Embed Size (px)
Citation preview

Dispersive liquid-liquid micro-extraction coupled with gas chromatography
for the detection of trihalomethanes in different water sources in the
Western Cape, South Africa
By
Marshalle Lane
Thesis submitted in part-fulfillment of the requirements for the degree of
Magister Technologiae: Chemistry
In the
Faculty of Applied Science
at the
Cape Peninsula University of Technology
Supervisor: Dr. S. Le Roux
Bellville 2018
CPUT Copyright Information: This thesis may not be published either in part (scholarly,
scientific or technical journals), or as a whole (as a monography), unless permission has
been given by the university
2

3
ABSTRACT
Trihalomethanes (THMs) are a group of four compounds that are formed, along
with other disinfected by-products. This happens when chloride or other
disinfectants are used to control microbial contamination in drinking water, which
then reacts with natural organic or inorganic substances in water.
Trihalomethanes are better known by their common names such as chloroform,
bromodichloromethane, chlorodibromomethane and bromoform. These four
compounds are known to be classified as cancer group B carcinogens (shown to
cause cancer in laboratory animals). Trihalomethane levels tend to increase with
pH, temperature, time and the level of “precursors” present. Precursors are
known to be organic substances which react with chloride to form THMs. One
significant way of reducing the amount of THMs in water is to eliminate or reduce
chlorination before filtrations and reduce precursors. There are guideline limits for
THMs in the SANS 241:2015 document, but they are not continuously monitored
and their levels in natural water are not known.
The aim of this study is to develop a rapid, fast and reliable liquid-liquid micro-
extraction technique, to determine the presence of THMs in natural water
sources. This study particularly focuses on different water sources e.g. river,
underground, borehole and chlorinated water. Chlorinated water is the water that
has been presumably treated for bacteria and fungus growth. The results that
were obtained for chlorinated water are as follow, 10.120 µg/L – 11.654 µg/L for
chloroform, 2.214 µg/L - 2.666 µg/L for bromodichloromethane, 0.819 µg/L –
0.895 µg/L chlorodibromomethane and 0.103 µg/L - 0.135 µg/L for bromoform
from validation data. All these THMs concentrations have been found to be below
the SANS 241:2015 limits. Natural water shows a very high affinity for chloroform.
This is what is expected under normal conditions as chloroform is the most
abundant THM of all THMs present in natural water. The liquid-liquid micro-
extraction technique that was optimized and used for the determination of THMs
in this study is a rapid, simple and inexpensive technique that provides low limits
of detection (LOD) e.g. 0.1999 µg/L chlorodibromomethane and 0.2056 µg/L
bromoform and wide dynamic range (LOQ) of 0.6664 µg/L
chlorodibromomethane and 0.6854 µg/L bromoform for the determination of
THMs.
4
ACKNOWLEDGEMENTS
I wish to thank: My External Supervisor, Dr Shirley Theodora Rose Le Roux for all her values suggestions and advice during the final stages of writing up the thesis. My Operational Manager, Hannes Esterhuizen for his excellent guidance, patience and willingness to always assist and share his vast amount of knowledge with me. My Assistant Laboratory Manager, Salwa Banien for her input as well as guidance and support. My Laboratory Supervisor, Sibusiso Tsewu for his significant input and vast amount of knowledge regarding method validation.
My Aunt, Charlotte De Villiers for her continued love and support.
My Manager Director Raymond Hartley, for giving me the opportunity and time to complete my studies and project at Microchem Laboratory Service.
5
LAYOUT OF THESIS
The aim of this study is to detect quantitatively THMs in natural drinking water, by
development of rapid liquid-liquid micro-extraction technique. The method will be
validated and applied to municipal and natural drinking water.
The thesis is subdivided into the following chapters:
Chapter 1, the introduction provides a background on THMs. It lists the overall
objectives, problem statements, sub-problems and hypothesis and clearly states
topics that were not covered by the study. The literature review provides a
summary of background studies performed on THMs, their origins, toxicity and
their routes into animal and human bodies. The second part of the literature
review covers the validation master plan, standard U.S EPA method 551.1 of
analysis for THMs and the modification of the method into UMass protocol
method.
Chapter 2, the research methodology chapter summaries the optimization of the
UMass protocol method for THMs. Validation criteria of analytical method and
information regarding sampling, transportation and sampling handling.
Chapter 3, summarizes the results which consists of limit of detection, limit of
quantification, instrument linearity, instrument precision, matrix effect based on
recovery, matrix effect based on interferences, precision based on reproducibility,
accuracy based on recovery, selectivity based on recovery, selectivity based on
interferences, inter-laboratory comparison, precision based on repeatability,
robustness, measure of uncertainty and proficiency testing. The following
sample matrices will be used to gather method validation data: river water,
borehole water, municipal water, sea water, chlorinated water, tap water,
underground water, tap water and medical water.
Chapter 4, overall discussion and conclusion, while also listing
recommendations for future research.
Chapter 5, the reference in accordance with Harvard method of referencing.
6
DEDICATION
This is optional, and may be omitted.
For (whomever)
7
Glossary of Terms
BDS - Blue Drop System
BDCM - Bromodichloromethane
CCT - City of Cape Town
CDBM - Chlorodibromomethane
CRM - Certified Reference Material
COT- Committee on Toxicity Chemicals in Food
DWA - Department of Water Affairs
DBP - Disinfection By-Products
DAI - Direct Aqueous Injection
DWDS - Drinking Water Distribution Stations
DWTP - Drinking Water Treatment Plants
EPA - Environmental Protection Agency
GC-ECD - Gas Chromatography Electron Captive Detector
GC-MS - Gas Chromatography Mass Spectroscopy
HSE - Health Service Executive
HT- Headspace Technique
HP - 5MS UI- HP Coloumn-5MS Ultra Inlet Column
IARC - International Agency for Research on Cancer
LLE - Liquid-Liquid Extraction
LIMS - Laboratory Information Management Systems
8
LOD - Limit of Detection
LOQ - Limit of Quantification
MoU - Measure of Uncertainty
MSDS - Material data Safety Sheet
MTBE - Methyl tert-butyl ether
Na2SO4 - Sodium Sulphate
NH4Cl - Ammonium Chloride
SANS 241- South African National Standards
SRI - Solidarity Research Institute
SHT - Static Headspace Technique
THMs - Trihalomethanes
TDS - Total Dissolve Solids
TOC - Total Organic Carbon
TTHMs - Total Trihalomethanes
VOC-Volatile Organic Carbons
WHO- World Health Organization
9
Table of Content
Declaration 2 Abstract 3 Acknowledgement 4 Layout of thesis 5 Dedication 6 Glossary 7 CHAPTER ONE: Introduction
1.1 Background 12
1.2.1 Problem Statement 13 1.2.2 Sub-Problem 14 1.2.3 Hypothesis 14 1.2.4 Assumptions 14 1.2.5 Delimitation 15 1.3 Literature Review 15 1.3.1 Introduction 15 1.3.2 Toxicity of Trihalomethanes 16 1.3.3 Validation Master Plan 20 1.3.4 Importance of South African National Standards 241 20 1.4 Analytical methods for Trihalomethanes 22 1.5 The Standard method of analysis for THMs was US EPA method 551.1 26 CHAPTER TWO: Methodology
2.1 Introduction 28 2.2 Optimization Parameters 29 2.3 Validation 33
10
2.4 Preparation of Standards and Samples 38 CHAPTER THREE: Method Validation Results
3.1 Introduction 41 3.2.1 Limit of Detection of Quantification 42 3.2.2 Instrument Linearity 43 3.2.3 Instrument Precision 46 3.2.4 Effect of Matrices on Recovery 47 3.2.5 Recovery and Matrix Effects based on Interferences 49 3.2.6 Precision based on Reproducibility 51 3.2.7 Accuracy based on Recovery 54 3.2.8 Selectivity based on Recovery 56 3.2.9 Selectivity based on Interferences 58 3.2.10 Inter Laboratory Comparison 60 3.2.11 Precision based on Repeatability 63 3.2.12 Robustness 65 3.2.13 Measure of Uncertainty 70
3.2.14 Fapas Proficiency Test 75 4. CHAPTER FOUR: Discussion and Conclusion 4.1 Discussion Introduction 78 4.2 Optimization 79 4.3 Validation of Trihalomethanes 81 4.4 Real Life Water 85 4.5 Municipal water 86 4.6 Fapas proficiency and inter laboratory comparison 88 4.7 Conclusion 98 4.8 Recommendations 90
11
5. Chapter FIVE: References
5.1 References 91 5.2 Appendix A 95 5.3 Appendix B 164 5.4 Appendix C 193
12
CHAPTER 1
INTRODUCTION
1.1 Background
The amount of water on earth is constant and cannot increase or decrease, but it
is unevenly distributed across the earth. The earth receives 985 millimeters
annual rainfall whereas South Africa receives annual rainfall of 492 millimeters of
rain (Rand Water & Water Wise, 2011). This amount contributes to almost half of
the amount of the earth’s average. Therefore, South Africa is considered a water
stressed country. The Department of Water and Environmental Affairs stated that
the demand for water will outstrip the supply in Gauteng by 2013 and the rest of
South Africa by 2025. Thus, demand for water in South Africa is very high, and
as the human population increases, with its increasing needs for survival, the
greater the demand for water in South Africa becomes.
A further problem that adds to the supply for water is water quality. Water quality
is defined as water that is safe, drinkable and appealing to all life on earth.
Drinking water treatment is a fundamental step and using disinfectant chemicals,
prevents the spreading of waterborne infectious diseases. The use of disinfectant
chemicals normally results in the formation of disinfectant byproducts (DBP)
(HSE & EPA, 2011). In South Africa the most common disinfectant method used
is chlorination. Chloride is regulated primarily to minimize the formation of DBPs,
the most common of which are trihalomethanes (THMs). Trihalomethanes are a
group of organic chemicals often present in drinking water and normally forms
when chlorine reacts with naturally occurring organic matter in raw water.
Chlorine is a powerful oxidizing agent and normally breaks down complex
organic compounds, which are considered the coloring agents of water. This then
leads to the formation of small reactive entities. These small entities then react
with chlorine to form what is better known as THMs. Trihalomethanes are a
group of four chemicals known as chloroform, bromoform,
dibromochloromethane and dichlorobromomethane. Trihalomethanes are formed
when there is either inadequate pre-treatment of the water or poor control over

13
the disinfection process itself according to the World Health Organization (WHO,
2004).
In South Africa, drinking water quality is governed by policies and regulations
based on international standards. Municipalities or district municipalities,
governed by Water Service Authorities are required to submit information
regarding water quality and management thereof regularly to the national Blue
Drop System (BDS). Since 2009, a trend has emerged in which under-resourced
municipalities are failing to improve their water quality management systems,
while urban municipalities have shown to consistently improve their water quality
systems. A major concern has emerged in which rural municipalities are
significantly failing to report the necessary required information and are regularly
not complying with the regulated requirement that speaks to the overall
management of the water quality monitoring rather than water quality itself
(Rivett et al., 2012). A recent study that was done in February 2016 (Solidarity
Research Institute, 2016) (SRI) showed that eighteen Free State municipalities
have failed to attain BDS status for which ageing infrastructure and lack of
expertise are to blame. The BDS usually gives an indication that water is safe to
drink. To obtain blue drop status a municipality must obtain a score of at least 95%
on adherence to BDS status. The only two municipalities that obtained BDS
status in the Free State is Mangaung & Metsimaholo. Chlorine is used as a
disinfectant agent by most municipal water supplying systems, as they are
extremely efficient and cost effective. Although the chlorination of drinking water
provides many advantages, THMs remain a human health concern. Water
supplied by municipalities that contains DBP’s may lead to potential human
health risks and many of the DBP’s have been classified as probable or possible
carcinogens (Jamaleddin et al., 2016). A study carried out to assess THM levels
in drinking water system from several areas in South Africa for the year 2013
reported variation of THM level with some reported to have relatively high levels
of THMs (Booi, 2013). No study has since been carried out in municipalities in
South Africa.
1.2.1 Problem Statement
Chlorination is the most common disinfected method used in South Africa, but
this method produced the toxic, carcinogens THMs which can seriously affect

14
human health. The detection and monitoring of THM levels in drinking water is of
vital importance. The aim of this study is to quantitatively determine THMs in
natural drinking water, by development of rapid a liquid-liquid micro-extraction
technique. The method will be validated and applied to municipal and natural
drinking water.
1.2.2 Sub-Problems
1. Optimizing a rapid and simple method for analysis of THMs in municipality and
natural water by using dispersive liquid-liquid micro-extraction (DLLME) coupled
with gas chromatography-electron capture detection (GC-ECD).
2. Comparing the newly developed method with other conventional methods in
terms of their sensitivity, simplicity and rapid determination of THMs.
3. Validation of the method will be done in compliance with SANS 241: 2015 and
SANAS TR 28-01 method validation guidelines. This method validation guideline
is only applicable to agriculture, mining, petroleum and food & beverage
industries.
4. Applying the developed technique for monitoring of THMs in municipal water for
three different municipalities and natural water systems
1.2.3 Hypothesis
Tap water supplied by municipalities to local communities is not polluted with
trihalomethanes. This statement is made on the basis that government has a
responsibility to ensure that the water is sterile and harmless for consumption.
1.2.4 Assumptions
1. That drinking water does not exceed the SANS 241-1:2015 limits set out by
SANS, if it does, South Africa has an action plan in place in the event of a
significant increase of THMs in drinking water.
2. All drinking water is safe (without pathogenic microorganisms and toxic
compounds), attractive (free from colour, taste and odour) to avoid accumulation
15
of solids, corrosion and after-growth of bacteria in the distribution and transport
pipeline.
3. That municipalities test their drinking water on a regular basis
1.2.5 Delimitations
1. All investigations regarding this study will be carried out on gas chromatography
electron capture detector. There will be no studies carried out on any alternative
instruments e.g. high performance liquid chromatography, ion-exchange
chromatography, thin-layer chromatography, gas chromatography-mass
spectroscopy or liquid chromatography-mass spectroscopy.
2. The study will be limited to liquid-liquid micro-extraction technique.
3. For this method validation, the following sample matrices will be used to gather
method validation data: river water, borehole water, municipal water, sea water,
chlorinated water, tap water, underground water, tap water and medical water.
1.3 Literature Review
1.3.1 Introduction
Water is life. For millions of years and generations still to come life on earth has
been dependent on water for survival. Today, water holds the key to our future
survival. When Neil Armstrong landed on the moon in 1969 he described Planet
Earth as “a shining blue pearl spinning in space”. This blue color that Neil
Armstrong was referring to is in fact the amount of water that is present on the
surface. A 70% of the earth surface is covered with water but of this,
approximately 97% is salt water, with the remaining 3% being fresh water. From
this 3% less than 1% is available for life on earth (Rand Water & Water Wise,
2011), while the rest is in the form of ice at the poles. For complete control of
microbial contamination in drinking water chlorine or other disinfectants are used.
When chlorine reacts with natural occurring organic or inorganic materials in
water, it results in the formation of disinfectant by-product. Trihalomethanes are
one of these disinfectant byproducts (WHO, 2004). The main aim of treating
drinking water is to produce water that is safe, these are water that contains no
16
pathogenic microorganisms and toxic compounds, attractive (free from colour,
taste and odor) and to avoid any accumulation of solids, corrosion and after-
growth of bacteria in the distribution and transportation through pipelines (Mamba
et al., 2008).
The water quality and management systems are monitored by different standards
across the world. In most parts of the world the monitoring is done by water
suppliers while the data is audited by public health authorities. However there are
international guidelines that all drinking water regulations need to adhere to. This
is to ensure that every country follows the exact same procedure regarding
protocol when it comes to treatment of drinking water. This body is known as the
World Health Organization (WHO). However, every country has its own public
health authority that needs to ensure that their country is following the WHO
protocol. The main reason why every country has its own public health
authorities is because the water quality differs from country to country.
1.3.2 Toxicity of Trihalomethanes
Trihalomethanes are rarely present in significant concentrations in raw water.
Chloroform is the THM that is highest in concentration. Information regarding
bromoform, chlorodibromomethane and bromodichloromethane are very limited.
In industry bromoform is produced in small quantities and is often used as a
chemical intermediate during chemical processing. Chlorodibromomethane and
bromodichloromethane are produced in even smaller quantities than bromoform
and are used for laboratory use only (EFS, 2006). These three THMs are largely
released into the environment through air during water chlorination. Chronic oral
exposure of humans (Christina et al., 2017) to chloroform at high doses results in
adverse effects on the central nervous, liver, kidneys and heart. Animal studies
(Jamaleddin et al., 2016) have shown a decrease in body weight in rats and mice
given chloroform at high oral doses, and an increased incidence of respiratory
disease at higher doses. At even higher oral doses, liver abnormalities and
decreased size of the reproductive organs were observed in rats (Jamaleddin et
al., 2016). Investigating studies (Jamaleddin et al., 2016) regarding the other
THMs has led to observation of chronic exposure and liver toxicity.
Bromodichloromethane also caused kidney toxicity. Evidence from an animal
17
study (Jamaleddin et al., 2016) now strongly indicated that exposure to
chloroform causes cancer in animals, after first producing toxic cells.
Studies were done by Jamaleddin et al., (2016) in human population using
chlorinated drinking water where chloroform is the most present THM. Small
increases in the incidence of rectal, colon and bladder cancer have been
consistently observed, with evidence strongest for bladder cancer. Chloroform
has been classified as Group B2 or “probable human carcinogen” by the U.S
Environmental Protective Agency (EPA), this is due to sufficient animal evidence
(Jamaleddin et al., 2016) and inadequate human evidence of carcinogenicity.
For cell toxicity to occur a certain threshold level of exposure needs to occur,
cancer can only form from chloroform if that threshold is exceeded. Based on the
result of animal studies, it has shown that bromodichloromethane increased
tumors of the large intestine, kidney and liver, and bromoform increased the
tumor of the large intestine. They are also classified as Group B2, wherease
chlorodibromomethane is classified as Group C “possible human carcinogen”.
Results have been inconclusive regarding exposure of THMs and adverse
developments or reproductive effects in humans. However, the results of a recent
study (Sharp et al., 2013) suggest an increased risk of early-term miscarriage
from high levels of THMs in tap water, particularly bromodichloromethane.
According to the Health Service Executive and Environmental Protective Agency,
chlorine’s primary function in drinking water is to act as disinfectant, however it
also provides a stable disinfectant residual to preserve the quality of the water
throughout the distribution network. Acute effects of THMs in drinking water are
rare.
The International Agency for Research on Cancer (IARC) reviewed studies and
updated its findings from 1991 to 1997 in 1997. It founded that chlorinated
drinking water was not classified as carcinogenic to humans (HSE & EPA, 2011).
In 2008 a study done by the Committee on Toxicity Chemicals in Food (COT)
(UK) found that there is association between cancer and THMs in drinking water
and others showed no association. The main responsibility of the COT is to
assess the quality and totality and draw a conclusion based on the evidence
present. They concluded:

18
“Problems remain in the interpretation of published studies. These include the
small relative risks recorded, the possibility of residual confounding, and the
problems with exposure assessment’. They conclude ‘the evidence for a causal
association between cancer and exposure to chlorination by-products is limited
and any such association is unlikely to be strong. Efforts to minimise chlorination
by-products in drinking water should continue but must be balanced against the
need for effective disinfection of drinking water”.
A study by (Booi, 2013) was conducted to determine THMs, in seven drinking
Water Treatment Plants, (DWTP) and one Drinking Water Distribution Station
(DWDS) in the Western Cape. The seven DWTP that were studied were Atlantis,
Blackheath, Brooklands, Faure, Steenbras, Wemmershoek and Voelvlei. The
one DWDS that was studied was Plattekloof. The study was performed using
liquid-liquid gas chromatography-electron capture detector.
The average total THMs (TTHMs) concentrations detected from the DWTPs and
DWDS was found to range from 32.82 μg/L for Brooklands to 26.52 μg/L for
Plattekloof, with the observed total concentrations being comparable. The
average chloroform concentration was found to be the highest for DWTP and
DWDS, it ranged from 22.29 μg/L for Voelvlei to 11.74 μg/L for Plattekloof.
Dichlorobromomethane had the lowest concentrations for all seven DWTP and
DWDS. Atlantis was the only one of the seven DWTP in which the average
TTHMs concentration was highest and found to be 83.48 μg/L. The chloroform
concentration of 46.06 μg/L for Atlantis was found to be significant higher than
any of the other chloroform concentrations for the DWTPs. Tap water samples
was collected from 14 Western Cape suburbs. The average TTHMs
concentration ranged from 5.30 μg/L for Mandalay to 13.12 μg/L for Brown Farm,
Phillipi. All the TTHMs concentrations for the 14 Western Cape suburbs were
lower than the TTHMs concentrations for the DWTPs. Overall the TTHMs and
individual THMs concentration from the 14 Western Cape suburbs and the seven
DWTP concentrations were well below the levels recommended by SANS
241:2011
A country-wide study conducted in South Africa over a period of two years on
THMs levels in drinking water, indicated that the average TTHMs levels in water
19
was found to be 45 µg/L, with 10 % of the samples exceeding guideline levels
(van Steenderen et al., 1991). The TTHMs study was based on a South African
survey. The average THMs levels of 45 µg/L was found to be well below the
guidelines limits of SANS 241 which specifies a maximum of 300 µg/L chloroform
or 100 µg/L bromoform THM's and the WHO guideline of 200 µg/L chloroform or
100 µg/L bromoform. The WHO guidelines were reviewed and increased from 30
µg/L to 200 µg/L as the toxicological data was considered to be inconclusive
(US-EPA, 2004; WHO, 2004).
In 2008 in Zimbabwe, a very interesting observation was made when a study was
carried out regarding THMs in drinking water (Guyo et al., 2008). Water samples
were collected from dams during June-September 2008, 3 water samples were
collected once a month from dams which supply water to the city of Gweru. The
THMs found were chloroform, chlorodibromomethane, dibromochloromethane
and bromoform chloroform, being predominantly present, with concentration
levels ranging from 3.70 µg/L to 45.89 µg/L. The concentration levels of THMs
increased with increasing distance from the chlorination point according to the
study. Total THMs concentration in raw water ranged from non-detectable levels
to 18.13 µg/L and in treated water from 6.83 µg/L to 145.50 µg/L. A slight
increase in concentration levels of THMs were present in warmer months with
the highest concentration level of 145.80 µg/L being recorded in September.
Generally, the concentration levels obtained were lower than the maximum
permissible limits set by the World Health Organization (WHO).
A study done by Rahanama et al., (2007) that was conducted in Tehran and Iran
founded that the total concentration of THMs in drinking water from the two areas
were 10.9 and 14.1 µg/L. The conditions were optimized and the enrichment
factor ranges from 116 to 335. The limit of detection ranged from 0.0005 to 0.040
µg/L, while the linear range was 0.01-50 µg/L. Relative standard deviations (RSD)
for 2.00 µg/L with internal standard were in the range 1,3-5,9 % (n=5), without
internal standard they were in the range 3,7-8,6 % (n=5).
A similar study was conducted in Spain by Rodrıguez-Cabo et al., (2012) of
THMs in tap and swimming pool water and reported the following results i.e.
limits of quantification (LOQs) between 0.05 and 1.3 ng/ mL-1 and an excellent
20
linearity was noticed up to 100 ng mL-1. Relative recoveries, measured for spiked
aliquots of tap and swimming pool water samples, remained between 79% and
113%, with associated standard deviations below 12%. The applicability of the
developed methodology was demonstrated with chlorinated water samples
analysis. As regards tap water samples, the sum of THMs concentrations
remained under the limit fixed by the European Union 100 ng mL-1, however,
some samples contained levels close to 80 ng mL-1, the maximum allowable
concentration established by the United States Environmental Protection Agency
(EPA).
1.3.3 Validation Master Plan
As part of GMPs (Good Manufacturer Practices) for pharma, biotech, beverage,
and medical device companies, a guide validation master plan is documented
that outlines and defines which processes and equipment needs to be validated
(FDA, 2013) and the priority and order in which it will be done. The validation
master plan will overcome challenges faced in heavily regulated sectors, since
FDA (Food and Drug Administration) may request documentation summarizing
an organization’s process. Validation master plan is part of industry GMPs and
not a formal requirement, but can help reduce the chances of receiving an FDA
warning letter. In South Africa, the national body that oversees the drinking water
regulations is South African National Standards (SANS) 241. However it is of
critical importance to look at the function of SANS 241 and its validation master
plan.
1.3.4 Importance of South African National Standards 241
The South Africa Bureau of Standards (SABS) is a South African regulatory body
established in terms of the Standard Act, 1945 (Act No. 24 of 1945) (DWA, 2013).
It continues to operate in terms of the newest edition of the Standard Act, 2008
(Act No. 29 of 2008) as the national institute that promotes and maintains
standardization and quality in connection with commodities and rendering of
services (DWA, 2013). Safe drinking water is one of the basic requirements for
human rights and vital to human health (WHO, 2014). The South African
National Standards (SANS) 241 drinking water specification states the minimum
21
requirements (SANS, 241:2015) for potable drinking water to be considered safe
for human consumption. The requirements include microbiological, chemical and
physical properties of the water. Water that complies with SANS 241 regulations
does not pose a risk to health over a lifetime of consumption (DWA, 2013). SANS
241 shows various properties of water that need to be checked to determine
whether drinking water is safe for human consumption. SANS 241 categorizes
the properties of drinking water into 4 main risk categories and states the
minimum values that drinking water must conform to before considered safe to
drink.
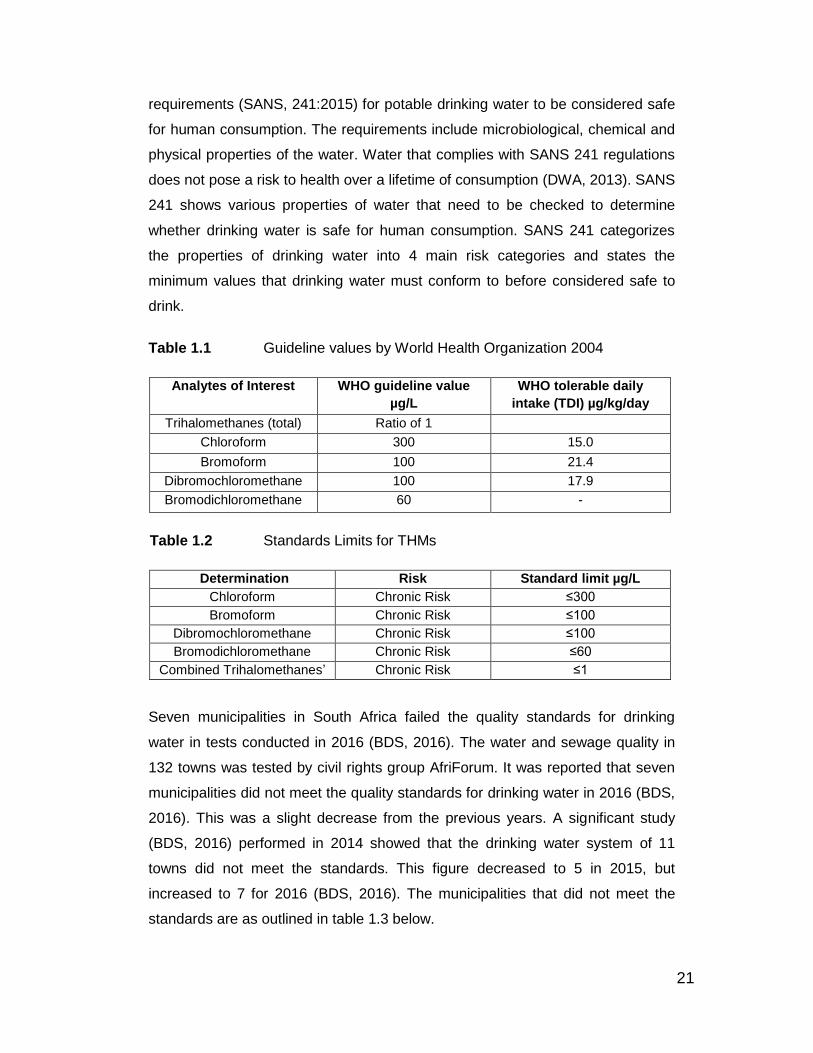
Table 1.1 Guideline values by World Health Organization 2004
Analytes of Interest WHO guideline value
µg/L
WHO tolerable daily
intake (TDI) µg/kg/day
Trihalomethanes (total) Ratio of 1
Chloroform 300 15.0
Bromoform 100 21.4
Dibromochloromethane 100 17.9
Bromodichloromethane 60 -
Table 1.2 Standards Limits for THMs
Determination Risk Standard limit µg/L
Chloroform Chronic Risk ≤300
Bromoform Chronic Risk ≤100
Dibromochloromethane Chronic Risk ≤100
Bromodichloromethane Chronic Risk ≤60
Combined Trihalomethanes’ Chronic Risk ≤1
Seven municipalities in South Africa failed the quality standards for drinking
water in tests conducted in 2016 (BDS, 2016). The water and sewage quality in
132 towns was tested by civil rights group AfriForum. It was reported that seven
municipalities did not meet the quality standards for drinking water in 2016 (BDS,
2016). This was a slight decrease from the previous years. A significant study
(BDS, 2016) performed in 2014 showed that the drinking water system of 11
towns did not meet the standards. This figure decreased to 5 in 2015, but
increased to 7 for 2016 (BDS, 2016). The municipalities that did not meet the
standards are as outlined in table 1.3 below.
22
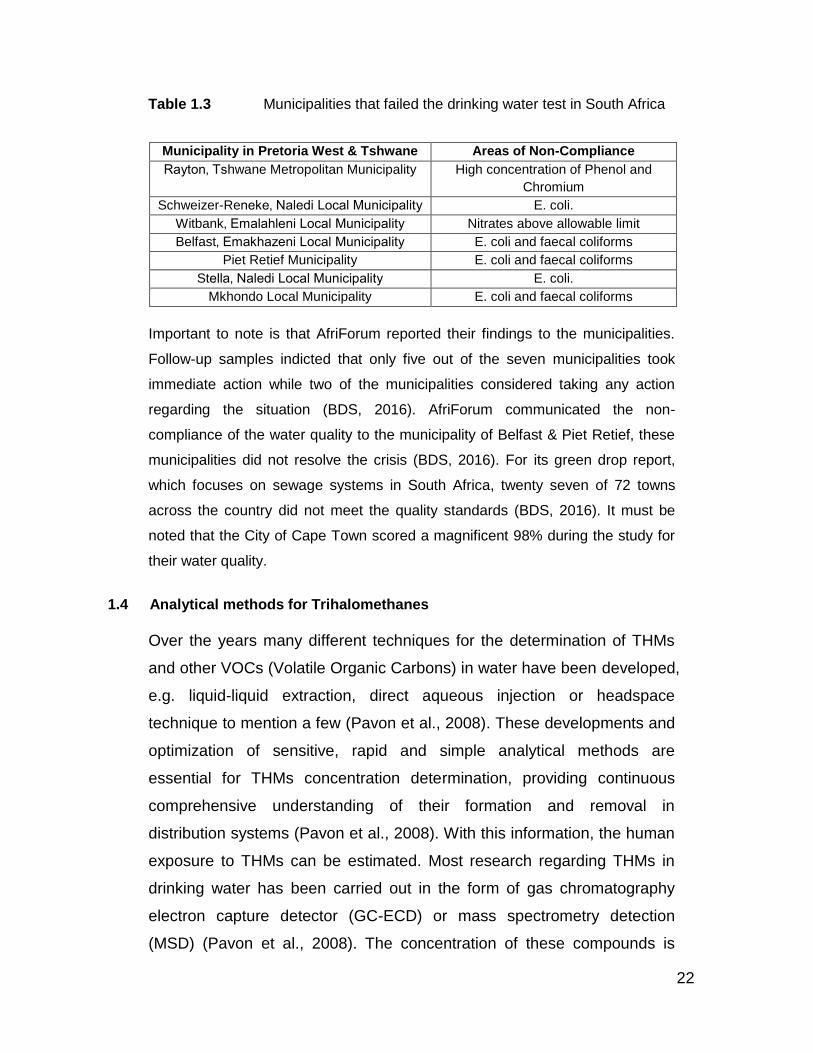
Table 1.3 Municipalities that failed the drinking water test in South Africa
Municipality in Pretoria West & Tshwane Areas of Non-Compliance
Rayton‚ Tshwane Metropolitan Municipality High concentration of Phenol and
Chromium
Schweizer-Reneke‚ Naledi Local Municipality E. coli.
Witbank‚ Emalahleni Local Municipality Nitrates above allowable limit
Belfast‚ Emakhazeni Local Municipality E. coli and faecal coliforms
Piet Retief Municipality E. coli and faecal coliforms
Stella‚ Naledi Local Municipality E. coli.
Mkhondo Local Municipality E. coli and faecal coliforms
Important to note is that AfriForum reported their findings to the municipalities.
Follow-up samples indicted that only five out of the seven municipalities took
immediate action while two of the municipalities considered taking any action
regarding the situation (BDS, 2016). AfriForum communicated the non-
compliance of the water quality to the municipality of Belfast & Piet Retief, these
municipalities did not resolve the crisis (BDS, 2016). For its green drop report,
which focuses on sewage systems in South Africa, twenty seven of 72 towns
across the country did not meet the quality standards (BDS, 2016). It must be
noted that the City of Cape Town scored a magnificent 98% during the study for
their water quality.
1.4 Analytical methods for Trihalomethanes
Over the years many different techniques for the determination of THMs
and other VOCs (Volatile Organic Carbons) in water have been developed,
e.g. liquid-liquid extraction, direct aqueous injection or headspace
technique to mention a few (Pavon et al., 2008). These developments and
optimization of sensitive, rapid and simple analytical methods are
essential for THMs concentration determination, providing continuous
comprehensive understanding of their formation and removal in
distribution systems (Pavon et al., 2008). With this information, the human
exposure to THMs can be estimated. Most research regarding THMs in
drinking water has been carried out in the form of gas chromatography
electron capture detector (GC-ECD) or mass spectrometry detection
(MSD) (Pavon et al., 2008). The concentration of these compounds is

23
generally in the range of ng/L to µg/L, such that it is normal to consider a
pre-concentration step of the analytes to achieve a level that can be
measured by the chosen analytical method. Generally there are four major
techniques for the determination of THMs: direct aqueous injection (DAI),
headspace technique, membrane - based sampling technique, liquid-liquid
extraction (LLE). These methods differ significantly one from each other,
whether it is sample preparation, matrix match or instrumentation.
Therefore it is important that the best method must be chosen for
instrumentation availability, accredited quality systems and company
protocol quality controls (Pavon et al., 2008).
1.4.1 Direct Aqueous Injection (DAI)
Direct Aqueous Injection (DAI) of water samples into a GC system is considered
the fastest and simplest “first step” in the analysis of aqueous samples by means
of gas chromatography injection. This technique requires no isolation or pre-
concentration of the sample to be performed. This is done to such an extent that
the loss of volatile analytes and the possibility of sample pollution during
manipulation are minimized. However, it is considered as a significant alternative
because it avoids the use of solvents which are quite expensive and toxic (Pavon
et al., 2008). The introduction of water as a solvent into the GC system is not
considered as a desired step, because it commonly degrades the coatings of the
analytical column. The analytical column is covered with a thick film of polar
liquid phase that allows the water to elute before the analytes of interest. An on
column injector is used, so that the sample is introduced into the
chromatographic system with no prior vaporization. The disadvantage that this
technique provides is the deterioration of the initial segment of the column due to
the presence of non-volatile organic compounds or inorganic salts in aqueous
samples. Another drawback is that the sensitivity of the technique is limited to the
volume of the sample that can be introduced onto the analytical column. Over the
years, this technique has become quite common for the analysis of volatile
halocarbons.
24
1.4.2 Headspace Technique (HT)
Headspace techniques (HT) have been widely used over the last decade for the
determination of THMs and other volatiles in water samples. However it is
important to note that this technique itself is split into two techniques known as
static headspace and headspace-solid dynamic headspace. These two
techniques will be individually assessed to determine how they can be utilized in
the best way possible for our needs.
1.4.3 Static Headspace Technique (SHT)
The static headspace technique (SHT) is the simplest and fastest headspace
technique and permits a high degree of automation. In the static headspace
mode, an aliquot of the gas phase from the vial, in equilibrium with the sample, is
introduced into the carrier gas stream, which then carries it to the column. The
main disadvantage with this technique is its low sensitivity. In most cases the
concentration of the analyte in the headspace is lower than the limit of detection
of the technique itself (Pavon et al., 2008). The sensitivity can be increased by
increasing the sample volume onto the analytical column. However the drawback
of this is band broading effect and a loss of resolution. Therefore, it is worth
noting that the resulting sensitivity depends, apart from on detector sensitivity, on
the capacity of the column for a gas sample. The sensitivity levels obtained with
this pre-concentrated technique tend to be lower than those obtained with two-
step headspace techniques (Dynamic Headspace), which include a prior analyte
pre-concentration step.
1.4.4 Dynamic Headspace (DH)
The techniques discussed so far have a similar disadvantage in common, which
is known as the sensitivity to the technique. New techniques were developed to
address this situation. This technique is known as dynamic headspace purge and
trap-gas chromatography, developed by Swinnerton and Linnebom in 1962. This
technique has become very popular, valuable and a widely acceptable method
for the determination of VOCs in water (Pavon et al., 2008). In the extraction gas,
the purge volatiles are diluted before being focused in the trap. The sample is
then introduced into the analytical column. This can normally be performed in a
25
cold trap. This technique is exceptional with regard to sensitivity. However, the
one major disadvantage with regard to methodology is the excessive water vapor
that is purged with the volatiles by a stream of inert gas (Pavon et al., 2008). This
would give rise to significant peak distortion especially in the early part of the
chromatogram. It is worth nothing that all these headspace techniques require
the use of a gas chromatography head space instrument. It should be noted that
for the purpose of this project no headspace techniques will be used, as there is
no gas chromatography headspace instruments available at site.
1.4.5 Membrane based sampling technique
The membrane based techniques are techniques that have been develop in the
laboratory by analyst. Several membrane based techniques have been
developed for the analysis of VOCs in water. The advantage that the membrane
based method offers is that it allows the THMs concentration to be monitored on
line (Pavon et al., 2008). Additionally, in these systems no solvents are used
because introduction of the analysis into the system is done directly through the
membrane by means of a process called pre-vaporation. Due to limited available
research, this technique will not be suitable for the testing purposes.
1.4.6 Liquid-Liquid Extraction (LLE)
Liquid-Liquid Extraction (LLE) is the most commonly used sample preparation
techniques in water analysis. In contrast with classical DAI techniques, which use
large amounts of solvent in order to deplete the sample out of the analytes, the
process is normally completed with a much lower solvent volume. The sample
volume varies between 5 and 100 mL. A study (Nikolaou et al., 2008) performed
in which pre-concentration techniques was used for the determination of THMs in
water. The study was a modification of the EPA method 551.1, which includes
liquid-liquid extraction with methyl tertiary butyl ether (MTBE), after the addition
of anhydrous sulphate. The addition of the sodium sulphate was to increase the
ionic strength of the solution, enhancing the extraction of the compounds by the
salting-out effect. The studies found that the LLE-GC-ECD method was the most
sensitive one for the determination of THMs in water samples. A lot of alternative
LLE methods have been recently develop over the years but the LLE-GC-ECD
method is still considered the best method for the determination of THMs.
26
Advantages of this method include low cost. The most popular of this alternative
method up until today, is still the analysis of trihalomethanes and relative
pentane- extractable organic halides.
For this study, due to instrument availability a decision had to be made between
DAI and LLE. It was decided that the LLE is a safer option and meets instrument
availability in the laboratory.
1.5 The Standard method of analysis for THMs was US EPA method 551.1
The US EPA method was developed in 1990. Due to the significant development
in technology over the past decade a lot of alterations have been made to the
method, to keep up to date with more advanced state of the art instrumentation
equipment e.g. better column conditions, more sensitive detectors and different
carrier gasses. Reckhow et al., (2012) optimized the US EPA method in 2012 at
University of Massachusetts Environmental Engineering Research Laboratory.
This method is currently the latest method that has been optimized for THMs.
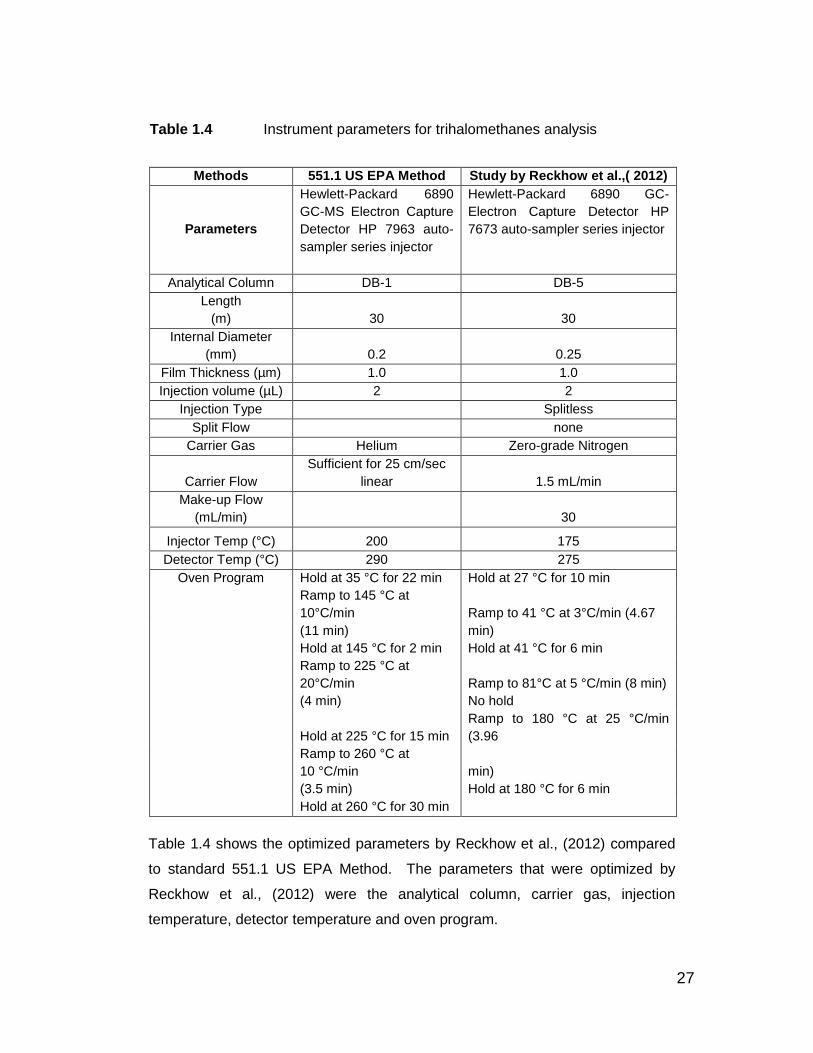
Table 1.4 shows the changes that have been implemented to suite a more state
of the art instrumentation and more suitable chemicals for extraction processes.
27
Table 1.4 Instrument parameters for trihalomethanes analysis
Methods 551.1 US EPA Method Study by Reckhow et al.,( 2012)
Parameters
Hewlett-Packard 6890
GC-MS Electron Capture
Detector HP 7963 auto-
sampler series injector
Hewlett-Packard 6890 GC-
Electron Capture Detector HP
7673 auto-sampler series injector
Analytical Column DB-1 DB-5
Length
(m) 30 30
Internal Diameter
(mm) 0.2 0.25
Film Thickness (µm) 1.0 1.0
Injection volume (µL) 2 2
Injection Type Splitless
Split Flow none
Carrier Gas Helium Zero-grade Nitrogen
Carrier Flow
Sufficient for 25 cm/sec
linear 1.5 mL/min
Make-up Flow
(mL/min) 30
Injector Temp (°C) 200 175
Detector Temp (°C) 290 275
Oven Program Hold at 35 °C for 22 min Hold at 27 °C for 10 min
Ramp to 145 °C at
10°C/min Ramp to 41 °C at 3°C/min (4.67
(11 min) min)
Hold at 145 °C for 2 min Hold at 41 °C for 6 min
Ramp to 225 °C at
20°C/min Ramp to 81°C at 5 °C/min (8 min)
(4 min) No hold
Hold at 225 °C for 15 min
Ramp to 180 °C at 25 °C/min
(3.96
Ramp to 260 °C at
10 °C/min min)
(3.5 min) Hold at 180 °C for 6 min
Hold at 260 °C for 30 min
Table 1.4 shows the optimized parameters by Reckhow et al., (2012) compared
to standard 551.1 US EPA Method. The parameters that were optimized by
Reckhow et al., (2012) were the analytical column, carrier gas, injection
temperature, detector temperature and oven program.
28
CHAPTER 2
METHODOLOGY
2.1 Introduction
For the present study, the method of Reckhow et al., (2012) will be optimized and
validated in the study. The method was developed on a 6890 N gas
chromatography electron capture detector instrument HP 7683 auto-sampler
series injector. Due to significant changes regarding instrumentation, some of the
parameters were modified to suite instrument needs and availabilities. The
method developed by Reckhow et al., (2012) was developed on a Hewlett
Packard 6890 GC-ECD. The method for the present study was developed on a
6890 N GC-ECD. The instruments make use of different PTV inlets, septums and
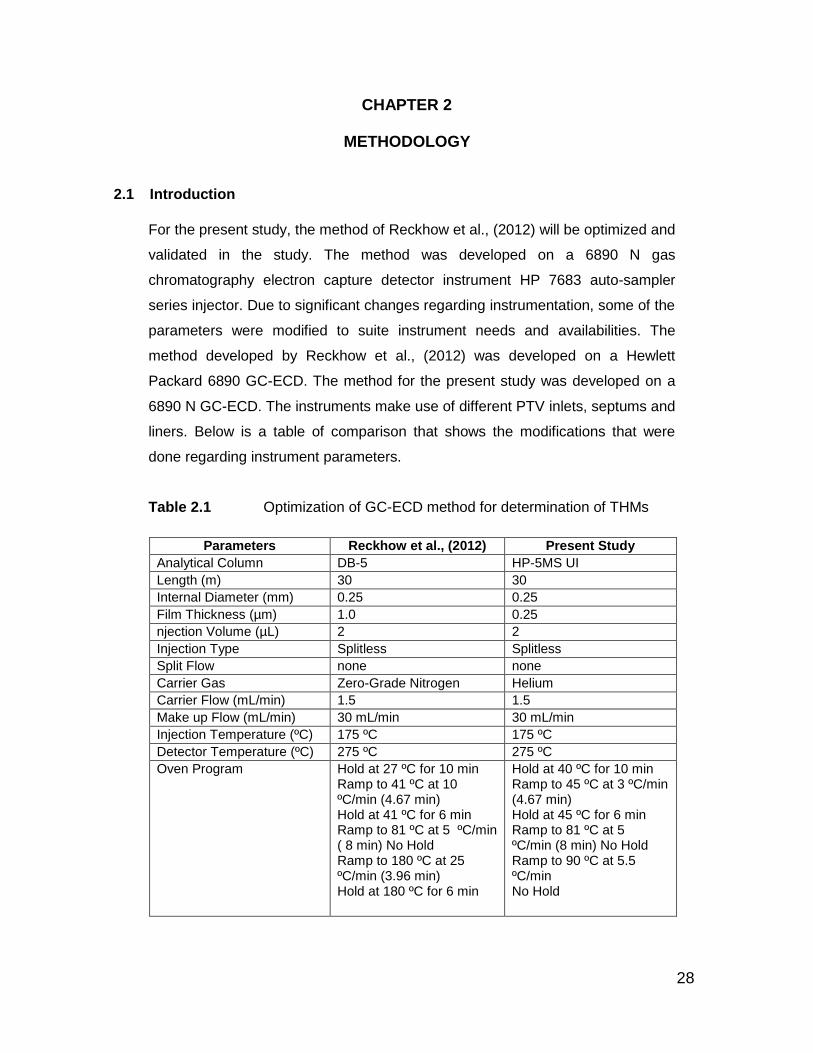
liners. Below is a table of comparison that shows the modifications that were
done regarding instrument parameters.
Table 2.1 Optimization of GC-ECD method for determination of THMs
Parameters Reckhow et al., (2012) Present Study
Analytical Column DB-5 HP-5MS UI
Length (m) 30 30
Internal Diameter (mm) 0.25 0.25
Film Thickness (µm) 1.0 0.25
njection Volume (µL) 2 2
Injection Type Splitless Splitless
Split Flow none none
Carrier Gas Zero-Grade Nitrogen Helium
Carrier Flow (mL/min) 1.5 1.5
Make up Flow (mL/min) 30 mL/min 30 mL/min
Injection Temperature (ºC) 175 ºC 175 ºC
Detector Temperature (ºC) 275 ºC 275 ºC
Oven Program Hold at 27 ºC for 10 min Ramp to 41 ºC at 10 ºC/min (4.67 min) Hold at 41 ºC for 6 min Ramp to 81 ºC at 5 ºC/min ( 8 min) No Hold Ramp to 180 ºC at 25 ºC/min (3.96 min) Hold at 180 ºC for 6 min
Hold at 40 ºC for 10 min Ramp to 45 ºC at 3 ºC/min (4.67 min) Hold at 45 ºC for 6 min Ramp to 81 ºC at 5 ºC/min (8 min) No Hold Ramp to 90 ºC at 5.5 ºC/min No Hold
29
Table 2.1 shows the optimized parameters of the present study compared to
Reckhow et al., (2012). Some of the parameters that were optimized were the
analytical column, carrier gas, film thickness and oven program.
2.2.1 Optimization Parameters
The parameters that were optimized for the study were the carrier gas, analytical
column, film thickness and oven program. All these parameters were optimized
to make the method more efficient towards, instrument suitability and capability.
2.2.2 Carrier Gas
Most laboratories instruments have moved over from nitrogen to helium as a
carrier gas, as it offers significant improvements compared to nitrogen. Helium
provides high column efficiency at moderate linear velocity flow rate, shorter
retention time and less carrier gas being consumed during analysis. However, it
does have the disadvantage of limited number of peaks, as peaks start to co-
eluent. This can be minimized by using a longer column.
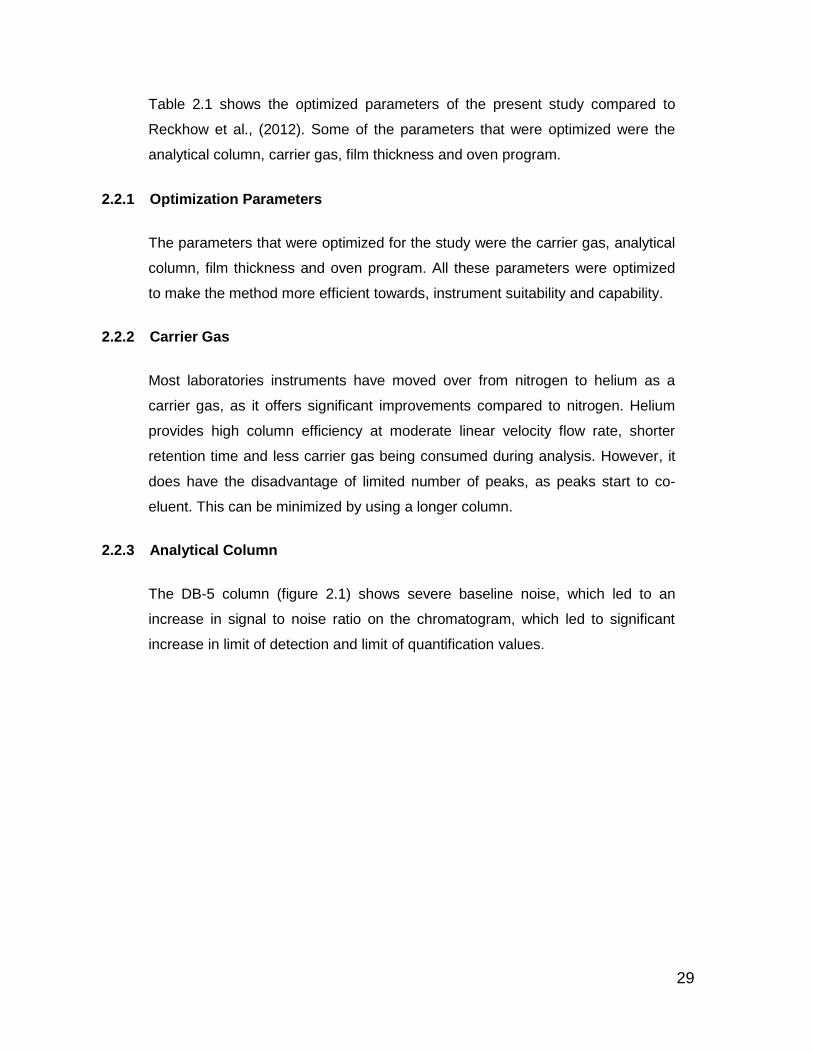
2.2.3 Analytical Column
The DB-5 column (figure 2.1) shows severe baseline noise, which led to an
increase in signal to noise ratio on the chromatogram, which led to significant
increase in limit of detection and limit of quantification values.
30
Figure 2.1 Chromatogram of baseline noise from using DB-5 coloumn which was
inserted into GC-ECD HP 7683 auto-sampler series injector.
The chromatogram in figure 2.1 shows severe baseline noise using the DB-5
column that was experienced from 28-36 min during the chromatographic run.
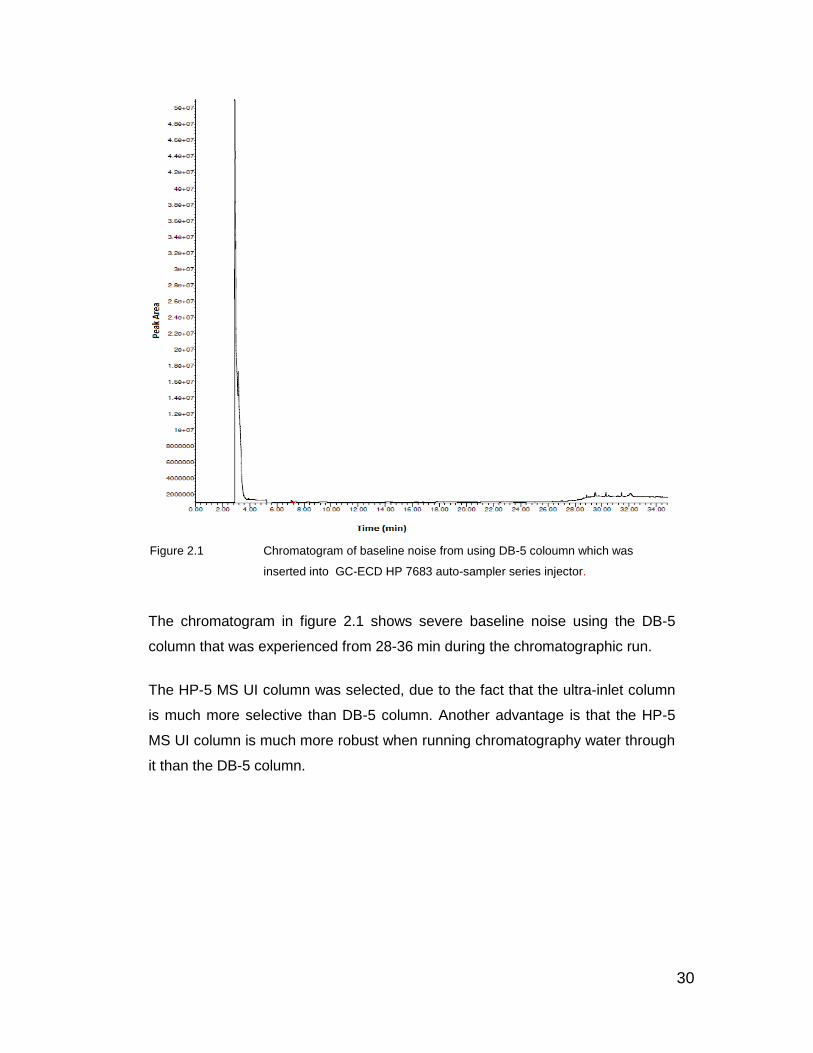
The HP-5 MS UI column was selected, due to the fact that the ultra-inlet column
is much more selective than DB-5 column. Another advantage is that the HP-5
MS UI column is much more robust when running chromatography water through
it than the DB-5 column.
31
Figure 2.2 Chromatography of baseline noise in GC-ECD HP 7683 auto sampler
injection series injection.
Figure 2.2 is a much improved chromatograph baseline noise making use of HP-
5 MS UI, it shows no baseline noise, which led to much better chromatogram.
2.2.4 Oven Program
The method developed by Reckhow et al., (2012), was for determination of
trihalomethanes and related pentane-extractable organic halides. In the present
study, analytes of interest were limited to THMs only, not the organic halides.
Trihalomethanes elute in the order of chloroform, bromodichloromethane,
chlorodibromomethane and bromoform. All peaks elute within 26.50 min. This
instrument run time was reduced from 37.50 min to 26.50 min. This reduced
retention time of analysis uses less gas. This decision was made because all
THMs of interest has already eluted after 12.00 min. An additional 14.50 min was
added to the time to discard all purities that remained trapped behind in the
analytical column after each analytical run. The starting temperature was
increased from 27 ºC to 40 ºC. In summer seasons, it becomes difficult to cool
32
the oven temperature to 27 ºC compared to winter seasons. These changes are
cost effective and reduce amount of consumables used.
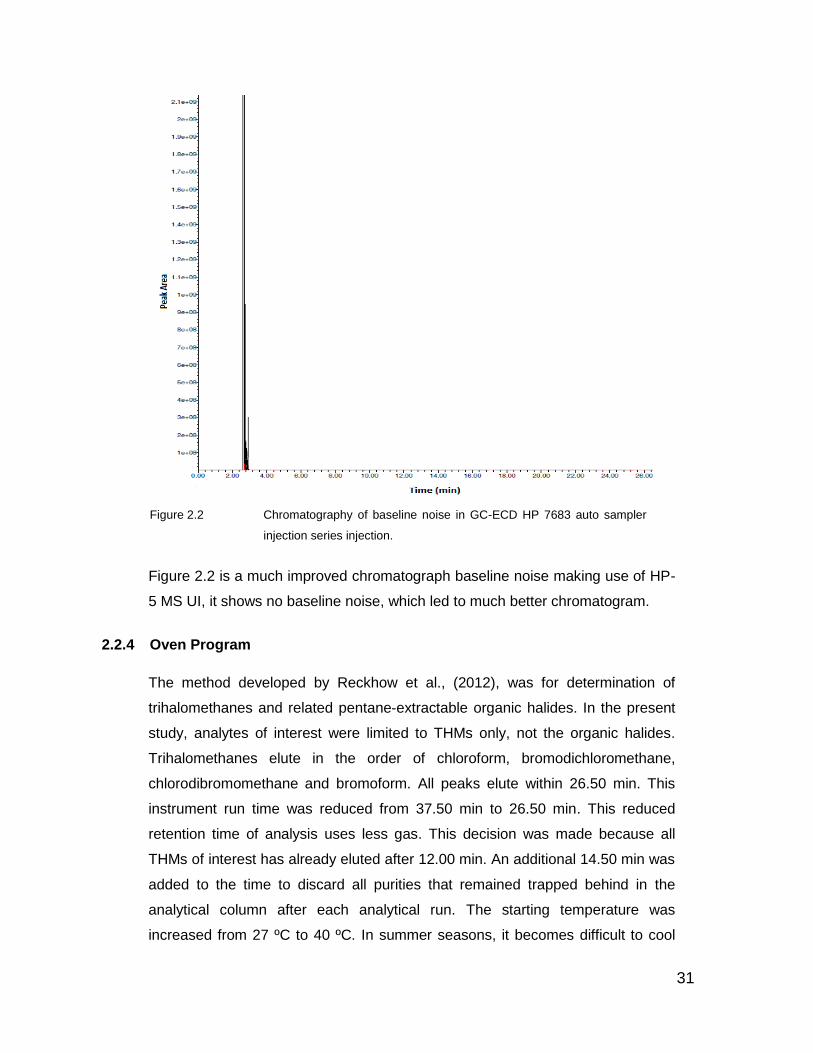
Figure 2.3 Chromatogram of 50 µg/L trihalomethanes calibration standard with
eluent retention times. Chloroform (2.703 min), bromodichloromethane
(3.875 min), chlorodibromomethane (6.452 min), 1,2 - dibromopropane
(9.903 min) and bromoform (11.852 min).
Figure 2.3 shows all four trihalomethanes and internal standard peaks identified
within 26.50 min.
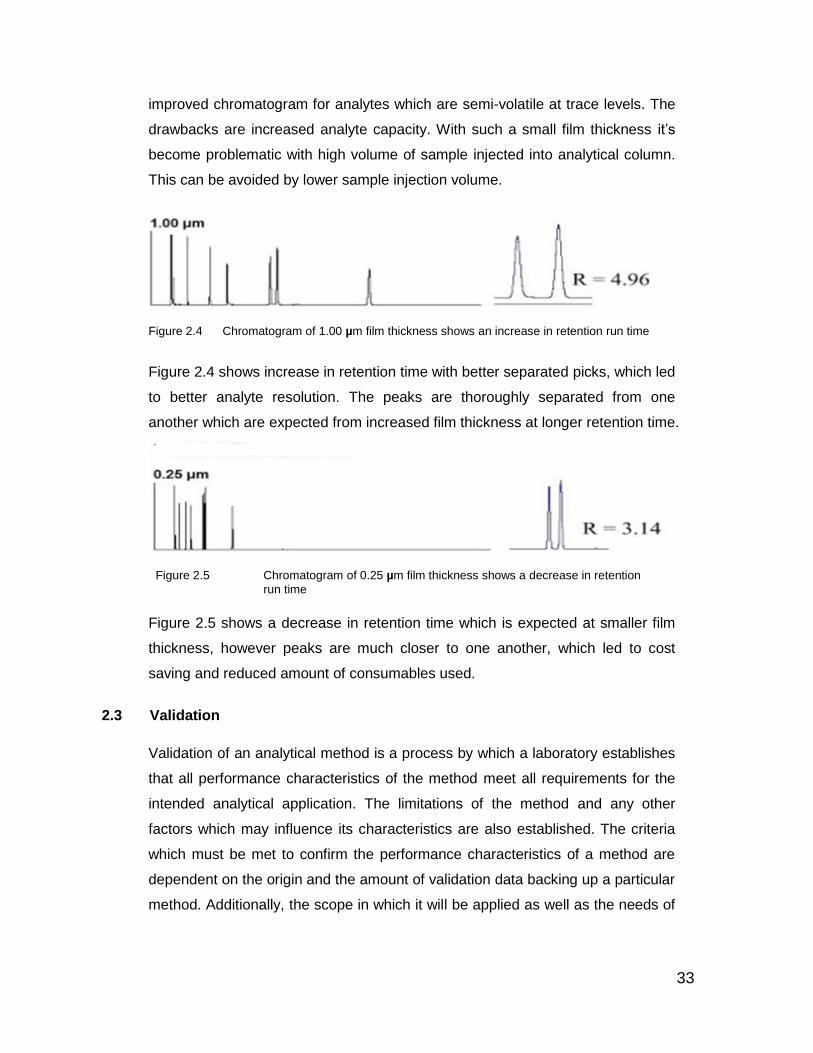
2.2.5 Film Thickness
The benefits of decreasing film thickness are sharper peaks (which may increase
resolution) and reduced column bleed. Analytical columns with smaller film
thickness have higher maximum operating column temperature. Decreasing film
thickness also allows analytes to elute with shorter retention time and at lower
temperatures, depending on the application. A decrease in film thickness led to
33
improved chromatogram for analytes which are semi-volatile at trace levels. The
drawbacks are increased analyte capacity. With such a small film thickness it’s
become problematic with high volume of sample injected into analytical column.
This can be avoided by lower sample injection volume.
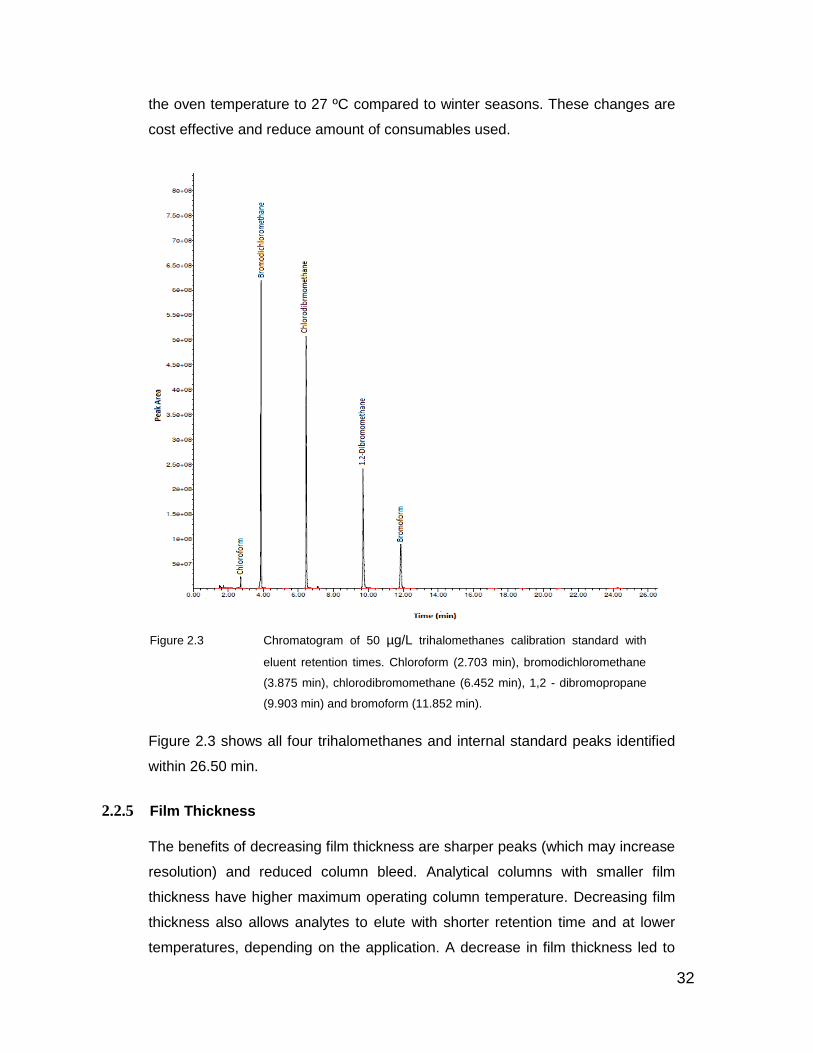
Figure 2.4 Chromatogram of 1.00 µm film thickness shows an increase in retention run time
Figure 2.4 shows increase in retention time with better separated picks, which led
to better analyte resolution. The peaks are thoroughly separated from one
another which are expected from increased film thickness at longer retention time.
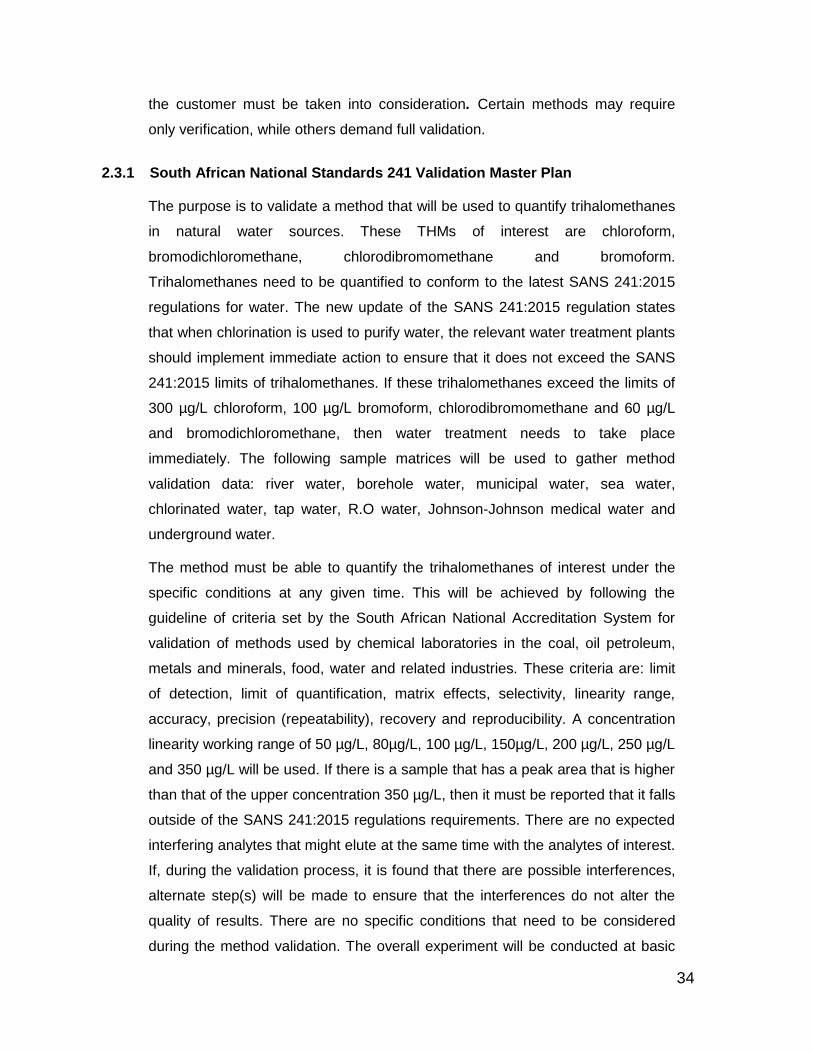
Figure 2.5 Chromatogram of 0.25 µm film thickness shows a decrease in retention
run time
Figure 2.5 shows a decrease in retention time which is expected at smaller film
thickness, however peaks are much closer to one another, which led to cost
saving and reduced amount of consumables used.
2.3 Validation
Validation of an analytical method is a process by which a laboratory establishes
that all performance characteristics of the method meet all requirements for the
intended analytical application. The limitations of the method and any other
factors which may influence its characteristics are also established. The criteria
which must be met to confirm the performance characteristics of a method are
dependent on the origin and the amount of validation data backing up a particular
method. Additionally, the scope in which it will be applied as well as the needs of
34
the customer must be taken into consideration. Certain methods may require
only verification, while others demand full validation.
2.3.1 South African National Standards 241 Validation Master Plan
The purpose is to validate a method that will be used to quantify trihalomethanes
in natural water sources. These THMs of interest are chloroform,
bromodichloromethane, chlorodibromomethane and bromoform.
Trihalomethanes need to be quantified to conform to the latest SANS 241:2015
regulations for water. The new update of the SANS 241:2015 regulation states
that when chlorination is used to purify water, the relevant water treatment plants
should implement immediate action to ensure that it does not exceed the SANS
241:2015 limits of trihalomethanes. If these trihalomethanes exceed the limits of
300 µg/L chloroform, 100 µg/L bromoform, chlorodibromomethane and 60 µg/L
and bromodichloromethane, then water treatment needs to take place
immediately. The following sample matrices will be used to gather method
validation data: river water, borehole water, municipal water, sea water,
chlorinated water, tap water, R.O water, Johnson-Johnson medical water and
underground water.
The method must be able to quantify the trihalomethanes of interest under the
specific conditions at any given time. This will be achieved by following the
guideline of criteria set by the South African National Accreditation System for
validation of methods used by chemical laboratories in the coal, oil petroleum,
metals and minerals, food, water and related industries. These criteria are: limit
of detection, limit of quantification, matrix effects, selectivity, linearity range,
accuracy, precision (repeatability), recovery and reproducibility. A concentration
linearity working range of 50 µg/L, 80µg/L, 100 µg/L, 150µg/L, 200 µg/L, 250 µg/L
and 350 µg/L will be used. If there is a sample that has a peak area that is higher
than that of the upper concentration 350 µg/L, then it must be reported that it falls
outside of the SANS 241:2015 regulations requirements. There are no expected
interfering analytes that might elute at the same time with the analytes of interest.
If, during the validation process, it is found that there are possible interferences,
alternate step(s) will be made to ensure that the interferences do not alter the
quality of results. There are no specific conditions that need to be considered
during the method validation. The overall experiment will be conducted at basic
35
laboratory conditions (ambient temperatures and a well-ventilated environment),
and only the specific method conditions should be considered, from sample
preservation, sample extraction, to instrument parameters. All research work was
conducted on 6890 N gas chromatography and electron capture detector HP
7683 auto-sampler series injector.
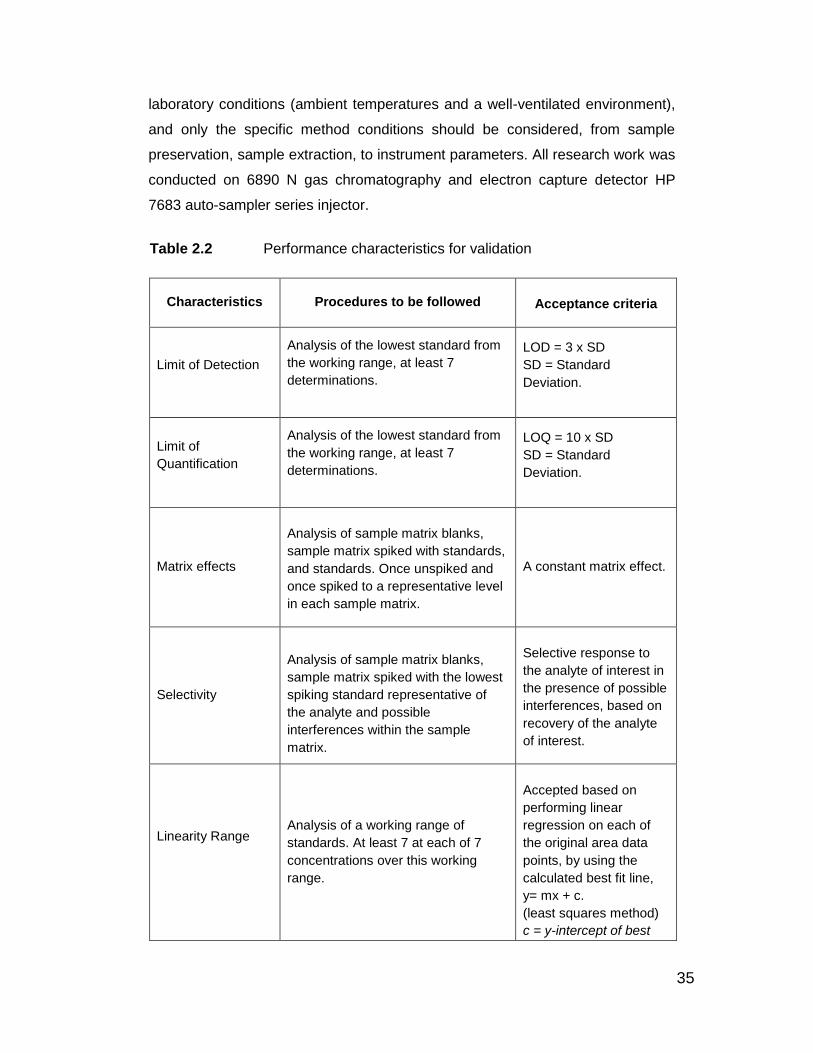
Table 2.2 Performance characteristics for validation
Characteristics Procedures to be followed
Acceptance criteria
Limit of Detection
Analysis of the lowest standard from
the working range, at least 7
determinations.
LOD = 3 x SD
SD = Standard
Deviation.
Limit of
Quantification
Analysis of the lowest standard from
the working range, at least 7
determinations.
LOQ = 10 x SD
SD = Standard
Deviation.
Matrix effects
Analysis of sample matrix blanks,
sample matrix spiked with standards,
and standards. Once unspiked and
once spiked to a representative level
in each sample matrix.
A constant matrix effect.
Selectivity
Analysis of sample matrix blanks,
sample matrix spiked with the lowest
spiking standard representative of
the analyte and possible
interferences within the sample
matrix.
Selective response to
the analyte of interest in
the presence of possible
interferences, based on
recovery of the analyte
of interest.
Linearity Range
Analysis of a working range of
standards. At least 7 at each of 7
concentrations over this working
range.
Accepted based on
performing linear
regression on each of
the original area data
points, by using the
calculated best fit line,
y= mx + c.
(least squares method)
c = y-intercept of best
36
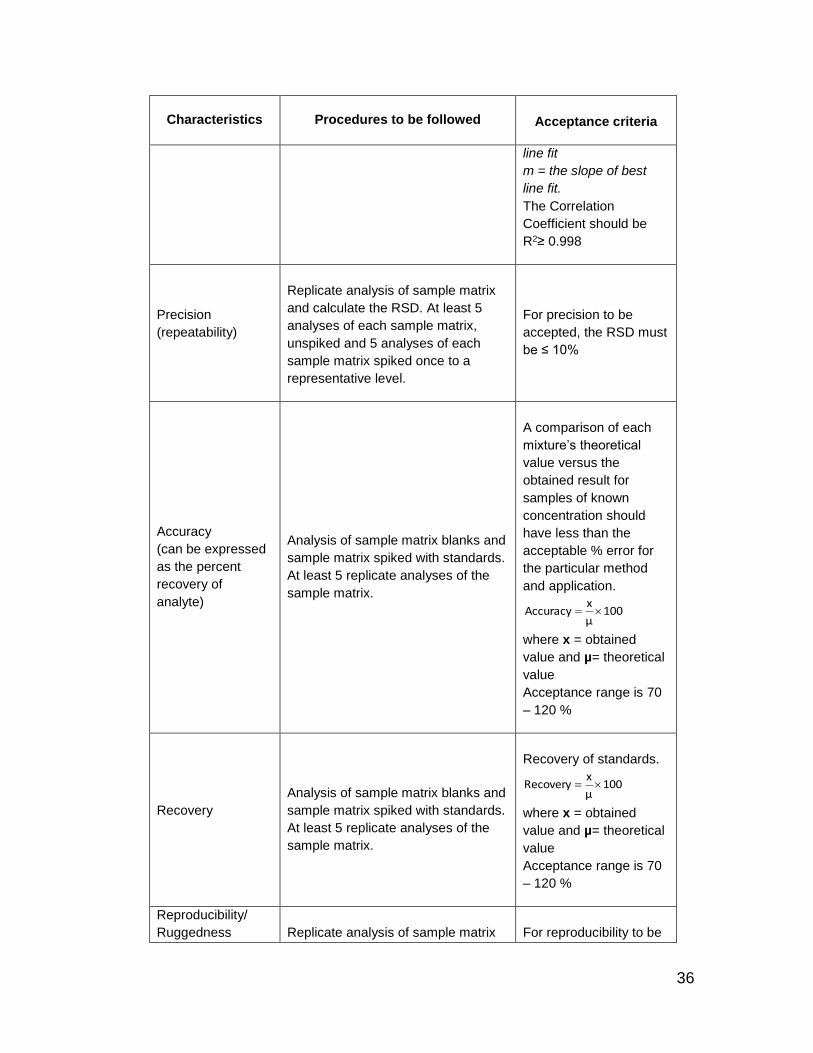
Characteristics Procedures to be followed
Acceptance criteria
line fit
m = the slope of best
line fit.
The Correlation
Coefficient should be
R2≥ 0.998
Precision
(repeatability)
Replicate analysis of sample matrix
and calculate the RSD. At least 5
analyses of each sample matrix,
unspiked and 5 analyses of each
sample matrix spiked once to a
representative level.
For precision to be
accepted, the RSD must
be ≤ 10%
Accuracy
(can be expressed
as the percent
recovery of
analyte)
Analysis of sample matrix blanks and
sample matrix spiked with standards.
At least 5 replicate analyses of the
sample matrix.
A comparison of each
mixture’s theoretical
value versus the
obtained result for
samples of known
concentration should
have less than the
acceptable % error for
the particular method
and application.
100µ
xAccuracy
where x = obtained
value and µ= theoretical
value
Acceptance range is 70
– 120 %
Recovery
Analysis of sample matrix blanks and
sample matrix spiked with standards.
At least 5 replicate analyses of the
sample matrix.
Recovery of standards.
100µ
xRecovery
where x = obtained
value and µ= theoretical
value
Acceptance range is 70
– 120 %
Reproducibility/
Ruggedness
Replicate analysis of sample matrix
For reproducibility to be

37
Characteristics Procedures to be followed
Acceptance criteria
(precision between
different runs)
over a longer set time period and
calculate the RSD. At least 5
analyses of each sample matrix,
unspiked and 5 analyses of each
sample matrix spiked once to a
representative level.
accepted, the RSD must
be ≤ 10%
Listed in Table 2.2 are the requirement that needs to be met for method
validation accreditation through SANAS for SANS 241:2015 drinking water.
2.3.2 Extended Validation Criteria
For method validation the characteristics tabled in Table 2.2 needs to be
achieved for accreditation. However, method validation does not have to stop
there. For this study a significant need to cover some characteristics that needed
to be addressed to improve the reliability of the method as a newly established
method that is not documented as Official Method of Analysis of AOAC
International. The characteristics tabulated below are the additional validation
criteria that needed to be included.
Table 2.3 Extended performance characteristics for validation
Characteristics Procedure to be followed Acceptable criteria
Measure of
Uncertainty
A laboratory quality control are run
6 times in duplicate for the
uncertainty to be calculated
The uncertainty is the
experimenter’s best
estimate of how far an
experimental quantity
might be from the true
value. the uncertainty
must be ≤ 10%
FAPAS
Provided an independent
assessment of laboratory
performance and compares the
results to that of laboratories
worldwide
Must pass the FAPAS
proficiency test
Inter-Laboratory
Comparing laboratory results
against SANAS accredited
For inter-laboratory to
be accepted, the RSD
38
laboratories results by outsourcing
samples
must be ≤ 10%
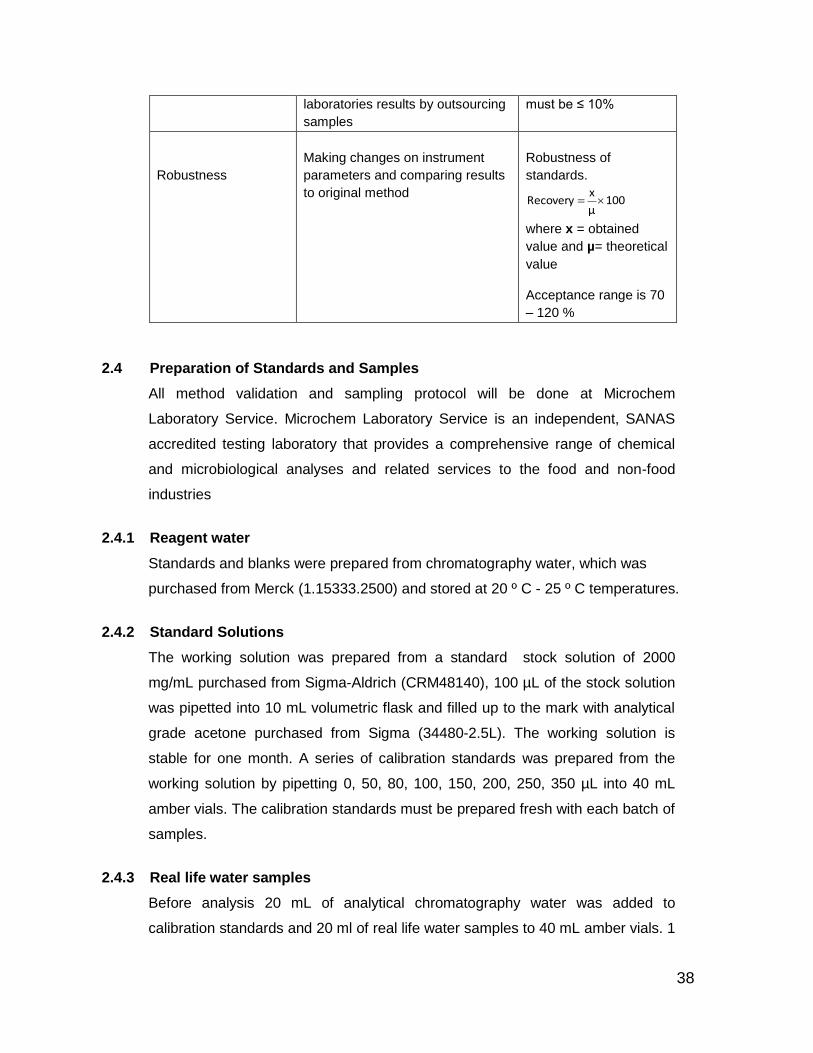
Robustness
Making changes on instrument
parameters and comparing results
to original method
Robustness of
standards.
100µ
xRecovery
where x = obtained
value and µ= theoretical
value
Acceptance range is 70
– 120 %
2.4 Preparation of Standards and Samples
All method validation and sampling protocol will be done at Microchem
Laboratory Service. Microchem Laboratory Service is an independent, SANAS
accredited testing laboratory that provides a comprehensive range of chemical
and microbiological analyses and related services to the food and non-food
industries
2.4.1 Reagent water
Standards and blanks were prepared from chromatography water, which was
purchased from Merck (1.15333.2500) and stored at 20 º C - 25 º C temperatures.
2.4.2 Standard Solutions
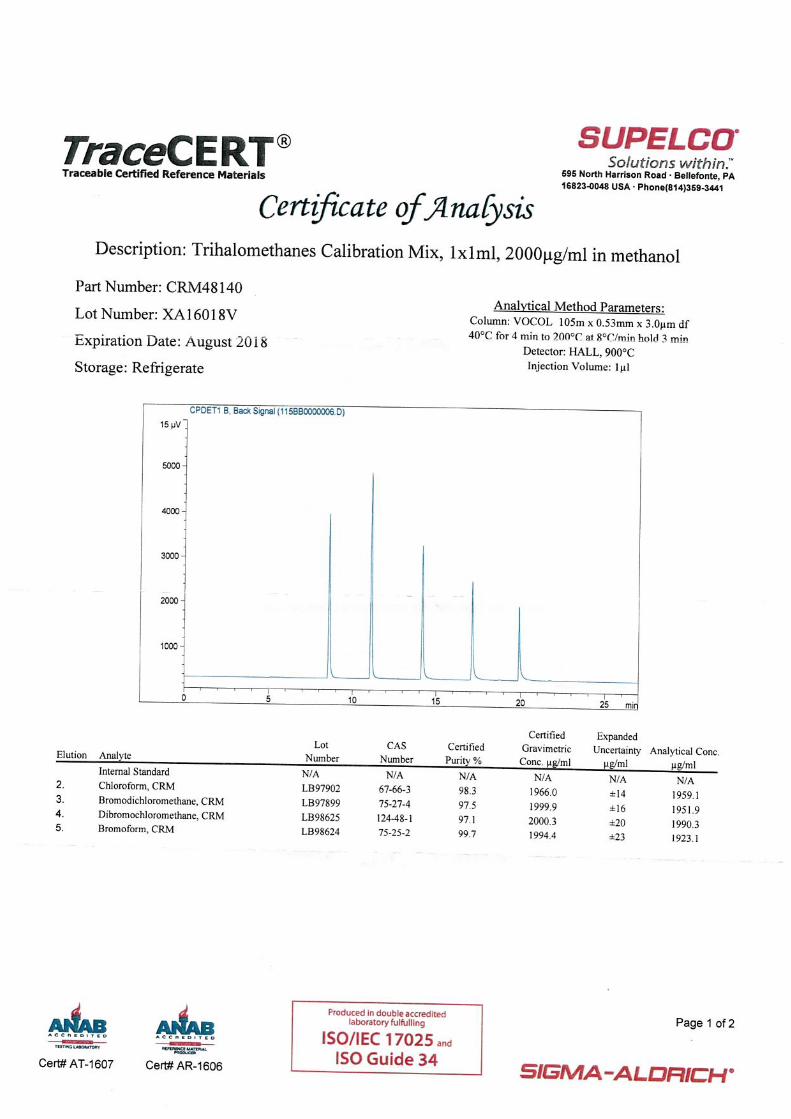
The working solution was prepared from a standard stock solution of 2000
mg/mL purchased from Sigma-Aldrich (CRM48140), 100 µL of the stock solution
was pipetted into 10 mL volumetric flask and filled up to the mark with analytical
grade acetone purchased from Sigma (34480-2.5L). The working solution is
stable for one month. A series of calibration standards was prepared from the
working solution by pipetting 0, 50, 80, 100, 150, 200, 250, 350 µL into 40 mL
amber vials. The calibration standards must be prepared fresh with each batch of
samples.
2.4.3 Real life water samples
Before analysis 20 mL of analytical chromatography water was added to
calibration standards and 20 ml of real life water samples to 40 mL amber vials. 1
39
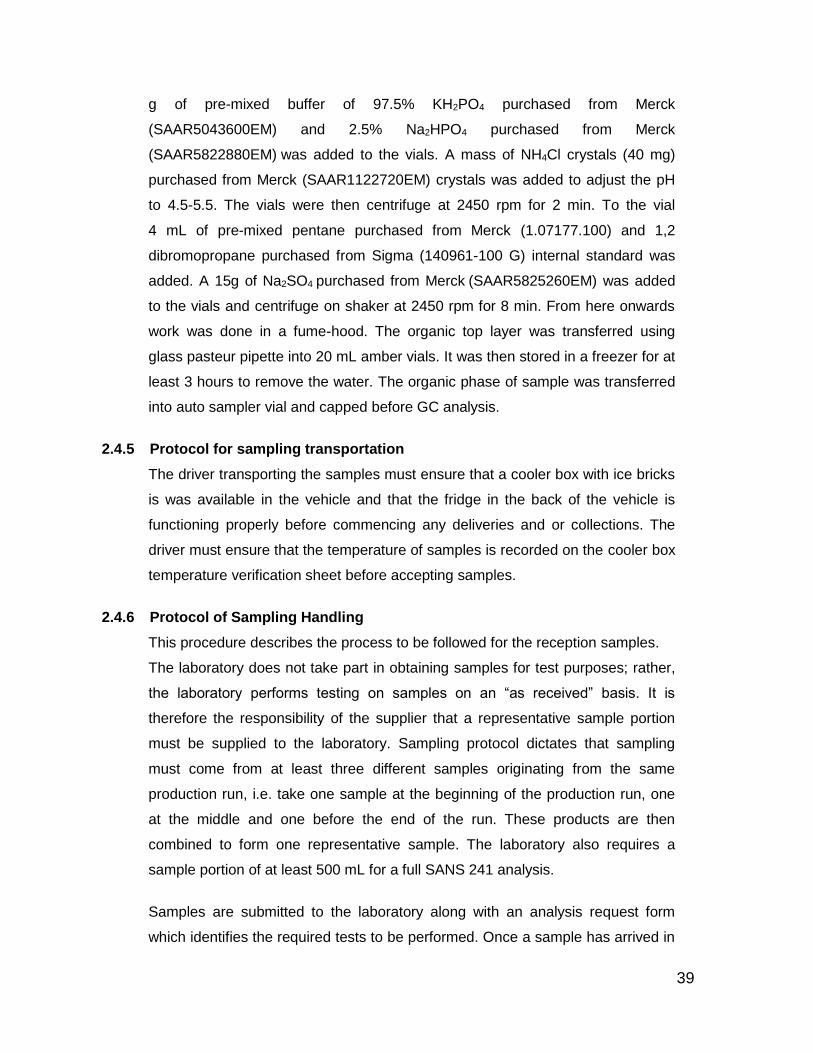
g of pre-mixed buffer of 97.5% KH2PO4 purchased from Merck
(SAAR5043600EM) and 2.5% Na2HPO4 purchased from Merck
(SAAR5822880EM) was added to the vials. A mass of NH4Cl crystals (40 mg)
purchased from Merck (SAAR1122720EM) crystals was added to adjust the pH
to 4.5-5.5. The vials were then centrifuge at 2450 rpm for 2 min. To the vial
4 mL of pre-mixed pentane purchased from Merck (1.07177.100) and 1,2
dibromopropane purchased from Sigma (140961-100 G) internal standard was
added. A 15g of Na2SO4 purchased from Merck (SAAR5825260EM) was added
to the vials and centrifuge on shaker at 2450 rpm for 8 min. From here onwards
work was done in a fume-hood. The organic top layer was transferred using
glass pasteur pipette into 20 mL amber vials. It was then stored in a freezer for at
least 3 hours to remove the water. The organic phase of sample was transferred
into auto sampler vial and capped before GC analysis.
2.4.5 Protocol for sampling transportation
The driver transporting the samples must ensure that a cooler box with ice bricks
is was available in the vehicle and that the fridge in the back of the vehicle is
functioning properly before commencing any deliveries and or collections. The
driver must ensure that the temperature of samples is recorded on the cooler box
temperature verification sheet before accepting samples.
2.4.6 Protocol of Sampling Handling
This procedure describes the process to be followed for the reception samples.
The laboratory does not take part in obtaining samples for test purposes; rather,
the laboratory performs testing on samples on an “as received” basis. It is
therefore the responsibility of the supplier that a representative sample portion
must be supplied to the laboratory. Sampling protocol dictates that sampling
must come from at least three different samples originating from the same
production run, i.e. take one sample at the beginning of the production run, one
at the middle and one before the end of the run. These products are then
combined to form one representative sample. The laboratory also requires a
sample portion of at least 500 mL for a full SANS 241 analysis.
Samples are submitted to the laboratory along with an analysis request form
which identifies the required tests to be performed. Once a sample has arrived in

40
the laboratory it is logged into the Laboratory Information Management System
(LIMS) by the administrative personnel member and is assigned a unique
laboratory sample ID (e.g. AA43257). This sample ID number is printed on a set
of sample labels, of which one is affixed to the sample packaging. The labeled
sample (known as the laboratory sample), along with the second label and a
copy of the request form is sent to the sampling area in the laboratory.
Particle size reduction is important to ensure that any chemicals or enzymes
used during an analysis are in contact with the maximum surface area of the
sample. Increasing the surface area of a substance generally increases the rate
of a chemical reaction. It was also important to ensure that samples are properly
homogenized to ensure a uniform distribution of sample components and
nutrients throughout the sample (this is particularly important when working with
fortified products or recipe dishes).
The first step performed by the analyst in the laboratory is to verify that the
sample has been correctly logged for all of the required tests. This is done by
opening the sample data in LIMS and crosschecking with the analysis request
form. The request form will be signed by the personnel member checking the
request form. The tests required for the sample must be carefully recorded as
different tests require different handling of the sample. Sometimes as much as 20
sample portions are provided-spanning a certain production period and are used
to form a composite sample.
The sample jars are labelled by attaching the sample label to the jar. A sample ID
number (e.g. AA43256) must be clearly written on the lid of the sample with a
permanent marker. After the sampling process, the analysis request form is filled
in the appropriate record file. The sample jars get stored in the laboratory fridge.
The appropriate sample must be recorded in the sample login record book to
indicate that the sample has been sampled and is ready for analysis.
41
CHAPTER 3
Method Validation Results
3.1 Introduction
Validation of an analytical method is the process by which the laboratory
establishes that the performance characteristics of the method meet the
requirement for the intended analytical applications. The limitations of the
method, as well as any factors which may influence its characteristics are also
established.
Validation was done with optimized GC-ECD method (paragraph 2.2 pg 19-27).
All information that was obtained from the GC-ECD instrument was stored on
Laboratory Information Management Software (LIMS). The following water
matrices were validated: river water, underground water, tap water (Woodstock),
municipal water, chlorinated water, sea water, Johnson-Johnson medical water,
unfiltered water and borehole water. All samples contain a unique barcode that
makes it possible to retrieve any relevant information for any sample. The
method will be validated in reference with Microchem Laboratory Services
Standard Operating Procedure (SOP-C-002/07), which was established in
conjunction with reference from the following documents:
1. ISO 17025:2005-Section 5.4.5
2. SOP-QM-016-method Validation
3. SANAS TG 41-Guidelines for the Verification of Methods in Forensic Chemistry
4. SANCO/10684/2009-Method Validation and Quality Control Procedures for
Pesticides Residues Analysis in Food and Feed
Microchem Laboratory Service is an independent, SANAS accredited testing
laboratory that provides a comprehensive range of chemical and microbiological
analyses and related services to the food and non-food industries.
3.2 Method validation results Method validation was established in the following order, limit of detection (LOD),
limit of quantification (LOQ), instrument linearity, instrument precision, matrix
effect based on recovery, matrix effect based on interferences, precision based
42
on reproducibility, accuracy based on recovery, selectivity based on recovery,
selectivity based on interferences, inter-laboratory comparison, precision based
on repeatability, robustness, measure of uncertainty (MOU) and proficiency
testing.
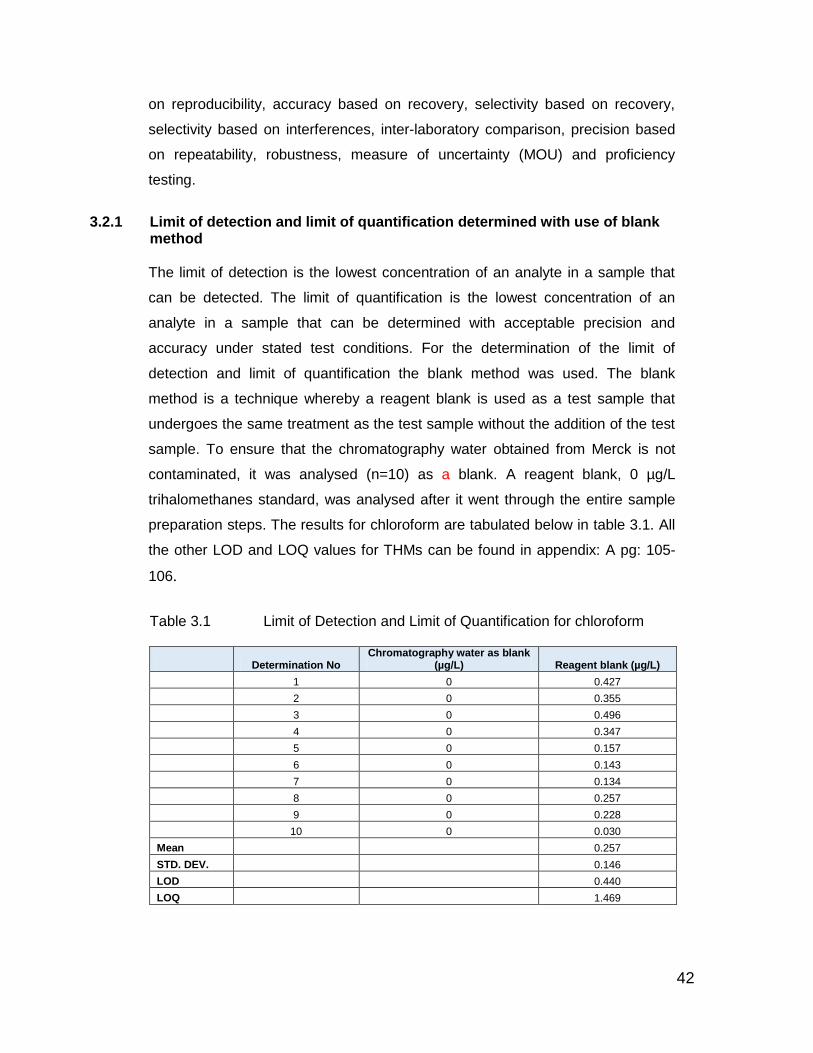
3.2.1 Limit of detection and limit of quantification determined with use of blank
method The limit of detection is the lowest concentration of an analyte in a sample that
can be detected. The limit of quantification is the lowest concentration of an
analyte in a sample that can be determined with acceptable precision and
accuracy under stated test conditions. For the determination of the limit of
detection and limit of quantification the blank method was used. The blank
method is a technique whereby a reagent blank is used as a test sample that
undergoes the same treatment as the test sample without the addition of the test
sample. To ensure that the chromatography water obtained from Merck is not
contaminated, it was analysed (n=10) as a blank. A reagent blank, 0 µg/L
trihalomethanes standard, was analysed after it went through the entire sample
preparation steps. The results for chloroform are tabulated below in table 3.1. All
the other LOD and LOQ values for THMs can be found in appendix: A pg: 105-
106.
Table 3.1 Limit of Detection and Limit of Quantification for chloroform
Determination No Chromatography water as blank
(µg/L) Reagent blank (µg/L)
1 0 0.427
2 0 0.355
3 0 0.496
4 0 0.347
5 0 0.157
6 0 0.143
7 0 0.134
8 0 0.257
9 0 0.228
10 0 0.030
Mean 0.257
STD. DEV. 0.146
LOD 0.440
LOQ 1.469
43
Sample calculation for chloroform as reagent blank LOD= Stdev × 3 LOQ= Stdev × 10 LOD chloroform= 0.1469 × 3 = 0.4407 LOQ chloroform= 0.1469 ×10 =14690
Table 3.2 Summary of Limit of Detection and Limit of Quantification for THMs
Trihalomethanes
Limit of Detection
µg/L
Limit of
Quantification µg/L
Chloroform 0.4407 1.4690
Bromodichloromethane 0.2927 0.9759
Chlorodibromomethane 0.1999 0.6664
Bromoform 0.2056 0.6854
From the values reported in table 3.2, it can be concluded that the analytes of
interest can be quantified and detected at this stipulated values, which falls in the
instrument quantification range.
Instrument Linearity
Instrument linearity is how well a plot of the analytical response versus the
quantity of the interest follows a straight line. The calibration curves was obtained
by preparing 7 different concentrations, that make up the working range, and
these were analysed (n=7). The 7 concentrations ranged from 50 - 350 µg/L.
This range was selected to cover the entire SANS 241:2015 range of limits that
each trihalomethanes should not exceed, e.g. chloroform should not exceed 300
µg/L, bromodichloromethane 60 µg/L, chlorodibromomethane and bromoform
100 µg/L. The peak area of each analyte from 50 - 350 µg/L as well as the peak
area of the internal standard was obtained from the instrument. The area ratios of
each analyte were then calculated by dividing the peak area of the analytes by
the peak area of the internal standard at different theoretical concentrations. This
approach was taken to minimize errors and data manipulation. Errors can be
minimized by comparing the internal standard peak area of each analyte to one
another.
44
Data manipulation is much more difficult to implement when the peak area of
analyte is divided by peak area of internal standard at different concentrations.
Data manipulations can easily be implemented when, area of each analyte is
manually integrated to make it a desired value; however, this is much more
difficult to achieve when making use of the internal standard peak area. The
internal standard peak area is directly proportional to that of the analyte. If the
internal standard peak area is reduced, the peak area of the analyte increases
and vice versa. A linearity graph was plotted by using the area ratio of each
analyte against the concentration. All the other linearity values for THMs can be
found in appendix: A pg. 107.
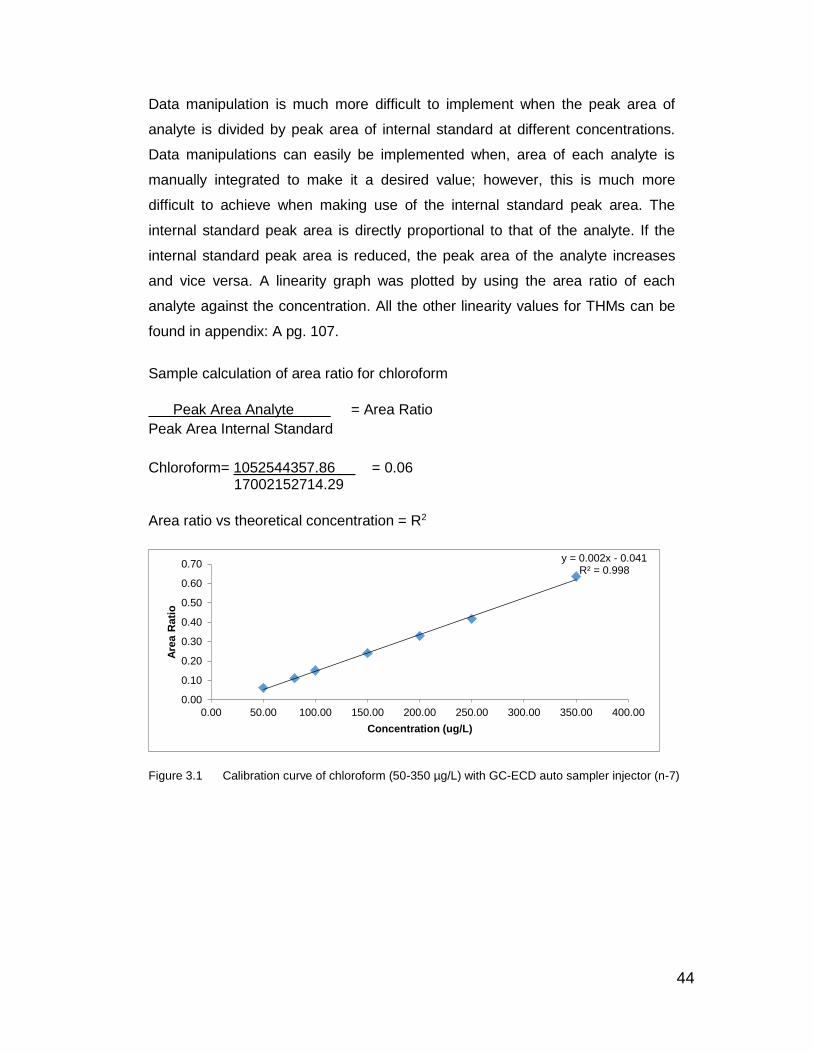
Sample calculation of area ratio for chloroform
Peak Area Analyte = Area Ratio
Peak Area Internal Standard
Chloroform= 1052544357.86 = 0.06 17002152714.29
Area ratio vs theoretical concentration = R2
Figure 3.1 Calibration curve of chloroform (50-350 µg/L) with GC-ECD auto sampler injector (n-7)
y = 0.002x - 0.041R² = 0.998
0.00
0.10
0.20
0.30
0.40
0.50
0.60
0.70
0.00 50.00 100.00 150.00 200.00 250.00 300.00 350.00 400.00
Are
a R
ati
o
Concentration (ug/L)
45
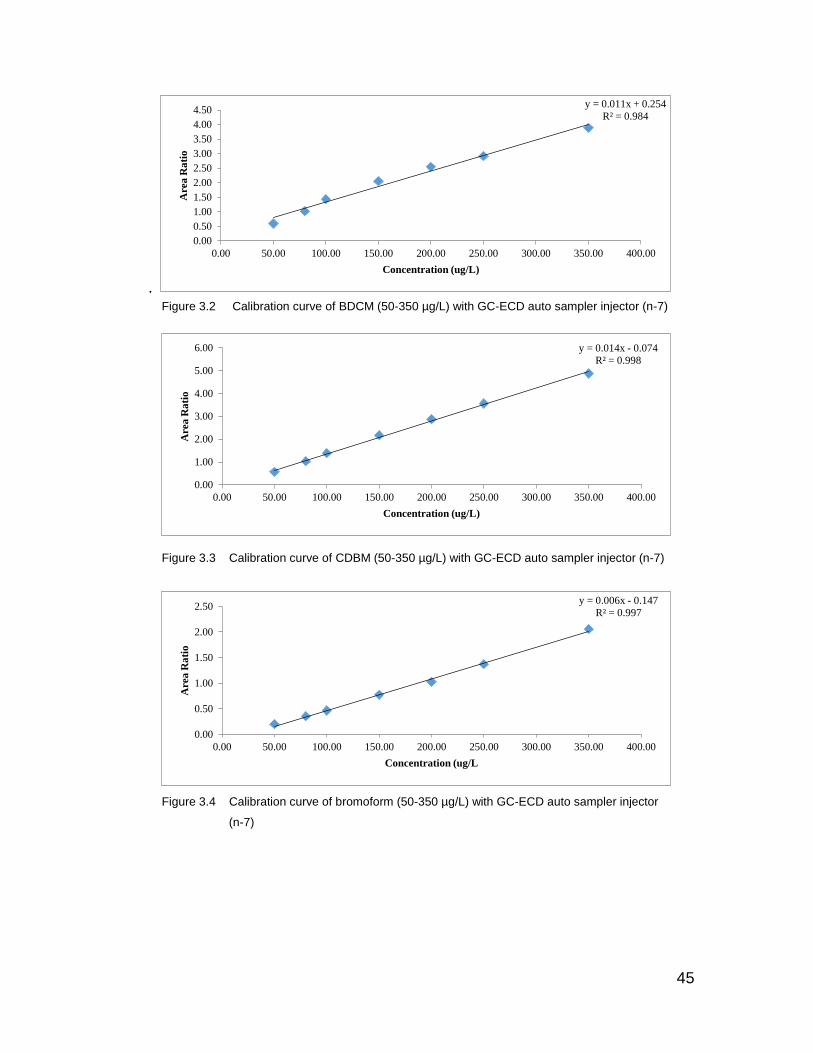
. Figure 3.2 Calibration curve of BDCM (50-350 µg/L) with GC-ECD auto sampler injector (n-7)
Figure 3.3 Calibration curve of CDBM (50-350 µg/L) with GC-ECD auto sampler injector (n-7)
Figure 3.4 Calibration curve of bromoform (50-350 µg/L) with GC-ECD auto sampler injector
(n-7)
y = 0.011x + 0.254
R² = 0.984
0.00
0.50
1.00
1.50
2.00
2.50
3.00
3.50
4.00
4.50
0.00 50.00 100.00 150.00 200.00 250.00 300.00 350.00 400.00
Are
a R
ati
o
Concentration (ug/L)
y = 0.014x - 0.074
R² = 0.998
0.00
1.00
2.00
3.00
4.00
5.00
6.00
0.00 50.00 100.00 150.00 200.00 250.00 300.00 350.00 400.00
Are
a R
ati
o
Concentration (ug/L)
y = 0.006x - 0.147
R² = 0.997
0.00
0.50
1.00
1.50
2.00
2.50
0.00 50.00 100.00 150.00 200.00 250.00 300.00 350.00 400.00
Are
a R
ati
o
Concentration (ug/L
46
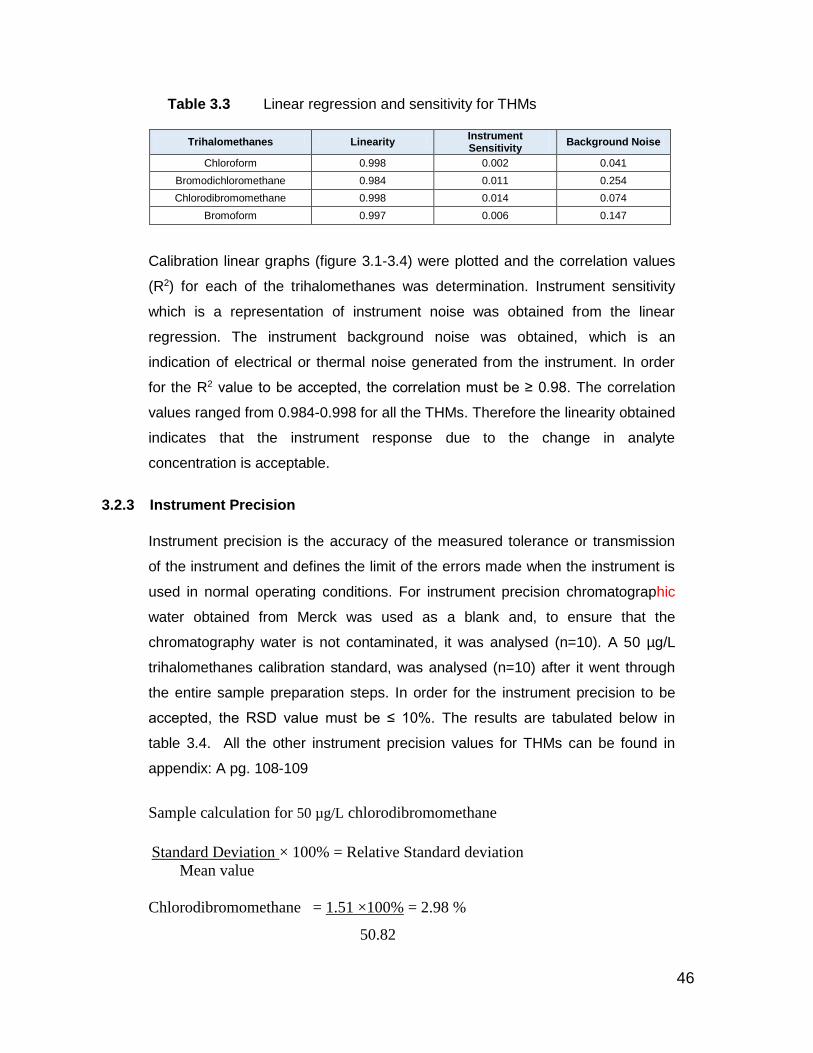
Table 3.3 Linear regression and sensitivity for THMs
Trihalomethanes Linearity Instrument Sensitivity
Background Noise
Chloroform 0.998 0.002 0.041
Bromodichloromethane 0.984 0.011 0.254
Chlorodibromomethane 0.998 0.014 0.074
Bromoform 0.997 0.006 0.147
Calibration linear graphs (figure 3.1-3.4) were plotted and the correlation values
(R2) for each of the trihalomethanes was determination. Instrument sensitivity
which is a representation of instrument noise was obtained from the linear
regression. The instrument background noise was obtained, which is an
indication of electrical or thermal noise generated from the instrument. In order
for the R2 value to be accepted, the correlation must be ≥ 0.98. The correlation
values ranged from 0.984-0.998 for all the THMs. Therefore the linearity obtained
indicates that the instrument response due to the change in analyte
concentration is acceptable.
3.2.3 Instrument Precision
Instrument precision is the accuracy of the measured tolerance or transmission
of the instrument and defines the limit of the errors made when the instrument is
used in normal operating conditions. For instrument precision chromatographic
water obtained from Merck was used as a blank and, to ensure that the
chromatography water is not contaminated, it was analysed (n=10). A 50 µg/L
trihalomethanes calibration standard, was analysed (n=10) after it went through
the entire sample preparation steps. In order for the instrument precision to be
accepted, the RSD value must be ≤ 10%. The results are tabulated below in
table 3.4. All the other instrument precision values for THMs can be found in
appendix: A pg. 108-109
Sample calculation for 50 µg/L chlorodibromomethane
Standard Deviation × 100% = Relative Standard deviation
Mean value
Chlorodibromomethane = 1.51 ×100% = 2.98 %
50.82
47
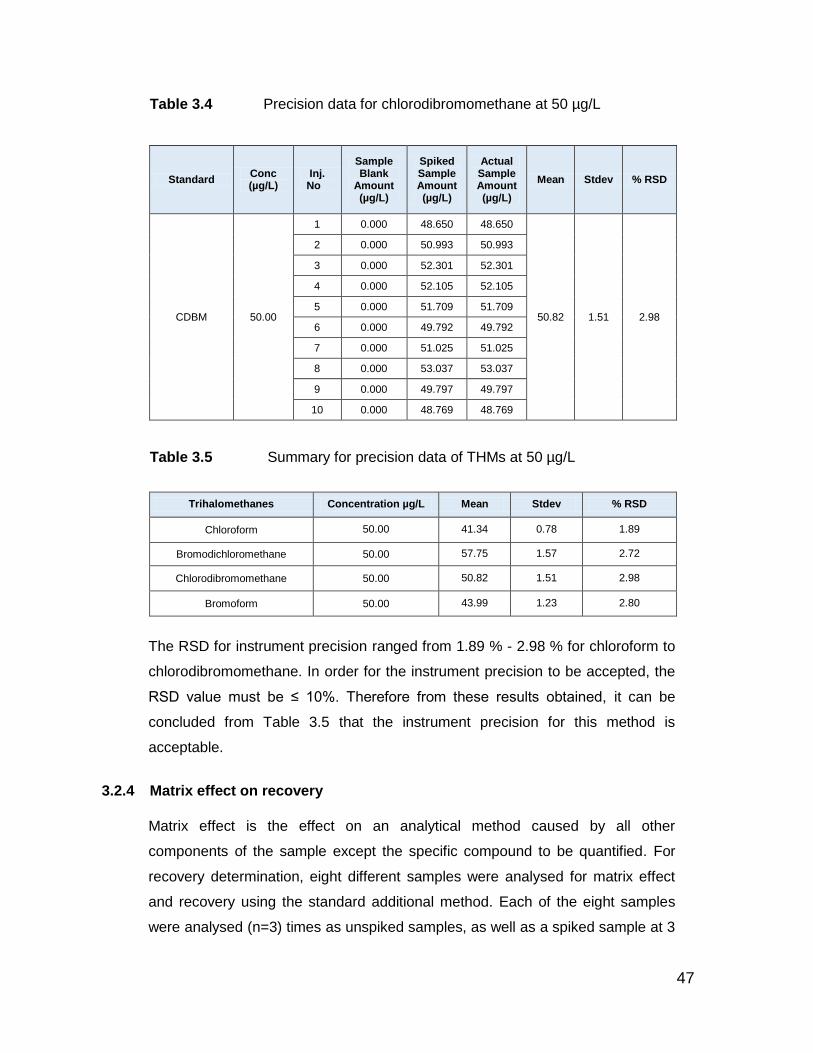
Table 3.4 Precision data for chlorodibromomethane at 50 µg/L
Standard Conc (µg/L)
Inj. No
Sample Blank
Amount (µg/L)
Spiked Sample Amount (µg/L)
Actual Sample Amount (µg/L)
Mean Stdev % RSD
CDBM 50.00
1 0.000 48.650 48.650
50.82 1.51 2.98
2 0.000 50.993 50.993
3 0.000 52.301 52.301
4 0.000 52.105 52.105
5 0.000 51.709 51.709
6 0.000 49.792 49.792
7 0.000 51.025 51.025
8 0.000 53.037 53.037
9 0.000 49.797 49.797
10 0.000 48.769 48.769
Table 3.5 Summary for precision data of THMs at 50 µg/L
Trihalomethanes Concentration µg/L Mean Stdev % RSD
Chloroform 50.00 41.34 0.78 1.89
Bromodichloromethane 50.00 57.75 1.57 2.72
Chlorodibromomethane 50.00 50.82 1.51 2.98
Bromoform 50.00 43.99 1.23 2.80
The RSD for instrument precision ranged from 1.89 % - 2.98 % for chloroform to
chlorodibromomethane. In order for the instrument precision to be accepted, the
RSD value must be ≤ 10%. Therefore from these results obtained, it can be
concluded from Table 3.5 that the instrument precision for this method is
acceptable.
3.2.4 Matrix effect on recovery
Matrix effect is the effect on an analytical method caused by all other
components of the sample except the specific compound to be quantified. For
recovery determination, eight different samples were analysed for matrix effect
and recovery using the standard additional method. Each of the eight samples
were analysed (n=3) times as unspiked samples, as well as a spiked sample at 3
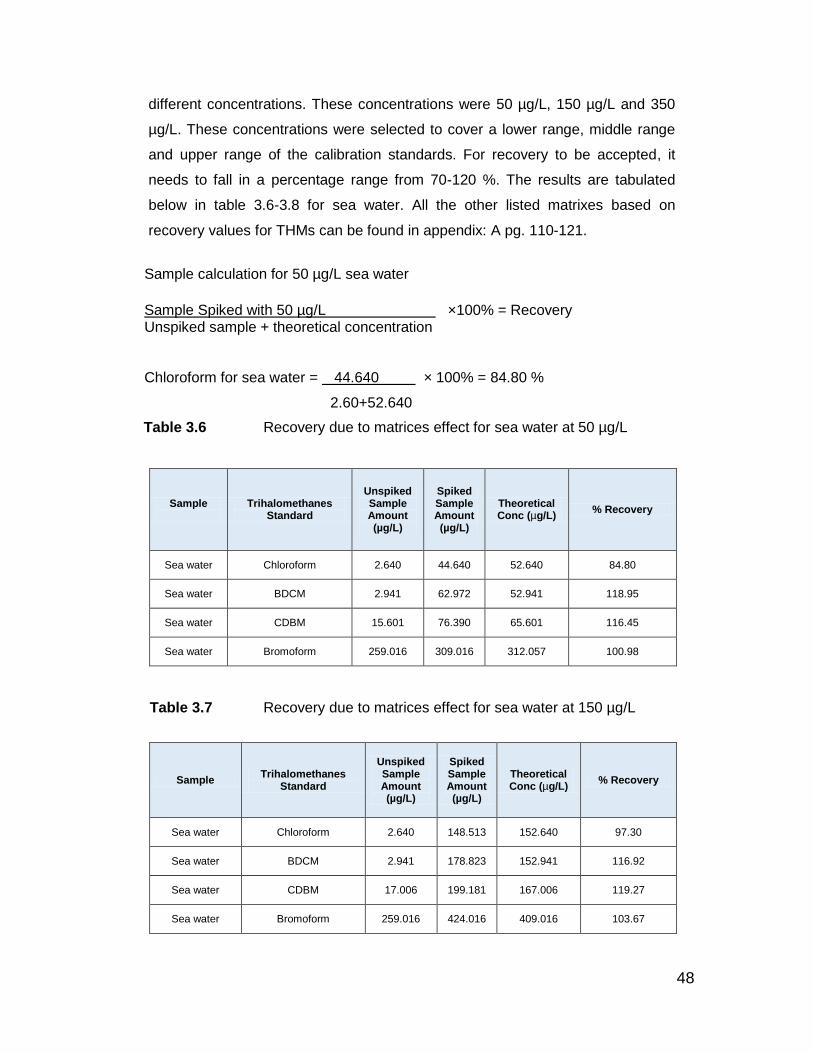
48
different concentrations. These concentrations were 50 µg/L, 150 µg/L and 350
µg/L. These concentrations were selected to cover a lower range, middle range
and upper range of the calibration standards. For recovery to be accepted, it
needs to fall in a percentage range from 70-120 %. The results are tabulated
below in table 3.6-3.8 for sea water. All the other listed matrixes based on
recovery values for THMs can be found in appendix: A pg. 110-121.
Sample calculation for 50 µg/L sea water
Sample Spiked with 50 µg/L ×100% = Recovery Unspiked sample + theoretical concentration
Chloroform for sea water = 44.640 × 100% = 84.80 %
2.60+52.640
Table 3.6 Recovery due to matrices effect for sea water at 50 µg/L
Sample
Trihalomethanes Standard
Unspiked Sample Amount (µg/L)
Spiked Sample Amount (µg/L)
Theoretical Conc (µg/L)
% Recovery
Sea water Chloroform 2.640 44.640 52.640 84.80
Sea water BDCM 2.941 62.972 52.941 118.95
Sea water CDBM 15.601 76.390 65.601 116.45
Sea water Bromoform 259.016 309.016 312.057 100.98
Table 3.7 Recovery due to matrices effect for sea water at 150 µg/L
Sample Trihalomethanes
Standard
Unspiked Sample Amount (µg/L)
Spiked Sample Amount (µg/L)
Theoretical Conc (µg/L)
% Recovery
Sea water Chloroform 2.640 148.513 152.640 97.30
Sea water BDCM 2.941 178.823 152.941 116.92
Sea water CDBM 17.006 199.181 167.006 119.27
Sea water Bromoform 259.016 424.016 409.016 103.67
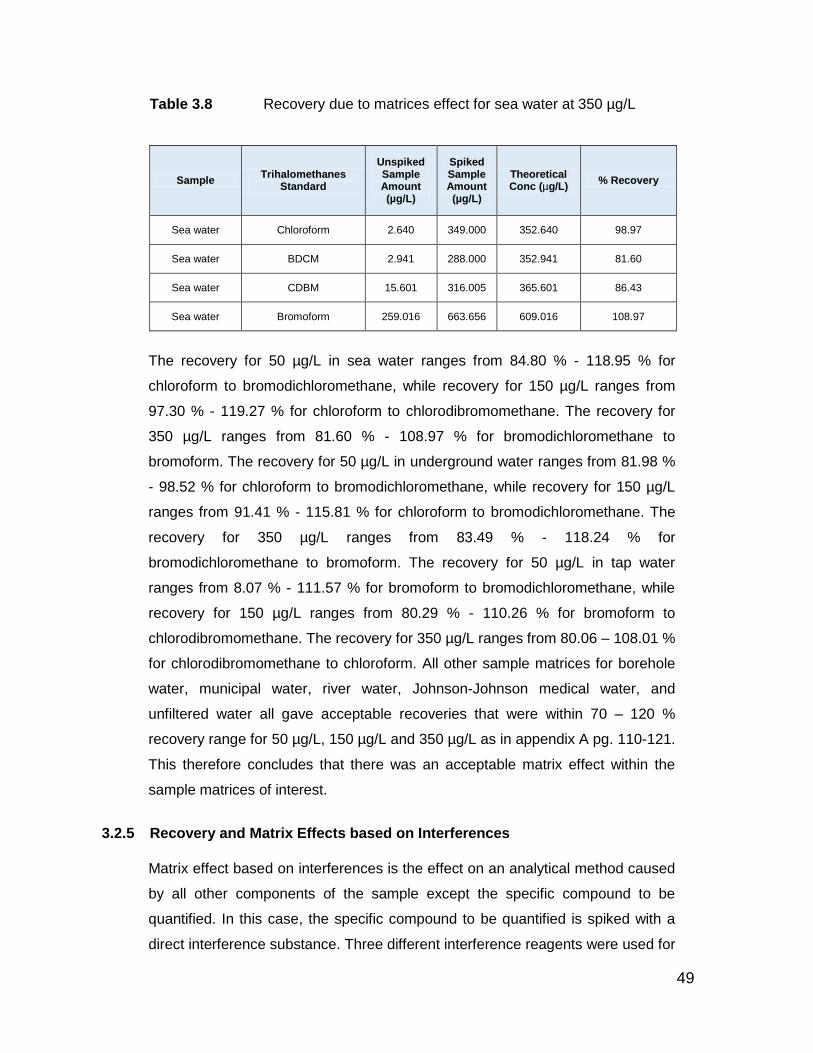
49
Table 3.8 Recovery due to matrices effect for sea water at 350 µg/L
Sample Trihalomethanes
Standard
Unspiked Sample Amount (µg/L)
Spiked Sample Amount (µg/L)
Theoretical Conc (µg/L)
% Recovery
Sea water Chloroform 2.640 349.000 352.640 98.97
Sea water BDCM 2.941 288.000 352.941 81.60
Sea water CDBM 15.601 316.005 365.601 86.43
Sea water Bromoform 259.016 663.656 609.016 108.97
The recovery for 50 µg/L in sea water ranges from 84.80 % - 118.95 % for
chloroform to bromodichloromethane, while recovery for 150 µg/L ranges from
97.30 % - 119.27 % for chloroform to chlorodibromomethane. The recovery for
350 µg/L ranges from 81.60 % - 108.97 % for bromodichloromethane to
bromoform. The recovery for 50 µg/L in underground water ranges from 81.98 %
- 98.52 % for chloroform to bromodichloromethane, while recovery for 150 µg/L
ranges from 91.41 % - 115.81 % for chloroform to bromodichloromethane. The
recovery for 350 µg/L ranges from 83.49 % - 118.24 % for
bromodichloromethane to bromoform. The recovery for 50 µg/L in tap water
ranges from 8.07 % - 111.57 % for bromoform to bromodichloromethane, while
recovery for 150 µg/L ranges from 80.29 % - 110.26 % for bromoform to
chlorodibromomethane. The recovery for 350 µg/L ranges from 80.06 – 108.01 %
for chlorodibromomethane to chloroform. All other sample matrices for borehole
water, municipal water, river water, Johnson-Johnson medical water, and
unfiltered water all gave acceptable recoveries that were within 70 – 120 %
recovery range for 50 µg/L, 150 µg/L and 350 µg/L as in appendix A pg. 110-121.
This therefore concludes that there was an acceptable matrix effect within the
sample matrices of interest.
3.2.5 Recovery and Matrix Effects based on Interferences
Matrix effect based on interferences is the effect on an analytical method caused
by all other components of the sample except the specific compound to be
quantified. In this case, the specific compound to be quantified is spiked with a
direct interference substance. Three different interference reagents were used for
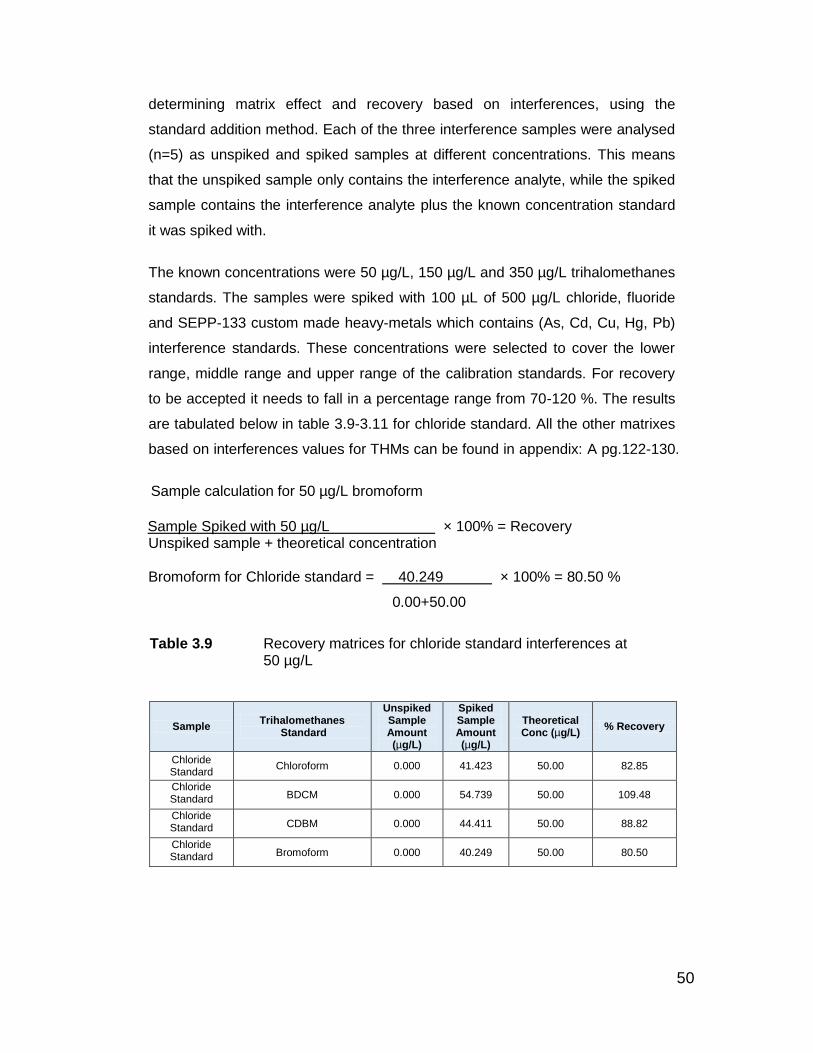
50
determining matrix effect and recovery based on interferences, using the
standard addition method. Each of the three interference samples were analysed
(n=5) as unspiked and spiked samples at different concentrations. This means
that the unspiked sample only contains the interference analyte, while the spiked
sample contains the interference analyte plus the known concentration standard
it was spiked with.
The known concentrations were 50 µg/L, 150 µg/L and 350 µg/L trihalomethanes
standards. The samples were spiked with 100 µL of 500 µg/L chloride, fluoride
and SEPP-133 custom made heavy-metals which contains (As, Cd, Cu, Hg, Pb)
interference standards. These concentrations were selected to cover the lower
range, middle range and upper range of the calibration standards. For recovery
to be accepted it needs to fall in a percentage range from 70-120 %. The results
are tabulated below in table 3.9-3.11 for chloride standard. All the other matrixes
based on interferences values for THMs can be found in appendix: A pg.122-130.
Sample calculation for 50 µg/L bromoform
Sample Spiked with 50 µg/L × 100% = Recovery Unspiked sample + theoretical concentration Bromoform for Chloride standard = 40.249 × 100% = 80.50 %
0.00+50.00
Table 3.9 Recovery matrices for chloride standard interferences at 50 µg/L
Sample Trihalomethanes
Standard
Unspiked Sample Amount (µg/L)
Spiked Sample Amount (µg/L)
Theoretical Conc (µg/L)
% Recovery
Chloride Standard
Chloroform 0.000 41.423 50.00 82.85
Chloride Standard BDCM 0.000 54.739 50.00 109.48
Chloride Standard CDBM 0.000 44.411 50.00 88.82
Chloride Standard Bromoform 0.000 40.249 50.00 80.50
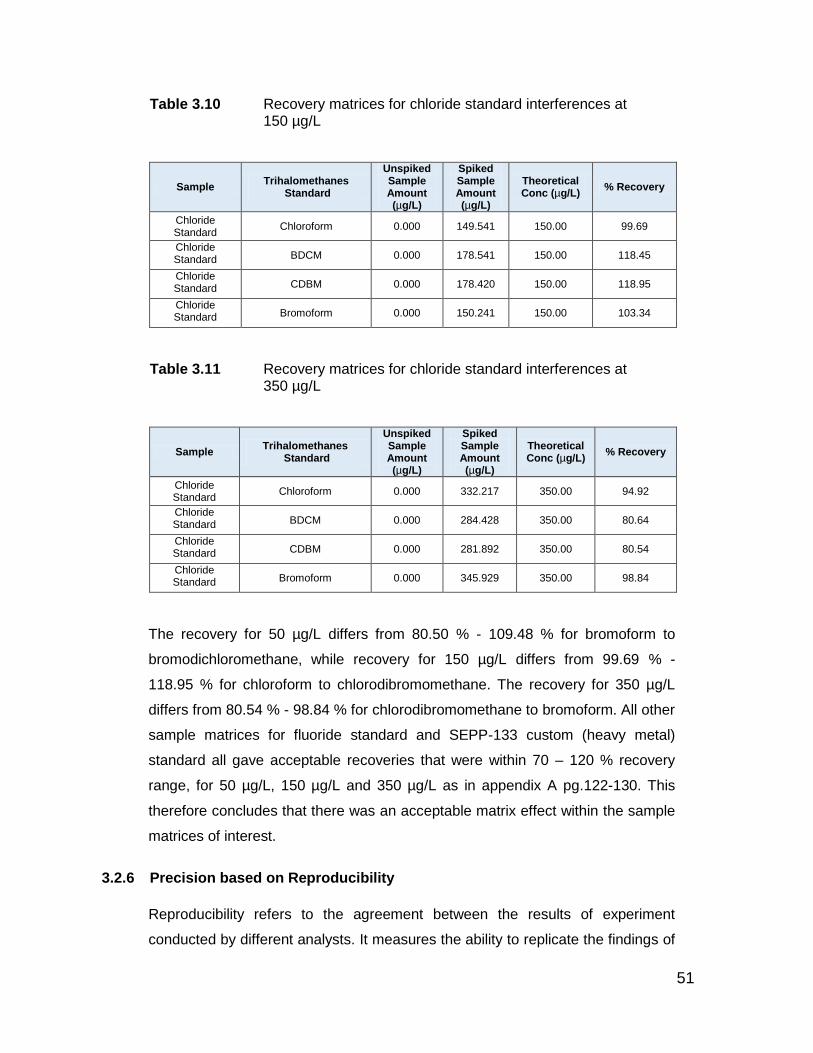
51
Table 3.10 Recovery matrices for chloride standard interferences at 150 µg/L
Sample Trihalomethanes
Standard
Unspiked Sample Amount (µg/L)
Spiked Sample Amount (µg/L)
Theoretical Conc (µg/L)
% Recovery
Chloride Standard
Chloroform 0.000 149.541 150.00 99.69
Chloride Standard BDCM 0.000 178.541 150.00 118.45
Chloride Standard CDBM 0.000 178.420 150.00 118.95
Chloride Standard Bromoform 0.000 150.241 150.00 103.34
Table 3.11 Recovery matrices for chloride standard interferences at 350 µg/L
Sample Trihalomethanes
Standard
Unspiked Sample Amount (µg/L)
Spiked Sample Amount (µg/L)
Theoretical Conc (µg/L)
% Recovery
Chloride Standard
Chloroform 0.000 332.217 350.00 94.92
Chloride Standard BDCM 0.000 284.428 350.00 80.64
Chloride Standard CDBM 0.000 281.892 350.00 80.54
Chloride Standard Bromoform 0.000 345.929 350.00 98.84
The recovery for 50 µg/L differs from 80.50 % - 109.48 % for bromoform to
bromodichloromethane, while recovery for 150 µg/L differs from 99.69 % -
118.95 % for chloroform to chlorodibromomethane. The recovery for 350 µg/L
differs from 80.54 % - 98.84 % for chlorodibromomethane to bromoform. All other
sample matrices for fluoride standard and SEPP-133 custom (heavy metal)
standard all gave acceptable recoveries that were within 70 – 120 % recovery
range, for 50 µg/L, 150 µg/L and 350 µg/L as in appendix A pg.122-130. This
therefore concludes that there was an acceptable matrix effect within the sample
matrices of interest.
3.2.6 Precision based on Reproducibility
Reproducibility refers to the agreement between the results of experiment
conducted by different analysts. It measures the ability to replicate the findings of
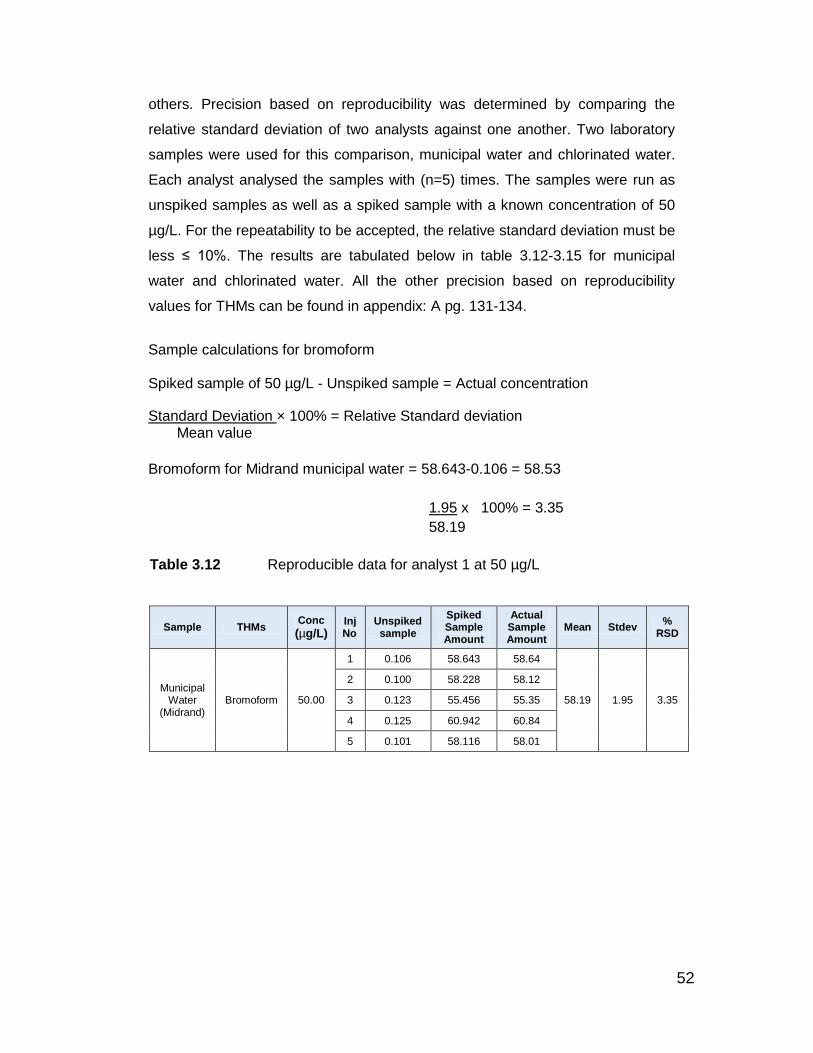
52
others. Precision based on reproducibility was determined by comparing the
relative standard deviation of two analysts against one another. Two laboratory
samples were used for this comparison, municipal water and chlorinated water.
Each analyst analysed the samples with (n=5) times. The samples were run as
unspiked samples as well as a spiked sample with a known concentration of 50
µg/L. For the repeatability to be accepted, the relative standard deviation must be
less ≤ 10%. The results are tabulated below in table 3.12-3.15 for municipal
water and chlorinated water. All the other precision based on reproducibility
values for THMs can be found in appendix: A pg. 131-134.
Sample calculations for bromoform Spiked sample of 50 µg/L - Unspiked sample = Actual concentration
Standard Deviation × 100% = Relative Standard deviation Mean value
Bromoform for Midrand municipal water = 58.643-0.106 = 58.53
1.95 x 100% = 3.35
58.19
Table 3.12 Reproducible data for analyst 1 at 50 µg/L
Sample THMs Conc
(µg/L) Inj No
Unspiked sample
Spiked Sample Amount
Actual Sample Amount
Mean Stdev %
RSD
Municipal Water
(Midrand) Bromoform 50.00
1 0.106 58.643 58.64
58.19 1.95 3.35
2 0.100 58.228 58.12
3 0.123 55.456 55.35
4 0.125 60.942 60.84
5 0.101 58.116 58.01
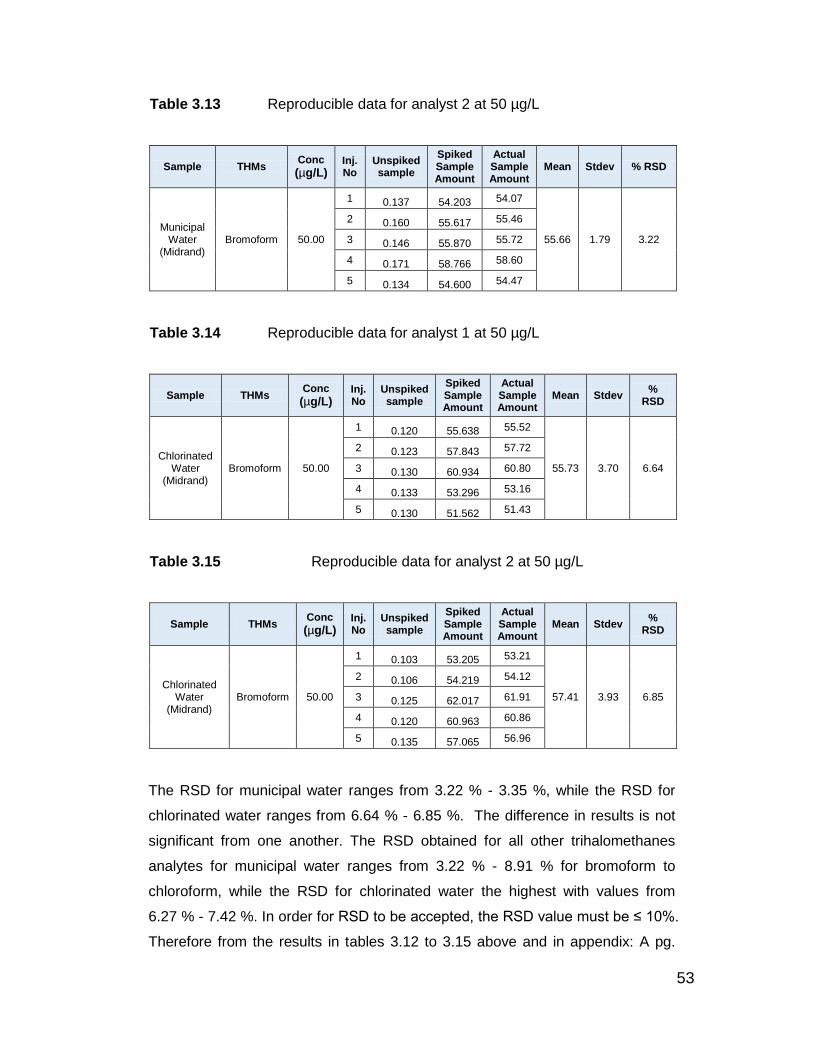
53
Table 3.13 Reproducible data for analyst 2 at 50 µg/L
Sample THMs Conc
(µg/L) Inj. No
Unspiked sample
Spiked Sample Amount
Actual Sample Amount
Mean Stdev % RSD
Municipal Water
(Midrand) Bromoform 50.00
1 0.137 54.203 54.07
55.66 1.79 3.22
2 0.160 55.617 55.46
3 0.146 55.870 55.72
4 0.171 58.766 58.60
5 0.134 54.600 54.47
Table 3.14 Reproducible data for analyst 1 at 50 µg/L
Sample THMs Conc
(µg/L) Inj. No
Unspiked sample
Spiked Sample Amount
Actual Sample Amount
Mean Stdev %
RSD
Chlorinated Water
(Midrand) Bromoform 50.00
1 0.120 55.638 55.52
55.73 3.70 6.64
2 0.123 57.843 57.72
3 0.130 60.934 60.80
4 0.133 53.296 53.16
5 0.130 51.562 51.43
Table 3.15 Reproducible data for analyst 2 at 50 µg/L
Sample THMs Conc
(µg/L) Inj. No
Unspiked sample
Spiked Sample Amount
Actual Sample Amount
Mean Stdev %
RSD
Chlorinated Water
(Midrand) Bromoform 50.00
1 0.103 53.205 53.21
57.41 3.93 6.85
2 0.106 54.219 54.12
3 0.125 62.017 61.91
4 0.120 60.963 60.86
5 0.135 57.065 56.96
The RSD for municipal water ranges from 3.22 % - 3.35 %, while the RSD for
chlorinated water ranges from 6.64 % - 6.85 %. The difference in results is not
significant from one another. The RSD obtained for all other trihalomethanes
analytes for municipal water ranges from 3.22 % - 8.91 % for bromoform to
chloroform, while the RSD for chlorinated water the highest with values from
6.27 % - 7.42 %. In order for RSD to be accepted, the RSD value must be ≤ 10%.
Therefore from the results in tables 3.12 to 3.15 above and in appendix: A pg.
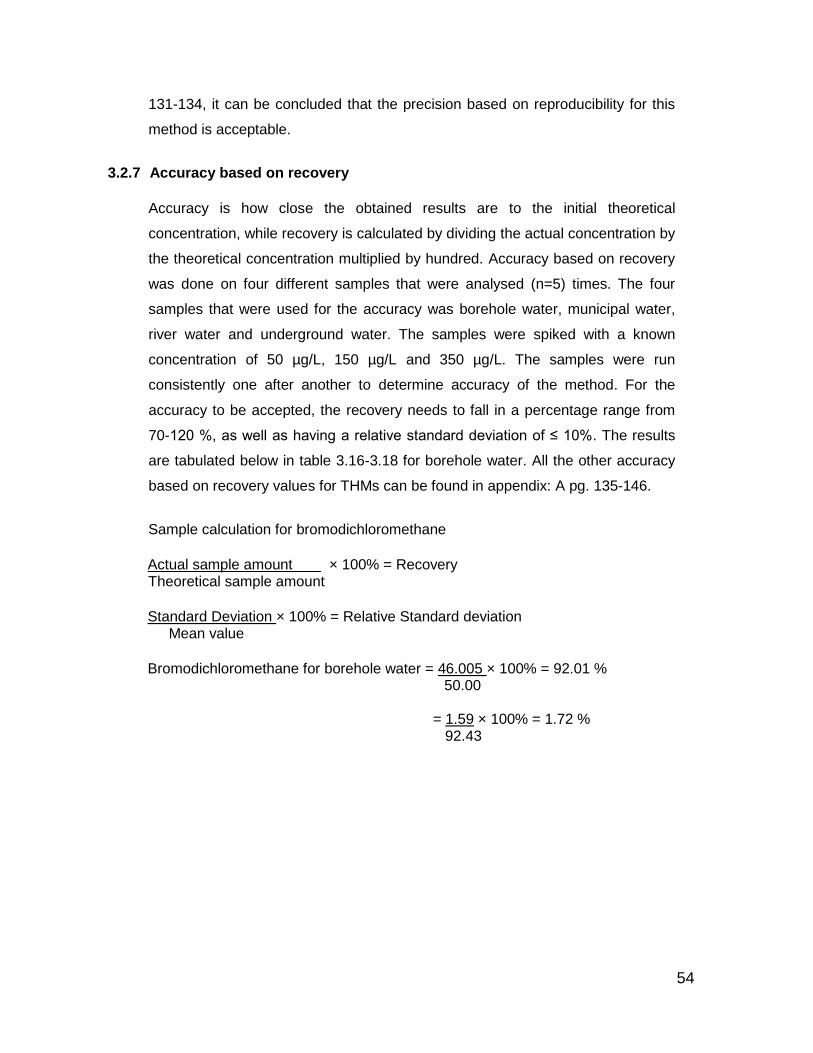
54
131-134, it can be concluded that the precision based on reproducibility for this
method is acceptable.
3.2.7 Accuracy based on recovery
Accuracy is how close the obtained results are to the initial theoretical
concentration, while recovery is calculated by dividing the actual concentration by
the theoretical concentration multiplied by hundred. Accuracy based on recovery
was done on four different samples that were analysed (n=5) times. The four
samples that were used for the accuracy was borehole water, municipal water,
river water and underground water. The samples were spiked with a known
concentration of 50 µg/L, 150 µg/L and 350 µg/L. The samples were run
consistently one after another to determine accuracy of the method. For the
accuracy to be accepted, the recovery needs to fall in a percentage range from
70-120 %, as well as having a relative standard deviation of ≤ 10%. The results
are tabulated below in table 3.16-3.18 for borehole water. All the other accuracy
based on recovery values for THMs can be found in appendix: A pg. 135-146.
Sample calculation for bromodichloromethane
Actual sample amount × 100% = Recovery Theoretical sample amount
Standard Deviation × 100% = Relative Standard deviation Mean value
Bromodichloromethane for borehole water = 46.005 × 100% = 92.01 %
50.00 = 1.59 × 100% = 1.72 % 92.43
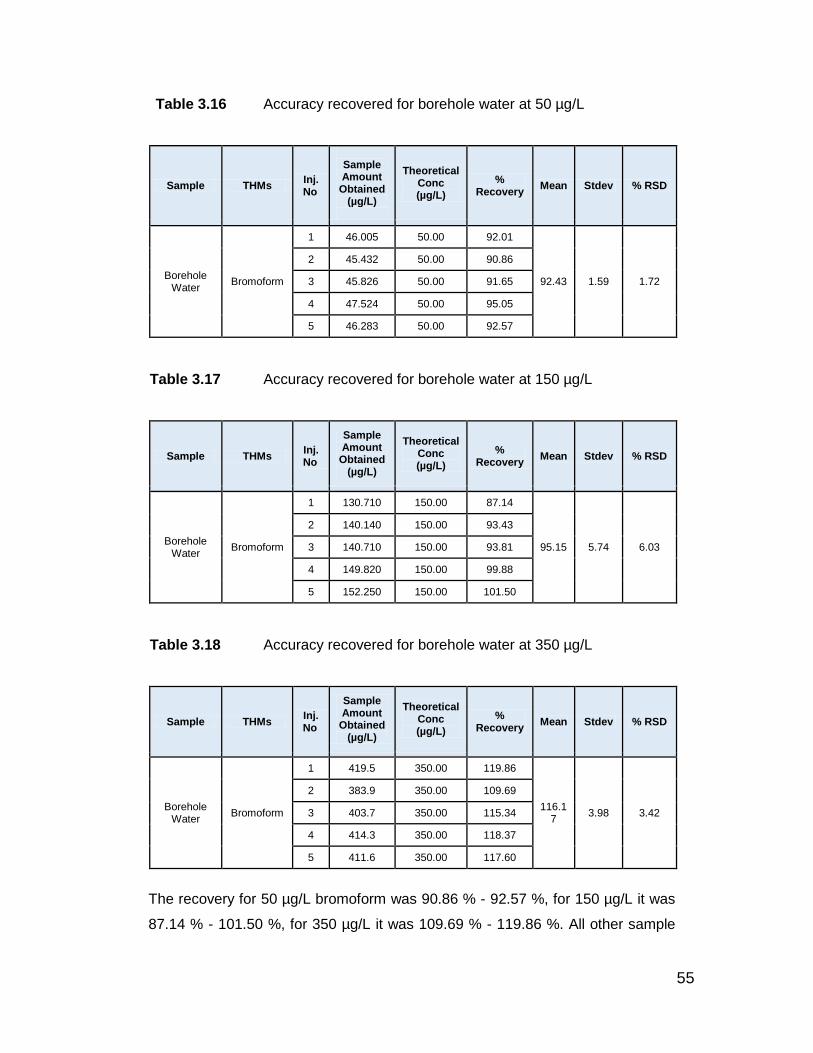
55
Table 3.16 Accuracy recovered for borehole water at 50 µg/L
Sample THMs Inj.
No
Sample Amount
Obtained (µg/L)
Theoretical Conc (µg/L)
% Recovery
Mean Stdev % RSD
Borehole Water
Bromoform
1 46.005 50.00 92.01
92.43 1.59 1.72
2 45.432 50.00 90.86
3 45.826 50.00 91.65
4 47.524 50.00 95.05
5 46.283 50.00 92.57
Table 3.17 Accuracy recovered for borehole water at 150 µg/L
Sample THMs Inj.
No
Sample Amount
Obtained (µg/L)
Theoretical Conc (µg/L)
% Recovery
Mean Stdev % RSD
Borehole Water
Bromoform
1 130.710 150.00 87.14
95.15 5.74 6.03
2 140.140 150.00 93.43
3 140.710 150.00 93.81
4 149.820 150.00 99.88
5 152.250 150.00 101.50
Table 3.18 Accuracy recovered for borehole water at 350 µg/L
Sample THMs Inj.
No
Sample Amount
Obtained (µg/L)
Theoretical Conc (µg/L)
% Recovery
Mean Stdev % RSD
Borehole Water
Bromoform
1 419.5 350.00 119.86
116.17
3.98 3.42
2 383.9 350.00 109.69
3 403.7 350.00 115.34
4 414.3 350.00 118.37
5 411.6 350.00 117.60
The recovery for 50 µg/L bromoform was 90.86 % - 92.57 %, for 150 µg/L it was
87.14 % - 101.50 %, for 350 µg/L it was 109.69 % - 119.86 %. All other sample
56
matrices for municipal water, underground water and river water all gave
acceptable recoveries that were within 70 – 120 % recovery range, for 50 µg/L,
150 µg/L and 350 µg/L as in appendix A page: 31-42. This therefore concludes
that there was an acceptable accuracy within the sample matrices of interest for
recovery. The relative standard deviation (RSD) for borehole water was
calculated for each trihalomethanes based on the recovery, and was found to be
1.72 % for 50 µg/L, 6.03 % for 150 µg/L and 3.42 % for 350 µg/L. All other
sample matrices for municipal water, underground water and river water was
found to have RSD less than the ≤ 10% limit for RSD as in appendix A pg. 135-
146.
It must be noted that the borehole water and underground water for 150 µg/L,
showed consistently high RSD values for all four trihalomethanes. These values
were reported as followed, for borehole and underground water in the range from
4.21 % - 6.23 %. These values are still less than the acceptable ≤ 10% RSD limit.
This therefore concludes that the method is accurate in quantifying the
trihalomethanes of interest within the sample matrices of the method.
3.2.8 Selectivity based on recovery
A method can be selective if it responds to a change in a specific analyte, while
obtaining a selective recovery for that specific analyte. For selectivity, three
different samples were analysed for matrix effect and recovery making use of the
standard additional method. Each of the three samples was analysed (n=3) times
as unspiked samples, as well as a spiked sample at 2 different concentrations.
These concentrations were 50 µg/L for river and underground water, while 80
µg/L for municipal water. The selectivity test was conducted in order to analyze
the ability of the method to respond to a particular analyte of interest. For the
selectivity to be accepted, the recovery needs to fall in a percentage range from
70-120 %, as well as having proof on the chromatograms that the samples
respond to a particular analyte. The results are tabulated below in table 3.19 for
chloride standard. All the other selectivity based on recovery values for THMs
can be found in appendix: A pg. 147-148. All the other selectivity based on
recovery chromatograms for THMs can be found in appendix: B pg. 177-182.
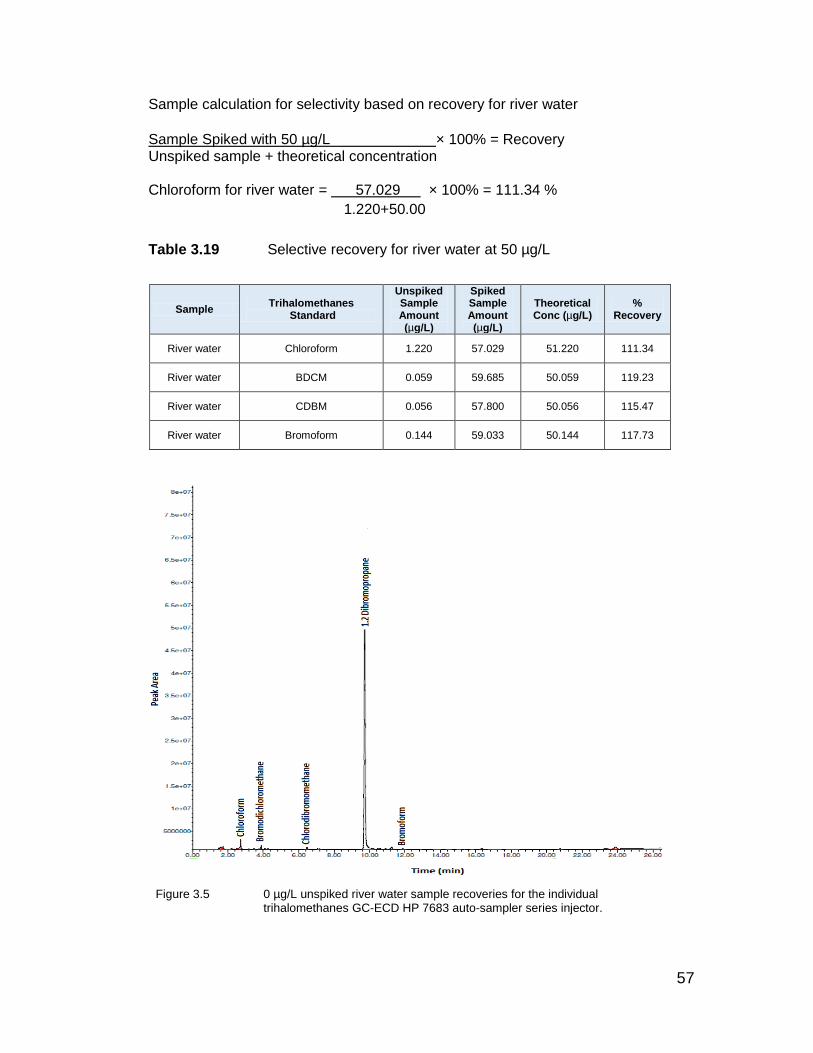
57
Sample calculation for selectivity based on recovery for river water
Sample Spiked with 50 µg/L × 100% = Recovery Unspiked sample + theoretical concentration Chloroform for river water = 57.029 × 100% = 111.34 %
1.220+50.00
Table 3.19 Selective recovery for river water at 50 µg/L
Sample Trihalomethanes
Standard
Unspiked Sample Amount (µg/L)
Spiked Sample Amount (µg/L)
Theoretical Conc (µg/L)
% Recovery
River water Chloroform 1.220 57.029 51.220 111.34
River water BDCM 0.059 59.685 50.059 119.23
River water CDBM 0.056 57.800 50.056 115.47
River water Bromoform 0.144 59.033 50.144 117.73
Figure 3.5 0 µg/L unspiked river water sample recoveries for the individual trihalomethanes GC-ECD HP 7683 auto-sampler series injector.
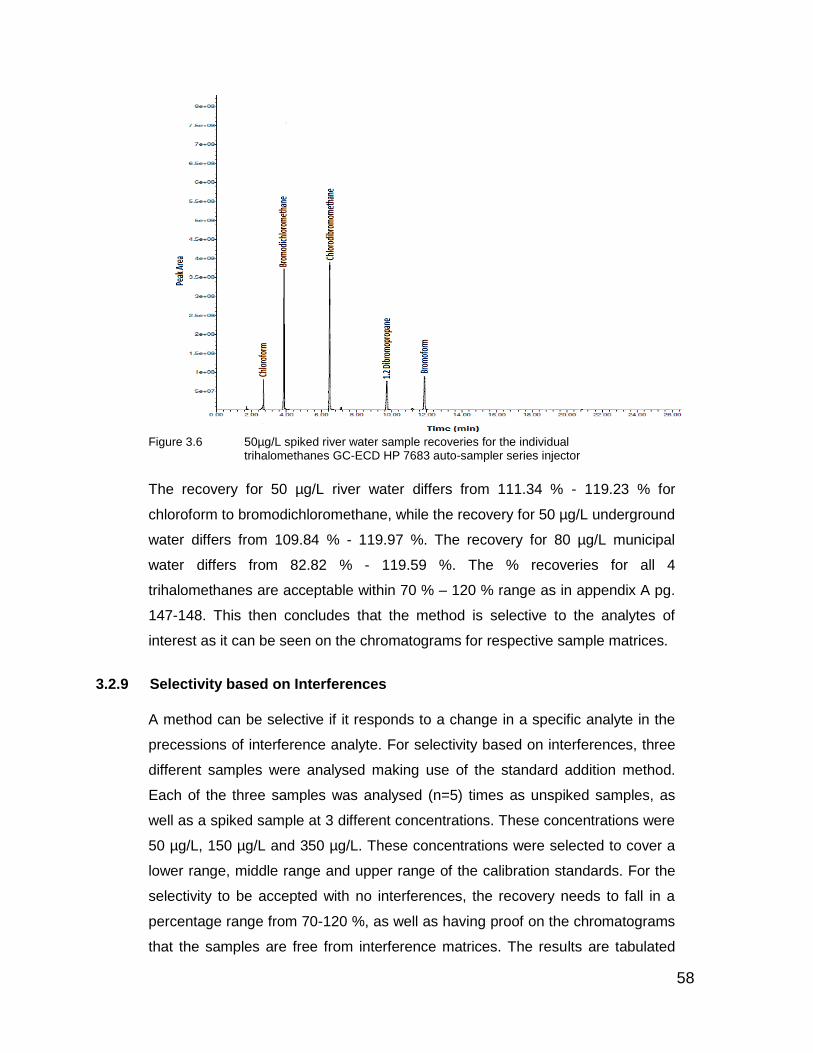
58
Figure 3.6 50µg/L spiked river water sample recoveries for the individual
trihalomethanes GC-ECD HP 7683 auto-sampler series injector
The recovery for 50 µg/L river water differs from 111.34 % - 119.23 % for
chloroform to bromodichloromethane, while the recovery for 50 µg/L underground
water differs from 109.84 % - 119.97 %. The recovery for 80 µg/L municipal
water differs from 82.82 % - 119.59 %. The % recoveries for all 4
trihalomethanes are acceptable within 70 % – 120 % range as in appendix A pg.
147-148. This then concludes that the method is selective to the analytes of
interest as it can be seen on the chromatograms for respective sample matrices.
3.2.9 Selectivity based on Interferences
A method can be selective if it responds to a change in a specific analyte in the
precessions of interference analyte. For selectivity based on interferences, three
different samples were analysed making use of the standard addition method.
Each of the three samples was analysed (n=5) times as unspiked samples, as
well as a spiked sample at 3 different concentrations. These concentrations were
50 µg/L, 150 µg/L and 350 µg/L. These concentrations were selected to cover a
lower range, middle range and upper range of the calibration standards. For the
selectivity to be accepted with no interferences, the recovery needs to fall in a
percentage range from 70-120 %, as well as having proof on the chromatograms
that the samples are free from interference matrices. The results are tabulated
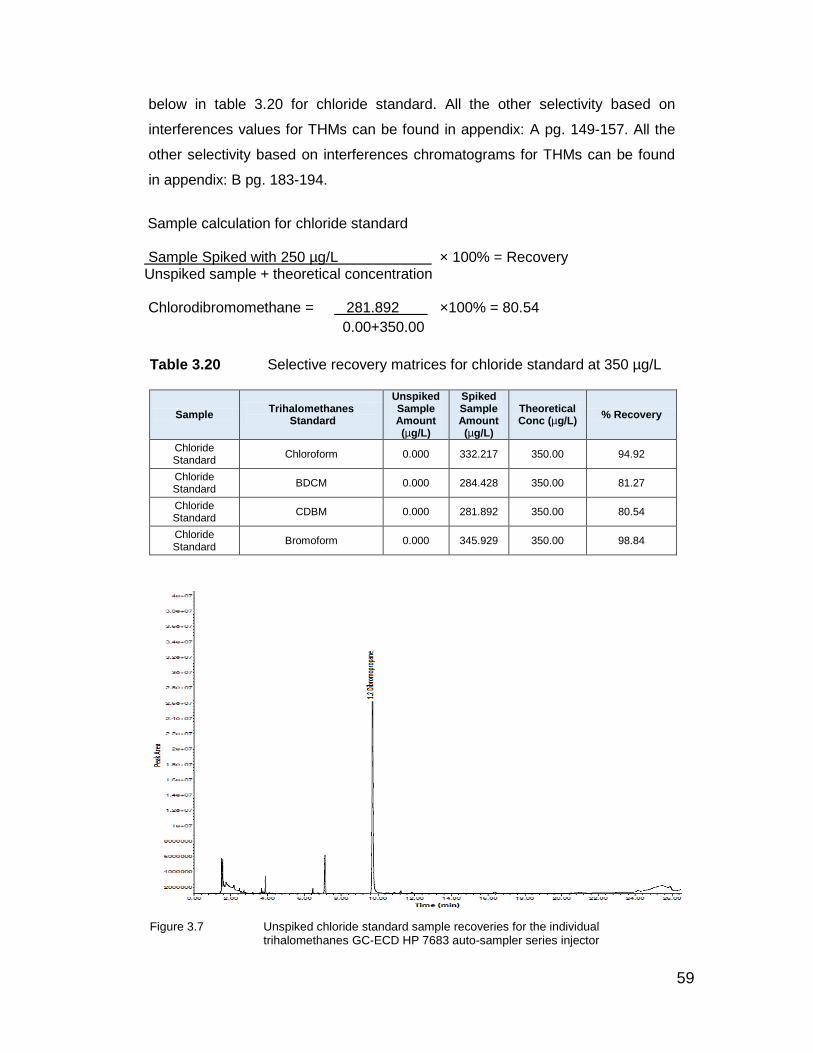
59
below in table 3.20 for chloride standard. All the other selectivity based on
interferences values for THMs can be found in appendix: A pg. 149-157. All the
other selectivity based on interferences chromatograms for THMs can be found
in appendix: B pg. 183-194.
Sample calculation for chloride standard Sample Spiked with 250 µg/L × 100% = Recovery Unspiked sample + theoretical concentration Chlorodibromomethane = 281.892 ×100% = 80.54
0.00+350.00
Table 3.20 Selective recovery matrices for chloride standard at 350 µg/L
Sample Trihalomethanes
Standard
Unspiked Sample Amount (µg/L)
Spiked Sample Amount (µg/L)
Theoretical Conc (µg/L)
% Recovery
Chloride Standard
Chloroform 0.000 332.217 350.00 94.92
Chloride Standard
BDCM 0.000 284.428 350.00 81.27
Chloride Standard
CDBM 0.000 281.892 350.00 80.54
Chloride Standard
Bromoform 0.000 345.929 350.00 98.84
Figure 3.7 Unspiked chloride standard sample recoveries for the individual trihalomethanes GC-ECD HP 7683 auto-sampler series injector

60
Figure 3.8 350µg/L spiked Chloride Standard sample recoveries for the individual trihalomethanes from GC-ECD HP 7683 auto-sampler series injector.
The recovery for 350 µg/L trihalomethanes differs from 80.54 % - 98.84 % for
chlorodibromomethane to bromoform. All other sample matrixes for fluoride
standard and SEPP-133 (custom) heavy metal standard gave acceptable
recoveries that were within 70 – 120 % recovery range, for 50 µg/L, 150 µg/L and
350 µg/L as in appendix: A pg. 149-157. All the other selectivity based on
recovery chromatograms for THMs can be found in appendix: B pg. 177-182.
This then concludes that the method is selective to the analytes of interest in the
presence of any possible interference, as it can be seen on the chromatograms
for respective sample matrices.
3.2.10 Inter Laboratory Comparison
Inter laboratory comparison consists in testing and comparing the results of the
same sample by different laboratories. Microchem Laboratory Services outsource
its trihalomethanes samples to SANAS Accredited A.L Abbott and Association
Laboratory Service. A.L Abbott and Association is a testing laboratory that
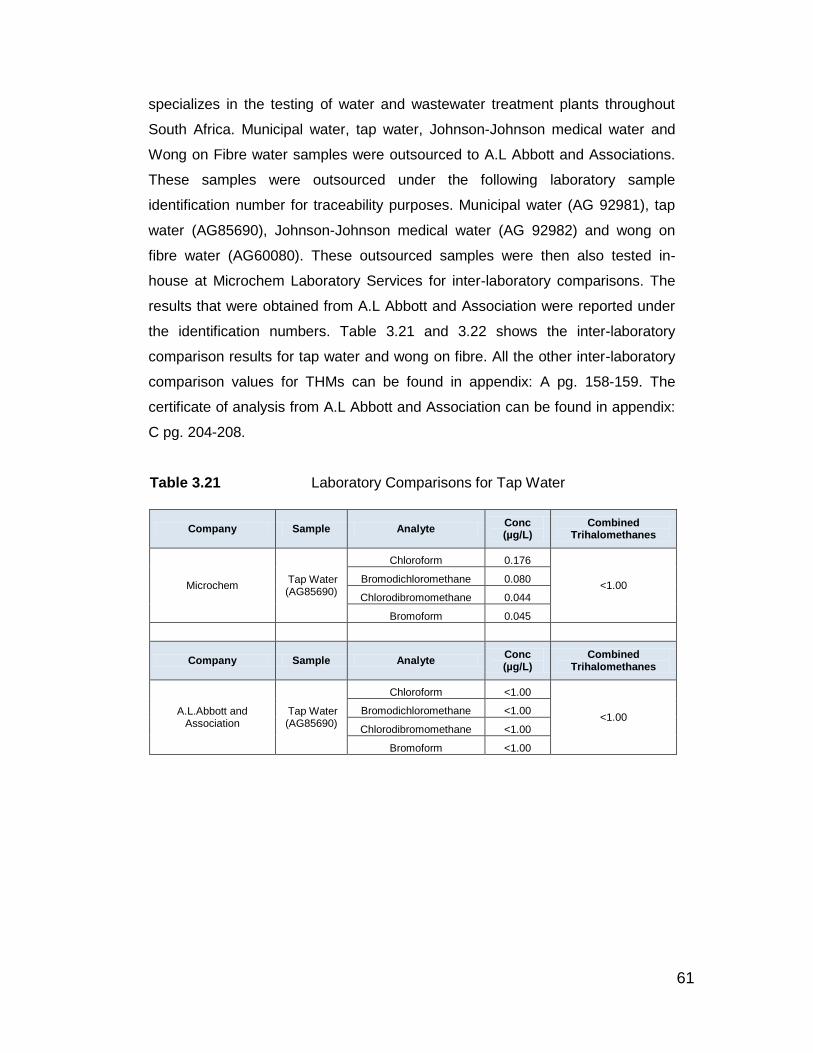
61
specializes in the testing of water and wastewater treatment plants throughout
South Africa. Municipal water, tap water, Johnson-Johnson medical water and
Wong on Fibre water samples were outsourced to A.L Abbott and Associations.
These samples were outsourced under the following laboratory sample
identification number for traceability purposes. Municipal water (AG 92981), tap
water (AG85690), Johnson-Johnson medical water (AG 92982) and wong on
fibre water (AG60080). These outsourced samples were then also tested in-
house at Microchem Laboratory Services for inter-laboratory comparisons. The
results that were obtained from A.L Abbott and Association were reported under
the identification numbers. Table 3.21 and 3.22 shows the inter-laboratory
comparison results for tap water and wong on fibre. All the other inter-laboratory
comparison values for THMs can be found in appendix: A pg. 158-159. The
certificate of analysis from A.L Abbott and Association can be found in appendix:
C pg. 204-208.
Table 3.21 Laboratory Comparisons for Tap Water
Company Sample Analyte Conc (µg/L)
Combined Trihalomethanes
Microchem Tap Water (AG85690)
Chloroform 0.176
<1.00 Bromodichloromethane 0.080
Chlorodibromomethane 0.044
Bromoform 0.045
Company Sample Analyte Conc (µg/L)
Combined Trihalomethanes
A.L.Abbott and Association
Tap Water (AG85690)
Chloroform <1.00
<1.00 Bromodichloromethane <1.00
Chlorodibromomethane <1.00
Bromoform <1.00
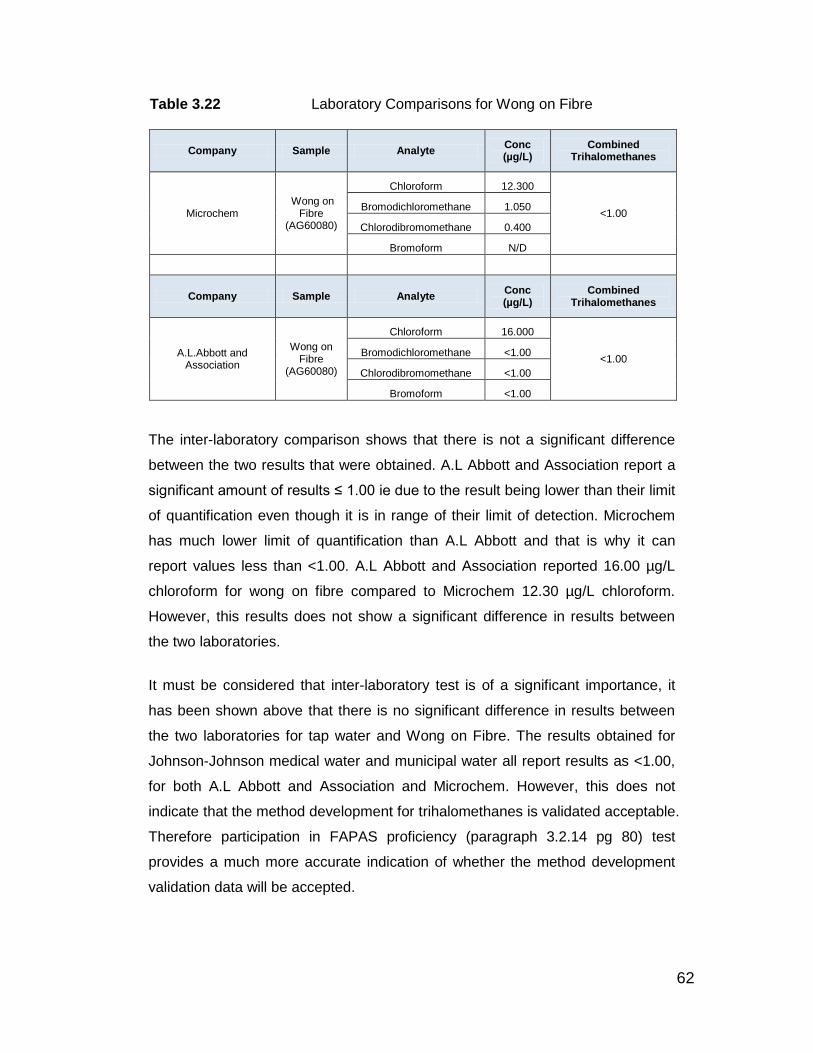
62
Table 3.22 Laboratory Comparisons for Wong on Fibre
Company Sample Analyte Conc (µg/L)
Combined Trihalomethanes
Microchem Wong on
Fibre (AG60080)
Chloroform 12.300
<1.00 Bromodichloromethane 1.050
Chlorodibromomethane 0.400
Bromoform N/D
Company Sample Analyte Conc (µg/L)
Combined Trihalomethanes
A.L.Abbott and Association
Wong on Fibre
(AG60080)
Chloroform 16.000
<1.00 Bromodichloromethane <1.00
Chlorodibromomethane <1.00
Bromoform <1.00
The inter-laboratory comparison shows that there is not a significant difference
between the two results that were obtained. A.L Abbott and Association report a
significant amount of results ≤ 1.00 ie due to the result being lower than their limit
of quantification even though it is in range of their limit of detection. Microchem
has much lower limit of quantification than A.L Abbott and that is why it can
report values less than <1.00. A.L Abbott and Association reported 16.00 µg/L
chloroform for wong on fibre compared to Microchem 12.30 µg/L chloroform.
However, this results does not show a significant difference in results between
the two laboratories.
It must be considered that inter-laboratory test is of a significant importance, it
has been shown above that there is no significant difference in results between
the two laboratories for tap water and Wong on Fibre. The results obtained for
Johnson-Johnson medical water and municipal water all report results as <1.00,
for both A.L Abbott and Association and Microchem. However, this does not
indicate that the method development for trihalomethanes is validated acceptable.
Therefore participation in FAPAS proficiency (paragraph 3.2.14 pg 80) test
provides a much more accurate indication of whether the method development
validation data will be accepted.
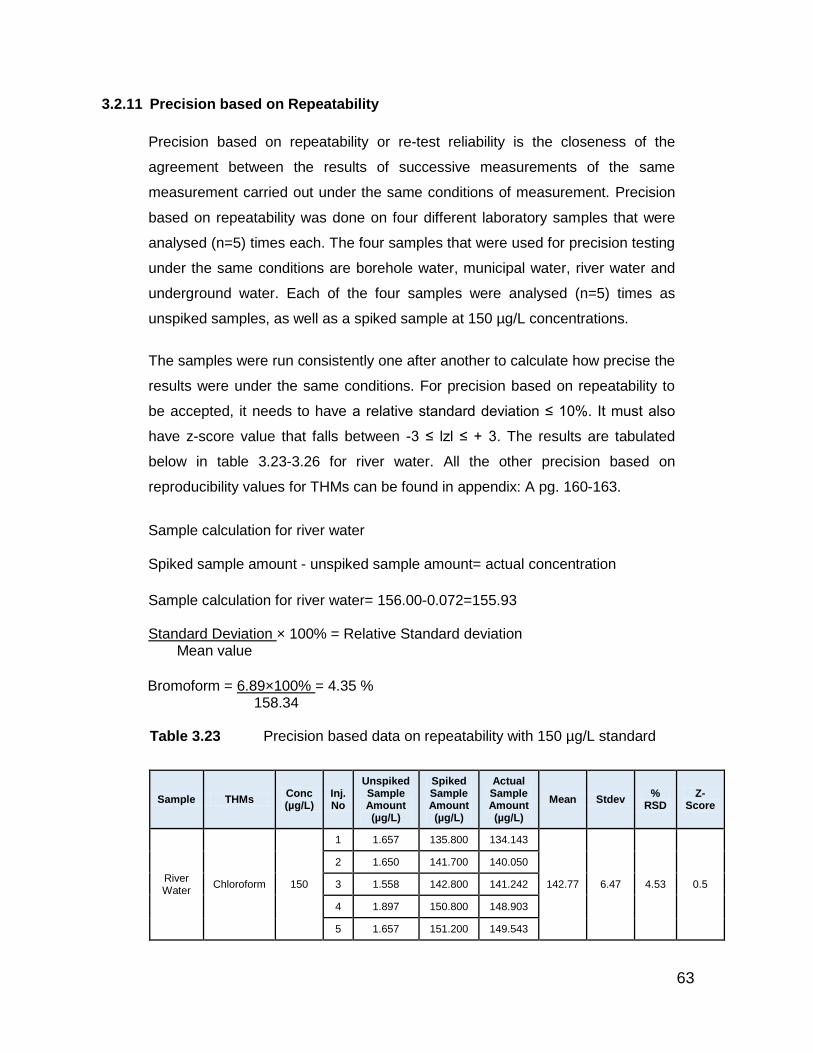
63
3.2.11 Precision based on Repeatability
Precision based on repeatability or re-test reliability is the closeness of the
agreement between the results of successive measurements of the same
measurement carried out under the same conditions of measurement. Precision
based on repeatability was done on four different laboratory samples that were
analysed (n=5) times each. The four samples that were used for precision testing
under the same conditions are borehole water, municipal water, river water and
underground water. Each of the four samples were analysed (n=5) times as
unspiked samples, as well as a spiked sample at 150 µg/L concentrations.
The samples were run consistently one after another to calculate how precise the
results were under the same conditions. For precision based on repeatability to
be accepted, it needs to have a relative standard deviation ≤ 10%. It must also
have z-score value that falls between -3 ≤ lzl ≤ + 3. The results are tabulated
below in table 3.23-3.26 for river water. All the other precision based on
reproducibility values for THMs can be found in appendix: A pg. 160-163.
Sample calculation for river water Spiked sample amount - unspiked sample amount= actual concentration
Sample calculation for river water= 156.00-0.072=155.93
Standard Deviation × 100% = Relative Standard deviation Mean value
Bromoform = 6.89×100% = 4.35 % 158.34
Table 3.23 Precision based data on repeatability with 150 µg/L standard
Sample THMs Conc (µg/L)
Inj. No
Unspiked Sample Amount (µg/L)
Spiked Sample Amount (µg/L)
Actual Sample Amount (µg/L)
Mean Stdev %
RSD Z-
Score
River Water
Chloroform 150
1 1.657 135.800 134.143
142.77
6.47
4.53 0.5
2 1.650 141.700 140.050
3 1.558 142.800 141.242
4 1.897 150.800 148.903
5 1.657 151.200 149.543
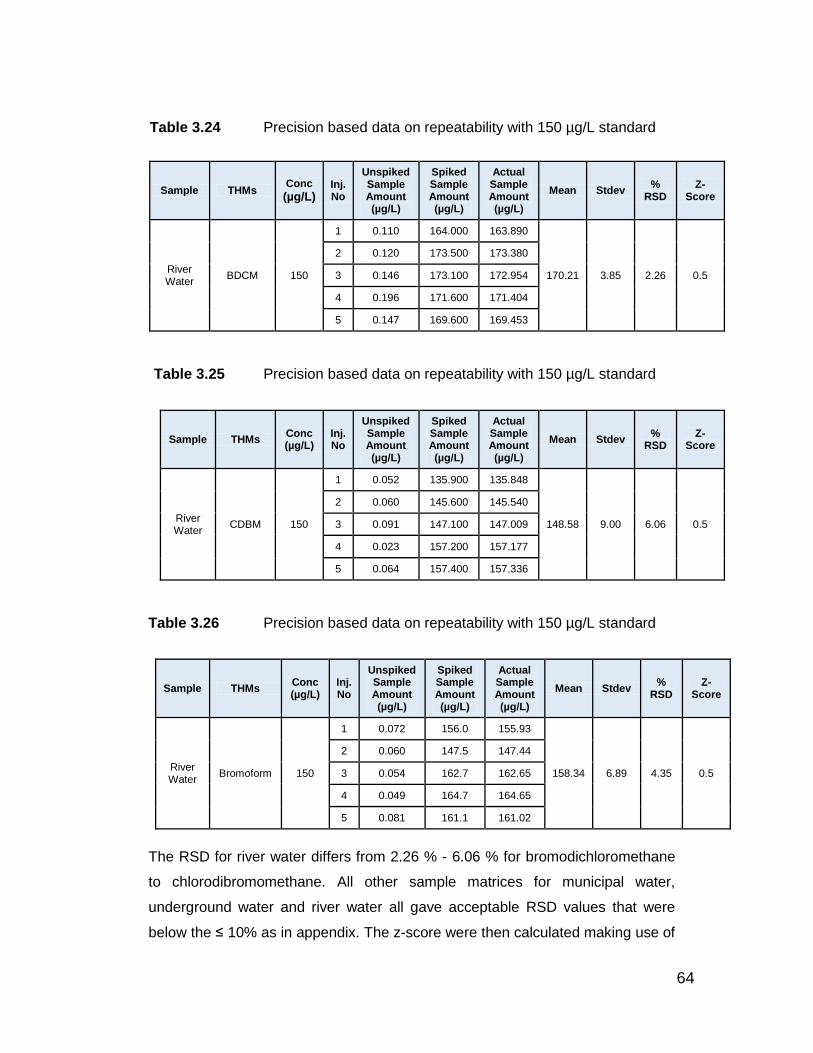
64
Table 3.24 Precision based data on repeatability with 150 µg/L standard
Sample THMs Conc
(µg/L) Inj. No
Unspiked Sample Amount (µg/L)
Spiked Sample Amount (µg/L)
Actual Sample Amount (µg/L)
Mean Stdev %
RSD Z-
Score
River Water
BDCM 150
1 0.110 164.000 163.890
170.21
3.85
2.26
0.5
2 0.120 173.500 173.380
3 0.146 173.100 172.954
4 0.196 171.600 171.404
5 0.147 169.600 169.453
Table 3.25 Precision based data on repeatability with 150 µg/L standard
Sample THMs Conc (µg/L)
Inj. No
Unspiked Sample Amount (µg/L)
Spiked Sample Amount (µg/L)
Actual Sample Amount (µg/L)
Mean Stdev %
RSD Z-
Score
River Water
CDBM 150
1 0.052 135.900 135.848
148.58
9.00
6.06
0.5
2 0.060 145.600 145.540
3 0.091 147.100 147.009
4 0.023 157.200 157.177
5 0.064 157.400 157.336
Table 3.26 Precision based data on repeatability with 150 µg/L standard
Sample THMs Conc (µg/L)
Inj. No
Unspiked Sample Amount (µg/L)
Spiked Sample Amount (µg/L)
Actual Sample Amount (µg/L)
Mean Stdev %
RSD Z-
Score
River Water
Bromoform 150
1 0.072 156.0 155.93
158.34 6.89 4.35 0.5
2 0.060 147.5 147.44
3 0.054 162.7 162.65
4 0.049 164.7 164.65
5 0.081 161.1 161.02
The RSD for river water differs from 2.26 % - 6.06 % for bromodichloromethane
to chlorodibromomethane. All other sample matrices for municipal water,
underground water and river water all gave acceptable RSD values that were
below the ≤ 10% as in appendix. The z-score were then calculated making use of
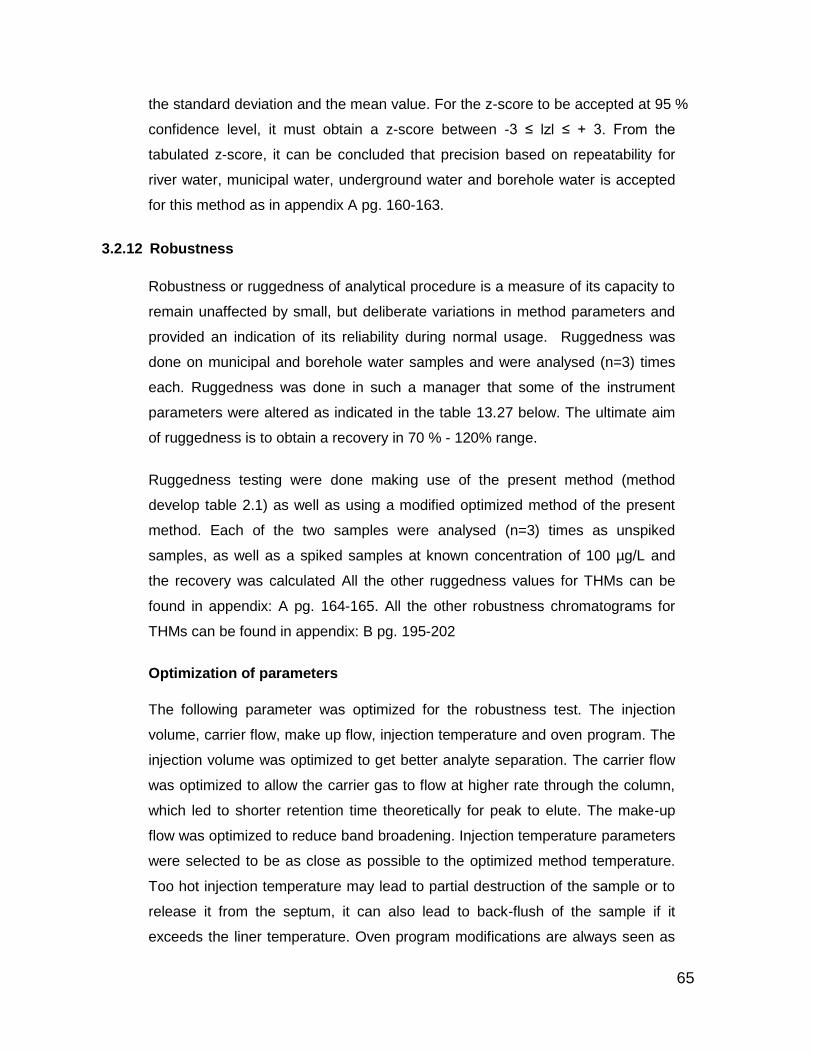
65
the standard deviation and the mean value. For the z-score to be accepted at 95 %
confidence level, it must obtain a z-score between -3 ≤ lzl ≤ + 3. From the
tabulated z-score, it can be concluded that precision based on repeatability for
river water, municipal water, underground water and borehole water is accepted
for this method as in appendix A pg. 160-163.
3.2.12 Robustness
Robustness or ruggedness of analytical procedure is a measure of its capacity to
remain unaffected by small, but deliberate variations in method parameters and
provided an indication of its reliability during normal usage. Ruggedness was
done on municipal and borehole water samples and were analysed (n=3) times
each. Ruggedness was done in such a manager that some of the instrument
parameters were altered as indicated in the table 13.27 below. The ultimate aim
of ruggedness is to obtain a recovery in 70 % - 120% range.
Ruggedness testing were done making use of the present method (method
develop table 2.1) as well as using a modified optimized method of the present
method. Each of the two samples were analysed (n=3) times as unspiked
samples, as well as a spiked samples at known concentration of 100 µg/L and
the recovery was calculated All the other ruggedness values for THMs can be
found in appendix: A pg. 164-165. All the other robustness chromatograms for
THMs can be found in appendix: B pg. 195-202
Optimization of parameters
The following parameter was optimized for the robustness test. The injection
volume, carrier flow, make up flow, injection temperature and oven program. The
injection volume was optimized to get better analyte separation. The carrier flow
was optimized to allow the carrier gas to flow at higher rate through the column,
which led to shorter retention time theoretically for peak to elute. The make-up
flow was optimized to reduce band broadening. Injection temperature parameters
were selected to be as close as possible to the optimized method temperature.
Too hot injection temperature may lead to partial destruction of the sample or to
release it from the septum, it can also lead to back-flush of the sample if it
exceeds the liner temperature. Oven program modifications are always seen as
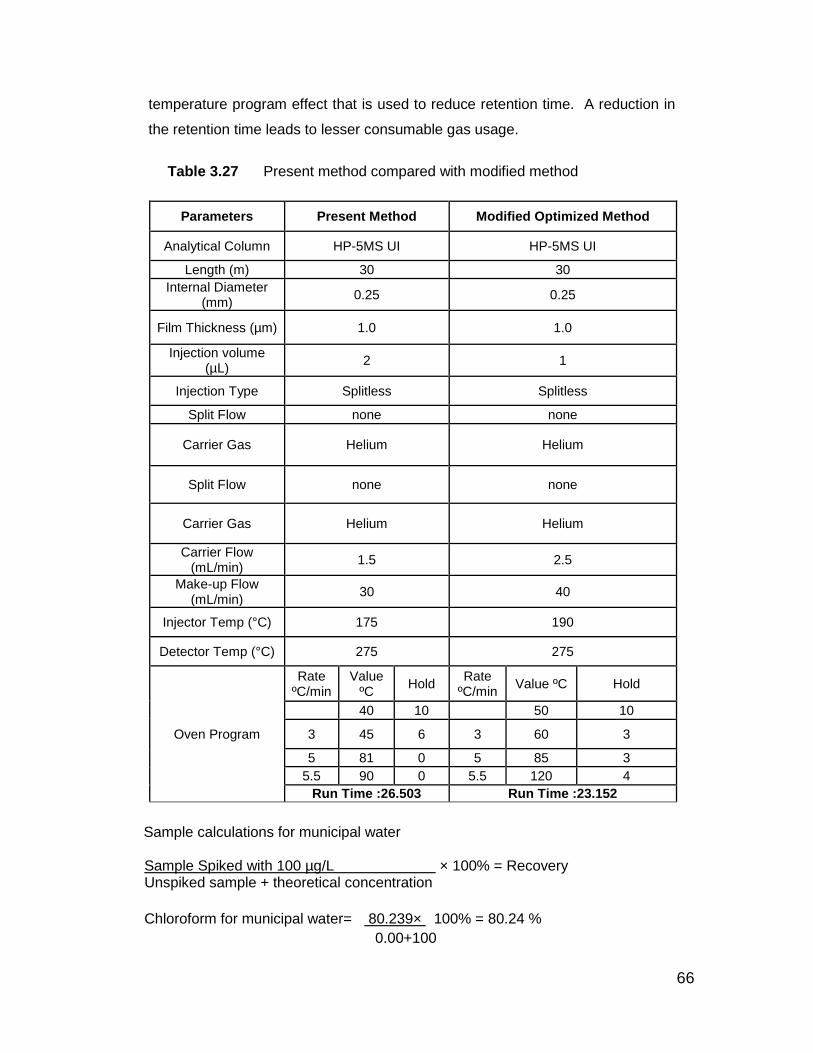
66
temperature program effect that is used to reduce retention time. A reduction in
the retention time leads to lesser consumable gas usage.
Table 3.27 Present method compared with modified method
Parameters Present Method Modified Optimized Method
Analytical Column HP-5MS UI HP-5MS UI
Length (m) 30 30
Internal Diameter (mm)
0.25 0.25
Film Thickness (µm) 1.0 1.0
Injection volume (µL)
2 1
Injection Type Splitless Splitless
Split Flow none none
Carrier Gas Helium Helium
Split Flow none none
Carrier Gas Helium Helium
Carrier Flow (mL/min)
1.5 2.5
Make-up Flow (mL/min)
30 40
Injector Temp (°C) 175 190
Detector Temp (°C) 275 275
Rate
ºC/min Value
ºC Hold
Rate ºC/min
Value ºC Hold
40 10 50 10
Oven Program 3 45 6 3 60 3
5 81 0 5 85 3
5.5 90 0 5.5 120 4
Run Time :26.503 Run Time :23.152
Sample calculations for municipal water Sample Spiked with 100 µg/L × 100% = Recovery Unspiked sample + theoretical concentration
Chloroform for municipal water= 80.239× 100% = 80.24 %
0.00+100
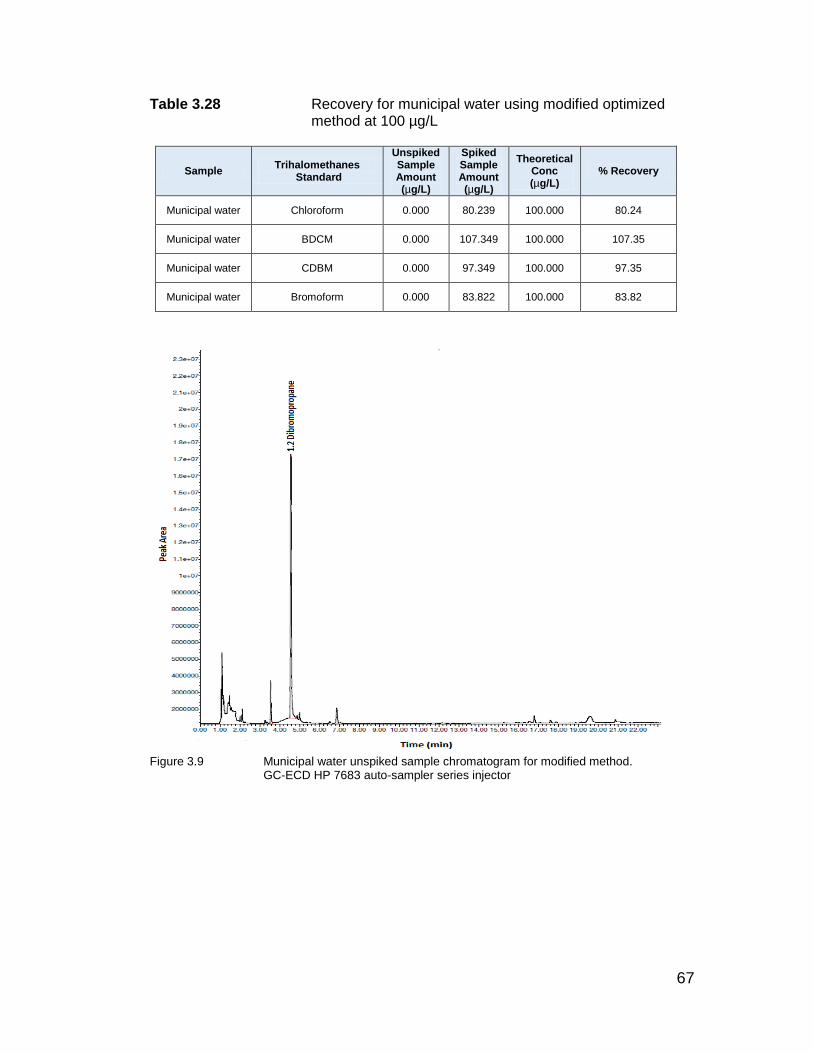
67
Table 3.28 Recovery for municipal water using modified optimized method at 100 µg/L
Sample Trihalomethanes
Standard
Unspiked Sample Amount (µg/L)
Spiked Sample Amount (µg/L)
Theoretical Conc (µg/L)
% Recovery
Municipal water Chloroform 0.000 80.239 100.000 80.24
Municipal water BDCM 0.000 107.349 100.000 107.35
Municipal water CDBM 0.000 97.349 100.000 97.35
Municipal water Bromoform 0.000 83.822 100.000 83.82
Figure 3.9 Municipal water unspiked sample chromatogram for modified method.
GC-ECD HP 7683 auto-sampler series injector
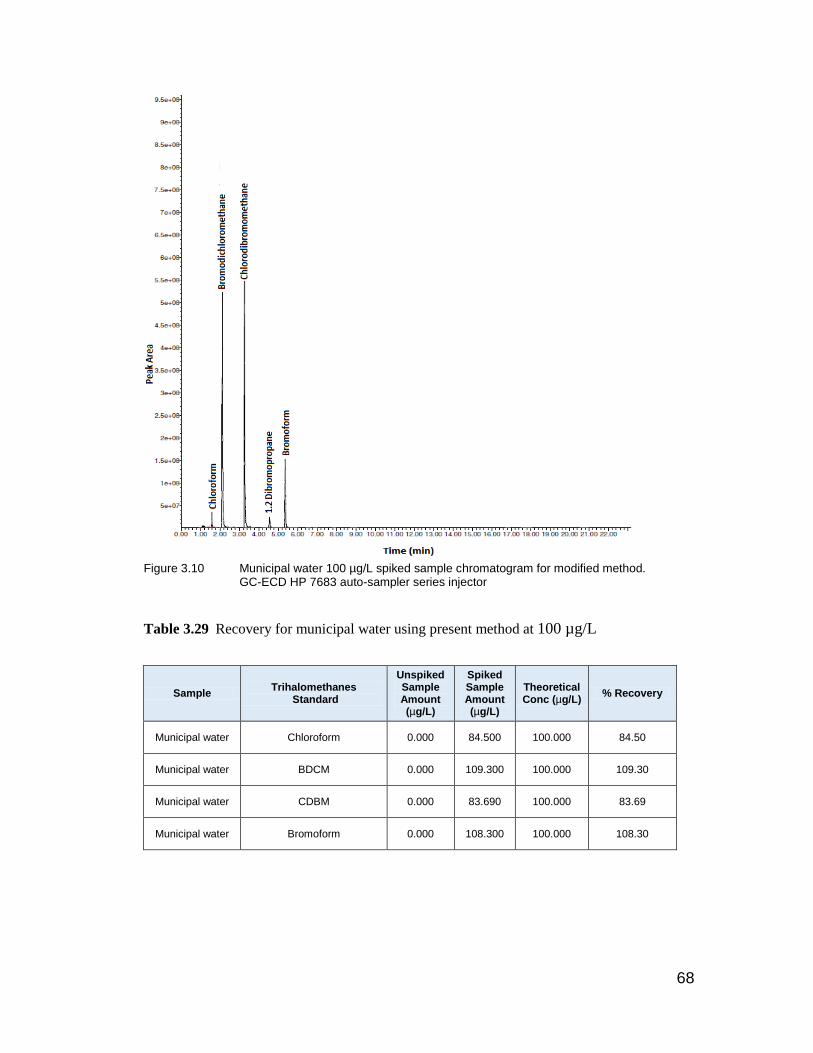
68
Figure 3.10 Municipal water 100 µg/L spiked sample chromatogram for modified method.
GC-ECD HP 7683 auto-sampler series injector
Table 3.29 Recovery for municipal water using present method at 100 µg/L
Sample Trihalomethanes
Standard
Unspiked Sample Amount (µg/L)
Spiked Sample Amount (µg/L)
Theoretical Conc (µg/L)
% Recovery
Municipal water Chloroform 0.000 84.500 100.000 84.50
Municipal water BDCM 0.000 109.300 100.000 109.30
Municipal water CDBM 0.000 83.690 100.000 83.69
Municipal water Bromoform 0.000 108.300 100.000 108.30

69
Figure 3.11 Municipal water Unspiked sample chromatogram for present method. GC-ECD HP 7683 auto-sampler series injector
Figure 3.12 Municipal Water 100 µg/L spiked sample chromatogram for present method GC-ECD HP 7683 auto-sampler series injector
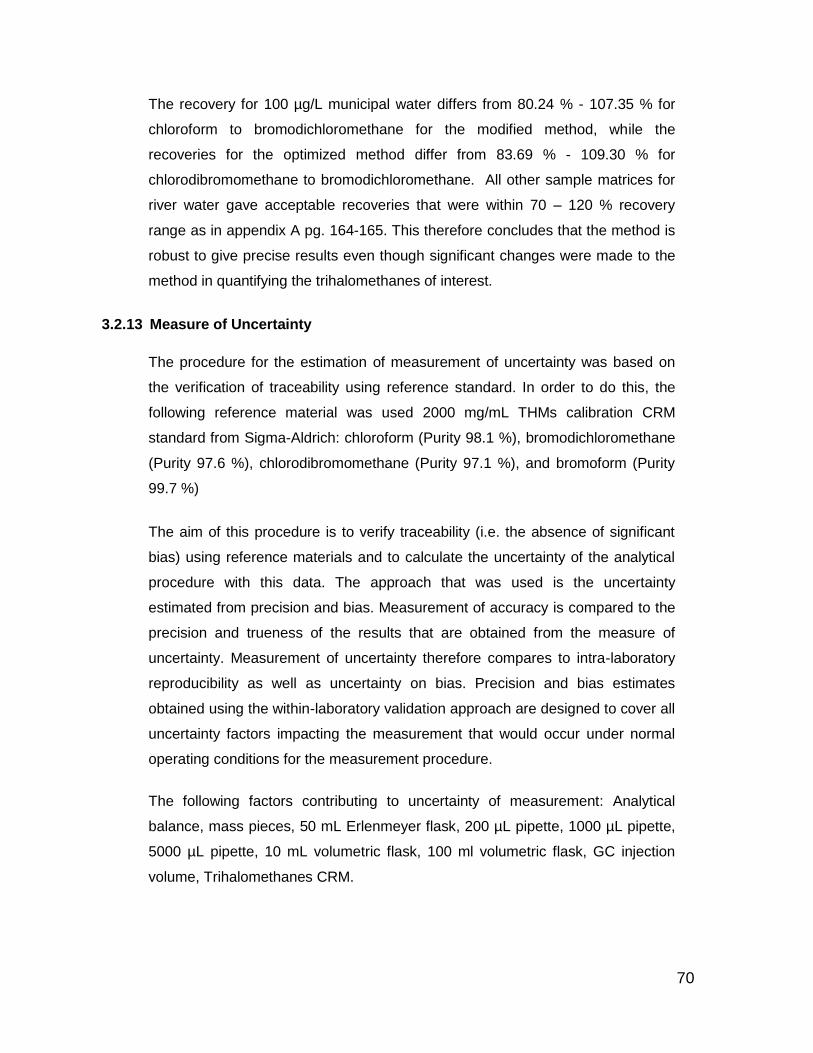
70
The recovery for 100 µg/L municipal water differs from 80.24 % - 107.35 % for
chloroform to bromodichloromethane for the modified method, while the
recoveries for the optimized method differ from 83.69 % - 109.30 % for
chlorodibromomethane to bromodichloromethane. All other sample matrices for
river water gave acceptable recoveries that were within 70 – 120 % recovery
range as in appendix A pg. 164-165. This therefore concludes that the method is
robust to give precise results even though significant changes were made to the
method in quantifying the trihalomethanes of interest.
3.2.13 Measure of Uncertainty
The procedure for the estimation of measurement of uncertainty was based on
the verification of traceability using reference standard. In order to do this, the
following reference material was used 2000 mg/mL THMs calibration CRM
standard from Sigma-Aldrich: chloroform (Purity 98.1 %), bromodichloromethane
(Purity 97.6 %), chlorodibromomethane (Purity 97.1 %), and bromoform (Purity
99.7 %)
The aim of this procedure is to verify traceability (i.e. the absence of significant
bias) using reference materials and to calculate the uncertainty of the analytical
procedure with this data. The approach that was used is the uncertainty
estimated from precision and bias. Measurement of accuracy is compared to the
precision and trueness of the results that are obtained from the measure of
uncertainty. Measurement of uncertainty therefore compares to intra-laboratory
reproducibility as well as uncertainty on bias. Precision and bias estimates
obtained using the within-laboratory validation approach are designed to cover all
uncertainty factors impacting the measurement that would occur under normal
operating conditions for the measurement procedure.
The following factors contributing to uncertainty of measurement: Analytical
balance, mass pieces, 50 mL Erlenmeyer flask, 200 µL pipette, 1000 µL pipette,
5000 µL pipette, 10 mL volumetric flask, 100 ml volumetric flask, GC injection
volume, Trihalomethanes CRM.

71
Measurement uncertainty (standard measurement uncertainty, u) is estimated as
a root sum of squares of a standard deviation (s) that characterizes the precision
or imprecision of the measurement and an estimate (b) accounting for the
measurement bias.
𝑢 = √𝑠2 + 𝑏2
Within-laboratory reproducibility standard deviation (𝑆𝑅𝑊) was determined by
carrying out replicate analysis under intermediate precision conditions. Six
replicate analyses for trihalomethanes were performed to include all major and
minor uncertainty contributions.
b = √∆2 + 𝑢𝑟𝑒𝑓2 +
𝑠2
𝑛
Measurement bias (b) is eliminated to the greatest extent possible. The residual
bias that still remains consists of three different components. The first of these
components, delta ( ) represents the mean deviation of replicate
measurement results from the stated reference value. The second component
(𝑢𝑟𝑒𝑓) comprises the uncertainty estimate for the reference value while the third
term comprises the standard deviation and the number of measurements made.
The uncertainty of measurement for 120 µg/L trihalomethanes was determined
as explained below.
An in-house laboratory control of 120 µg/L trihalomethanes was prepared in six
duplicates. The mean value between the two duplicates was calculated and
reported as the average values at a designated % reference value. From the six
average values, the mean was calculated from them and reported as the Xmean
value. From the Xmean value, the standard deviation was calculated. The
uncertainty of reference at 95 % was obtained from the certificate of analysis for
2000 mg/mL THMs CRM. All the other measure of uncertainty values for THMs
can be found in appendix: A page: 166-173.
From this data the mean result (Xmean) is calculated as 117.29 µg/L.
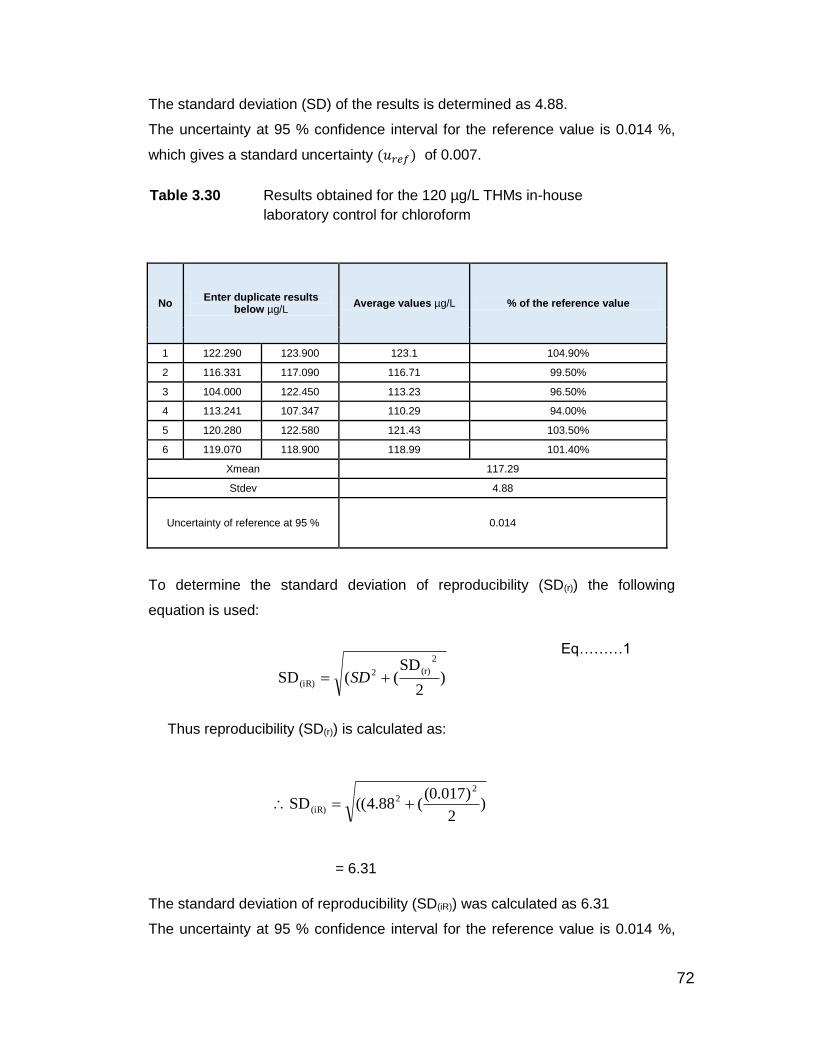
72
The standard deviation (SD) of the results is determined as 4.88.
The uncertainty at 95 % confidence interval for the reference value is 0.014 %,
which gives a standard uncertainty (𝑢𝑟𝑒𝑓) of 0.007.
Table 3.30 Results obtained for the 120 µg/L THMs in-house
laboratory control for chloroform
No Enter duplicate results
below µg/L Average values µg/L % of the reference value
1 122.290 123.900 123.1 104.90%
2 116.331 117.090 116.71 99.50%
3 104.000 122.450 113.23 96.50%
4 113.241 107.347 110.29 94.00%
5 120.280 122.580 121.43 103.50%
6 119.070 118.900 118.99 101.40%
Xmean 117.29
Stdev 4.88
Uncertainty of reference at 95 % 0.014
To determine the standard deviation of reproducibility (SD(r)) the following
equation is used:
Eq………1
Thus reproducibility (SD(r)) is calculated as:
= 6.31
The standard deviation of reproducibility (SD(iR)) was calculated as 6.31
The uncertainty at 95 % confidence interval for the reference value is 0.014 %,
)2
)(0.017(88.4((SD
22
(iR)
)2
SD((SD
2
(r)2
(iR) SD
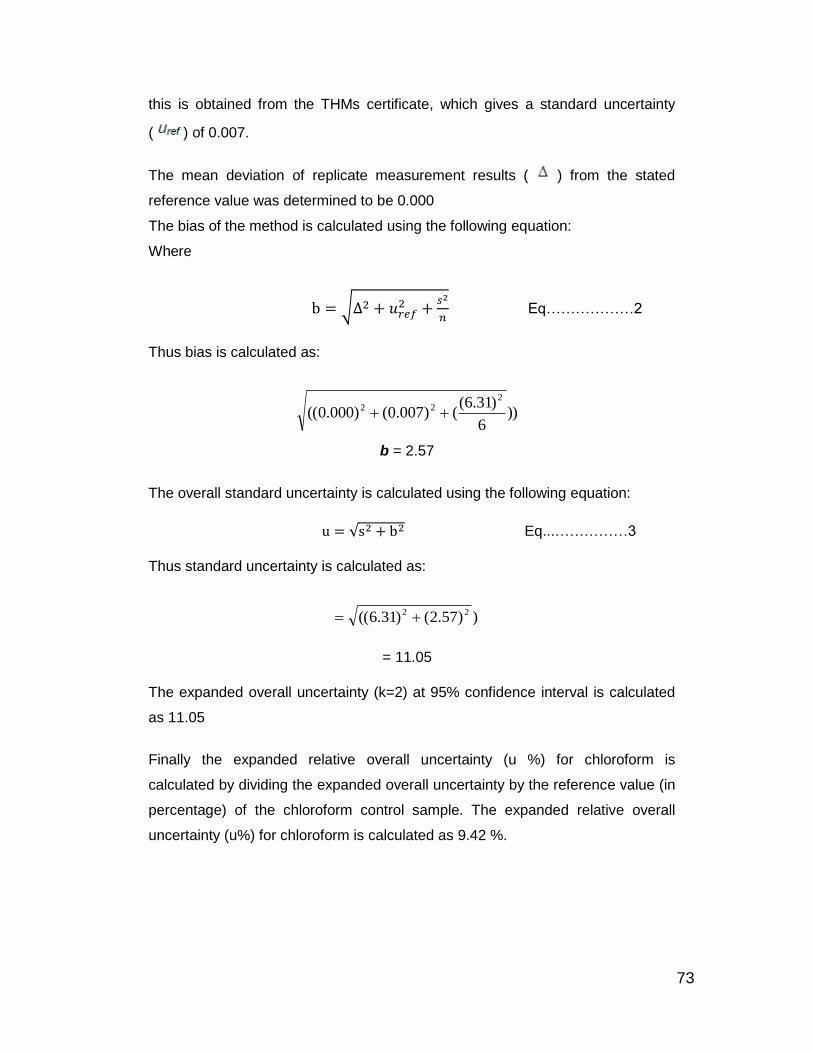
73
this is obtained from the THMs certificate, which gives a standard uncertainty
( ) of 0.007.
The mean deviation of replicate measurement results ( ) from the stated
reference value was determined to be 0.000
The bias of the method is calculated using the following equation:
Where
b = √∆2 + 𝑢𝑟𝑒𝑓2 +
𝑠2
𝑛 Eq………………2
Thus bias is calculated as:
))6
)6.31(()007.0()000.0((
222
b = 2.57
The overall standard uncertainty is calculated using the following equation:
u = √s2 + b2 Eq...……………3
Thus standard uncertainty is calculated as:
))57.2()6.31(( 22
= 11.05
The expanded overall uncertainty (k=2) at 95% confidence interval is calculated
as 11.05
Finally the expanded relative overall uncertainty (u %) for chloroform is
calculated by dividing the expanded overall uncertainty by the reference value (in
percentage) of the chloroform control sample. The expanded relative overall
uncertainty (u%) for chloroform is calculated as 9.42 %.
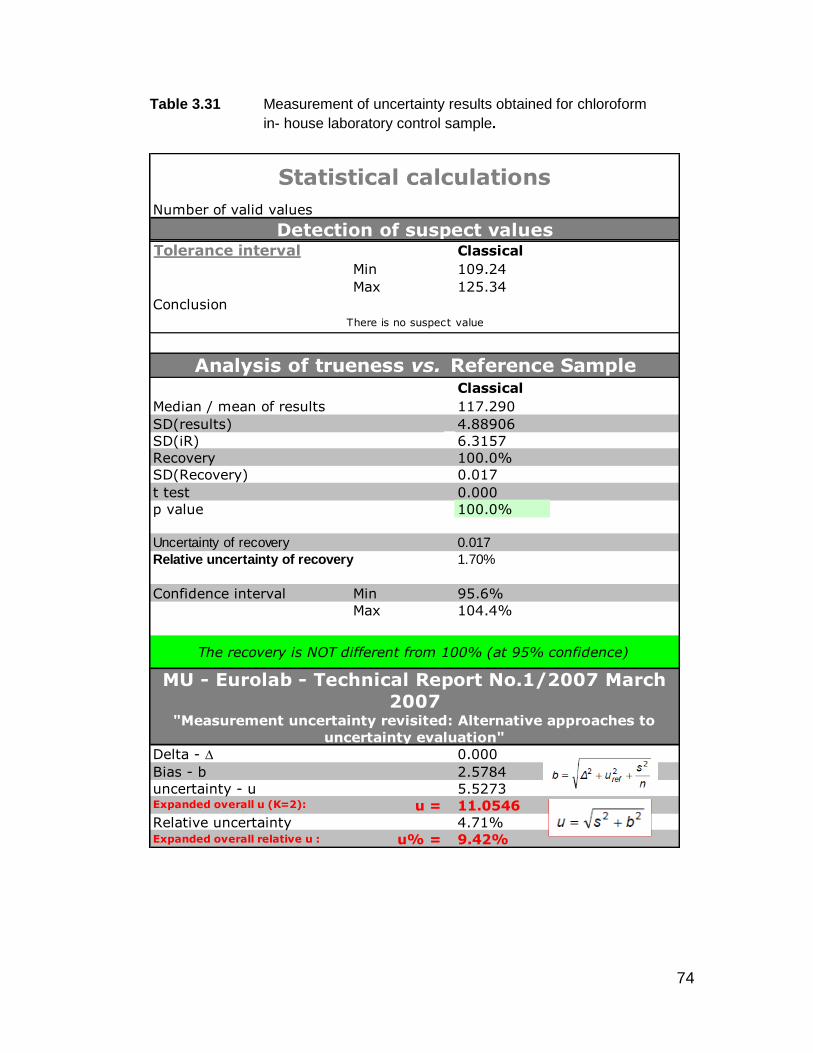
74
Table 3.31 Measurement of uncertainty results obtained for chloroform
in- house laboratory control sample.
Number of valid values
Tolerance interval Classical
Min 109.24
Max 125.34
Conclusion
Classical
Median / mean of results 117.290
SD(results) 4.88906
SD(iR) 6.3157
Recovery 100.0%
SD(Recovery) 0.017
t test 0.000
p value 100.0%
Uncertainty of recovery 0.017
Relative uncertainty of recovery 1.70%
Confidence interval Min 95.6%
Max 104.4%
Delta - D 0.000
Bias - b 2.5784
uncertainty - u 5.5273
u = 11.0546
Relative uncertainty 4.71%Expanded overall relative u : u% = 9.42%
The recovery is NOT different from 100% (at 95% confidence)
MU - Eurolab - Technical Report No.1/2007 March
2007"Measurement uncertainty revisited: Alternative approaches to
uncertainty evaluation"
Expanded overall u (K=2):
Statistical calculations
Detection of suspect values
There is no suspect value
Analysis of trueness vs. Reference Sample

75
Table 3.32 Summary of Measurement of uncertainty for THMs
Trihalomethanes Measure of Uncertainty
Chloroform 9.42%
Bromodichloromethane 3.81%
Chlorodibromomethane 3.10%
Bromoform 9.43%
The measurement of uncertainty associated with the determination of chloroform
in trihalomethanes tested on a routine basis was determined as 9.42 %. These
uncertainty estimations are based upon physical analysis of reference standard.
This process includes all areas of uncertainty in the final results, and the
calculated uncertainties meets the requirements of the test method as well as the
requirements of the customer.
3.2.14 Proficiency Testing (Fapas drinking water proficiency test)
Proficiency testing aims to provide an independent assessment of the
competence of participating laboratories. Together with the use of validation
methods, proficiency testing is an essential element of laboratory quality
assurance.
The laboratory participated in Fapas drinking water proficiency test in the month
of June 2017. Chemistry proficiency test for drinking water DWC017 was
dispatched in May 2017. Each participant received drinking water test material of
spiking concentration to be analysed for a variety of analytes in a single run. The
trihalomethanes results of the Fapas proficiency sample were obtained from the
instrument. Results were submitted by 39 participants (95%) before the closing
date for this test. Each participant was given a laboratory number, assigned in
order of receipt of results. All the other Fapas proficiency values for THMs can be
found in appendix: A pg: 174.
Fapas drinking water proficiency test calculations
An assigned value (χα) was determined for each analyte and in conjunction with
the standard deviation for proficiency (σp) was used to calculate a z-score for
each result.
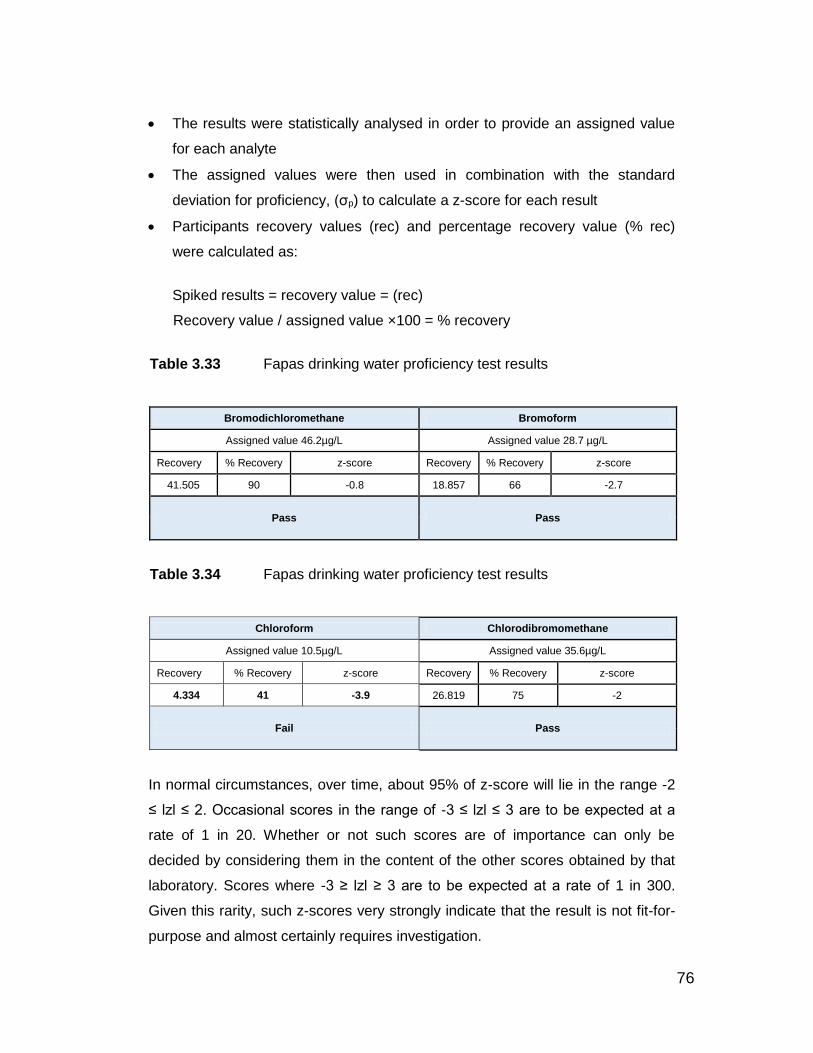
76
The results were statistically analysed in order to provide an assigned value
for each analyte
The assigned values were then used in combination with the standard
deviation for proficiency, (σp) to calculate a z-score for each result
Participants recovery values (rec) and percentage recovery value (% rec)
were calculated as:
Spiked results = recovery value = (rec)
Recovery value / assigned value ×100 = % recovery
Table 3.33 Fapas drinking water proficiency test results
Bromodichloromethane Bromoform
Assigned value 46.2µg/L Assigned value 28.7 µg/L
Recovery % Recovery z-score Recovery % Recovery z-score
41.505 90 -0.8 18.857 66 -2.7
Pass Pass
Table 3.34 Fapas drinking water proficiency test results
Chloroform Chlorodibromomethane
Assigned value 10.5µg/L Assigned value 35.6µg/L
Recovery % Recovery z-score Recovery % Recovery z-score
4.334 41 -3.9 26.819 75 -2
Fail Pass
In normal circumstances, over time, about 95% of z-score will lie in the range -2
≤ lzl ≤ 2. Occasional scores in the range of -3 ≤ lzl ≤ 3 are to be expected at a
rate of 1 in 20. Whether or not such scores are of importance can only be
decided by considering them in the content of the other scores obtained by that
laboratory. Scores where -3 ≥ lzl ≥ 3 are to be expected at a rate of 1 in 300.
Given this rarity, such z-scores very strongly indicate that the result is not fit-for-
purpose and almost certainly requires investigation.
77
Proficiency testing was conducted by participating Fapas proficiency test. Three
of the four analytes bromodichloromethane, chlorodibromomethane and
bromoform scored a z-score in the range between -3 ≤ lzl ≤ + 3. It can be
concluded that these three analytes passed the proficiency test. However,
chloroform failed the proficiency test with a z score of -3.9. The failure of
chloroform can be due to sample transfer lost due to volatile sample technique,
loss of liquid-liquid extraction due to transfer process, poor sample preparation
technique, lack of experience by analyst in proficiency testing. It must be
concluded that overall result of three out of four is quite satisfactory which gave a
75 % pass rate.
78
CHAPTER 4
Discussion, Conclusion and Recommendation
4.1 Introduction
South Africa is relatively poorly endowed with water resources and is considered
a “water stressed country”. According to statistics South Africa’s 2016 general
household survey, South Africa is the 39th “driest” country in the world. South
Africa water supply is mainly from rivers and dams, but the quality of water
supplied from the dams and rivers remains threatened from contaminated
sources. According to the literature reviewed 132 towns were tested for water
and sewerage quality. It was reported that seven municipalities did not meet the
quality standards for drinking water in 2016 (BDS, 2016). South Africa’s water
quality has been on a decline, after a published report by the South African
Water Caucus, (SAWC, 2017). It appears that the drinking water quality in South
Africa has severely deteriorated from 2009 (DEA, 2013) and is now a cause for
concern, after the Department of Water Affairs (DWA) failed to publish the
countries Blue Drop/ Green Drop report for 2017, (SAWC, 2017).
The number of systems that were awarded Blue Drop status in 2012 has
dropped from 98 to 44 in 2014 (SAWC, 2017). In 2009, the first Blue Drop report
showed that the national microbiological compliance for tap water in South Africa
was measured at 93.3 % against the national standard. Since then the Blue Drop
score has significantly deteriorated dropping from 87.6 % in 2012 to 79.6 % in
2014. The minister of water and sanitation has responsibility to fulfil certain
obligations related to the use, allocation and protection of and access to water.
Many rural as well as urban communities have no choice but to collect water
from rivers and dams for domestic use, irrigation, cattle, rituals, recreation and at
times for drinking purposes because of erratic water supply There is huge risk
involved when the public consumes untreated water. Untreated water from
municipalities may results in a broad spectrum of toxic metals in high
concentrations. Drinking water that contains metals in high concentration levels
may result in impairment of cognitive functions, skin lesions, cancer and metal
retardation in foetus since it affect the neural development. The Blue Drop and

79
Green Drop statuses give the public assurance that the water they drink is of a
high quality standard.
Water treatment on its own brings significant problems. Water in South Africa is
treated with chlorine or other disinfectants. They are used to control microbial
contaminants in natural drinking water; however, this leads to formation of
significant amount of disinfections known as THMs. Trihalomethanes have been
known to cause cancer (Jamaleddin et al., 2016) in human population using
chlorine or other disinfectant for water treatments, before being consuming by
people, where chloroform is the most present THM. Consistent slight increases in
the incidence of rectal, colon and bladder cancer was found with the strongest
evidence for bladder cancer. This alone should serve as enough reason for the
DWA affairs to publish the countries Blue Drop/Green report for 2017.
In South Africa, there are 9 chemical laboratories that are SANAS accredited
(SANAS, 2017) and undisclosed amount of laboratories that are not SANAS
accredited for THMs. There is significant need in South Africa for independent
laboratories to obtain accreditation of THMs analysis in drinking water.
Government laboratories also better known as State Owned Entities (SOE)
laboratories are not required to obtain any accreditation for testing purposes.
State Owned Entities laboratories need to compare their inter-laboratory testing
results to SANAS accredited laboratory, whether it is for chemical testing or
microbial testing. As there are only 9 accredited laboratories which limits SOE
laboratories to the number of laboratories it can send their samples. Therefore
with the development of this method it will be possible to become one of the
accredited laboratories in the country that is able to test for THMs, and also be
able to contribute to the improvement of better water quality in the country.
4.2 Optimization of gas chromatography method
The standard method of analysis for THMs was the US EPA method 551.1. This
method was published in 1990, when gravimetric extraction techniques were still
considered the most reliable technique for THMs. This technique is still
considered one of the most reliable techniques, as it requires a significant
amount of weighing small quantities and is a high chemical consumable
80
technique. Reckhow et al., (2012) derived a new analytical method for the
determination of THMs. This method was known as “Analysis of Trihalomethanes
and Related Pentane-Extractable Organic Halides”. This new method added
significant advantages compared to US EPA method, such as, better analytical
column, better carrier gasses, better carrier flow and shorter retention time. This
is currently the most advanced liquid-liquid extraction technique available for
determination of THMs.
The aim of this project was to optimize the method developed by Reckhow et al.,
(2012). Optimization normally requires changes being made to analytical
methods that are currently in use. The first change was the analytical column.
The DB-5 column was in use but a significant baseline noise was experienced
after initial trial tests as shown in figure 2.1. The column was replaced with a
more advanced analytical column HP-5 MS UI. This column offers major
advantages such as more selective analytes, water robustness, low bleed and
excellent inertness. This was all proven when the column was inserted and no
baseline noise was experienced as shown in figure 2.2. The carrier gas was
changed from nitrogen to helium, as there was a significant advantage of helium
compared to nitrogen. Helium provides high column efficiency at moderate linear
velocity flow rate, shorter retention time and less carrier gas being consumed
during analysis. The oven program was the one where the most changes were
made. When Reckhow et al., (2012) developed the method, it was developed for
THMs and organic halides. This project is only focusing on THMs. After a
considerate amount of testing trials, it was decided to optimize the method
retention time from 37.50 min to 26.50 min. This decision was made because all
THMs of interest has already eluted after 12.00 min. An additional 14.50 min
was added to the time to discard all purities that remained trapped behind in the
column after each analytical run. The initial oven temperature was increased
from 27 ºC to 40 ºC. This decision was made because oven program
temperature needs to be consistent from season to season. It was found that
during summer seasons it becomes difficult for the oven to reach 27 ºC, because
of the surrounding ambient temperatures.
81
4.3.1 Validation of Trihalomethanes
Validation is the core foundation for all analytical methods that are developed or
modified. A method needs to be validated when significant changes are made to
the current method which has already been validated, an in-house developed
method is used or a method is published in scientific literature but no validation
characteristics is included. Validation needs to be done based on scientific
guidelines in order to be acceptable. The guideline characteristics that were used
for validation purposes are found in the SANAS TR 28-01 document. The
document states that for any method that is validated the following requirements
need to be met: limit of detection, limit of quantification, instrument linearity,
instrument precision, matrix effect based on recovery, matrix effect based on
interferences, precision based on reproducibility, accuracy based on recovery,
selectivity based on recovery, selectivity based on interferences, inter-laboratory
comparison, precision based on repeatability, robustness, measure of uncertainty
and proficiency testing. All of the above were done and complied with accepted
levels according to SANAS TR 28-01.
4.3.2 Limit of detection (LOD) and limit of quantification (LOQ)
The limits of detection and quantification showed that the THMs content ranges
from 0.199-0.440 for LOD and 0.666-1.469 for LOQ. As it can be seen from
table 3.2 both the LOD and LOQ calculated from the reagent blank concentration
concluded that this method will quantify the THMs of interest based on their
respective limits.
4.3.3 Linearity
The linearity of the 7 concentrations working range showed linear graphs with
acceptable correlation values (R2) for each THM. For the R2 value to be accepted,
the R2 must be ≥ 0.980. Therefore the R2 obtained ranges from 0.984-0.998 as
indicated in table 3.3 and showed that the instrument response due to the
change in analyte concentration is acceptable.
82
4.3.4 Instrument Precision
The instrument precision test was conducted by injecting a 50 µg/L calibration
standard sample 10 times. The RSD values ranges from 1.89 % - 2.98 % as
indicated in table 3.5. All gave acceptable results falling below the 10% limit for
RSD. It was concluded that the instrument precision for this method is acceptable
for the sample matrices of interest.
4.3.5 Recovery and Matrix effect
In order to establish recovery and matrix effect for this method, eight samples of
different matrices were analysed for each of the four THMs, with both the blank
samples and the spiked samples prepared separately in three different
concentrations. The recovery range from 81.60 % - 119.27 %, all the sample
matrices gave an acceptable % recovery that is within the 70 – 120 %. This
concludes that there were acceptable matrix effects within the sample matrices of
interest.
4.3.6 Recovery and Matrix effect based on Interferences
The recovery and matrix based on interference were established by using three
samples of different matrices were analysed for each of the four THMs, with both
the blank samples and the spiked samples prepared separately in three different
concentrations. The recoveries ranges from 80.50 % - 118.95 %, all the samples
gave an acceptable % recovery that is within the 70 – 120 % recovery range.
Therefore concludes that there were acceptable matrix effects based on
interferences within the sample matrices of interest.
4.3.7 Precision based on Reproducibility
Precision based on reproducibility were established on municipal and chlorinated
water samples were it was spiked with 50 µg/L THMs calibration standard
respectively, and analyzed five times each by two different analysts. The RSD
results obtained for municipal and chlorinated water ranges from 3.22 % - 6.85 %.
The instrument gave acceptable RSD results falling below the 10% limit. It was
concluded that the precision based on reproducibility for this method is
acceptable for the sample matrices of interest.
83
4.3.8 Accuracy based on recovery
In order to establish accuracy based on recovery for this method, four samples of
different matrices were analysed for THMs, with both the blank samples and the
spiked samples prepared separately in three different concentrations. The
recovery ranges from 87.14 % - 118.37 %. The % recoveries for THMs in each
sample were acceptable (within 70 % – 120 % range). The RSD was calculated
and ranges from 1.72 % - 6.03 %, they were accepted based on the RSD ≤ 10%
limit. This then concludes that the method is accurate in quantifying the THMs of
interest within the sample matrices of the method.
4.3.9 Selectivity based on recovery
Selectivity based on recovery is a very important validation test regarding
selective analytes of interest. The sample matrices were spiked with the 50, 80
and 250 µg/L THMs standards, and ran on the instrument. The % recovery
ranges from 82.82 % - 119.97 %. The % recoveries for THMs in each sample
were acceptable (within 70 % – 120 % range). It was then concluded that the
method is selective to the analytes of interest as the respective sample matrix
chromatograms showed in figure 3.5-3.6 a proper separation of the analytes of
interest.
4.3.10 Selectivity based on Interferences
Individual test were conducted to establish selectivity, the sample matrices were
spiked with the 50, 150 and 350 µg/L THMs standards, as well as 100 µL of 500
µg/L chloride, fluoride and SEPP-133 custom made (Metals) standards and ran
on the instrument. The % recovery ranges from 80.54 % - 98.84 %. The %
recoveries for THMs were acceptable (within 70 % – 120 % range),. It was then
concluded that the method is selective to the analytes of interest as the
respective sample matrix chromatograms showed in figure 3.7-3.8 a proper
separation of the analytes of interest and no interferences.
4.3.11 Laboratory comparison
To establish laboratory comparison, Microchem participate in an inter-laboratory
comparison with A.L. Abbot and Associations, the samples that were outsourced
84
to A.L Abbott and Associations were in-house tested at Microchem laboratory
service. The combined THMs showed that there were no significant differences
between the results of the two laboratories. This then concludes that the method
is capable of quantifying the THMs of interest.
4.3.12 Precision based on Repeatability
In order to establish precision based on repeatability for this method, four
samples of different matrices were analysed for THMs, with both the blank
samples and the spiked sample prepared separately at 150 µg/L concentration.
The RSD results ranges from 2.26 % - 6.06 %. The RSD results obtained, for the
respective THMs were acceptable below the 10% value. The z-scores were
found to be 0.5 for all respected THMs. This is in range with the acceptable z-
score range which falls between -3 ≤ lzl ≤ + 3. Therefore, it was concluded that
the precision based on repeatability for this method is acceptable for the sample
matrices of interest.
4.3.13 Robustness
Robustness for this method consists of two samples of different matrices were
analysed for THMs, with both the blank samples and the spiked samples
prepared separately. The recovery ranges from 80.24 % - 109.30 %, all the
samples gave an acceptable % recovery that is within the 70 – 120 % recovery
range. It was concluded that this method is robust enough to withstand significant
changes made to the method and would still give reliable results.
4.3.14 Estimation of uncertainty of measurement
The calculation of measurement of uncertainty was based on the analysis of the
spiked control sample, for any factors that contributes to the change in results of
the same sample. This process includes all areas of uncertainty in the final
results. Due to this serial analysis it was concluded that the calculated
uncertainties ranges from 3.10 % - 9.43 %, it meets the requirements of the test
method as well as the requirements of the customer.
85
4.3.15 Proficiency Testing
Proficiency testing was conducted by participating FAPAS proficiency test. Three
of the four analytes bromodichloromethane, chlorodibromomethane and
bromoform scored a z-score in the range between -3 ≤ lzl ≤ + 3, which concluded
that these three analytes pass the proficiency test. However, chloroform failed
the proficiency test with a z score of -3.9. The failure of chloroform can be due to
sample transfer lost due to volatile sample technique, loss of liquid-liquid
extraction due to transfer process, poor sample preparation technique, lack of
experience by analyst in proficiency testing. It must be mentioned that this was
the first proficiency testing participating for THMs. Thus, it must be concluded
that overall result of three out of four is quite satisfactory which gave 75 % pass
rate.
4.4 Real life water
A selective number of natural water samples were selected for application of the
validation method: such as river water, underground water, sea water, unfiltered
water and borehole water. These are waters that are natural in nature and are
accessible to humans. This is untreated water that is being made used of on a
daily basis in the rural areas. Most of these communities collect these waters
from rivers for domestic use, irrigation, cattle, rituals, recreation and at times for
drinking purposes. A question that needs to be asked is how safe are these
natural waters for consumption. It must be considered that municipalities have a
difficult time reaching out to these communities, as they are very far away from
cities and small townships where municipalities are situated, to implement water
treatment protocols. It must be taken into account of how well these waters
measure up to drinking water limits set up by SANS 241:2015 standards. SANS
241:2015 states that no water should exceed the following limits for THMs, 300
µg/L for chloroform, 60 µg/L bromodichloromethane, 100 µg/L
chlorodibromomethane and bromoform. If water exceeds these limits, it is
considered a chronic risk and is not safe for human consumption, whereby water
treatment needs to be taken care of immediately.
86
None of the water these was tested exceeded this limits except sea-water. The
water that did not exceed the limits can be classified as partially safe for human
consumption. The reason it is classified as partially safe for human consumption
is because it only passed the SANS 241:2015 THMs drinking water regulations
and levels. However, SANS 241:2015 does not just consist of trihalomethanes, it
also consists of physical and aesthetic determination (TDS, color, conductivity,
turbidity etc.), macro determinations (sulphate, nitrate, monochloramine,
chlorides and etc.), micro determinations (lead, mercury, and selenium etc.), and
organic determinations (TOC, phenols and microcystin). For the water to be
considered safe for human consumption, it needs to pass all these SANS
241:2015 tests. Sea water has shown very high levels of THMs content in them.
It has shown very high levels of bromoform which was reported as 259.016,
260.397 and 260.631 µg/L as untreated bromoform. This exceeds the limits of
100 µg/L set out by SANS 241:2015. This is a very strong indication that sea
water is not safe for human consumption, due to the significant high levels of
bromoform in it. This study has confirmed that all other natural water is safe for
human consumption in the presence of THMs. It is hoping that this study could fill
the significant hole left by municipalities that are more centralized to small
townships and larger cities than rural areas.
4.5 Municipal drinking water samples
Municipalities have a major responsibility of ensuring that the water quality that
they supply to rural areas, small towns or major cities is of safe standard for
human consumption. Pre-treated water samples were selected from a variety of
municipalities to ensure that municipalities are delivering water qualities of the
highest standards. The following water samples were selected from the following
municipalities: municipal and chlorinated water (Midrand), municipal water
(Sasko-Ladysmith KZN), Johnson-Johnson medical water, (Cape Town) and tap
water (Woodstock). Midrand municipality water showed low levels of THMs for
chloroform, bromodichloromethane, chlorodibromomethane and bromoform.
They all showed values that vary from 11.740 µg/L - 11.981 µg/L for chloroform
3.210 µg/L – 3.564 µg/L for bromodichloromethane, 0.820 µg/L - 0.890 µg/L for
chlorodibromomethane and 0.100 µg/L - 0.171 µg/L for bromoform. Sasko –
Ladysmith municipality showed very low values as well for THMs content. The
87
values verified from 2.208 µg/L- 2.300 µg/L for chloroform, 0.138 µg/L - 0.145
µg/L for bromodichloromethane, 0.060 µg/L - 0.068 µg/L for
chlorodibromomethane and 0.073 µg/L - 0.074 µg/L for bromoform. These are all
municipal waters that are used for human consumption and were supplied
directly from municipalities. These waters all show very low content of THMs that
are way below the permitted limits.
Chlorinated water is water that has been presumably been treated for bacteria
and fungi growth. These are normally the type of water that produces high
content of THMs in them, due to chlorination treatment. The results that were
obtained for chlorinated water were reported as follows: 10.120 µg/L – 11.654
µg/L for chloroform, 2.214 µg/L - 2.666 µg/L for bromodichloromethane, 0.819
µg/L – 0.895 µg/L chlorodibromomethane and 0.103 µg/L - 0.135 µg/L for
bromoform. This does conform to the permissible levels set out by WHO and
SANS 2015:241.
It has been observed that natural water shows a very high affinity for chloroform.
This is what is expected under normal conditions as chloroform is the most
abundant THM of all THMs present in natural water. Johnson-Johnson medical
water is very well-known natural water that is consistently used in medical
facilities like hospitals for treatment of sick patients. It is water that must be free
of any organic matter, bacterial growth or microbial contamination. The results
that were obtained from this water source are reported as follows, 0.511 µg/L –
0.580 µg/L for chloroform, 0.758 µg/L – 0.775 µg/L for bromodichloromethane,
0.550 µg/L – 0561 µg/L for chlorodibromomethane and 0.220 µg/L – 0231 µg/L
for bromoform. This low concentration levels of THMs are what are expected
because this water undergoes significant purification steps to eliminate all traces
of THMs, microbial contaminations, fungi and bacterial growth from them.
Tap water in Woodstock is water that was directly from a tap. Woodstock is
known for its fragile infrastructure in general. The results that were reported for
tap water are as follows: 31.410 µg/L – 32.665 µg/L for chloroform, 15.358 µg/L –
15.987 µg/L for bromodichloromethane, 5.260 µg/L – 5.963 µg/L for
chlorodibromomethane and 0.597 µg/L – 0.654 µg/L for bromoform. High content
of THMs was reported for chloroform and chlorodibromomethane. This high
88
content can be due to fragile quality of infrastructures of pipes that contains high
content of organic or inorganic matter that carries water to taps, which
contributes to high content of THMs. It could be due to poor quality of water
supplied by the municipality. This high content of THMs should be a concern for
the municipality. It must be noted that this high content of THMs for chloroform
and chlorodibromomethane is still far below the critical limits, for it to be
considered a chronic risk.
4.6 Fapas Proficiency Test and inter laboratory comparison
Inter laboratory comparisons are done to check the ability of a laboratory to
deliver accurate testing results to their customers or to find out whether a certain
analytical method performed well and is fit for its intended purposes. The former
is normally termed “proficiency testing” and the latter “collaborative method
validation study”. Laboratories involved in official control activities are required to
provide evidence for their competence in carrying out testing. This process is
called accreditation. Accredited laboratories should use standardized methods of
analysis and are required to participate in proficiency test for demonstrating their
technical competence to their customers and to ensure comparability and
acceptability of the testing results produced by them.
A proficiency sample was dispatched under the identification name ‘drinking
water DWC017’ in May 2017. The proficiency testing was for all four THMs:
chloroform, bromodichloromethane, chlorodibromomethane and bromoform.
Proficiency tests are scored based on z-scores. The following z-scores were
reported for THMs: chloroform -3.9, bromodichloromethane -0.8,
chlorodibromomethane -2.0 and bromoform -2.7. In normal circumstances, over
time, about 95% of z-score will lie in the range -2 ≤ lzl ≤ 2. Occasional scores in
the range of -3 ≤ lzl ≤ 3 are to be expected at a rate of 1 in 20. Whether or not
such scores are of importance can only be decided by considering them in the
context of the other scores obtained by that laboratory. Scores where -3 ≥ lzl ≥ 3
are to be expected at a rate of 1 in 300. Given this rarity, such z-scores very
strongly indicate that the result is not fit-for-purpose and almost certainly requires
investigation.

89
Under normal circumstances at 95 % confidence level bromodichloromethane
and chlorodibromomethane is acceptable base on z-score results. Occasionally
z-scores in range of -3 ≤ lzl ≤ 3 can be accepted. In this case the result of
bromoform can be accepted, based on the following indications. For instances,
the result can be accepted due to the overall low recovery percentage of all four
THMs. In this way, chloroform obtained a result of 4.334 µg/L, while the actual
result is 10.50 µg/L, this gives a recovery of 41 %. Bromodichloromethane
obtained a result of 41.505 µg/L, while the actual result is 46.2 µg/L, this gives a
recovery of 90 %. Chlorodibromomethane obtained a result of 26.819 µg/L, while
the actual result is 35.6 µg/L, this gives a recovery of 75 %. Bromoform obtained
result is 18.857 µg/L, while the actual result 28.7 µg/L, this gives a recovery of
66 %.
Low recovery can be due to loss of THMs during the extraction process. Scores
where z-score values are -3 ≥ lzl ≥ 3 strongly indicated that the result is not fit for
purpose use. In this case, the result for chloroform is unacceptable and is not fit
for purpose use and failed the proficiency test. The proficiency test has an overall
pass rate of 75 % under acceptable circumstance. However, it must be
mentioned that this is the first proficiency test carried out for THMs. Hopefully in
the near future more proficiency tests will be carried out to improve the overall
results.
4.7 Conclusion
South Africa is a water scarce country, and its water sources needs to be
protected at all cost. There are guideline limits for THMs in the SANS 241:2015
document, but they are not continuously being monitored and their levels in
natural water are not known. The results obtained for natural water e.g. river,
borehole and underground water have shown low levels of THMs concentrations.
These low levels need to be monitored consistently with precision. The water
supplied from municipal sources e.g. chlorinated, municipal and tap waters were
within the specification limits stipulated in SANS 241:2015, and need to be
monitored on a daily basis as these are the waters that are supplied to the
communities for consumption. The liquid-liquid micro-extraction technique that
was used for the determination of THMs is a rapid, simple and inexpensive

90
technique that provides low limits of detection and wide dynamic range for the
determination of THMs. The modified validated method for determination of
THMs in drinking water in South Africa is a suitable effective method which can
be used to determine trihalomethanes and combined content in water samples.
4.8 Recommendations for future studies
The primary objective of this project was to develop a fast and reliable method for
THMs, so that it can detect and quantify the THMs content present in natural
water. In order to improve monitoring of THM levels in natural water content, the
following recommendations need to be implemented.
Looking at alternative ways other than chlorination for water treatment plants.
Looking at other DBPs in drinking water content, not just THMs in South Africa.
Complete detailed study needs to be done regarding the effect of THMs, it has
been stipulated that it leads to chronic effect which can lead to cancer in
laboratory animals.
More extensive monitoring of THMs in municipal drinking water.
The method is in processes of getting SANAS accredited
91
Chapter 5
References
Booi, X. (2013) Perfluorinated Compounds and Trihalomethanes in Drinking
Water Sources of the Western Cape, South Africa, Magister Technologiae:
Chemical Engineering. Cape Peninsula University of Technology.
Capri, M., Zufall, C. (2003) Gas Chromatography Analysis of Trihalomethanes in
Drinking Water –A rapid and Direct Quantitative Method. LCGC ASIA Pacific,
6(1), 36-39
Chang, H.H., Tung, H.H., Chao, C.C., Wang, G.S. (2010) Occurrence of
Haloacetic acids (HAAs) and Trihalomethanes (THMs) in drinking water of
Taiwan. Environmental Monitoring and Assessment, 162(1-4), 237-250
Chowdhury, S. (2013) Trihalomethanes in drinking water: effect of natural
organic matter distribution. Water SA, 39 (1)
Chowdhury, S., Champagne, P. (2008) An investigation on parameters for
modeling THMs formation. Global NEST Journal, 10(1), 80-91
Cristina, M.V., Ester, G.L., Cristina, B., Elena, R. (2017) Colorectal cancer and
long-term exposure to trihalomethanes in drinking water. Environ Health
Prospect. 125 (1), 56-65
Department of Water Affairs Directorate: Water Services Planning & Information.
(2013) Strategic Overview of the Water Sector in South Africa, Department of
Water Affairs. Version 1.5.
Department of Water Affair Republic of South Africa. (2013) Strategic overview of
the Water Sector in South Africa, 1(5), 10-22
FDA, 2013 Food and Drug Administration United States of America.
Guyo, U., Moyo, M., Nyamundal, B., Shumbai, M., Chigondo, F. (2013)
Determination of trihalomethanes in raw and treaded water supply to a local city
92
in Zimbabwe. International Journal of Engineering Research & Technology, 2(2),
1-7
Hasan, A., Thacker, N.P., Bassin, J. (2010) Trihalomethane formation potential in
treated water supplies in urban metro city. Environmental Monitoring &
Assessment, 168, 489-497
Health Services Executive & Environmental Protective Agency. (2011) Joint
Position Statement: Trihalomethanes in Drinking Water, 1-9
Kozani, R. R., Assadi, Y., Shemirani, F., Hosseini, M. R., Jamali, M. R. (2007)
Determination of Trihalomethanes in Drinking Water by Dispersive Liquid-Liquid
Micro-Extraction then Gas Chromatography with Electron-Capture Detection.
Chromatographia, 66 (1-2), 81-86
Loyola-Sepulveda, R., Mudge, S.M., Bravo-Linares, C. (2013) Seasonal Variation
of Disinfection By-products in Drinking Water in Central Chile. Water Quality,
Exposure and Health, 5(1), 1-9
Madabhushi, B. S. (1999) What are Trihalomethanes: 18-19
Mamba, B.B., Rietveld, L.C., Verberk, JQ. JC. (2008) SA Drinking Water
Standards Under The Microscope. The Water Wheel: 1-3
Munch, D. J., Hautman, D. P. (1995) Determination of Chlorination Disinfection
By-products, Chlorinated Solvents, And Halogenated Pesticides/ Herbicides in
Drinking Water by Liquid- liquid Extraction and Gas Chromatography with
Electron-Capture Detection, National Exposure research Laboratory Office Of
research And Development U.S Environmental Protection Agency Cincinnati
Ohio. Method 551.1
Oelofse, S., Strydom, W. (2010) A CSIR Perspective on water in South Africa.
CSIR Report No: CSIR/NRE/PW/IR/2011/0012/A.
Pavon, J.LP., Martin, S. H., Pinto, C. G., Cordero, B. M. (2008) Determination of
Trihalomethanes in water samples: A review. Analytica Chemica Acta 629, 6-23
93
Rand Water & Water Wise. (2011) The Water Situation:1-1
Rahnama, K.R., Assadi, Y., Shemirani, F,. Milani Hosseini, M.R., Jamali, M.R.
(2007) Determination of Trihalomethanes in Drinking Water by Dispersive Liquid-
Liquid Micro extraction then Gas Chromatography with Electron-Capture
Detection. Chromatographia. 66 (1-2)
Reckhow, D. A. (2012) Analysis of Trihalomethanes and Related Pentane-
Extraction Organic Halides, University of Massachusetts, Environmental
Engineering Research Laboratory. THM SOP
Rodriquez-Cabo, T., Ramil, M,. Rodriquez, I., Cela, R. (2012) Dispersive Liquid–
Liquid Micro-Extraction with Non-Halogenated Extractants for Trihalomethanes
Determination in tap and swimming pool water. 99, 846-852
Ristoiu, D., Von Gunten, U., Haydee Kovacs, M. and Chira, R. (2009) Factors
affecting THM formation in the distribution system of Cluj, Romania. Romanian
Research Programme on Environmental Science and Technology (ESTROM),
73-79
Rivette, U., Champanis, M ., Wilson-Jones, T. (2012) Monitoring Drinking Water
Quality in South: Designing information systems for local needs. Water SA. 39(3),
409-410
Seager, S.L., and Slabaugh, M.R. 2010 Chemistry for Today: General, Organic
and Biochemistry, 7th Edition. Publisher: Brooks/Cole, Cengage Learning. Page
584
South Africa National Standards. (2005) Drinking Water Quality Management
Guide for Water Services Authorities. SANS 241
South Africa National Standards. (2011) Drinking Water Quality Management
Guide for Water Services Authorities. SANS 241
South Africa National Standards. (2015) Drinking Water Quality Management
Guide for Water Services Authorities. SANS 241
94
South Africa National Standard. (2015) Drinking Water Part 1: Microbiological,
physical, aesthetic and chemical determinands: SANS 241-1, 8-9
The group 17 elements: fluorine, chlorine, bromine and iodine, Chemistry 2810
Laboratory Manual. 26 June 2012
Van Der Molen, L. (2015) Microchem Specialized Lab Services: Method
Validation-Chemistry, Standard Operating Procedure, No: SOP-C-002/08
Van Steenderen, R.A., Pieterse, M.J., Bourne, D. (1991) Trihalomethanes
Formation in Portable Water with Reference to Related Variable and Health Data
Bases, Water South Africa, 17(4)
World Health Organization. (2004) Background document for development of
WHO Guideline for Drinking water Quality, Trihalomethanes in Drinking Water, 2-
39
WHO Guidelines for Drinking-water Quality 4th Edition, 2011
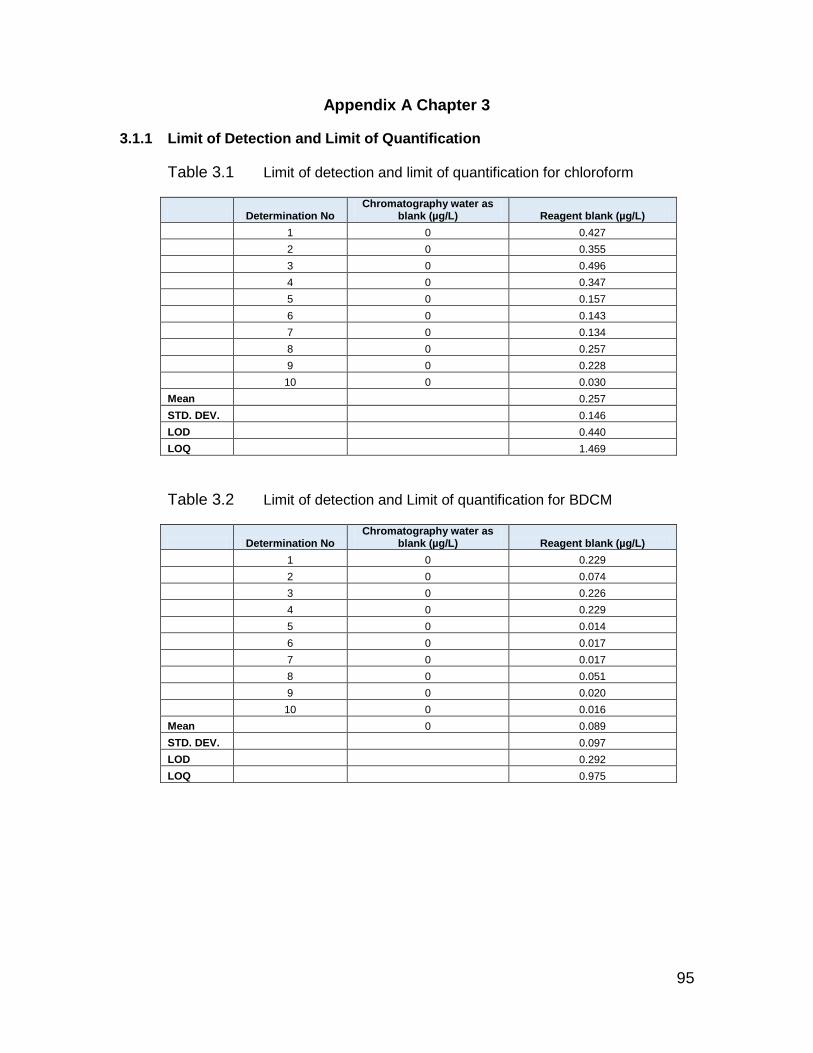
95
Appendix A Chapter 3
3.1.1 Limit of Detection and Limit of Quantification
Table 3.1 Limit of detection and limit of quantification for chloroform
Determination No Chromatography water as
blank (µg/L) Reagent blank (µg/L)
1 0 0.427
2 0 0.355
3 0 0.496
4 0 0.347
5 0 0.157
6 0 0.143
7 0 0.134
8 0 0.257
9 0 0.228
10 0 0.030
Mean 0.257
STD. DEV. 0.146
LOD 0.440
LOQ 1.469
Table 3.2 Limit of detection and Limit of quantification for BDCM
Determination No Chromatography water as
blank (µg/L) Reagent blank (µg/L)
1 0 0.229
2 0 0.074
3 0 0.226
4 0 0.229
5 0 0.014
6 0 0.017
7 0 0.017
8 0 0.051
9 0 0.020
10 0 0.016
Mean 0 0.089
STD. DEV. 0.097
LOD 0.292
LOQ 0.975
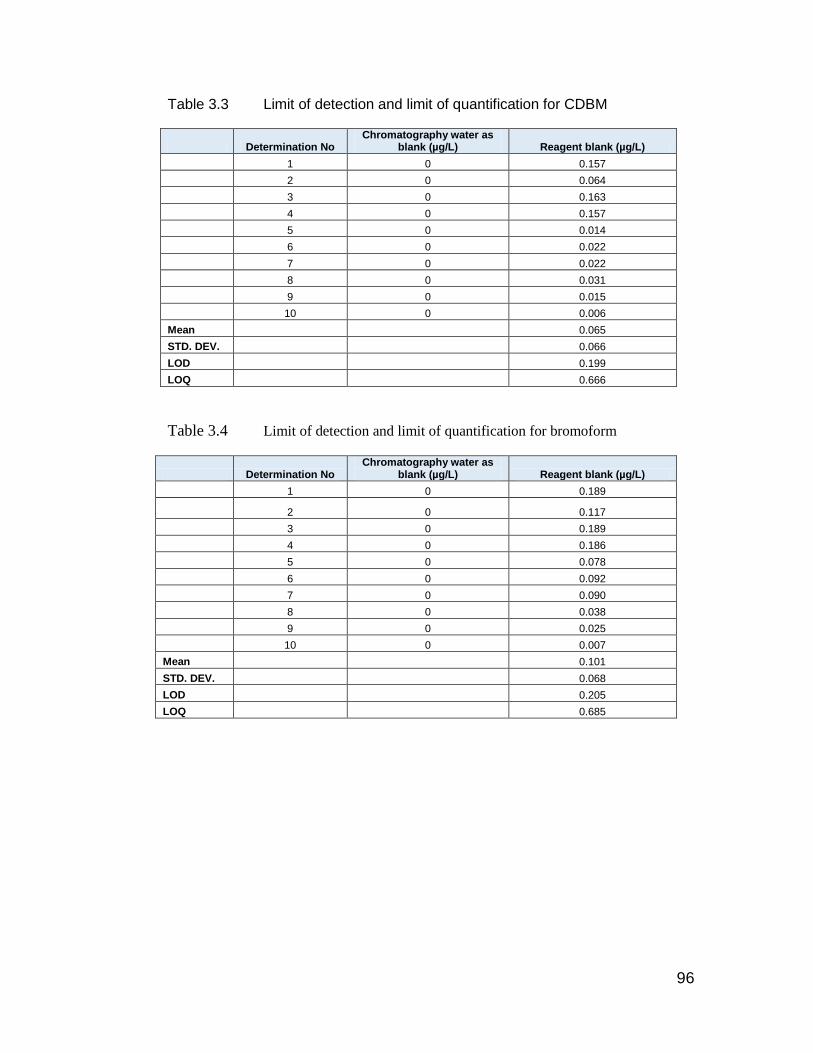
96
Table 3.3 Limit of detection and limit of quantification for CDBM
Determination No Chromatography water as
blank (µg/L) Reagent blank (µg/L)
1 0 0.157
2 0 0.064
3 0 0.163
4 0 0.157
5 0 0.014
6 0 0.022
7 0 0.022
8 0 0.031
9 0 0.015
10 0 0.006
Mean 0.065
STD. DEV. 0.066
LOD 0.199
LOQ 0.666
Table 3.4 Limit of detection and limit of quantification for bromoform
Determination No Chromatography water as
blank (µg/L) Reagent blank (µg/L)
1 0 0.189
2 0 0.117
3 0 0.189
4 0 0.186
5 0 0.078
6 0 0.092
7 0 0.090
8 0 0.038
9 0 0.025
10 0 0.007
Mean 0.101
STD. DEV. 0.068
LOD 0.205
LOQ 0.685
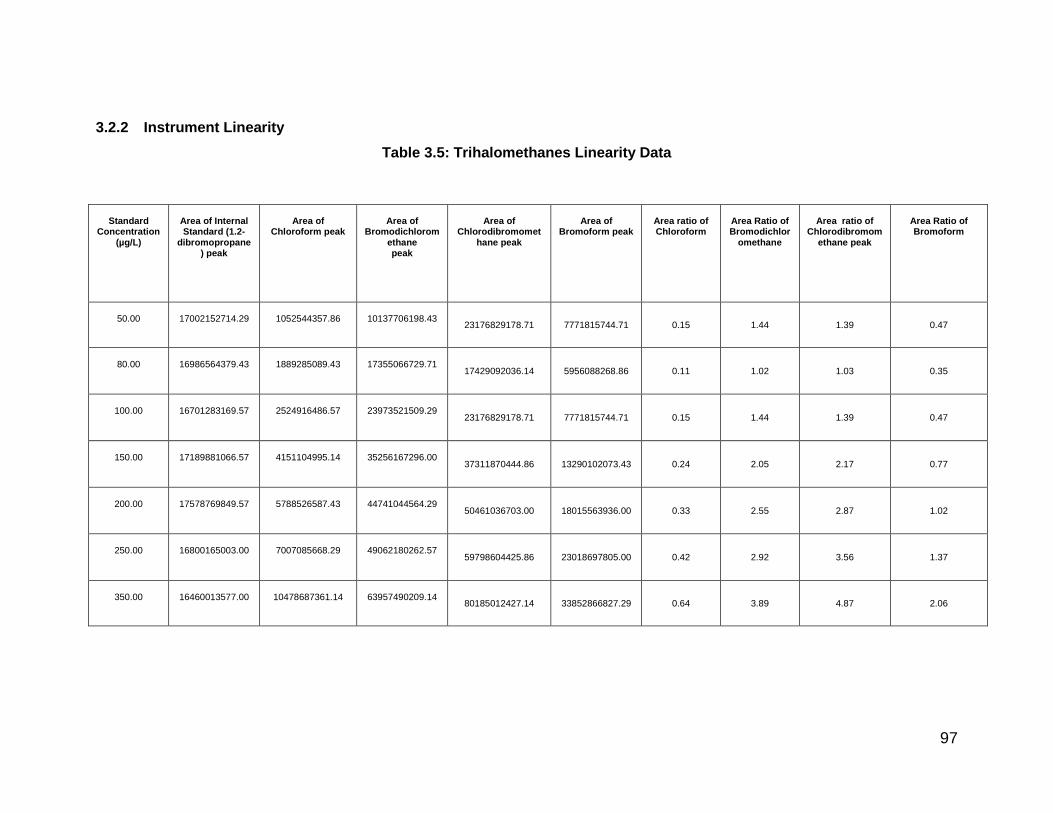
97
3.2.2 Instrument Linearity
Table 3.5: Trihalomethanes Linearity Data
Standard
Concentration (µg/L)
Area of Internal Standard (1.2-
dibromopropane) peak
Area of
Chloroform peak
Area of
Bromodichloromethane peak
Area of
Chlorodibromomethane peak
Area of
Bromoform peak
Area ratio of Chloroform
Area Ratio of Bromodichlor
omethane
Area ratio of
Chlorodibromomethane peak
Area Ratio of Bromoform
50.00
17002152714.29
1052544357.86
10137706198.43
23176829178.71 7771815744.71 0.15 1.44 1.39 0.47
80.00
16986564379.43
1889285089.43
17355066729.71
17429092036.14 5956088268.86 0.11 1.02 1.03 0.35
100.00
16701283169.57
2524916486.57
23973521509.29
23176829178.71 7771815744.71 0.15 1.44 1.39 0.47
150.00
17189881066.57
4151104995.14
35256167296.00
37311870444.86 13290102073.43 0.24 2.05 2.17 0.77
200.00
17578769849.57
5788526587.43
44741044564.29
50461036703.00 18015563936.00 0.33 2.55 2.87 1.02
250.00
16800165003.00
7007085668.29
49062180262.57
59798604425.86 23018697805.00 0.42 2.92 3.56 1.37
350.00
16460013577.00
10478687361.14
63957490209.14
80185012427.14 33852866827.29 0.64 3.89 4.87 2.06
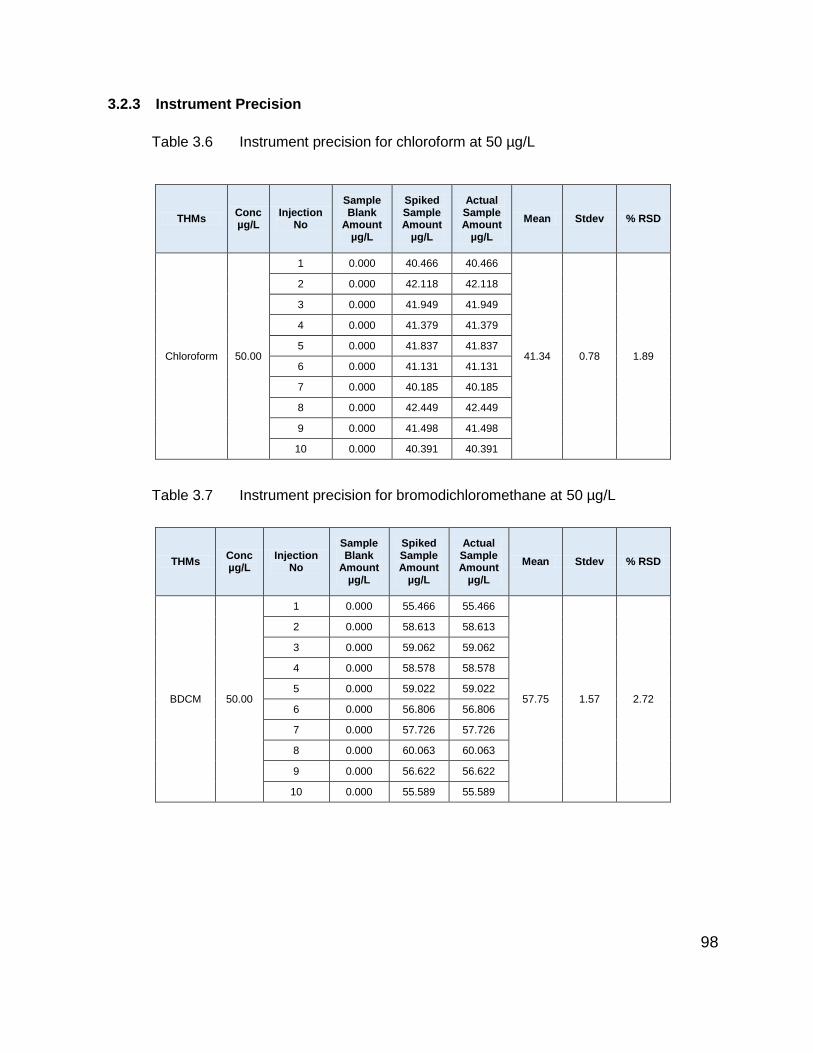
98
3.2.3 Instrument Precision
Table 3.6 Instrument precision for chloroform at 50 µg/L
THMs Conc µg/L
Injection No
Sample Blank
Amount µg/L
Spiked Sample Amount
µg/L
Actual Sample Amount
µg/L
Mean Stdev % RSD
Chloroform 50.00
1 0.000 40.466 40.466
41.34 0.78 1.89
2 0.000 42.118 42.118
3 0.000 41.949 41.949
4 0.000 41.379 41.379
5 0.000 41.837 41.837
6 0.000 41.131 41.131
7 0.000 40.185 40.185
8 0.000 42.449 42.449
9 0.000 41.498 41.498
10 0.000 40.391 40.391
Table 3.7 Instrument precision for bromodichloromethane at 50 µg/L
THMs Conc µg/L
Injection No
Sample Blank
Amount µg/L
Spiked Sample Amount
µg/L
Actual Sample Amount
µg/L
Mean Stdev % RSD
BDCM 50.00
1 0.000 55.466 55.466
57.75 1.57 2.72
2 0.000 58.613 58.613
3 0.000 59.062 59.062
4 0.000 58.578 58.578
5 0.000 59.022 59.022
6 0.000 56.806 56.806
7 0.000 57.726 57.726
8 0.000 60.063 60.063
9 0.000 56.622 56.622
10 0.000 55.589 55.589
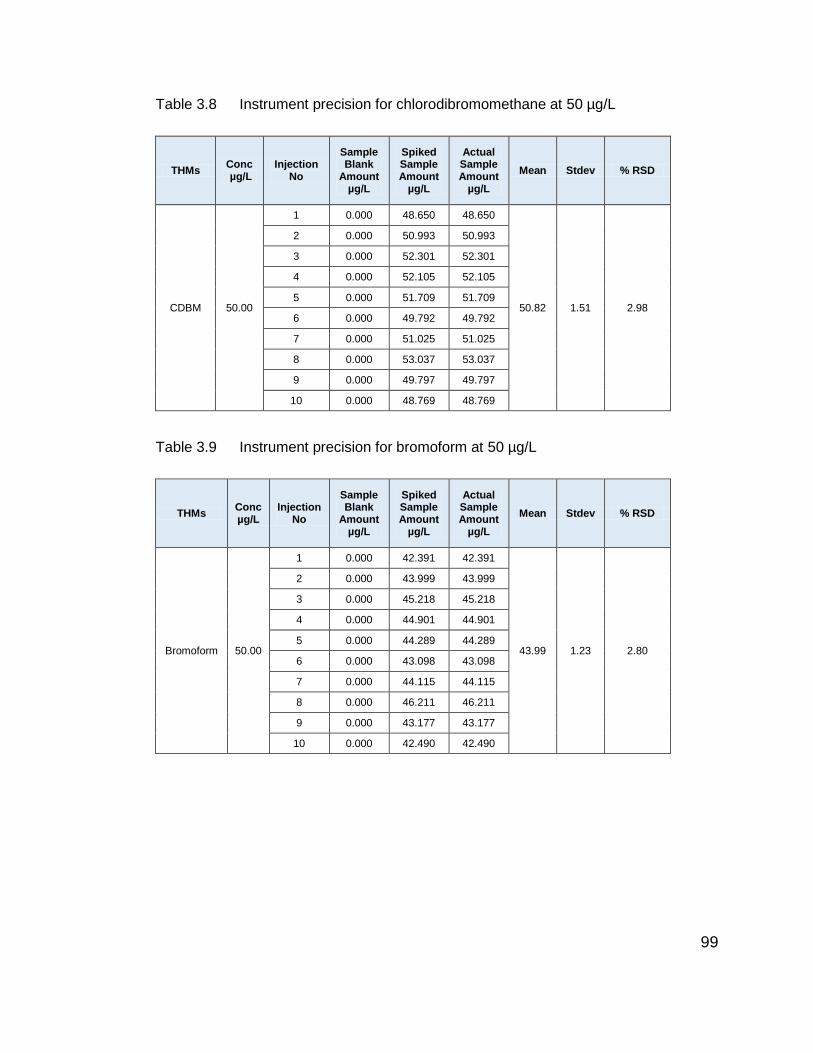
99
Table 3.8 Instrument precision for chlorodibromomethane at 50 µg/L
THMs Conc µg/L
Injection No
Sample Blank
Amount µg/L
Spiked Sample Amount
µg/L
Actual Sample Amount
µg/L
Mean Stdev % RSD
CDBM 50.00
1 0.000 48.650 48.650
50.82 1.51 2.98
2 0.000 50.993 50.993
3 0.000 52.301 52.301
4 0.000 52.105 52.105
5 0.000 51.709 51.709
6 0.000 49.792 49.792
7 0.000 51.025 51.025
8 0.000 53.037 53.037
9 0.000 49.797 49.797
10 0.000 48.769 48.769
Table 3.9 Instrument precision for bromoform at 50 µg/L
THMs Conc µg/L
Injection No
Sample Blank
Amount µg/L
Spiked Sample Amount
µg/L
Actual Sample Amount
µg/L
Mean Stdev % RSD
Bromoform 50.00
1 0.000 42.391 42.391
43.99 1.23 2.80
2 0.000 43.999 43.999
3 0.000 45.218 45.218
4 0.000 44.901 44.901
5 0.000 44.289 44.289
6 0.000 43.098 43.098
7 0.000 44.115 44.115
8 0.000 46.211 46.211
9 0.000 43.177 43.177
10 0.000 42.490 42.490

100
3.2.4 Matrix effect on Recovery
Table 3.10 Recovery based on matrices at 50 µg/L
Sample THMs Conc µg/L
Inj. No
Unspiked Sample Amount
µg/L
Spiked Sample Amount
µg/L
Theoretical Concentratio
n µg/L % Recovery
Borehole Water
Chloroform 50
1 1.657 44.059 51.657 85.29
2 1.500 45.000 51.500 87.38
3 1.658 44.693 51.658 86.52
Borehole Water
BDCM 50
1 0.110 46.005 50.110 91.81
2 0.120 45.321 50.120 90.42
3 0.132 46.665 50.132 93.08
Borehole Water
CDBM 50
1 0.052 41.052 50.052 82.02
2 0.060 42.000 50.060 83.90
3 0.065 41.031 50.065 81.96
Borehole Water
Bromoform 50
1 0.000 40.696 50.000 81.39
2 0.000 40.700 50.000 81.40
3 0.000 40.650 50.000 81.30
Table 3.11 Recovery based on matrices at 150 µg/L
Sample THMs Conc µg/L
Inj. No
Unspiked Sample Amount
µg/L
Spiked Sample Amount
µg/L
Theoretical Concentration
µg/L % Recovery
Borehole Water
Chloroform
150
1 1.657 151.200 151.657 99.70
2 1.500 151.300 151.500 99.87
3 1.658 151.640 151.658 99.99
Borehole Water
BDCM 150
1 0.110 169.600 150.110 112.98
2 0.120 167.000 150.120 111.24
3 0.132 166.100 150.132 110.64
Borehole Water
CDBM 150
1 0.052 157.400 150.052 104.90
2 0.060 157.600 150.060 105.02
3 0.065 156.321 150.065 104.17
Borehole Water
Bromoform
150
1 0.000 153.400 150.000 102.27
2 0.000 153.640 150.000 102.43
3 0.000 153.900 150.000 102.60
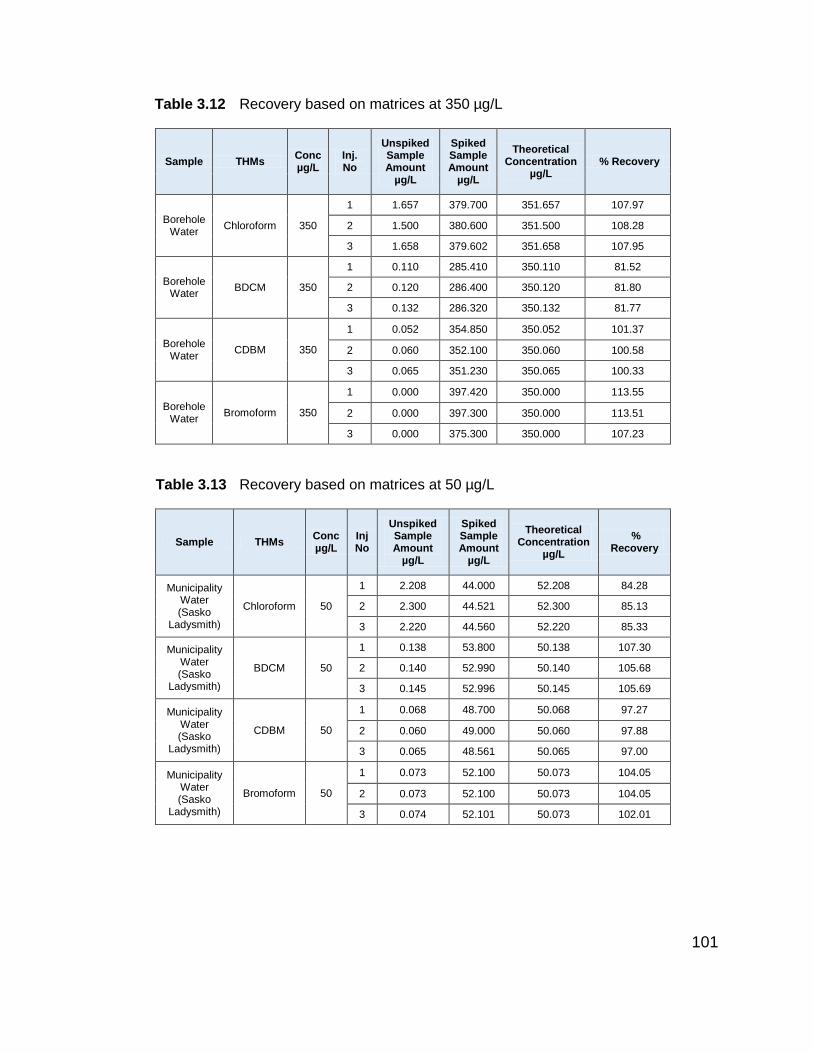
101
Table 3.12 Recovery based on matrices at 350 µg/L
Sample THMs Conc µg/L
Inj. No
Unspiked Sample Amount
µg/L
Spiked Sample Amount
µg/L
Theoretical Concentration
µg/L % Recovery
Borehole Water
Chloroform 350
1 1.657 379.700 351.657 107.97
2 1.500 380.600 351.500 108.28
3 1.658 379.602 351.658 107.95
Borehole Water
BDCM 350
1 0.110 285.410 350.110 81.52
2 0.120 286.400 350.120 81.80
3 0.132 286.320 350.132 81.77
Borehole Water
CDBM 350
1 0.052 354.850 350.052 101.37
2 0.060 352.100 350.060 100.58
3 0.065 351.230 350.065 100.33
Borehole Water
Bromoform 350
1 0.000 397.420 350.000 113.55
2 0.000 397.300 350.000 113.51
3 0.000 375.300 350.000 107.23
Table 3.13 Recovery based on matrices at 50 µg/L
Sample THMs Conc µg/L
Inj No
Unspiked Sample Amount
µg/L
Spiked Sample Amount
µg/L
Theoretical Concentration
µg/L
% Recovery
Municipality Water (Sasko
Ladysmith)
Chloroform 50
1 2.208 44.000 52.208 84.28
2 2.300 44.521 52.300 85.13
3 2.220 44.560 52.220 85.33
Municipality Water (Sasko
Ladysmith)
BDCM 50
1 0.138 53.800 50.138 107.30
2 0.140 52.990 50.140 105.68
3 0.145 52.996 50.145 105.69
Municipality Water (Sasko
Ladysmith)
CDBM 50
1 0.068 48.700 50.068 97.27
2 0.060 49.000 50.060 97.88
3 0.065 48.561 50.065 97.00
Municipality Water (Sasko
Ladysmith)
Bromoform 50
1 0.073 52.100 50.073 104.05
2 0.073 52.100 50.073 104.05
3 0.074 52.101 50.073 102.01

102
Table 3.14 Recovery based on matrices at 150 µg/L
Sample THMs Conc µg/L
Inj. No
Unspiked Sample Amount
µg/L
Spiked Sample Amount
µg/L
Theoretical Concentration
µg/L
% Recovery
Municipality Water (Sasko
Ladysmith)
Chloroform 150
1 2.208 162.600 152.208 106.83
2 2.300 163.600 152.300 107.42
3 2.220 164.600 152.220 108.13
Municipality Water (Sasko
Ladysmith)
BDCM 150
1 0.138 176.100 150.138 117.29
2 0.140 174.300 150.140 116.09
3 0.145 176.100 150.145 117.29
Municipality Water (Sasko
Ladysmith)
CDBM 150
1 0.068 169.400 150.068 112.88
2 0.060 168.000 150.060 111.96
3 0.065 169.000 150.065 112.62
Municipality Water (Sasko
Ladysmith)
Bromoform 150
1 0.073 161.100 150.073 107.35
2 0.073 160.320 150.073 106.82
3 0.074 161.990 150.074 107.94
Table 3.15 Recovery based on matrices at 350 µg/L
Sample THMs Conc µg/L
Inj.
No
Unspiked Sample Amount
µg/L
Spiked Sample Amount
µg/L
Theoretical Concentration
µg/L
% Recovery
Municipality Water (Sasko
Ladysmith)
Chloroform 350
1 2.208 396.040 352.208 112.44
2 2.300 395.300 352.300 112.21
3 2.220 396.100 352.220 112.46
Municipality Water (Sasko
Ladysmith)
BDCM 350
1 0.138 285.410 350.138 81.51
2 0.140 284.900 350.140 81.37
3 0.145 289.310 350.145 82.63
Municipality Water (Sasko
Ladysmith)
CDBM 350
1 0.068 354.850 350.068 101.37
2 0.060 353.210 350.060 100.90
3 0.065 354.610 350.065 101.30
Municipality Water (Sasko
Ladysmith)
Bromoform 350
1 0.073 397.420 350.073 113.52
2 0.073 396.300 350.073 113.20
3 0.074 397.800 350.074 113.63

103
Table 3.16 Recovery based on matrices at 50 µg/L
Sample THMs Conc µg/L
Inj. No
Unspiked Sample Amount
µg/L
Spiked Sample Amount
µg/L
Theoretical Concentration
µg/L
% Recovery
Underground Water
Chloroform 50
1 2.437 44.119 52.437 84.14
2 3.463 44.200 53.463 82.67
3 2.455 43.000 52.455 81.98
Underground Water
BDCM 50
1 0.079 48.356 50.079 96.56
2 0.090 49.000 50.090 97.82
3 0.060 49.321 50.060 98.52
Underground Water
CDBM 50
1 0.052 44.864 50.052 89.63
2 0.050 45.000 50.050 89.91
3 0.033 45.369 50.033 90.68
Underground Water
Bromoform 50
1 0.069 45.296 50.069 90.47
2 0.056 45.330 50.056 90.56
3 0.060 45.630 50.060 91.15
Table 3.17 Recovery based on matrices at 150 µg/L
Sample THMs Conc µg/L
Inj. No
Unspiked Sample Amount
µg/L
Spiked Sample Amount
µg/L
Theoretical Concentration
µg/L
% Recovery
Underground Water
Chloroform 150
1 2.437 139.400 152.437 91.45
2 3.463 140.321 153.463 91.44
3 2.455 139.357 152.455 91.41
Underground Water
BDCM 150
1 0.079 173.800 150.079 115.81
2 0.090 171.320 150.090 114.14
3 0.060 170.321 150.060 113.50
Underground Water
CDBM 150
1 0.052 146.800 150.052 97.83
2 0.050 144.600 150.050 96.37
3 0.033 146.900 150.033 97.91
Underground Water
Bromoform 150
1 0.069 143.100 150.069 95.36
2 0.056 144.321 150.056 96.18
3 0.060 140.358 150.060 93.53

104
Table 3.18 Recovery based on matrices at 350 µg/L
Sample THMs Conc µg/L
Inj. No
Unspiked Sample Amount
µg/L
Spiked Sample Amount
µg/L
Theoretical Concentration
µg/L
% Recovery
Underground Water
Chloroform 350
1 2.437 412.100 352.437 116.93
2 3.463 410.300 353.463 116.08
3 2.455 411.980 352.455 116.89
Underground Water
BDCM 350
1 0.079 294.900 350.079 84.24
2 0.090 292.300 350.090 83.49
3 0.060 293.600 350.060 83.87
Underground Water
CDBM 350
1 0.052 362.800 350.052 103.64
2 0.050 361.320 350.050 103.22
3 0.033 360.300 350.033 102.93
Underground Water
Bromoform 350
1 0.069 412.300 350.069 117.78
2 0.056 413.600 350.056 118.15
3 0.060 413.900 350.060 118.24
Table 3.19 Recovery based on matrices at 50 µg/L
Sample THMs Conc µg/L
Inj. No
Unspiked Sample Amount
µg/L
Spiked Sample Amount
µg/L
Theoretical Concentration
µg/L % Recovery
Sea water Chloroform 50
1 2.640 44.640 52.640 84.80
2 2.932 45.632 52.932 86.21
3 2.745 44.98 52.745 85.28
Sea water BDCM 50
1 2.941 62.972 52.941 118.95
2 2.966 63.91 52.966 120.66
3 2.974 61.789 52.974 116.64
Sea water CDBM 50
1 15.601 76.390 65.601 116.45
2 15.631 76.65 65.631 116.79
3 15.996 76.987 65.996 116.65
Sea water Bromoform 50
1 259.016 312.057 309.016 100.98
2 260.397 311.1 310.397 100.23
3 260.631 312.74 310.631 100.68

105
Table 3.20 Recovery based on matrices at 150 µg/L
Sample THMs Conc µg/L
Inj.No
Unspiked Sample Amount
µg/L
Spiked Sample Amount
µg/L
Theoretical Concentration
µg/L % Recovery
Sea water Chloroform 150
1 2.640 148.513 152.640 97.30
2 2.932 148.321 152.932 96.98
3 2.745 147.998 152.745 96.89
Sea water BDCM 150
1 2.941 178.823 152.941 116.92
2 2.966 176.321 152.966 115.27
3 2.974 173.651 152.974 113.52
Sea water CDBM 150
1 15.601 199.181 165.601 120.28
2 15.631 198.61 165.631 119.91
3 15.996 199.756 165.996 120.34
Sea water Bromoform 150
1 259.016 424.016 409.016 103.67
2 260.397 423.65 410.397 103.23
3 260.631 425.698 410.631 103.67
Table 3.21 Recovery based on matrices at 350 µg/L
Sample THMs Conc µg/L
Inj. No
Unspiked Sample Amount
µg/L
Spiked Sample Amount
µg/L
Theoretical Concentration
µg/L % Recovery
Sea water Chloroform 350
1 2.640 349.000 352.640 98.97
2 2.932 350.361 352.932 99.27
3 2.745 349.651 352.745 99.12
Sea water BDCM 350
1 2.941 288.000 352.941 81.60
2 2.966 289.321 352.966 81.97
3 2.974 288.634 352.974 81.77
Sea water CDBM 350
1 15.601 316.005 365.601 86.43
2 15.631 314.97 365.631 86.14
3 15.996 315.97 365.996 86.33
Sea water Bromoform 350
1 259.016 663.656 609.016 108.97
2 260.397 660.874 610.397 108.27
3 260.631 663.111 610.631 108.59
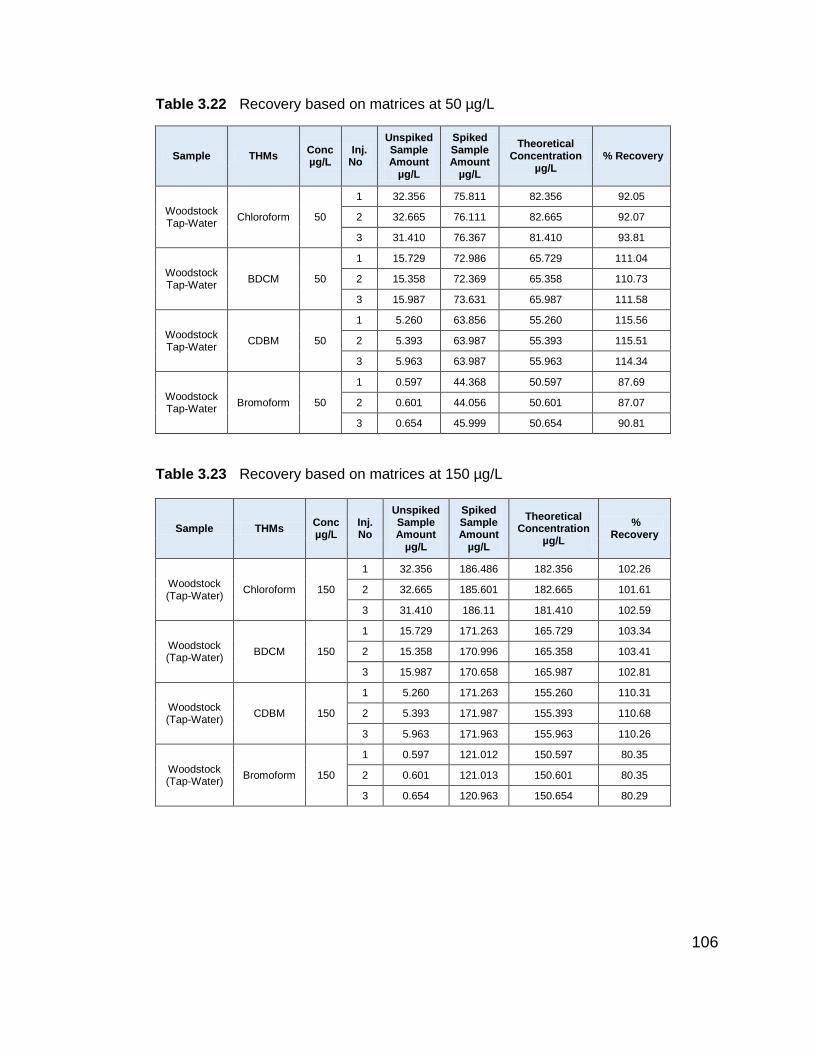
106
Table 3.22 Recovery based on matrices at 50 µg/L
Sample THMs Conc µg/L
Inj. No
Unspiked Sample Amount
µg/L
Spiked Sample Amount
µg/L
Theoretical Concentration
µg/L % Recovery
Woodstock Tap-Water
Chloroform 50
1 32.356 75.811 82.356 92.05
2 32.665 76.111 82.665 92.07
3 31.410 76.367 81.410 93.81
Woodstock Tap-Water
BDCM 50
1 15.729 72.986 65.729 111.04
2 15.358 72.369 65.358 110.73
3 15.987 73.631 65.987 111.58
Woodstock Tap-Water
CDBM 50
1 5.260 63.856 55.260 115.56
2 5.393 63.987 55.393 115.51
3 5.963 63.987 55.963 114.34
Woodstock Tap-Water
Bromoform 50
1 0.597 44.368 50.597 87.69
2 0.601 44.056 50.601 87.07
3 0.654 45.999 50.654 90.81
Table 3.23 Recovery based on matrices at 150 µg/L
Sample THMs Conc µg/L
Inj. No
Unspiked Sample Amount
µg/L
Spiked Sample Amount
µg/L
Theoretical Concentration
µg/L
% Recovery
Woodstock (Tap-Water)
Chloroform 150
1 32.356 186.486 182.356 102.26
2 32.665 185.601 182.665 101.61
3 31.410 186.11 181.410 102.59
Woodstock (Tap-Water)
BDCM 150
1 15.729 171.263 165.729 103.34
2 15.358 170.996 165.358 103.41
3 15.987 170.658 165.987 102.81
Woodstock (Tap-Water)
CDBM 150
1 5.260 171.263 155.260 110.31
2 5.393 171.987 155.393 110.68
3 5.963 171.963 155.963 110.26
Woodstock (Tap-Water)
Bromoform 150
1 0.597 121.012 150.597 80.35
2 0.601 121.013 150.601 80.35
3 0.654 120.963 150.654 80.29

107
Table 3.24 Recovery based on matrices at 350 µg/L
Sample THMs Conc µg/L
Inj. No
Unspiked Sample Amount
µg/L
Spiked Sample Amount
µg/L
Theoretical Concentration
µg/L % Recovery
Woodstock Tap-Water
Chloroform 350
1 32.356 413.000 382.356 108.01
2 32.665 410.321 382.665 107.23
3 31.410 409.555 381.410 107.38
Woodstock Tap-Water
BDCM 350
1 15.729 358.616 365.729 98.06
2 15.358 359.61 365.358 98.43
3 15.987 356.122 365.987 97.30
Woodstock Tap-Water
CDBM 350
1 5.260 285.886 355.260 80.47
2 5.393 286.321 355.393 80.56
3 5.963 284.999 355.963 80.06
Woodstock Tap-Water
Bromoform 350
1 0.597 358.195 350.597 102.17
2 0.601 359.61 350.601 102.57
3 0.654 359.74 350.654 102.59
Table 3.25 Recovery based on matrices at 50 µg/L
Sample THMs Conc µg/L
Inj. No
Unspiked Sample Amount
µg/L
Spiked Sample Amount
µg/L
Theoretical Concentration
µg/L % Recovery
Johnson-Johnson Medical
Chloroform 50
1 0.580 46.101 50.580 91.14
2 0.560 45.21 50.560 89.42
3 0.511 45.631 50.511 90.34
Johnson-Johnson Medical
BDCM 50
1 0.775 59.235 50.775 116.66
2 0.758 58.77 50.758 115.78
3 0.761 59.111 50.761 116.45
Johnson-Johnson Medical
CDBM 50
1 0.550 59.463 50.550 117.63
2 0.561 59.321 50.561 117.33
3 0.557 56.789 50.557 112.33
Johnson-Johnson Medical
Bromoform 50
1 0.229 52.148 50.229 103.82
2 0.220 51.369 50.220 102.29
3 0.231 51.654 50.231 102.83
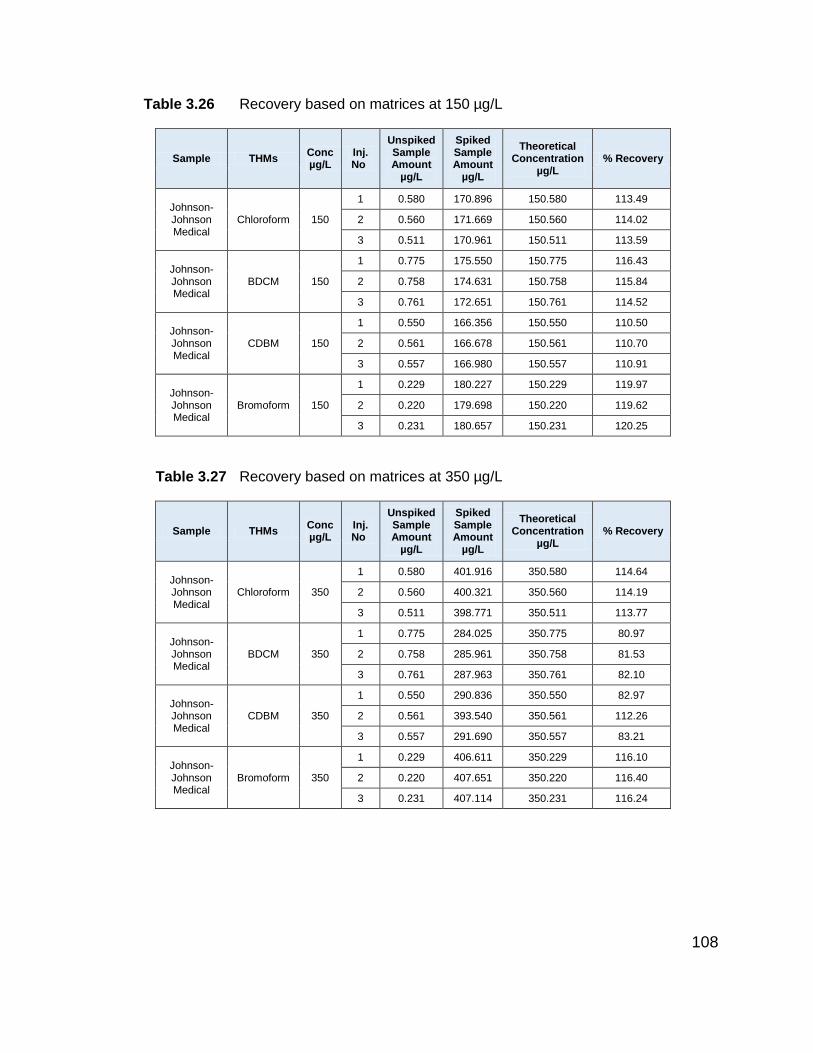
108
Table 3.26 Recovery based on matrices at 150 µg/L
Sample THMs Conc µg/L
Inj. No
Unspiked Sample Amount
µg/L
Spiked Sample Amount
µg/L
Theoretical Concentration
µg/L % Recovery
Johnson-Johnson Medical
Chloroform 150
1 0.580 170.896 150.580 113.49
2 0.560 171.669 150.560 114.02
3 0.511 170.961 150.511 113.59
Johnson-Johnson Medical
BDCM 150
1 0.775 175.550 150.775 116.43
2 0.758 174.631 150.758 115.84
3 0.761 172.651 150.761 114.52
Johnson-Johnson Medical
CDBM 150
1 0.550 166.356 150.550 110.50
2 0.561 166.678 150.561 110.70
3 0.557 166.980 150.557 110.91
Johnson-Johnson Medical
Bromoform 150
1 0.229 180.227 150.229 119.97
2 0.220 179.698 150.220 119.62
3 0.231 180.657 150.231 120.25
Table 3.27 Recovery based on matrices at 350 µg/L
Sample THMs Conc µg/L
Inj. No
Unspiked Sample Amount
µg/L
Spiked Sample Amount
µg/L
Theoretical Concentration
µg/L % Recovery
Johnson-Johnson Medical
Chloroform 350
1 0.580 401.916 350.580 114.64
2 0.560 400.321 350.560 114.19
3 0.511 398.771 350.511 113.77
Johnson-Johnson Medical
BDCM 350
1 0.775 284.025 350.775 80.97
2 0.758 285.961 350.758 81.53
3 0.761 287.963 350.761 82.10
Johnson-Johnson Medical
CDBM 350
1 0.550 290.836 350.550 82.97
2 0.561 393.540 350.561 112.26
3 0.557 291.690 350.557 83.21
Johnson-Johnson Medical
Bromoform 350
1 0.229 406.611 350.229 116.10
2 0.220 407.651 350.220 116.40
3 0.231 407.114 350.231 116.24
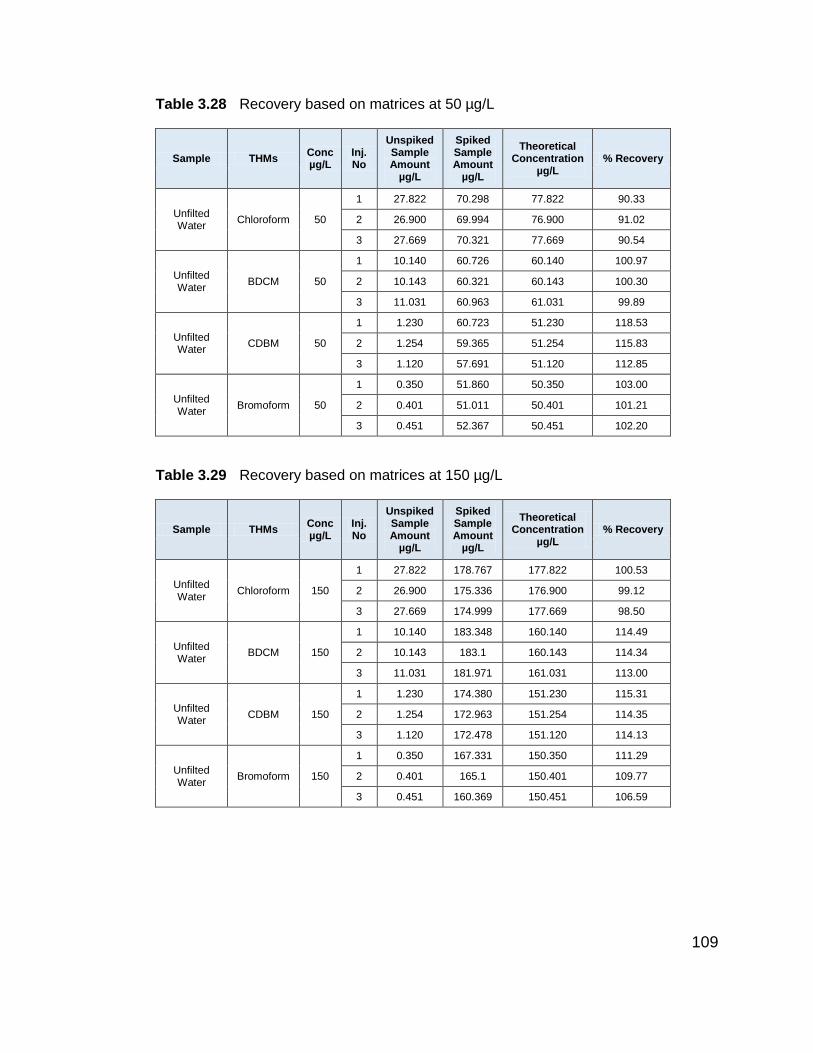
109
Table 3.28 Recovery based on matrices at 50 µg/L
Sample THMs Conc µg/L
Inj. No
Unspiked Sample Amount
µg/L
Spiked Sample Amount
µg/L
Theoretical Concentration
µg/L % Recovery
Unfilted Water
Chloroform 50
1 27.822 70.298 77.822 90.33
2 26.900 69.994 76.900 91.02
3 27.669 70.321 77.669 90.54
Unfilted Water
BDCM 50
1 10.140 60.726 60.140 100.97
2 10.143 60.321 60.143 100.30
3 11.031 60.963 61.031 99.89
Unfilted Water
CDBM 50
1 1.230 60.723 51.230 118.53
2 1.254 59.365 51.254 115.83
3 1.120 57.691 51.120 112.85
Unfilted Water
Bromoform 50
1 0.350 51.860 50.350 103.00
2 0.401 51.011 50.401 101.21
3 0.451 52.367 50.451 102.20
Table 3.29 Recovery based on matrices at 150 µg/L
Sample THMs Conc µg/L
Inj. No
Unspiked Sample Amount
µg/L
Spiked Sample Amount
µg/L
Theoretical Concentration
µg/L % Recovery
Unfilted Water
Chloroform 150
1 27.822 178.767 177.822 100.53
2 26.900 175.336 176.900 99.12
3 27.669 174.999 177.669 98.50
Unfilted Water
BDCM 150
1 10.140 183.348 160.140 114.49
2 10.143 183.1 160.143 114.34
3 11.031 181.971 161.031 113.00
Unfilted Water
CDBM 150
1 1.230 174.380 151.230 115.31
2 1.254 172.963 151.254 114.35
3 1.120 172.478 151.120 114.13
Unfilted Water
Bromoform 150
1 0.350 167.331 150.350 111.29
2 0.401 165.1 150.401 109.77
3 0.451 160.369 150.451 106.59
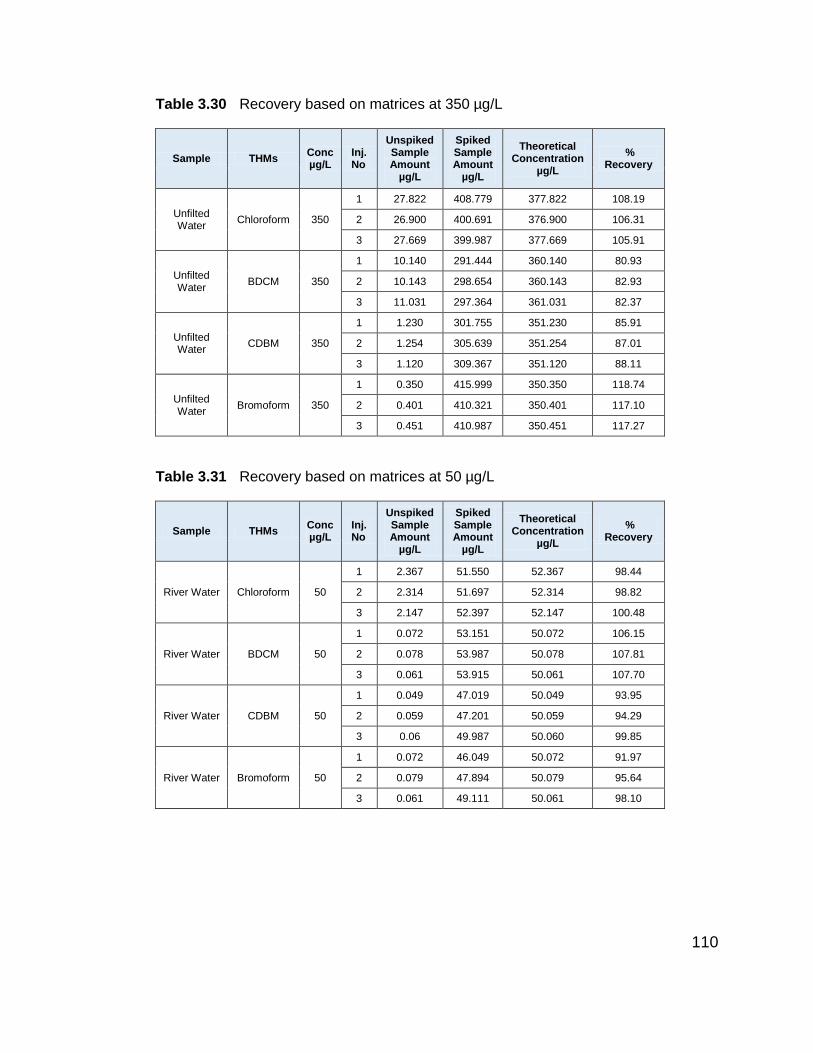
110
Table 3.30 Recovery based on matrices at 350 µg/L
Sample THMs Conc µg/L
Inj. No
Unspiked Sample Amount
µg/L
Spiked Sample Amount
µg/L
Theoretical Concentration
µg/L
% Recovery
Unfilted Water
Chloroform 350
1 27.822 408.779 377.822 108.19
2 26.900 400.691 376.900 106.31
3 27.669 399.987 377.669 105.91
Unfilted Water
BDCM 350
1 10.140 291.444 360.140 80.93
2 10.143 298.654 360.143 82.93
3 11.031 297.364 361.031 82.37
Unfilted Water
CDBM 350
1 1.230 301.755 351.230 85.91
2 1.254 305.639 351.254 87.01
3 1.120 309.367 351.120 88.11
Unfilted Water
Bromoform 350
1 0.350 415.999 350.350 118.74
2 0.401 410.321 350.401 117.10
3 0.451 410.987 350.451 117.27
Table 3.31 Recovery based on matrices at 50 µg/L
Sample THMs Conc µg/L
Inj. No
Unspiked Sample Amount
µg/L
Spiked Sample Amount
µg/L
Theoretical Concentration
µg/L
% Recovery
River Water Chloroform 50
1 2.367 51.550 52.367 98.44
2 2.314 51.697 52.314 98.82
3 2.147 52.397 52.147 100.48
River Water BDCM 50
1 0.072 53.151 50.072 106.15
2 0.078 53.987 50.078 107.81
3 0.061 53.915 50.061 107.70
River Water CDBM 50
1 0.049 47.019 50.049 93.95
2 0.059 47.201 50.059 94.29
3 0.06 49.987 50.060 99.85
River Water Bromoform 50
1 0.072 46.049 50.072 91.97
2 0.079 47.894 50.079 95.64
3 0.061 49.111 50.061 98.10
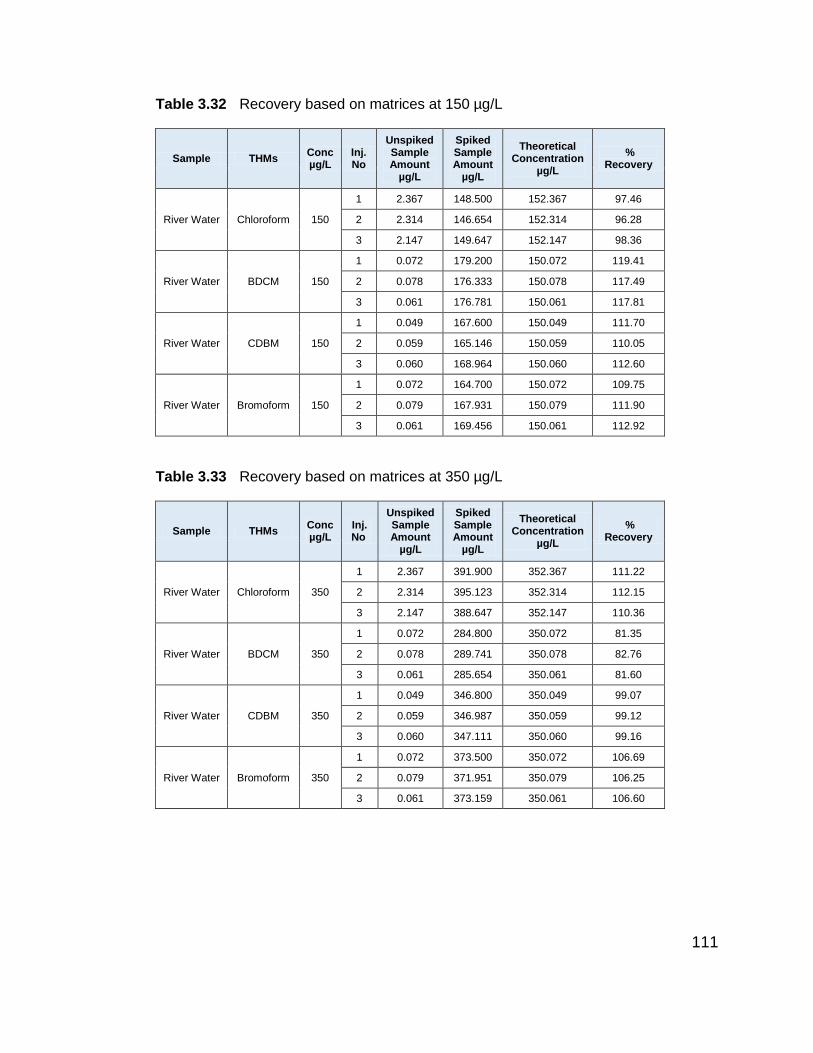
111
Table 3.32 Recovery based on matrices at 150 µg/L
Sample THMs Conc µg/L
Inj. No
Unspiked Sample Amount
µg/L
Spiked Sample Amount
µg/L
Theoretical Concentration
µg/L
% Recovery
River Water Chloroform 150
1 2.367 148.500 152.367 97.46
2 2.314 146.654 152.314 96.28
3 2.147 149.647 152.147 98.36
River Water BDCM 150
1 0.072 179.200 150.072 119.41
2 0.078 176.333 150.078 117.49
3 0.061 176.781 150.061 117.81
River Water CDBM 150
1 0.049 167.600 150.049 111.70
2 0.059 165.146 150.059 110.05
3 0.060 168.964 150.060 112.60
River Water Bromoform 150
1 0.072 164.700 150.072 109.75
2 0.079 167.931 150.079 111.90
3 0.061 169.456 150.061 112.92
Table 3.33 Recovery based on matrices at 350 µg/L
Sample THMs Conc µg/L
Inj. No
Unspiked Sample Amount
µg/L
Spiked Sample Amount
µg/L
Theoretical Concentration
µg/L
% Recovery
River Water Chloroform 350
1 2.367 391.900 352.367 111.22
2 2.314 395.123 352.314 112.15
3 2.147 388.647 352.147 110.36
River Water BDCM 350
1 0.072 284.800 350.072 81.35
2 0.078 289.741 350.078 82.76
3 0.061 285.654 350.061 81.60
River Water CDBM 350
1 0.049 346.800 350.049 99.07
2 0.059 346.987 350.059 99.12
3 0.060 347.111 350.060 99.16
River Water Bromoform 350
1 0.072 373.500 350.072 106.69
2 0.079 371.951 350.079 106.25
3 0.061 373.159 350.061 106.60
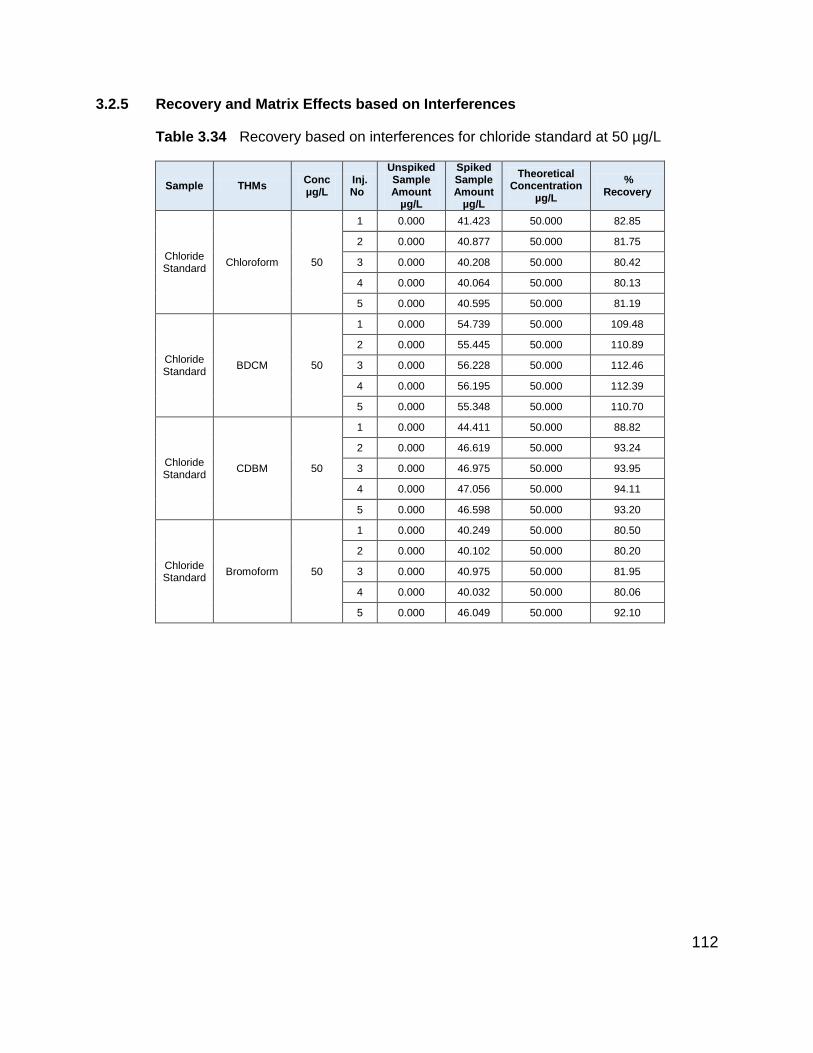
112
3.2.5 Recovery and Matrix Effects based on Interferences
Table 3.34 Recovery based on interferences for chloride standard at 50 µg/L
Sample THMs Conc µg/L
Inj. No
Unspiked Sample Amount
µg/L
Spiked Sample Amount
µg/L
Theoretical Concentration
µg/L
% Recovery
Chloride Standard
Chloroform 50
1 0.000 41.423 50.000 82.85
2 0.000 40.877 50.000 81.75
3 0.000 40.208 50.000 80.42
4 0.000 40.064 50.000 80.13
5 0.000 40.595 50.000 81.19
Chloride Standard
BDCM
50
1 0.000 54.739 50.000 109.48
2 0.000 55.445 50.000 110.89
3 0.000 56.228 50.000 112.46
4 0.000 56.195 50.000 112.39
5 0.000 55.348 50.000 110.70
Chloride Standard
CDBM 50
1 0.000 44.411 50.000 88.82
2 0.000 46.619 50.000 93.24
3 0.000 46.975 50.000 93.95
4 0.000 47.056 50.000 94.11
5 0.000 46.598 50.000 93.20
Chloride Standard
Bromoform 50
1 0.000 40.249 50.000 80.50
2 0.000 40.102 50.000 80.20
3 0.000 40.975 50.000 81.95
4 0.000 40.032 50.000 80.06
5 0.000 46.049 50.000 92.10
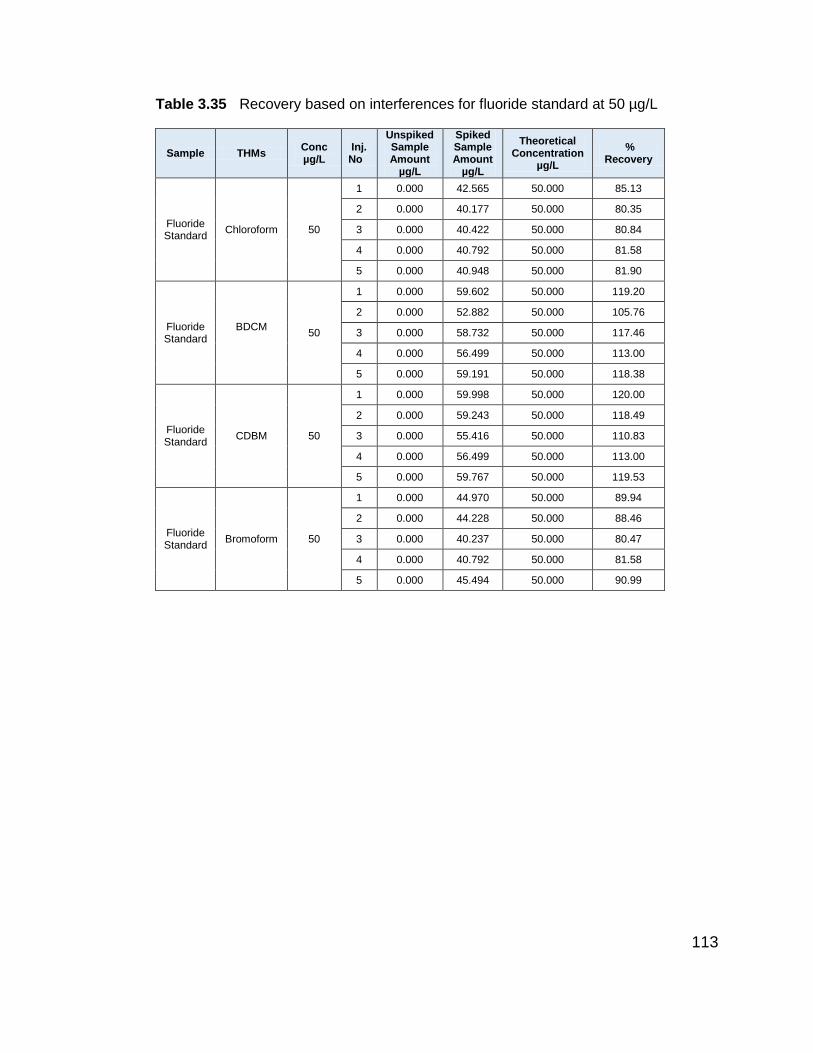
113
Table 3.35 Recovery based on interferences for fluoride standard at 50 µg/L
Sample THMs Conc µg/L
Inj. No
Unspiked Sample Amount
µg/L
Spiked Sample Amount
µg/L
Theoretical Concentration
µg/L
% Recovery
Fluoride Standard
Chloroform 50
1 0.000 42.565 50.000 85.13
2 0.000 40.177 50.000 80.35
3 0.000 40.422 50.000 80.84
4 0.000 40.792 50.000 81.58
5 0.000 40.948 50.000 81.90
Fluoride Standard
BDCM
50
1 0.000 59.602 50.000 119.20
2 0.000 52.882 50.000 105.76
3 0.000 58.732 50.000 117.46
4 0.000 56.499 50.000 113.00
5 0.000 59.191 50.000 118.38
Fluoride Standard
CDBM 50
1 0.000 59.998 50.000 120.00
2 0.000 59.243 50.000 118.49
3 0.000 55.416 50.000 110.83
4 0.000 56.499 50.000 113.00
5 0.000 59.767 50.000 119.53
Fluoride Standard
Bromoform 50
1 0.000 44.970 50.000 89.94
2 0.000 44.228 50.000 88.46
3 0.000 40.237 50.000 80.47
4 0.000 40.792 50.000 81.58
5 0.000 45.494 50.000 90.99
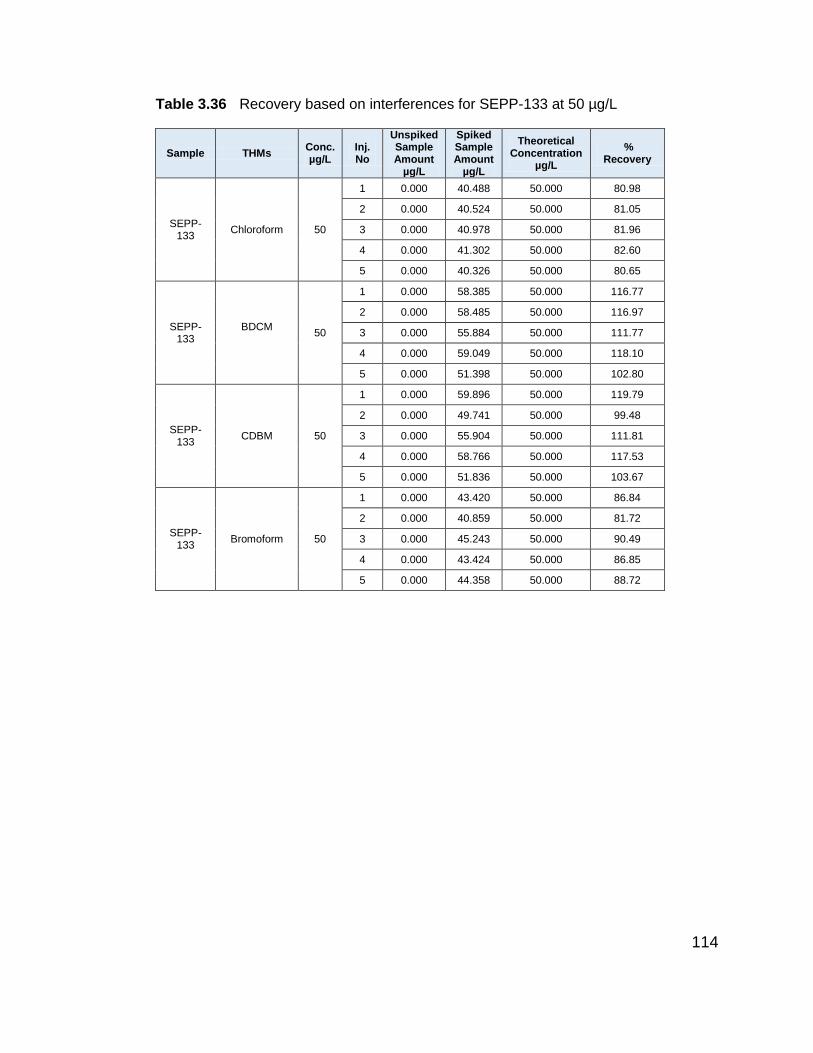
114
Table 3.36 Recovery based on interferences for SEPP-133 at 50 µg/L
Sample THMs Conc. µg/L
Inj. No
Unspiked Sample Amount
µg/L
Spiked Sample Amount
µg/L
Theoretical Concentration
µg/L
% Recovery
SEPP-133
Chloroform 50
1 0.000 40.488 50.000 80.98
2 0.000 40.524 50.000 81.05
3 0.000 40.978 50.000 81.96
4 0.000 41.302 50.000 82.60
5 0.000 40.326 50.000 80.65
SEPP-133
BDCM
50
1 0.000 58.385 50.000 116.77
2 0.000 58.485 50.000 116.97
3 0.000 55.884 50.000 111.77
4 0.000 59.049 50.000 118.10
5 0.000 51.398 50.000 102.80
SEPP-133
CDBM 50
1 0.000 59.896 50.000 119.79
2 0.000 49.741 50.000 99.48
3 0.000 55.904 50.000 111.81
4 0.000 58.766 50.000 117.53
5 0.000 51.836 50.000 103.67
SEPP-133
Bromoform 50
1 0.000 43.420 50.000 86.84
2 0.000 40.859 50.000 81.72
3 0.000 45.243 50.000 90.49
4 0.000 43.424 50.000 86.85
5 0.000 44.358 50.000 88.72
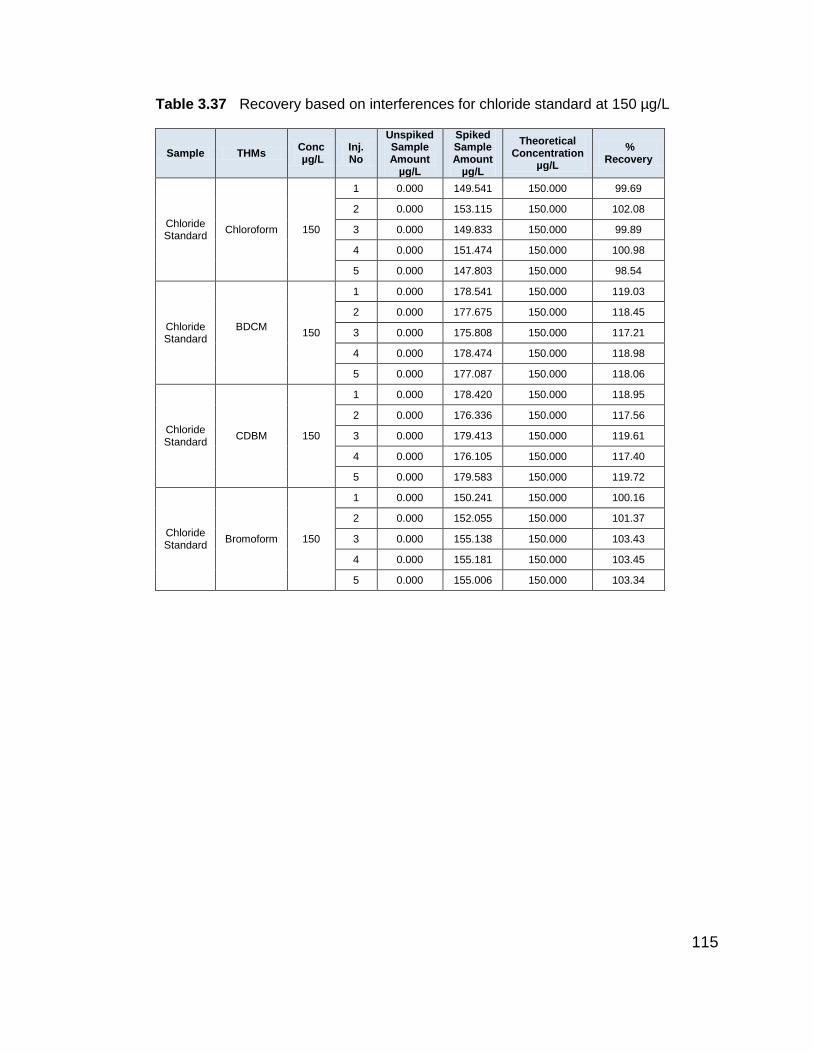
115
Table 3.37 Recovery based on interferences for chloride standard at 150 µg/L
Sample THMs Conc µg/L
Inj. No
Unspiked Sample Amount
µg/L
Spiked Sample Amount
µg/L
Theoretical Concentration
µg/L
% Recovery
Chloride Standard
Chloroform 150
1 0.000 149.541 150.000 99.69
2 0.000 153.115 150.000 102.08
3 0.000 149.833 150.000 99.89
4 0.000 151.474 150.000 100.98
5 0.000 147.803 150.000 98.54
Chloride Standard
BDCM
150
1 0.000 178.541 150.000 119.03
2 0.000 177.675 150.000 118.45
3 0.000 175.808 150.000 117.21
4 0.000 178.474 150.000 118.98
5 0.000 177.087 150.000 118.06
Chloride Standard
CDBM 150
1 0.000 178.420 150.000 118.95
2 0.000 176.336 150.000 117.56
3 0.000 179.413 150.000 119.61
4 0.000 176.105 150.000 117.40
5 0.000 179.583 150.000 119.72
Chloride Standard
Bromoform 150
1 0.000 150.241 150.000 100.16
2 0.000 152.055 150.000 101.37
3 0.000 155.138 150.000 103.43
4 0.000 155.181 150.000 103.45
5 0.000 155.006 150.000 103.34
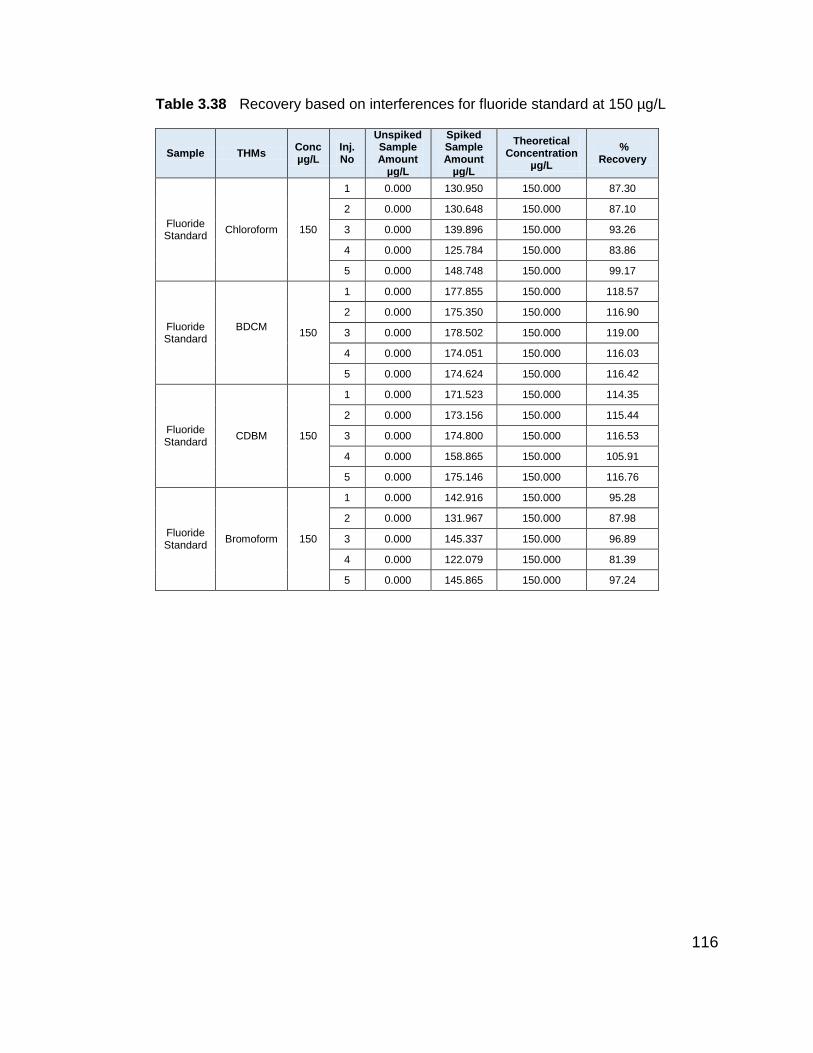
116
Table 3.38 Recovery based on interferences for fluoride standard at 150 µg/L
Sample THMs Conc µg/L
Inj. No
Unspiked Sample Amount
µg/L
Spiked Sample Amount
µg/L
Theoretical Concentration
µg/L
% Recovery
Fluoride Standard
Chloroform 150
1 0.000 130.950 150.000 87.30
2 0.000 130.648 150.000 87.10
3 0.000 139.896 150.000 93.26
4 0.000 125.784 150.000 83.86
5 0.000 148.748 150.000 99.17
Fluoride Standard
BDCM
150
1 0.000 177.855 150.000 118.57
2 0.000 175.350 150.000 116.90
3 0.000 178.502 150.000 119.00
4 0.000 174.051 150.000 116.03
5 0.000 174.624 150.000 116.42
Fluoride Standard
CDBM 150
1 0.000 171.523 150.000 114.35
2 0.000 173.156 150.000 115.44
3 0.000 174.800 150.000 116.53
4 0.000 158.865 150.000 105.91
5 0.000 175.146 150.000 116.76
Fluoride Standard
Bromoform 150
1 0.000 142.916 150.000 95.28
2 0.000 131.967 150.000 87.98
3 0.000 145.337 150.000 96.89
4 0.000 122.079 150.000 81.39
5 0.000 145.865 150.000 97.24
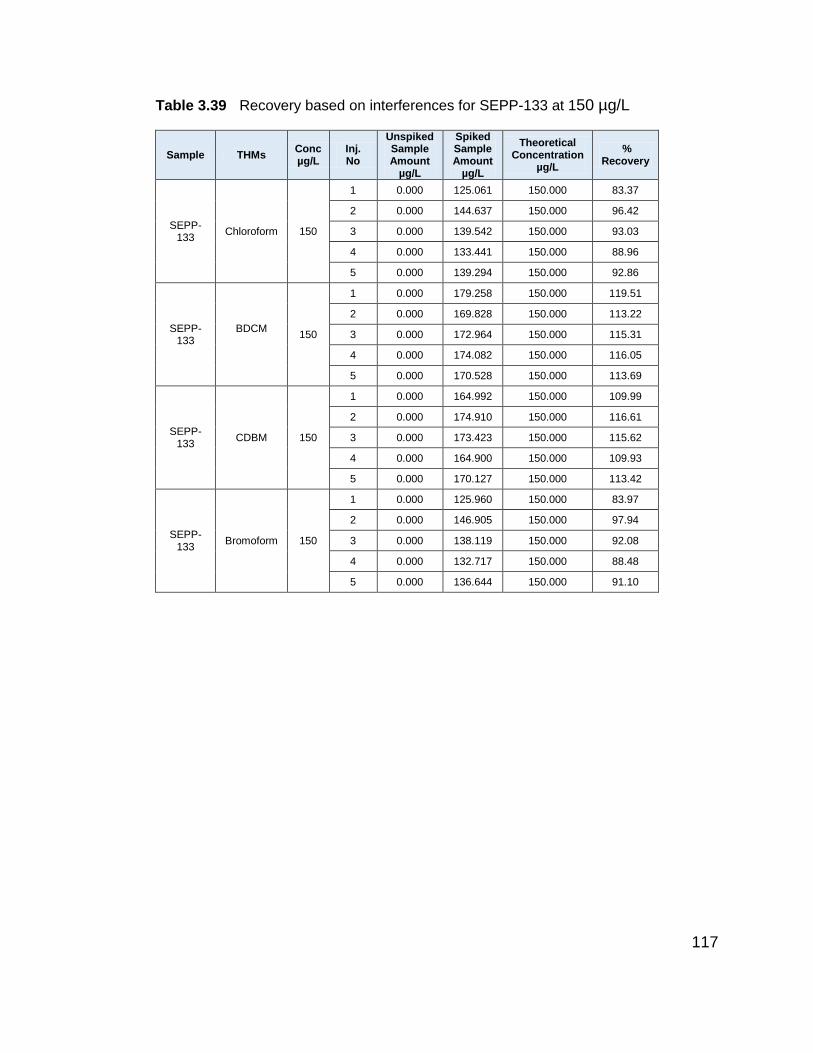
117
Table 3.39 Recovery based on interferences for SEPP-133 at 150 µg/L
Sample THMs Conc µg/L
Inj. No
Unspiked Sample Amount
µg/L
Spiked Sample Amount
µg/L
Theoretical Concentration
µg/L
% Recovery
SEPP-133
Chloroform 150
1 0.000 125.061 150.000 83.37
2 0.000 144.637 150.000 96.42
3 0.000 139.542 150.000 93.03
4 0.000 133.441 150.000 88.96
5 0.000 139.294 150.000 92.86
SEPP-133
BDCM
150
1 0.000 179.258 150.000 119.51
2 0.000 169.828 150.000 113.22
3 0.000 172.964 150.000 115.31
4 0.000 174.082 150.000 116.05
5 0.000 170.528 150.000 113.69
SEPP-133
CDBM 150
1 0.000 164.992 150.000 109.99
2 0.000 174.910 150.000 116.61
3 0.000 173.423 150.000 115.62
4 0.000 164.900 150.000 109.93
5 0.000 170.127 150.000 113.42
SEPP-133
Bromoform 150
1 0.000 125.960 150.000 83.97
2 0.000 146.905 150.000 97.94
3 0.000 138.119 150.000 92.08
4 0.000 132.717 150.000 88.48
5 0.000 136.644 150.000 91.10

118
Table 3.40 Recovery based on interferences for chloride standard at 350 µg/L
Sample THMs Conc. µg/L
Inj. No
Unspiked Sample Amount
µg/L
Spiked Sample Amount
µg/L
Theoretical Concentration
µg/L
% Recovery
Chloride Standard
Chloroform 350
1 0.000 332.217 350.000 94.92
2 0.000 280.176 350.000 80.05
3 0.000 304.408 350.000 86.97
4 0.000 282.356 350.000 80.67
5 0.000 373.850 350.000 106.81
Chloride Standard
BDCM
350
1 0.000 284.428 350.000 81.27
2 0.000 282.244 350.000 80.64
3 0.000 289.172 350.000 82.62
4 0.000 281.872 350.000 80.53
5 0.000 284.101 350.000 81.17
Chloride Standard
CDBM 350
1 0.000 281.892 350.000 80.54
2 0.000 285.560 350.000 81.59
3 0.000 285.748 350.000 81.64
4 0.000 286.884 350.000 81.97
5 0.000 286.078 350.000 81.74
Chloride Standard
Bromoform 350
1 0.000 345.929 350.000 98.84
2 0.000 292.435 350.000 83.55
3 0.000 319.806 350.000 91.37
4 0.000 384.759 350.000 109.93
5 0.000 356.472 350.000 101.85
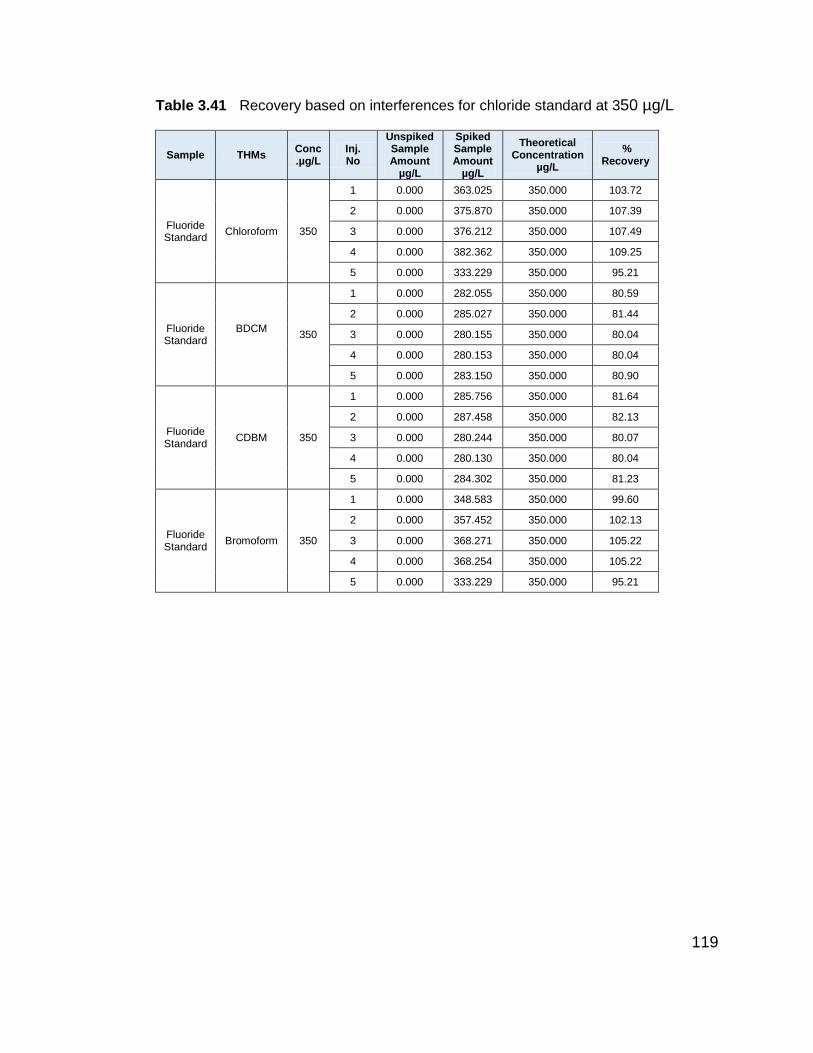
119
Table 3.41 Recovery based on interferences for chloride standard at 350 µg/L
Sample THMs Conc.µg/L
Inj. No
Unspiked Sample Amount
µg/L
Spiked Sample Amount
µg/L
Theoretical Concentration
µg/L
% Recovery
Fluoride Standard
Chloroform 350
1 0.000 363.025 350.000 103.72
2 0.000 375.870 350.000 107.39
3 0.000 376.212 350.000 107.49
4 0.000 382.362 350.000 109.25
5 0.000 333.229 350.000 95.21
Fluoride Standard
BDCM
350
1 0.000 282.055 350.000 80.59
2 0.000 285.027 350.000 81.44
3 0.000 280.155 350.000 80.04
4 0.000 280.153 350.000 80.04
5 0.000 283.150 350.000 80.90
Fluoride Standard
CDBM 350
1 0.000 285.756 350.000 81.64
2 0.000 287.458 350.000 82.13
3 0.000 280.244 350.000 80.07
4 0.000 280.130 350.000 80.04
5 0.000 284.302 350.000 81.23
Fluoride Standard
Bromoform 350
1 0.000 348.583 350.000 99.60
2 0.000 357.452 350.000 102.13
3 0.000 368.271 350.000 105.22
4 0.000 368.254 350.000 105.22
5 0.000 333.229 350.000 95.21
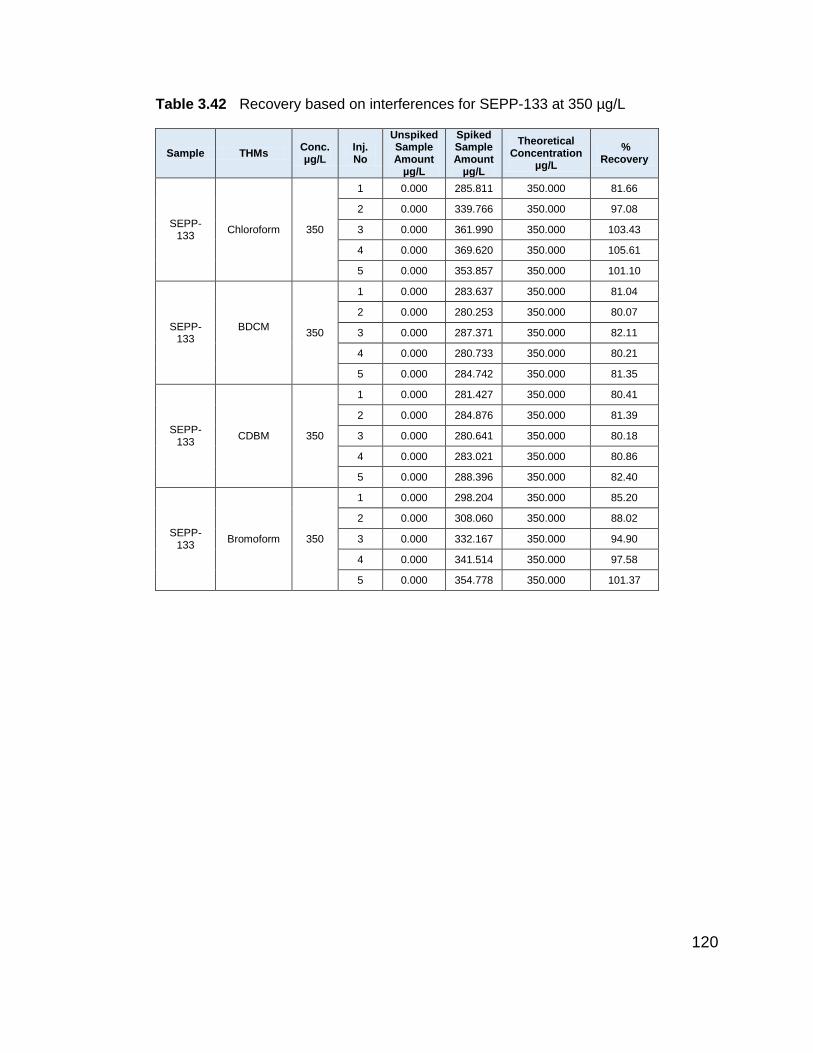
120
Table 3.42 Recovery based on interferences for SEPP-133 at 350 µg/L
Sample THMs Conc. µg/L
Inj. No
Unspiked Sample Amount
µg/L
Spiked Sample Amount
µg/L
Theoretical Concentration
µg/L
% Recovery
SEPP-133
Chloroform 350
1 0.000 285.811 350.000 81.66
2 0.000 339.766 350.000 97.08
3 0.000 361.990 350.000 103.43
4 0.000 369.620 350.000 105.61
5 0.000 353.857 350.000 101.10
SEPP-133
BDCM
350
1 0.000 283.637 350.000 81.04
2 0.000 280.253 350.000 80.07
3 0.000 287.371 350.000 82.11
4 0.000 280.733 350.000 80.21
5 0.000 284.742 350.000 81.35
SEPP-133
CDBM 350
1 0.000 281.427 350.000 80.41
2 0.000 284.876 350.000 81.39
3 0.000 280.641 350.000 80.18
4 0.000 283.021 350.000 80.86
5 0.000 288.396 350.000 82.40
SEPP-133
Bromoform 350
1 0.000 298.204 350.000 85.20
2 0.000 308.060 350.000 88.02
3 0.000 332.167 350.000 94.90
4 0.000 341.514 350.000 97.58
5 0.000 354.778 350.000 101.37
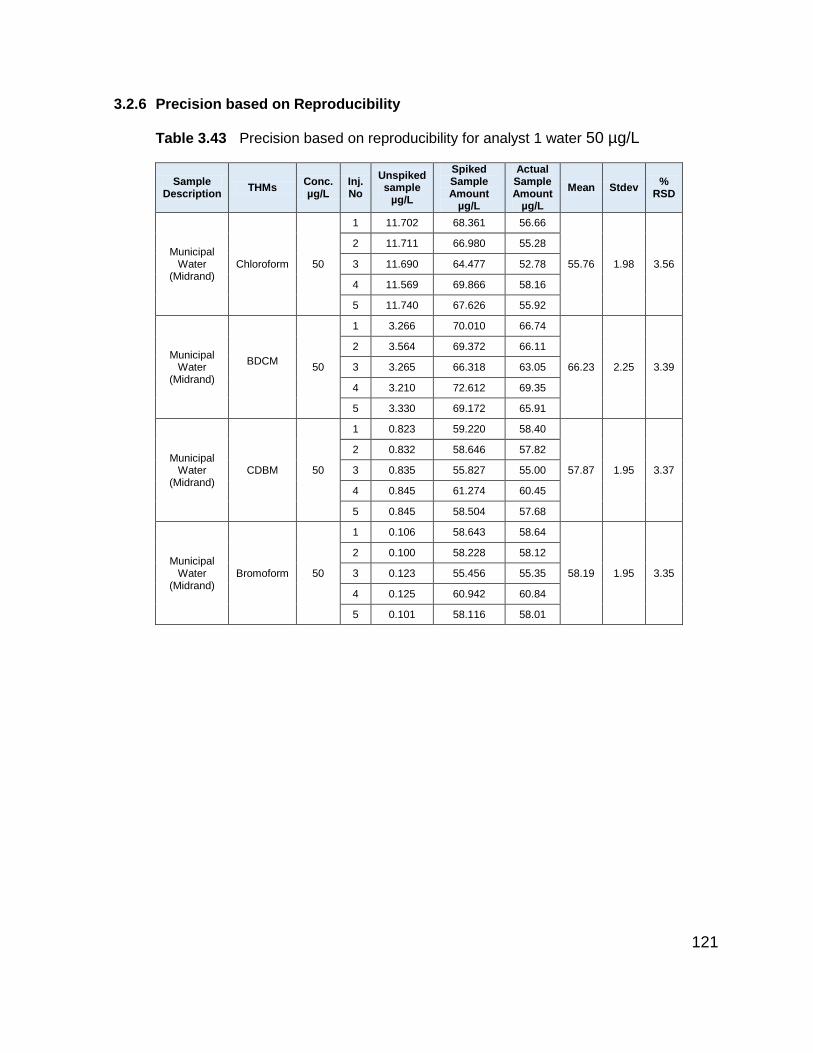
121
3.2.6 Precision based on Reproducibility
Table 3.43 Precision based on reproducibility for analyst 1 water 50 µg/L
Sample Description
THMs Conc. µg/L
Inj. No
Unspiked sample
µg/L
Spiked Sample Amount
µg/L
Actual Sample Amount
µg/L
Mean Stdev %
RSD
Municipal Water
(Midrand) Chloroform 50
1 11.702 68.361 56.66
55.76 1.98 3.56
2 11.711 66.980 55.28
3 11.690 64.477 52.78
4 11.569 69.866 58.16
5 11.740 67.626 55.92
Municipal Water
(Midrand)
BDCM
50
1 3.266 70.010 66.74
66.23 2.25 3.39
2 3.564 69.372 66.11
3 3.265 66.318 63.05
4 3.210 72.612 69.35
5 3.330 69.172 65.91
Municipal Water
(Midrand) CDBM 50
1 0.823 59.220 58.40
57.87 1.95 3.37
2 0.832 58.646 57.82
3 0.835 55.827 55.00
4 0.845 61.274 60.45
5 0.845 58.504 57.68
Municipal Water
(Midrand) Bromoform 50
1 0.106 58.643 58.64
58.19 1.95 3.35
2 0.100 58.228 58.12
3 0.123 55.456 55.35
4 0.125 60.942 60.84
5 0.101 58.116 58.01
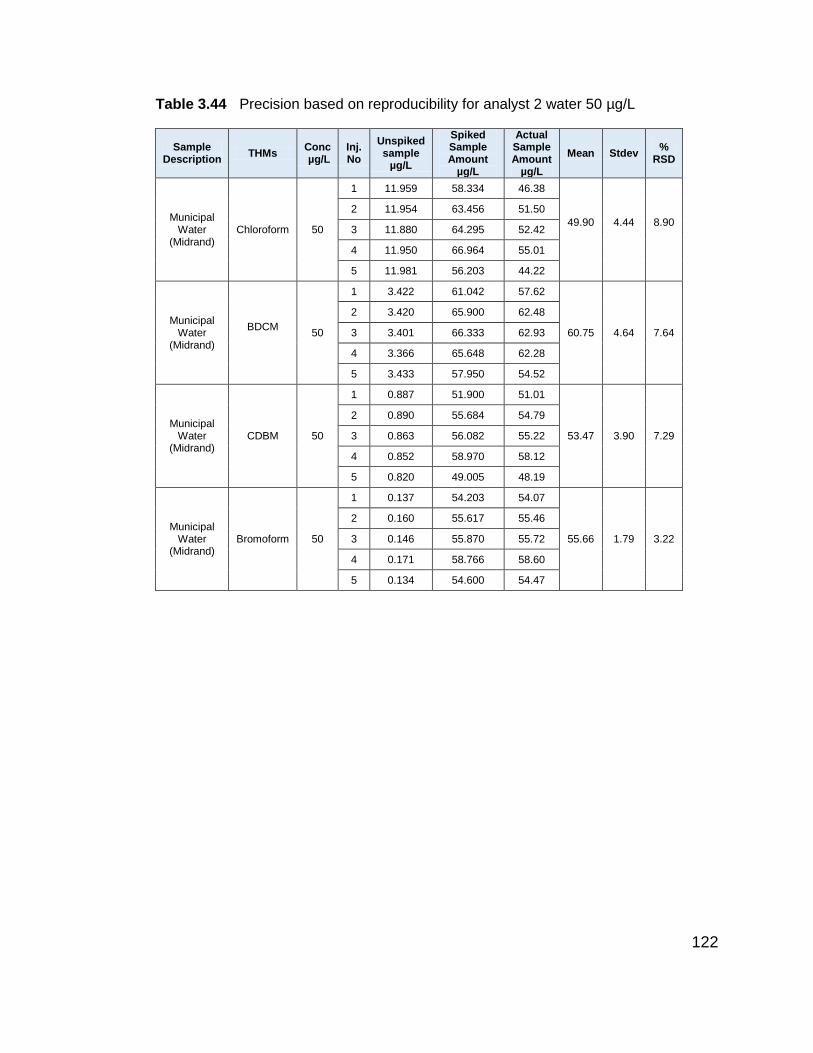
122
Table 3.44 Precision based on reproducibility for analyst 2 water 50 µg/L
Sample Description
THMs Conc µg/L
Inj. No
Unspiked sample
µg/L
Spiked Sample Amount
µg/L
Actual Sample Amount
µg/L
Mean Stdev %
RSD
Municipal Water
(Midrand) Chloroform 50
1 11.959 58.334 46.38
49.90 4.44 8.90
2 11.954 63.456 51.50
3 11.880 64.295 52.42
4 11.950 66.964 55.01
5 11.981 56.203 44.22
Municipal Water
(Midrand)
BDCM
50
1 3.422 61.042 57.62
60.75 4.64 7.64
2 3.420 65.900 62.48
3 3.401 66.333 62.93
4 3.366 65.648 62.28
5 3.433 57.950 54.52
Municipal Water
(Midrand) CDBM 50
1 0.887 51.900 51.01
53.47 3.90 7.29
2 0.890 55.684 54.79
3 0.863 56.082 55.22
4 0.852 58.970 58.12
5 0.820 49.005 48.19
Municipal Water
(Midrand) Bromoform 50
1 0.137 54.203 54.07
55.66 1.79 3.22
2 0.160 55.617 55.46
3 0.146 55.870 55.72
4 0.171 58.766 58.60
5 0.134 54.600 54.47
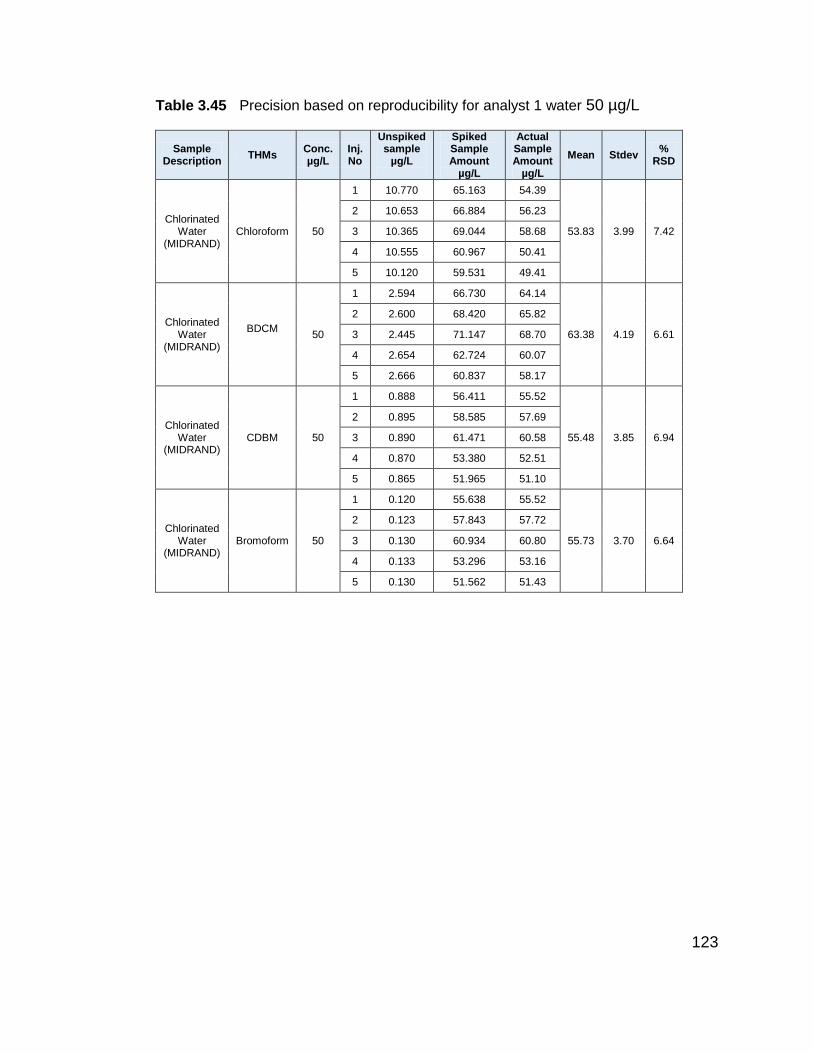
123
Table 3.45 Precision based on reproducibility for analyst 1 water 50 µg/L
Sample Description
THMs Conc. µg/L
Inj. No
Unspiked sample
µg/L
Spiked Sample Amount
µg/L
Actual Sample Amount
µg/L
Mean Stdev %
RSD
Chlorinated Water
(MIDRAND) Chloroform 50
1 10.770 65.163 54.39
53.83 3.99 7.42
2 10.653 66.884 56.23
3 10.365 69.044 58.68
4 10.555 60.967 50.41
5 10.120 59.531 49.41
Chlorinated Water
(MIDRAND)
BDCM
50
1 2.594 66.730 64.14
63.38 4.19 6.61
2 2.600 68.420 65.82
3 2.445 71.147 68.70
4 2.654 62.724 60.07
5 2.666 60.837 58.17
Chlorinated Water
(MIDRAND) CDBM 50
1 0.888 56.411 55.52
55.48 3.85 6.94
2 0.895 58.585 57.69
3 0.890 61.471 60.58
4 0.870 53.380 52.51
5 0.865 51.965 51.10
Chlorinated Water
(MIDRAND) Bromoform 50
1 0.120 55.638 55.52
55.73 3.70 6.64
2 0.123 57.843 57.72
3 0.130 60.934 60.80
4 0.133 53.296 53.16
5 0.130 51.562 51.43
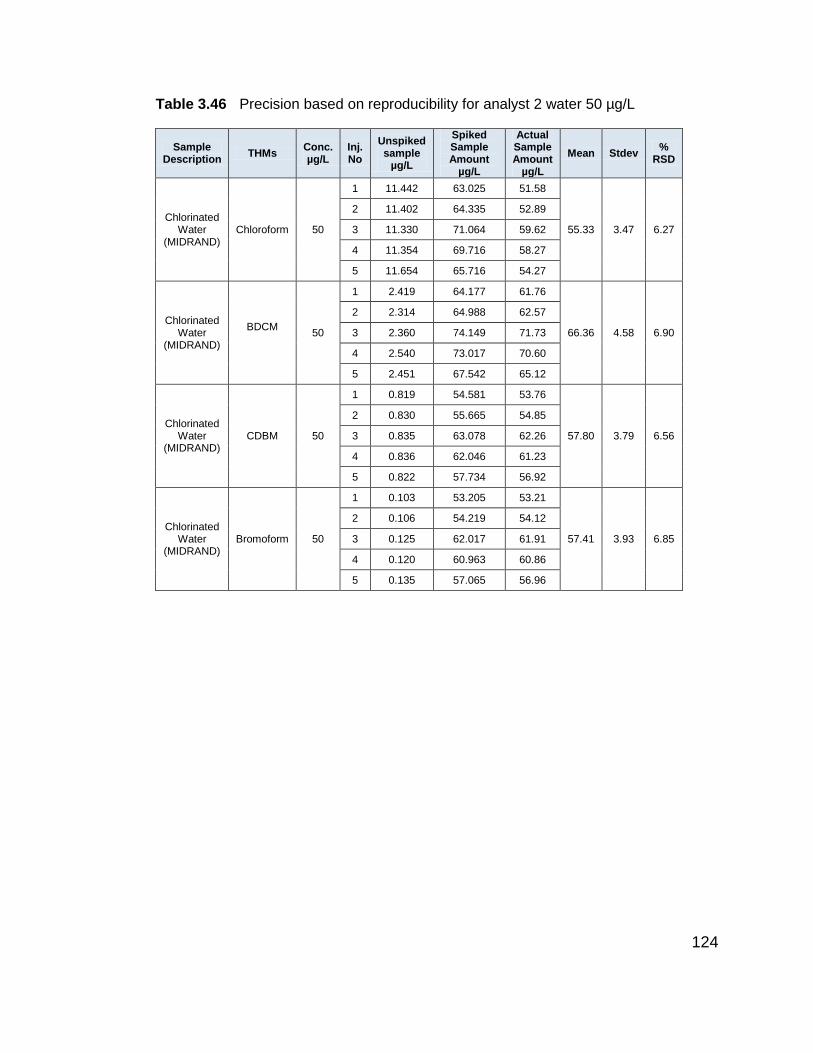
124
Table 3.46 Precision based on reproducibility for analyst 2 water 50 µg/L
Sample Description
THMs Conc. µg/L
Inj. No
Unspiked sample
µg/L
Spiked Sample Amount
µg/L
Actual Sample Amount
µg/L
Mean Stdev %
RSD
Chlorinated Water
(MIDRAND) Chloroform 50
1 11.442 63.025 51.58
55.33 3.47 6.27
2 11.402 64.335 52.89
3 11.330 71.064 59.62
4 11.354 69.716 58.27
5 11.654 65.716 54.27
Chlorinated Water
(MIDRAND)
BDCM
50
1 2.419 64.177 61.76
66.36 4.58 6.90
2 2.314 64.988 62.57
3 2.360 74.149 71.73
4 2.540 73.017 70.60
5 2.451 67.542 65.12
Chlorinated Water
(MIDRAND) CDBM 50
1 0.819 54.581 53.76
57.80 3.79 6.56
2 0.830 55.665 54.85
3 0.835 63.078 62.26
4 0.836 62.046 61.23
5 0.822 57.734 56.92
Chlorinated Water
(MIDRAND) Bromoform 50
1 0.103 53.205 53.21
57.41 3.93 6.85
2 0.106 54.219 54.12
3 0.125 62.017 61.91
4 0.120 60.963 60.86
5 0.135 57.065 56.96
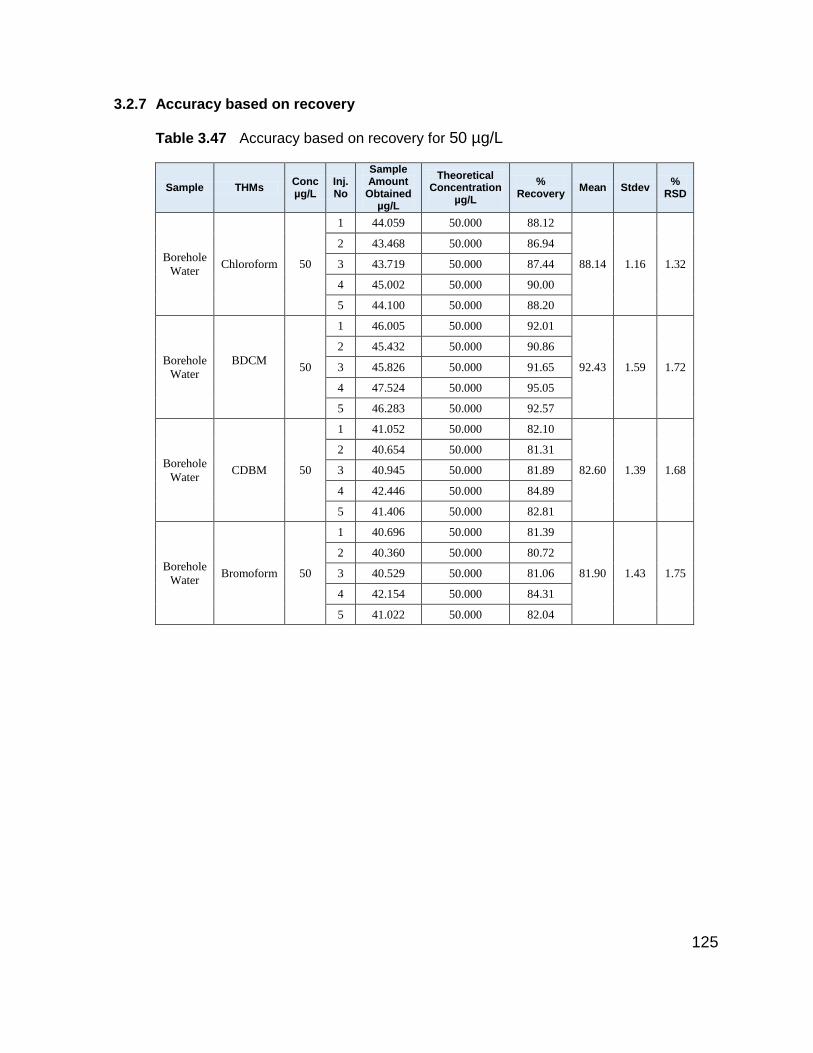
125
3.2.7 Accuracy based on recovery
Table 3.47 Accuracy based on recovery for 50 µg/L
Sample THMs Conc µg/L
Inj. No
Sample Amount
Obtained µg/L
Theoretical Concentration
µg/L
% Recovery
Mean Stdev %
RSD
Borehole
Water Chloroform 50
1 44.059 50.000 88.12
88.14 1.16 1.32
2 43.468 50.000 86.94
3 43.719 50.000 87.44
4 45.002 50.000 90.00
5 44.100 50.000 88.20
Borehole
Water
BDCM
50
1 46.005 50.000 92.01
92.43 1.59 1.72
2 45.432 50.000 90.86
3 45.826 50.000 91.65
4 47.524 50.000 95.05
5 46.283 50.000 92.57
Borehole
Water CDBM 50
1 41.052 50.000 82.10
82.60 1.39 1.68
2 40.654 50.000 81.31
3 40.945 50.000 81.89
4 42.446 50.000 84.89
5 41.406 50.000 82.81
Borehole
Water Bromoform 50
1 40.696 50.000 81.39
81.90 1.43 1.75
2 40.360 50.000 80.72
3 40.529 50.000 81.06
4 42.154 50.000 84.31
5 41.022 50.000 82.04
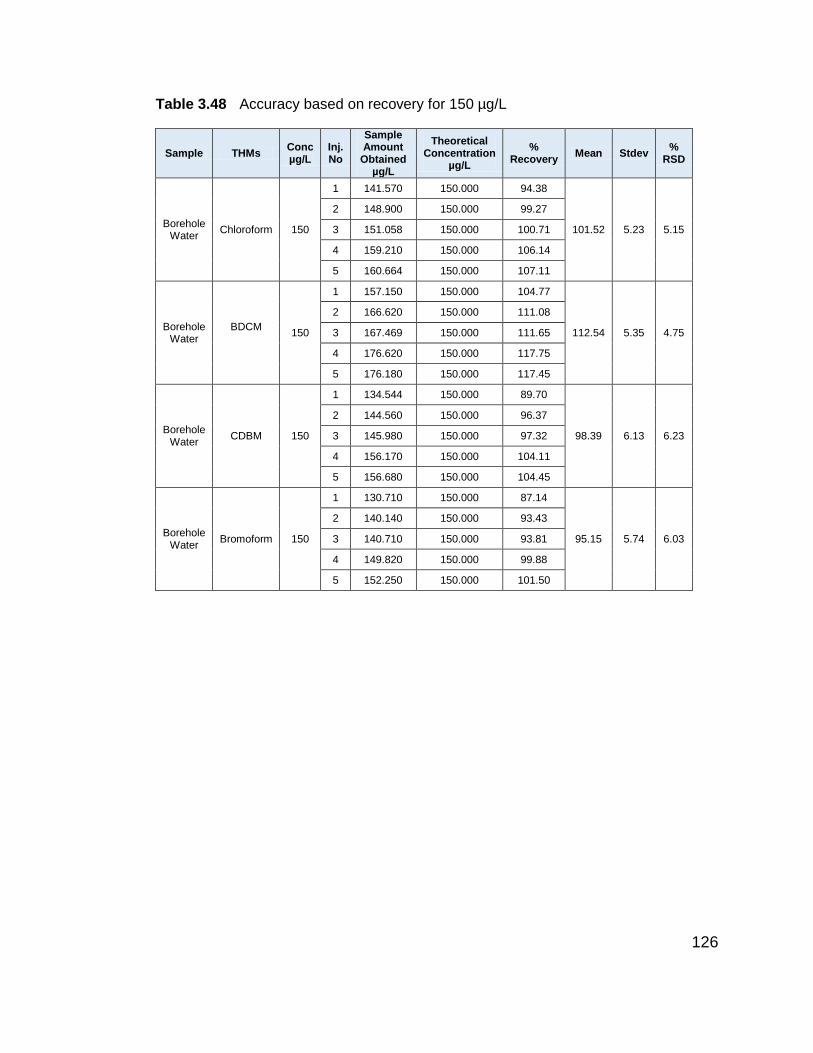
126
Table 3.48 Accuracy based on recovery for 150 µg/L
Sample THMs Conc µg/L
Inj. No
Sample Amount
Obtained µg/L
Theoretical Concentration
µg/L
% Recovery
Mean Stdev %
RSD
Borehole Water
Chloroform 150
1 141.570 150.000 94.38
101.52 5.23 5.15
2 148.900 150.000 99.27
3 151.058 150.000 100.71
4 159.210 150.000 106.14
5 160.664 150.000 107.11
Borehole Water
BDCM
150
1 157.150 150.000 104.77
112.54 5.35 4.75
2 166.620 150.000 111.08
3 167.469 150.000 111.65
4 176.620 150.000 117.75
5 176.180 150.000 117.45
Borehole Water
CDBM 150
1 134.544 150.000 89.70
98.39 6.13 6.23
2 144.560 150.000 96.37
3 145.980 150.000 97.32
4 156.170 150.000 104.11
5 156.680 150.000 104.45
Borehole Water
Bromoform 150
1 130.710 150.000 87.14
95.15 5.74 6.03
2 140.140 150.000 93.43
3 140.710 150.000 93.81
4 149.820 150.000 99.88
5 152.250 150.000 101.50
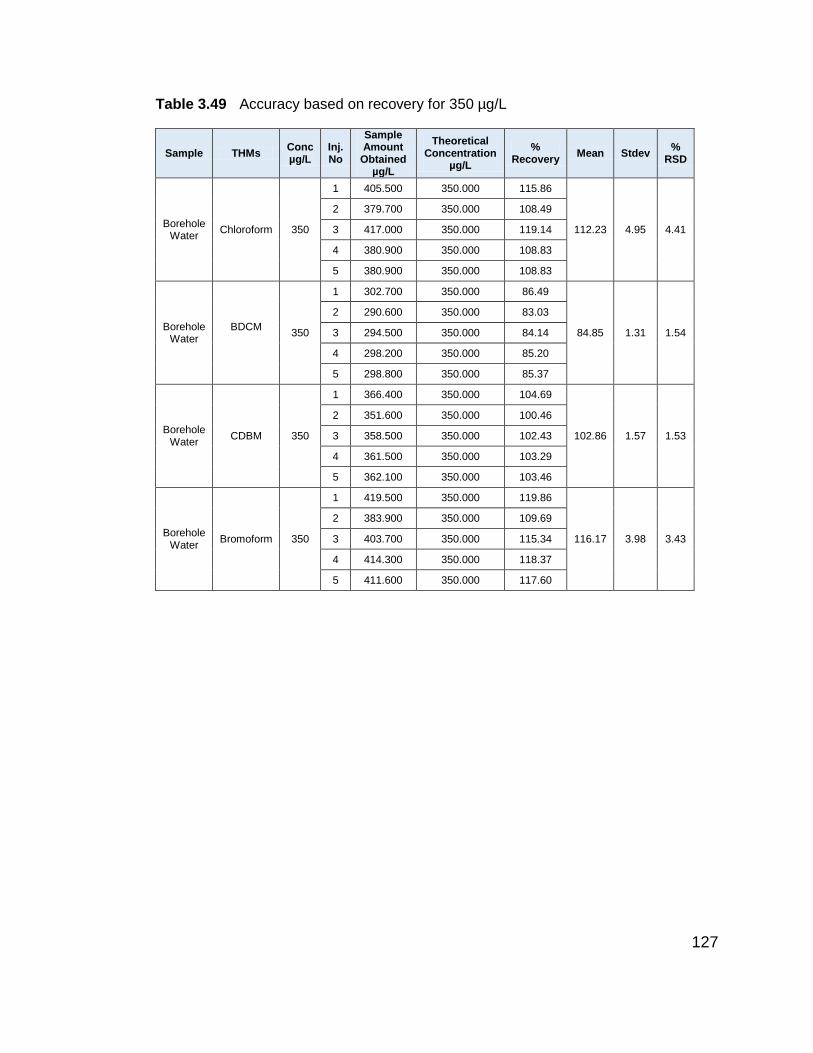
127
Table 3.49 Accuracy based on recovery for 350 µg/L
Sample THMs Conc µg/L
Inj. No
Sample Amount
Obtained µg/L
Theoretical Concentration
µg/L
% Recovery
Mean Stdev %
RSD
Borehole Water
Chloroform 350
1 405.500 350.000 115.86
112.23 4.95 4.41
2 379.700 350.000 108.49
3 417.000 350.000 119.14
4 380.900 350.000 108.83
5 380.900 350.000 108.83
Borehole Water
BDCM
350
1 302.700 350.000 86.49
84.85 1.31 1.54
2 290.600 350.000 83.03
3 294.500 350.000 84.14
4 298.200 350.000 85.20
5 298.800 350.000 85.37
Borehole Water
CDBM 350
1 366.400 350.000 104.69
102.86 1.57 1.53
2 351.600 350.000 100.46
3 358.500 350.000 102.43
4 361.500 350.000 103.29
5 362.100 350.000 103.46
Borehole Water
Bromoform 350
1 419.500 350.000 119.86
116.17 3.98 3.43
2 383.900 350.000 109.69
3 403.700 350.000 115.34
4 414.300 350.000 118.37
5 411.600 350.000 117.60
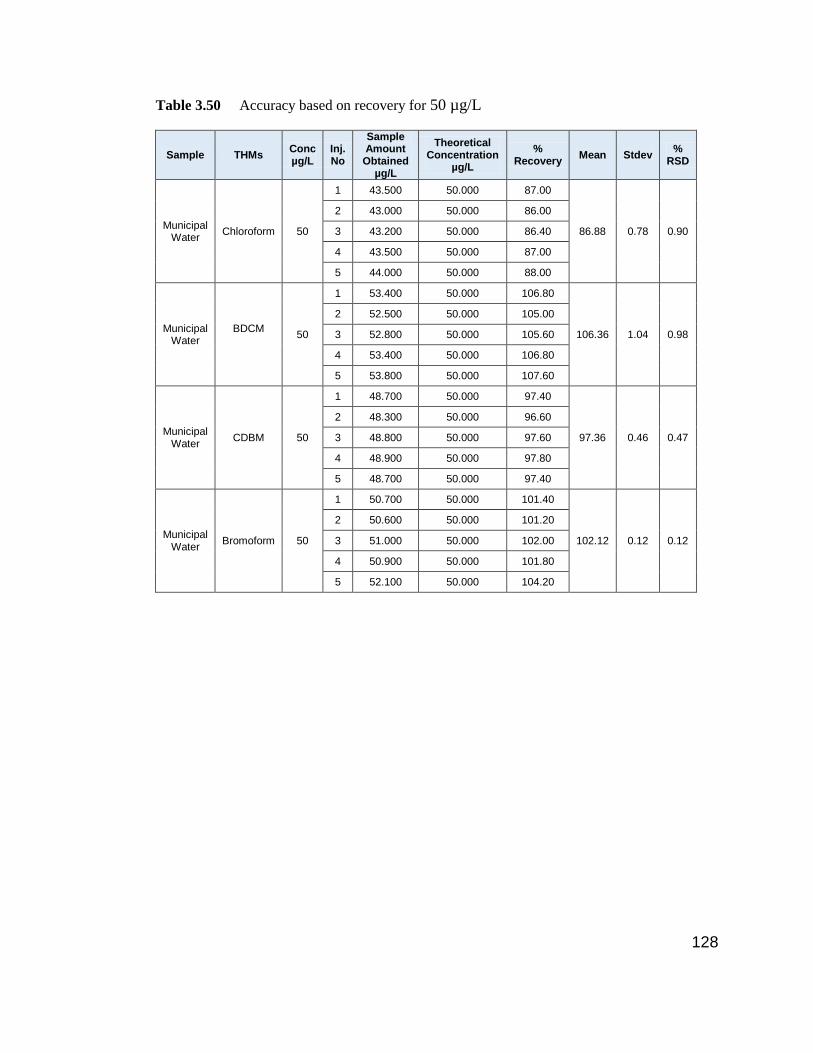
128
Table 3.50 Accuracy based on recovery for 50 µg/L
Sample THMs Conc µg/L
Inj. No
Sample Amount
Obtained µg/L
Theoretical Concentration
µg/L
% Recovery
Mean Stdev %
RSD
Municipal Water
Chloroform 50
1 43.500 50.000 87.00
86.88 0.78 0.90
2 43.000 50.000 86.00
3 43.200 50.000 86.40
4 43.500 50.000 87.00
5 44.000 50.000 88.00
Municipal Water
BDCM
50
1 53.400 50.000 106.80
106.36 1.04 0.98
2 52.500 50.000 105.00
3 52.800 50.000 105.60
4 53.400 50.000 106.80
5 53.800 50.000 107.60
Municipal Water
CDBM 50
1 48.700 50.000 97.40
97.36 0.46 0.47
2 48.300 50.000 96.60
3 48.800 50.000 97.60
4 48.900 50.000 97.80
5 48.700 50.000 97.40
Municipal Water
Bromoform 50
1 50.700 50.000 101.40
102.12 0.12 0.12
2 50.600 50.000 101.20
3 51.000 50.000 102.00
4 50.900 50.000 101.80
5 52.100 50.000 104.20
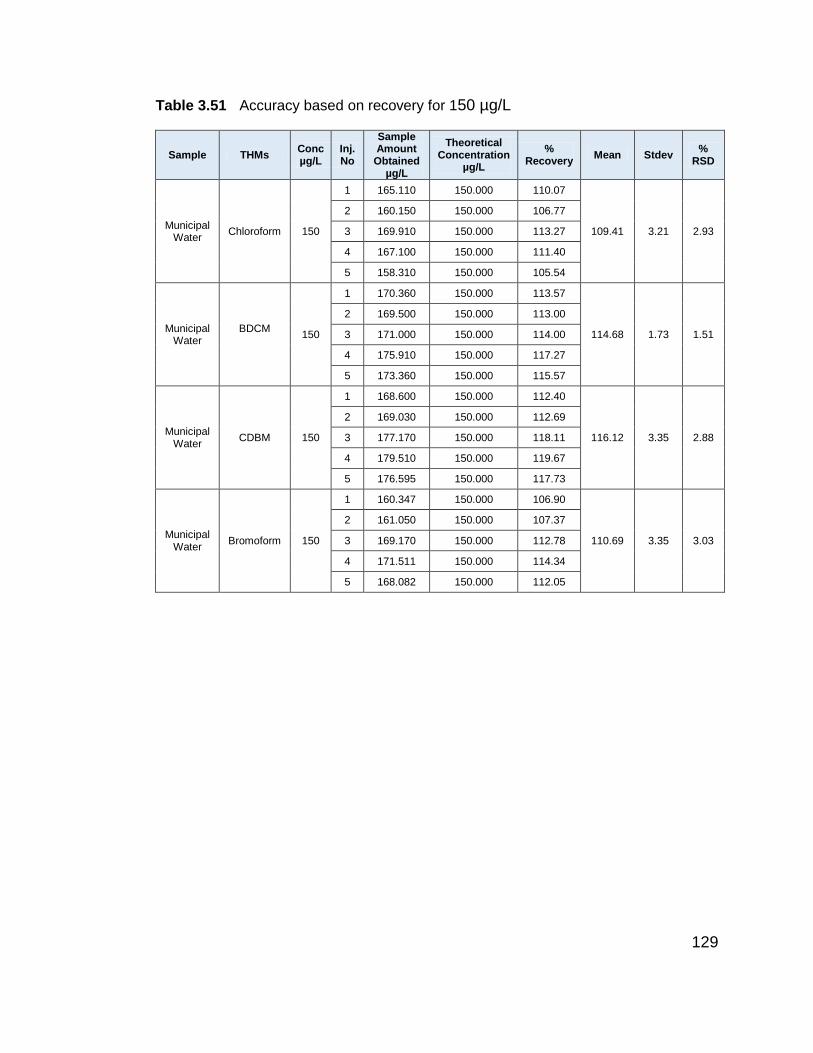
129
Table 3.51 Accuracy based on recovery for 150 µg/L
Sample THMs Conc µg/L
Inj. No
Sample Amount
Obtained µg/L
Theoretical Concentration
µg/L
% Recovery
Mean Stdev %
RSD
Municipal Water
Chloroform 150
1 165.110 150.000 110.07
109.41 3.21 2.93
2 160.150 150.000 106.77
3 169.910 150.000 113.27
4 167.100 150.000 111.40
5 158.310 150.000 105.54
Municipal Water
BDCM
150
1 170.360 150.000 113.57
114.68 1.73 1.51
2 169.500 150.000 113.00
3 171.000 150.000 114.00
4 175.910 150.000 117.27
5 173.360 150.000 115.57
Municipal Water
CDBM 150
1 168.600 150.000 112.40
116.12 3.35 2.88
2 169.030 150.000 112.69
3 177.170 150.000 118.11
4 179.510 150.000 119.67
5 176.595 150.000 117.73
Municipal Water
Bromoform 150
1 160.347 150.000 106.90
110.69 3.35 3.03
2 161.050 150.000 107.37
3 169.170 150.000 112.78
4 171.511 150.000 114.34
5 168.082 150.000 112.05
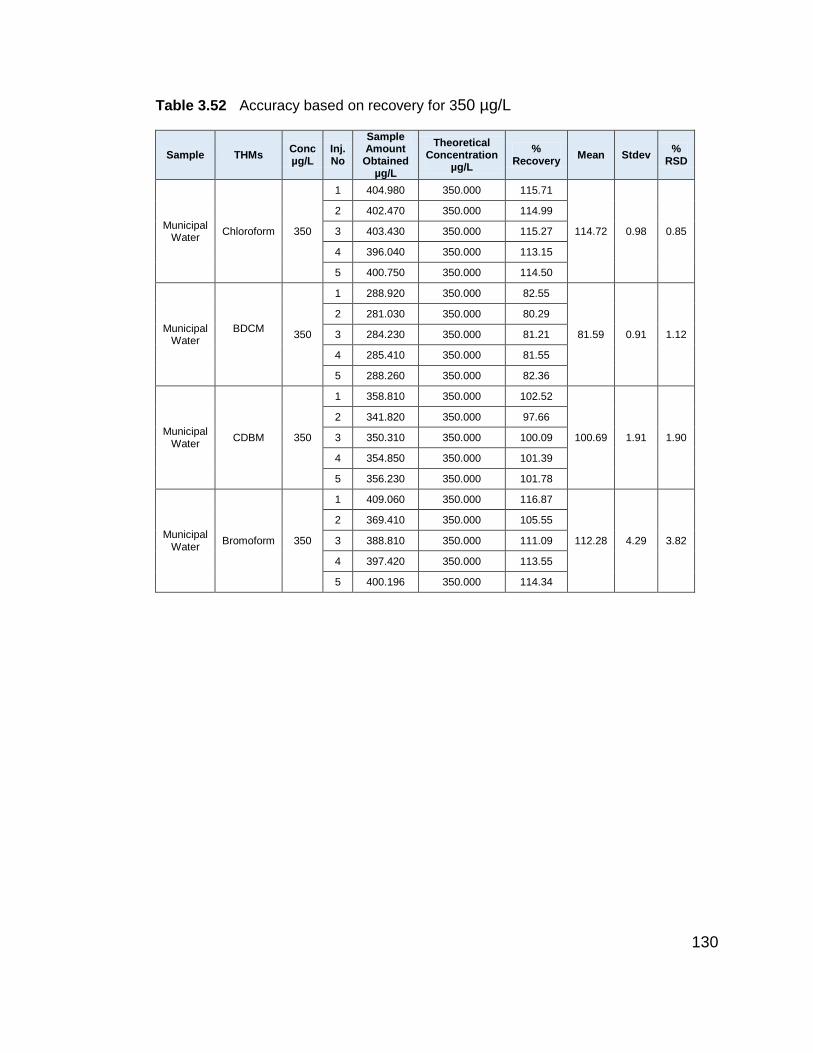
130
Table 3.52 Accuracy based on recovery for 350 µg/L
Sample THMs Conc µg/L
Inj. No
Sample Amount
Obtained µg/L
Theoretical Concentration
µg/L
% Recovery
Mean Stdev %
RSD
Municipal Water
Chloroform 350
1 404.980 350.000 115.71
114.72 0.98 0.85
2 402.470 350.000 114.99
3 403.430 350.000 115.27
4 396.040 350.000 113.15
5 400.750 350.000 114.50
Municipal Water
BDCM
350
1 288.920 350.000 82.55
81.59 0.91 1.12
2 281.030 350.000 80.29
3 284.230 350.000 81.21
4 285.410 350.000 81.55
5 288.260 350.000 82.36
Municipal Water
CDBM 350
1 358.810 350.000 102.52
100.69 1.91 1.90
2 341.820 350.000 97.66
3 350.310 350.000 100.09
4 354.850 350.000 101.39
5 356.230 350.000 101.78
Municipal Water
Bromoform 350
1 409.060 350.000 116.87
112.28 4.29 3.82
2 369.410 350.000 105.55
3 388.810 350.000 111.09
4 397.420 350.000 113.55
5 400.196 350.000 114.34
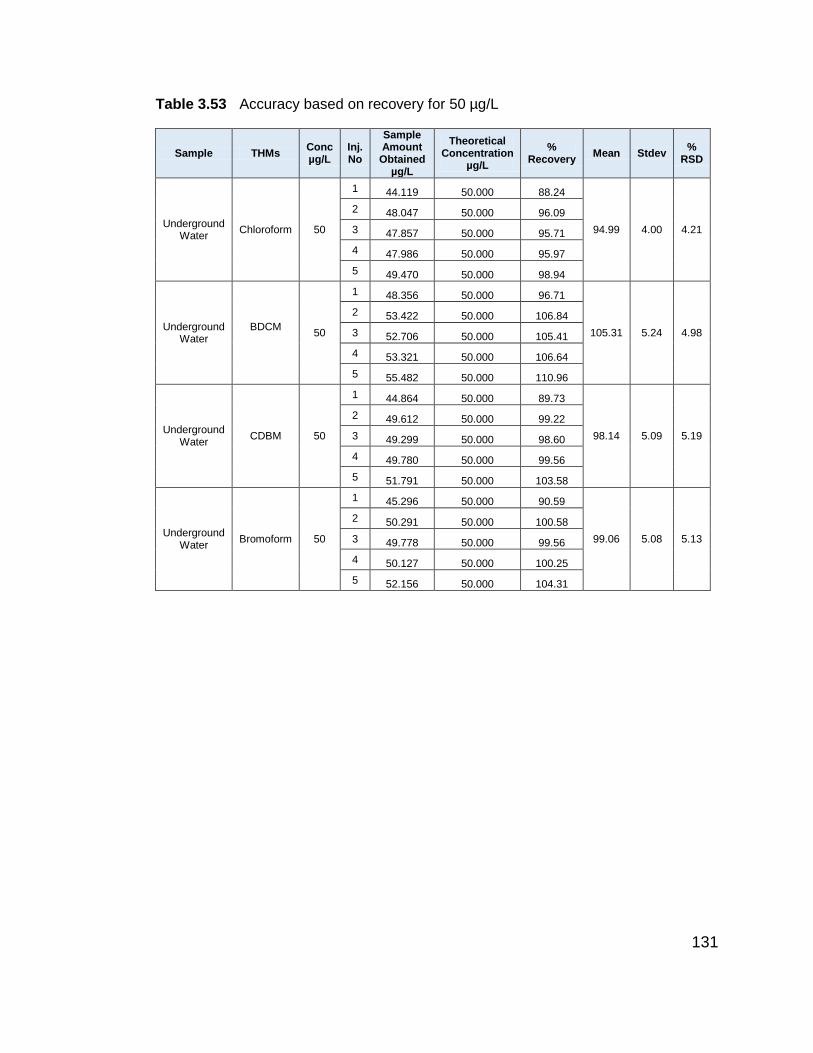
131
Table 3.53 Accuracy based on recovery for 50 µg/L
Sample THMs Conc µg/L
Inj. No
Sample Amount
Obtained µg/L
Theoretical Concentration
µg/L
% Recovery
Mean Stdev %
RSD
Underground Water
Chloroform 50
1 44.119 50.000 88.24
94.99 4.00 4.21
2 48.047 50.000 96.09
3 47.857 50.000 95.71
4 47.986 50.000 95.97
5 49.470 50.000 98.94
Underground Water
BDCM
50
1 48.356 50.000 96.71
105.31 5.24 4.98
2 53.422 50.000 106.84
3 52.706 50.000 105.41
4 53.321 50.000 106.64
5 55.482 50.000 110.96
Underground Water
CDBM 50
1 44.864 50.000 89.73
98.14 5.09 5.19
2 49.612 50.000 99.22
3 49.299 50.000 98.60
4 49.780 50.000 99.56
5 51.791 50.000 103.58
Underground Water
Bromoform 50
1 45.296 50.000 90.59
99.06 5.08 5.13
2 50.291 50.000 100.58
3 49.778 50.000 99.56
4 50.127 50.000 100.25
5 52.156 50.000 104.31

132
Table 3.54 Accuracy based on recovery for 150 µg/L
Sample THMs Conc µg/L
Inj. No
Sample Amount
Obtained µg/L
Theoretical Concentration
µg/L
% Recovery
Mean Stdev %
RSD
Underground Water
Chloroform 150
1 135.400 150.000 90.27
92.67 2.22 2.40
2 138.700 150.000 92.47
3 137.200 150.000 91.47
4 139.400 150.000 92.93
5 144.300 150.000 96.20
Underground Water
BDCM
150
1 169.400 150.000 112.93
115.33 2.45 2.12
2 173.400 150.000 115.60
3 170.300 150.000 113.53
4 173.100 150.000 115.40
5 178.800 150.000 119.20
Underground Water
CDBM 150
1 142.200 150.000 94.80
97.37 2.73 2.80
2 145.900 150.000 97.27
3 142.900 150.000 95.27
4 146.800 150.000 97.87
5 152.500 150.000 101.67
Underground Water
Bromoform 150
1 138.400 150.000 92.27
94.68 2.62 2.77
2 142.000 150.000 94.67
3 138.600 150.000 92.40
4 143.100 150.000 95.40
5 148.000 150.000 98.67
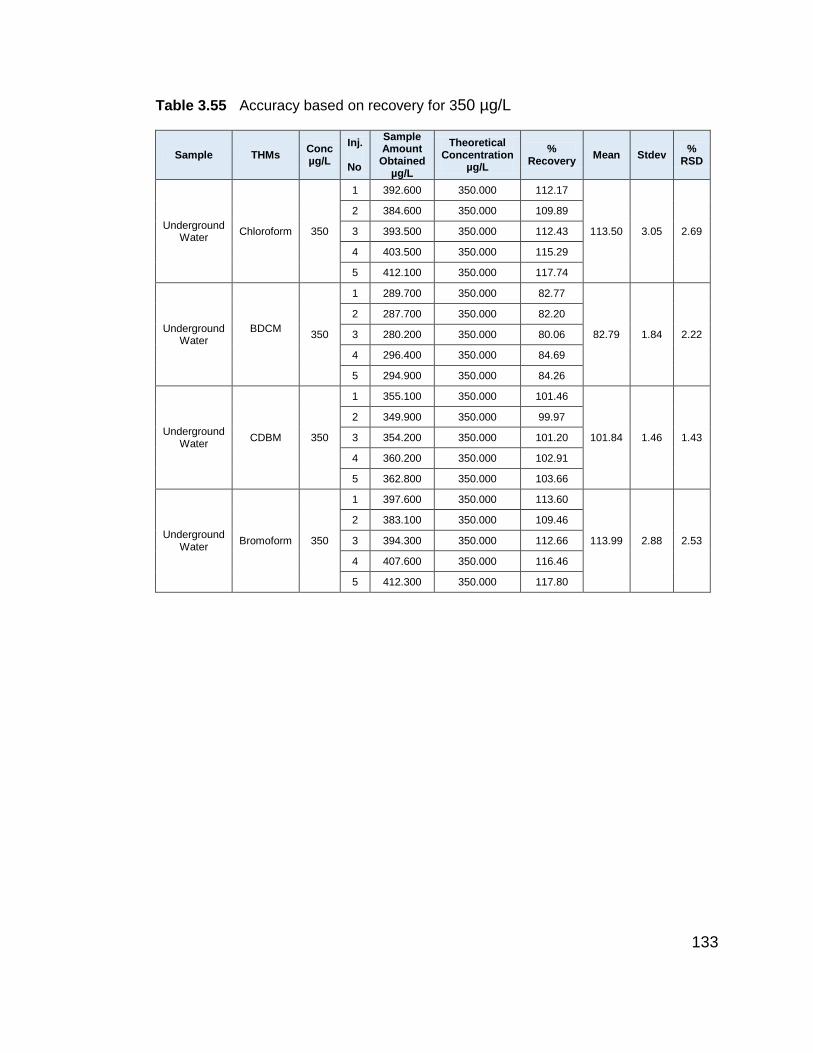
133
Table 3.55 Accuracy based on recovery for 350 µg/L
Sample THMs Conc µg/L
Inj. No
Sample Amount
Obtained µg/L
Theoretical Concentration
µg/L
% Recovery
Mean Stdev %
RSD
Underground Water
Chloroform 350
1 392.600 350.000 112.17
113.50 3.05 2.69
2 384.600 350.000 109.89
3 393.500 350.000 112.43
4 403.500 350.000 115.29
5 412.100 350.000 117.74
Underground Water
BDCM
350
1 289.700 350.000 82.77
82.79 1.84 2.22
2 287.700 350.000 82.20
3 280.200 350.000 80.06
4 296.400 350.000 84.69
5 294.900 350.000 84.26
Underground Water
CDBM 350
1 355.100 350.000 101.46
101.84 1.46 1.43
2 349.900 350.000 99.97
3 354.200 350.000 101.20
4 360.200 350.000 102.91
5 362.800 350.000 103.66
Underground Water
Bromoform 350
1 397.600 350.000 113.60
113.99 2.88 2.53
2 383.100 350.000 109.46
3 394.300 350.000 112.66
4 407.600 350.000 116.46
5 412.300 350.000 117.80
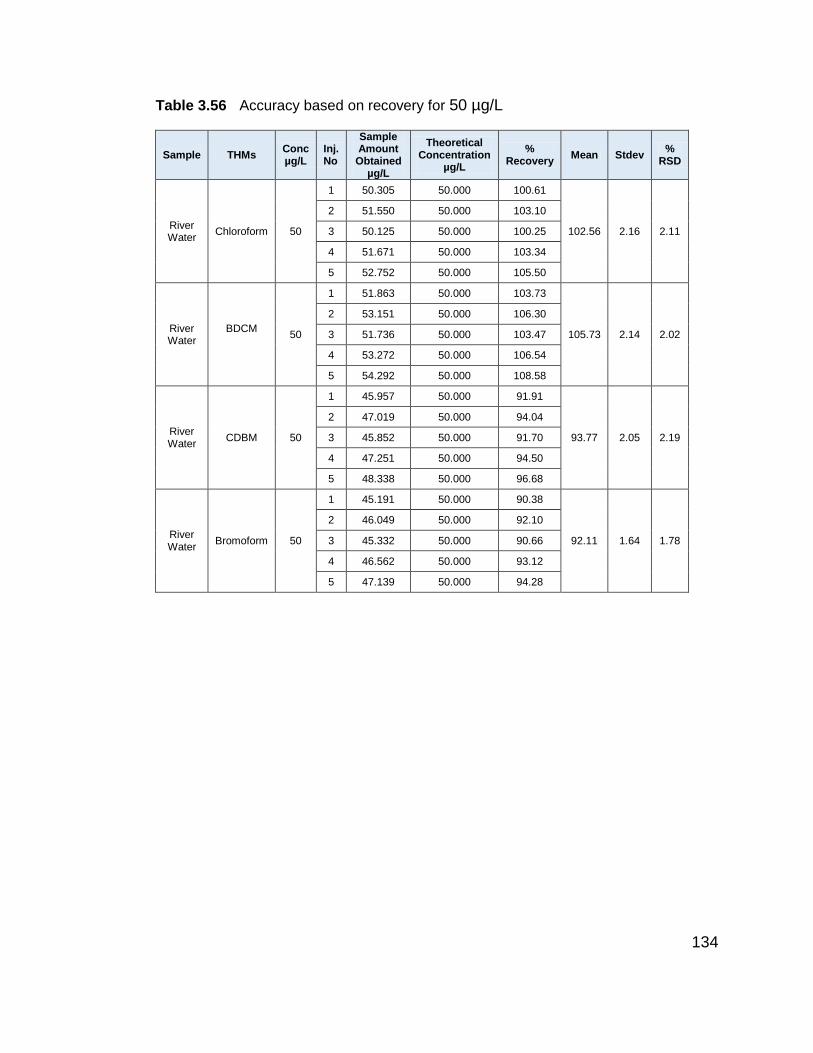
134
Table 3.56 Accuracy based on recovery for 50 µg/L
Sample THMs Conc µg/L
Inj. No
Sample Amount
Obtained µg/L
Theoretical Concentration
µg/L
% Recovery
Mean Stdev %
RSD
River Water
Chloroform 50
1 50.305 50.000 100.61
102.56 2.16 2.11
2 51.550 50.000 103.10
3 50.125 50.000 100.25
4 51.671 50.000 103.34
5 52.752 50.000 105.50
River Water
BDCM
50
1 51.863 50.000 103.73
105.73 2.14 2.02
2 53.151 50.000 106.30
3 51.736 50.000 103.47
4 53.272 50.000 106.54
5 54.292 50.000 108.58
River Water
CDBM 50
1 45.957 50.000 91.91
93.77 2.05 2.19
2 47.019 50.000 94.04
3 45.852 50.000 91.70
4 47.251 50.000 94.50
5 48.338 50.000 96.68
River Water
Bromoform 50
1 45.191 50.000 90.38
92.11 1.64 1.78
2 46.049 50.000 92.10
3 45.332 50.000 90.66
4 46.562 50.000 93.12
5 47.139 50.000 94.28
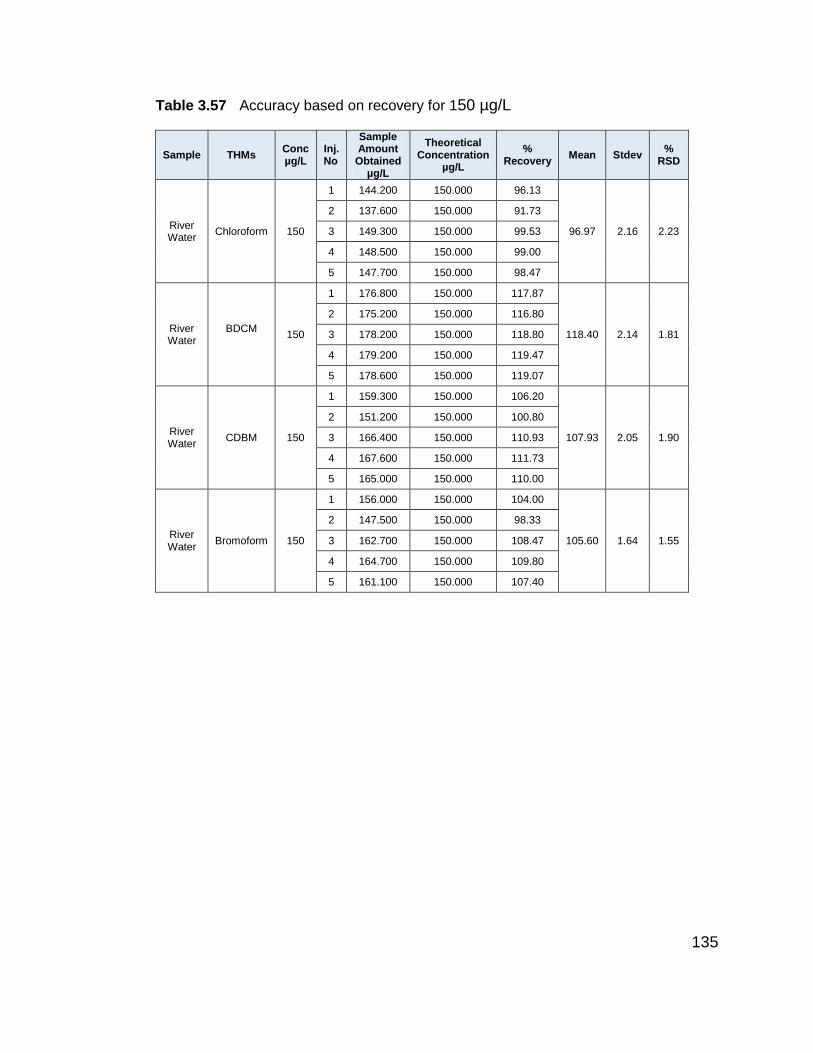
135
Table 3.57 Accuracy based on recovery for 150 µg/L
Sample THMs Conc µg/L
Inj. No
Sample Amount
Obtained µg/L
Theoretical Concentration
µg/L
% Recovery
Mean Stdev %
RSD
River Water
Chloroform 150
1 144.200 150.000 96.13
96.97 2.16 2.23
2 137.600 150.000 91.73
3 149.300 150.000 99.53
4 148.500 150.000 99.00
5 147.700 150.000 98.47
River Water
BDCM
150
1 176.800 150.000 117.87
118.40 2.14 1.81
2 175.200 150.000 116.80
3 178.200 150.000 118.80
4 179.200 150.000 119.47
5 178.600 150.000 119.07
River Water
CDBM 150
1 159.300 150.000 106.20
107.93 2.05 1.90
2 151.200 150.000 100.80
3 166.400 150.000 110.93
4 167.600 150.000 111.73
5 165.000 150.000 110.00
River Water
Bromoform 150
1 156.000 150.000 104.00
105.60 1.64 1.55
2 147.500 150.000 98.33
3 162.700 150.000 108.47
4 164.700 150.000 109.80
5 161.100 150.000 107.40
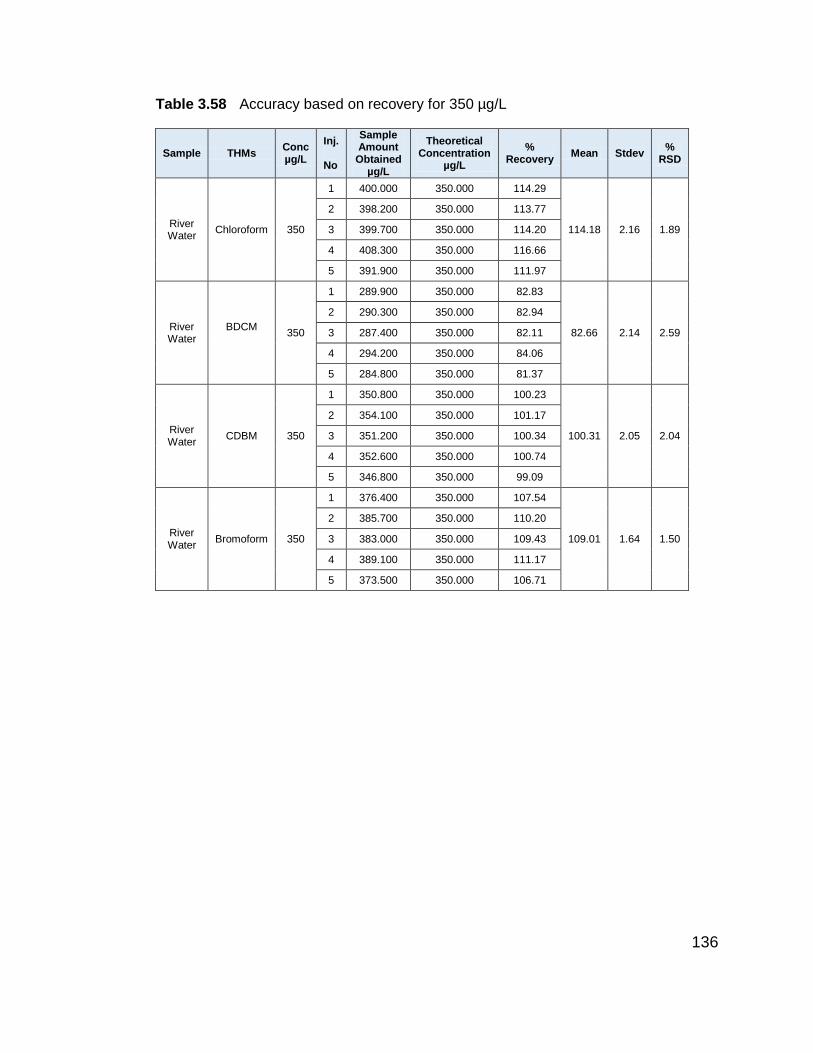
136
Table 3.58 Accuracy based on recovery for 350 µg/L
Sample THMs Conc µg/L
Inj. No
Sample Amount
Obtained µg/L
Theoretical Concentration
µg/L
% Recovery
Mean Stdev %
RSD
River Water
Chloroform 350
1 400.000 350.000 114.29
114.18 2.16 1.89
2 398.200 350.000 113.77
3 399.700 350.000 114.20
4 408.300 350.000 116.66
5 391.900 350.000 111.97
River Water
BDCM
350
1 289.900 350.000 82.83
82.66 2.14 2.59
2 290.300 350.000 82.94
3 287.400 350.000 82.11
4 294.200 350.000 84.06
5 284.800 350.000 81.37
River Water
CDBM 350
1 350.800 350.000 100.23
100.31 2.05 2.04
2 354.100 350.000 101.17
3 351.200 350.000 100.34
4 352.600 350.000 100.74
5 346.800 350.000 99.09
River Water
Bromoform 350
1 376.400 350.000 107.54
109.01 1.64 1.50
2 385.700 350.000 110.20
3 383.000 350.000 109.43
4 389.100 350.000 111.17
5 373.500 350.000 106.71
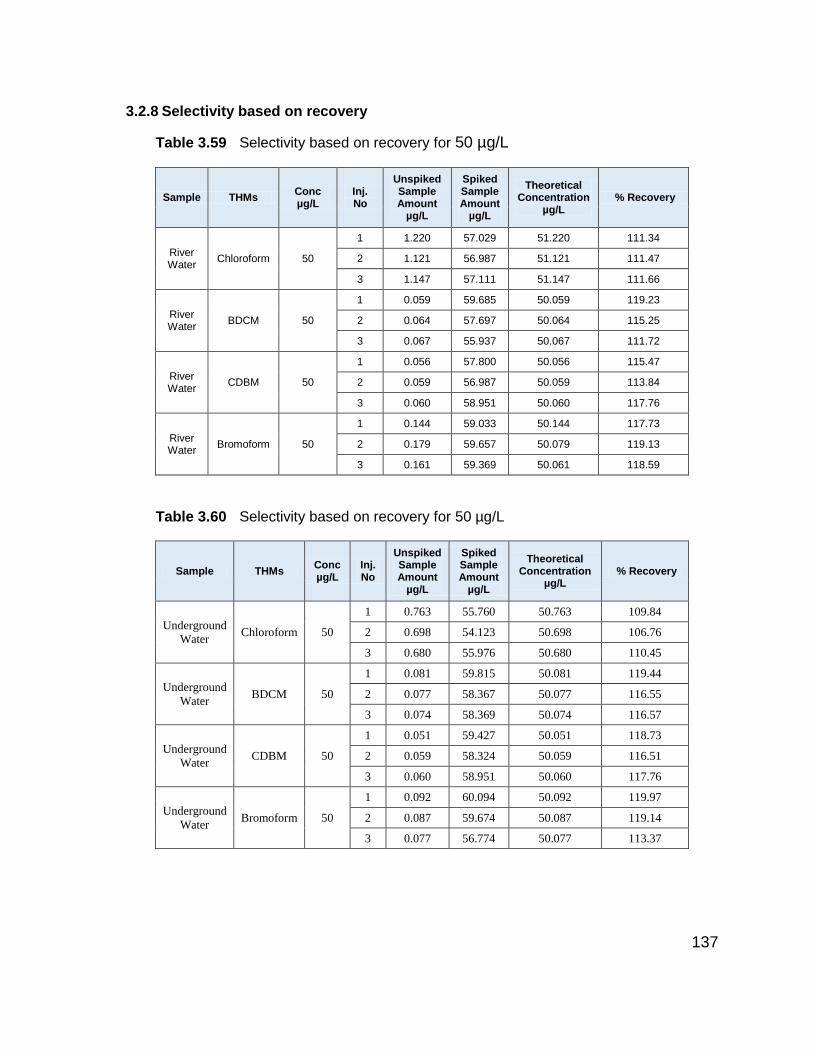
137
3.2.8 Selectivity based on recovery
Table 3.59 Selectivity based on recovery for 50 µg/L
Sample THMs Conc µg/L
Inj. No
Unspiked Sample Amount
µg/L
Spiked Sample Amount
µg/L
Theoretical Concentration
µg/L % Recovery
River Water
Chloroform 50
1 1.220 57.029 51.220 111.34
2 1.121 56.987 51.121 111.47
3 1.147 57.111 51.147 111.66
River Water
BDCM
50
1 0.059 59.685 50.059 119.23
2 0.064 57.697 50.064 115.25
3 0.067 55.937 50.067 111.72
River Water
CDBM 50
1 0.056 57.800 50.056 115.47
2 0.059 56.987 50.059 113.84
3 0.060 58.951 50.060 117.76
River Water
Bromoform 50
1 0.144 59.033 50.144 117.73
2 0.179 59.657 50.079 119.13
3 0.161 59.369 50.061 118.59
Table 3.60 Selectivity based on recovery for 50 µg/L
Sample THMs Conc µg/L
Inj. No
Unspiked Sample Amount
µg/L
Spiked Sample Amount
µg/L
Theoretical Concentration
µg/L % Recovery
Underground
Water Chloroform 50
1 0.763 55.760 50.763 109.84
2 0.698 54.123 50.698 106.76
3 0.680 55.976 50.680 110.45
Underground
Water
BDCM
50
1 0.081 59.815 50.081 119.44
2 0.077 58.367 50.077 116.55
3 0.074 58.369 50.074 116.57
Underground
Water CDBM 50
1 0.051 59.427 50.051 118.73
2 0.059 58.324 50.059 116.51
3 0.060 58.951 50.060 117.76
Underground
Water Bromoform 50
1 0.092 60.094 50.092 119.97
2 0.087 59.674 50.087 119.14
3 0.077 56.774 50.077 113.37
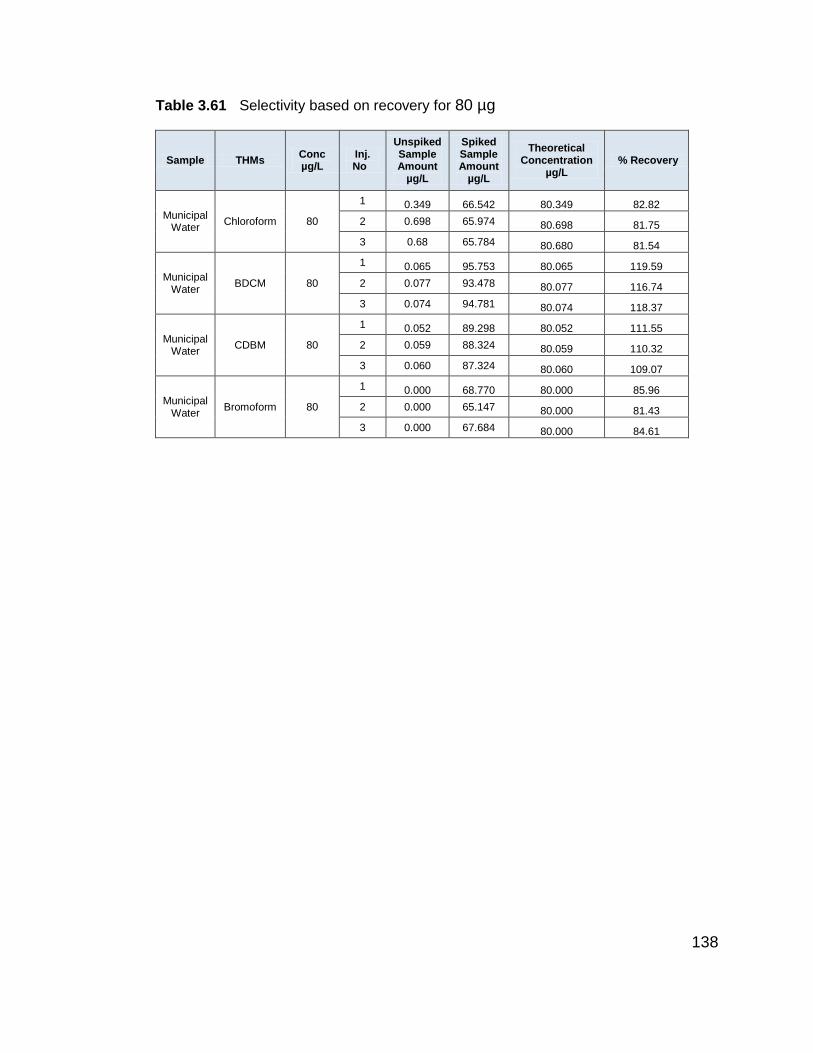
138
Table 3.61 Selectivity based on recovery for 80 µg
Sample THMs Conc µg/L
Inj. No
Unspiked Sample Amount
µg/L
Spiked Sample Amount
µg/L
Theoretical Concentration
µg/L % Recovery
Municipal Water
Chloroform 80
1 0.349 66.542 80.349 82.82
2 0.698 65.974 80.698 81.75
3 0.68 65.784 80.680 81.54
Municipal Water
BDCM
80
1 0.065 95.753 80.065 119.59
2 0.077 93.478 80.077 116.74
3 0.074 94.781 80.074 118.37
Municipal Water
CDBM 80
1 0.052 89.298 80.052 111.55
2 0.059 88.324 80.059 110.32
3 0.060 87.324 80.060 109.07
Municipal Water
Bromoform 80
1 0.000 68.770 80.000 85.96
2 0.000 65.147 80.000 81.43
3 0.000 67.684 80.000 84.61
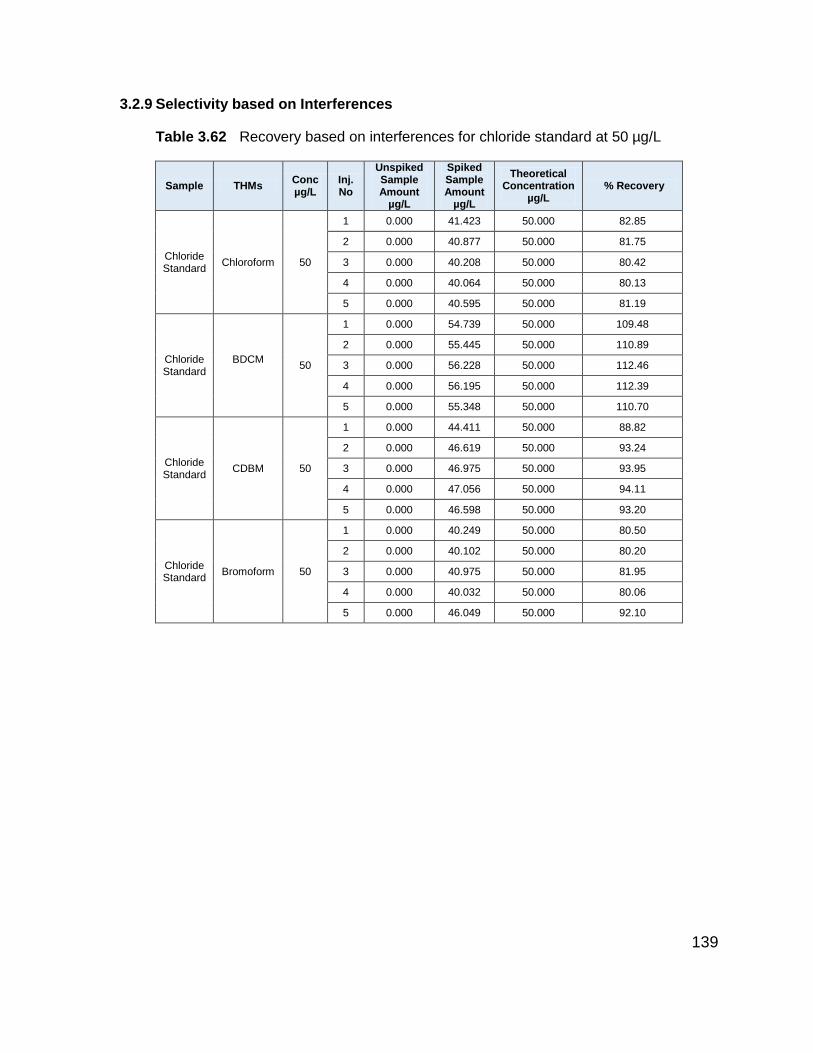
139
3.2.9 Selectivity based on Interferences
Table 3.62 Recovery based on interferences for chloride standard at 50 µg/L
Sample THMs Conc µg/L
Inj. No
Unspiked Sample Amount
µg/L
Spiked Sample Amount
µg/L
Theoretical Concentration
µg/L % Recovery
Chloride Standard
Chloroform 50
1 0.000 41.423 50.000 82.85
2 0.000 40.877 50.000 81.75
3 0.000 40.208 50.000 80.42
4 0.000 40.064 50.000 80.13
5 0.000 40.595 50.000 81.19
Chloride Standard
BDCM
50
1 0.000 54.739 50.000 109.48
2 0.000 55.445 50.000 110.89
3 0.000 56.228 50.000 112.46
4 0.000 56.195 50.000 112.39
5 0.000 55.348 50.000 110.70
Chloride Standard
CDBM 50
1 0.000 44.411 50.000 88.82
2 0.000 46.619 50.000 93.24
3 0.000 46.975 50.000 93.95
4 0.000 47.056 50.000 94.11
5 0.000 46.598 50.000 93.20
Chloride Standard
Bromoform 50
1 0.000 40.249 50.000 80.50
2 0.000 40.102 50.000 80.20
3 0.000 40.975 50.000 81.95
4 0.000 40.032 50.000 80.06
5 0.000 46.049 50.000 92.10
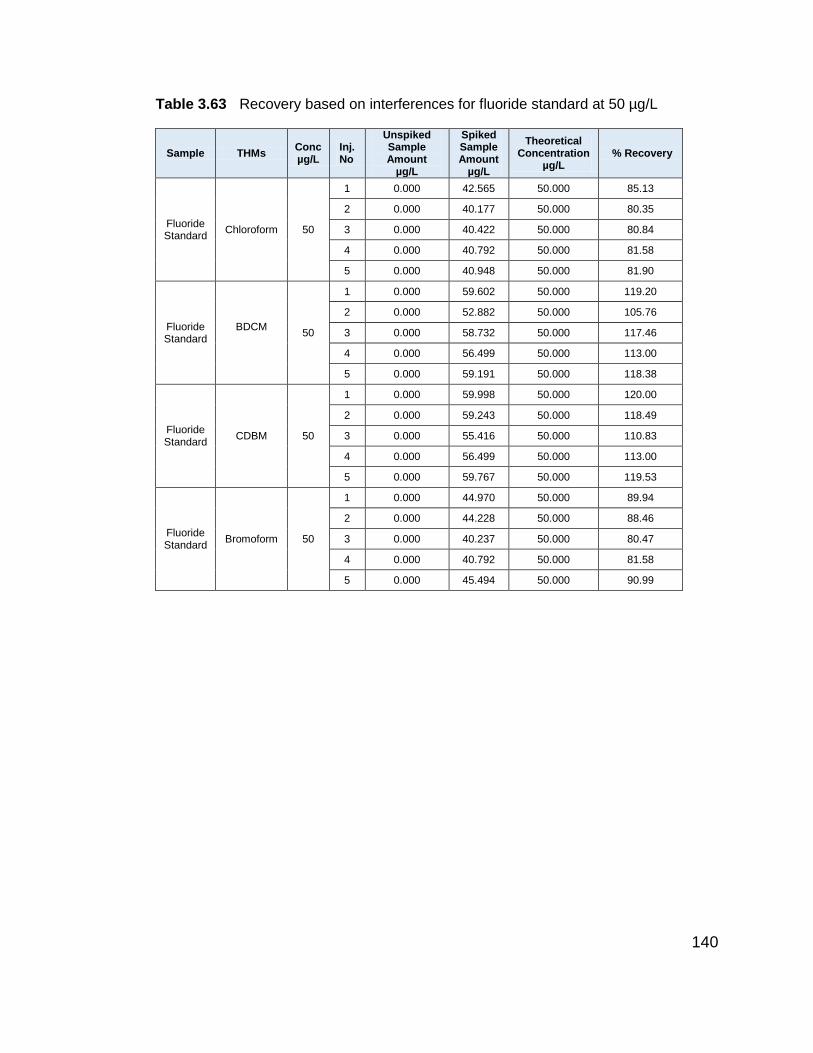
140
Table 3.63 Recovery based on interferences for fluoride standard at 50 µg/L
Sample THMs Conc µg/L
Inj. No
Unspiked Sample Amount
µg/L
Spiked Sample Amount
µg/L
Theoretical Concentration
µg/L % Recovery
Fluoride Standard
Chloroform 50
1 0.000 42.565 50.000 85.13
2 0.000 40.177 50.000 80.35
3 0.000 40.422 50.000 80.84
4 0.000 40.792 50.000 81.58
5 0.000 40.948 50.000 81.90
Fluoride Standard
BDCM
50
1 0.000 59.602 50.000 119.20
2 0.000 52.882 50.000 105.76
3 0.000 58.732 50.000 117.46
4 0.000 56.499 50.000 113.00
5 0.000 59.191 50.000 118.38
Fluoride Standard
CDBM 50
1 0.000 59.998 50.000 120.00
2 0.000 59.243 50.000 118.49
3 0.000 55.416 50.000 110.83
4 0.000 56.499 50.000 113.00
5 0.000 59.767 50.000 119.53
Fluoride Standard
Bromoform 50
1 0.000 44.970 50.000 89.94
2 0.000 44.228 50.000 88.46
3 0.000 40.237 50.000 80.47
4 0.000 40.792 50.000 81.58
5 0.000 45.494 50.000 90.99
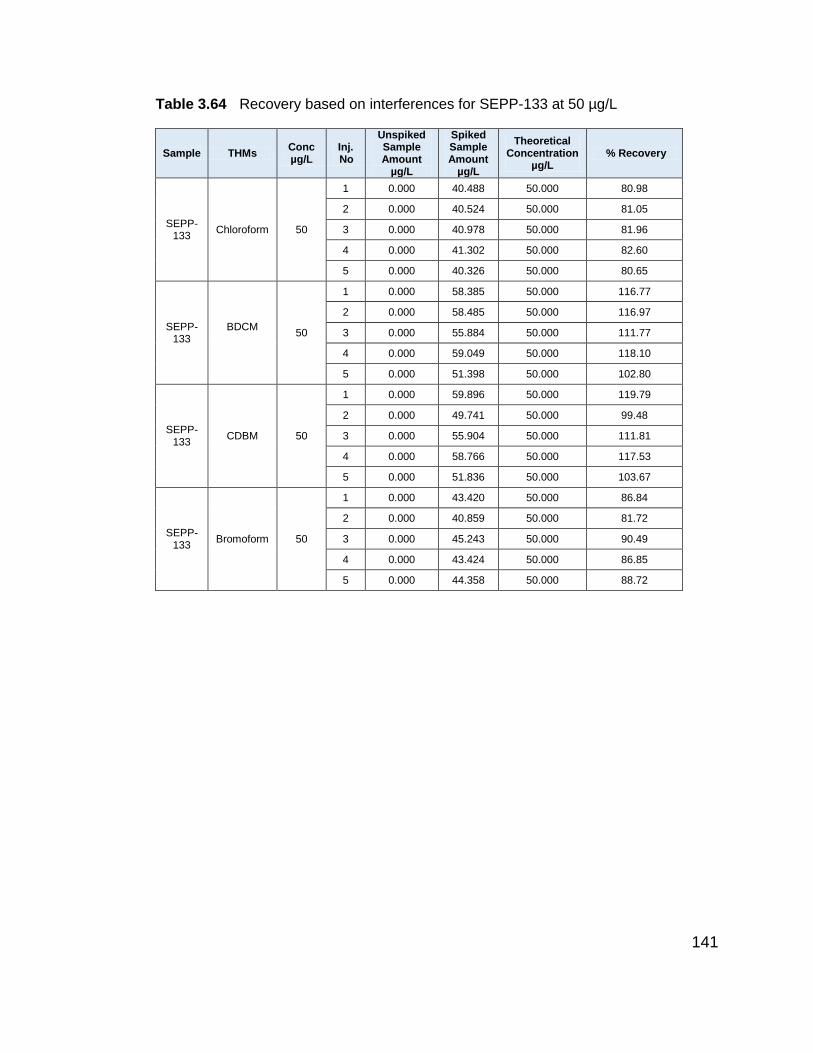
141
Table 3.64 Recovery based on interferences for SEPP-133 at 50 µg/L
Sample THMs Conc µg/L
Inj. No
Unspiked Sample Amount
µg/L
Spiked Sample Amount
µg/L
Theoretical Concentration
µg/L % Recovery
SEPP-133
Chloroform 50
1 0.000 40.488 50.000 80.98
2 0.000 40.524 50.000 81.05
3 0.000 40.978 50.000 81.96
4 0.000 41.302 50.000 82.60
5 0.000 40.326 50.000 80.65
SEPP-133
BDCM
50
1 0.000 58.385 50.000 116.77
2 0.000 58.485 50.000 116.97
3 0.000 55.884 50.000 111.77
4 0.000 59.049 50.000 118.10
5 0.000 51.398 50.000 102.80
SEPP-133
CDBM 50
1 0.000 59.896 50.000 119.79
2 0.000 49.741 50.000 99.48
3 0.000 55.904 50.000 111.81
4 0.000 58.766 50.000 117.53
5 0.000 51.836 50.000 103.67
SEPP-133
Bromoform 50
1 0.000 43.420 50.000 86.84
2 0.000 40.859 50.000 81.72
3 0.000 45.243 50.000 90.49
4 0.000 43.424 50.000 86.85
5 0.000 44.358 50.000 88.72
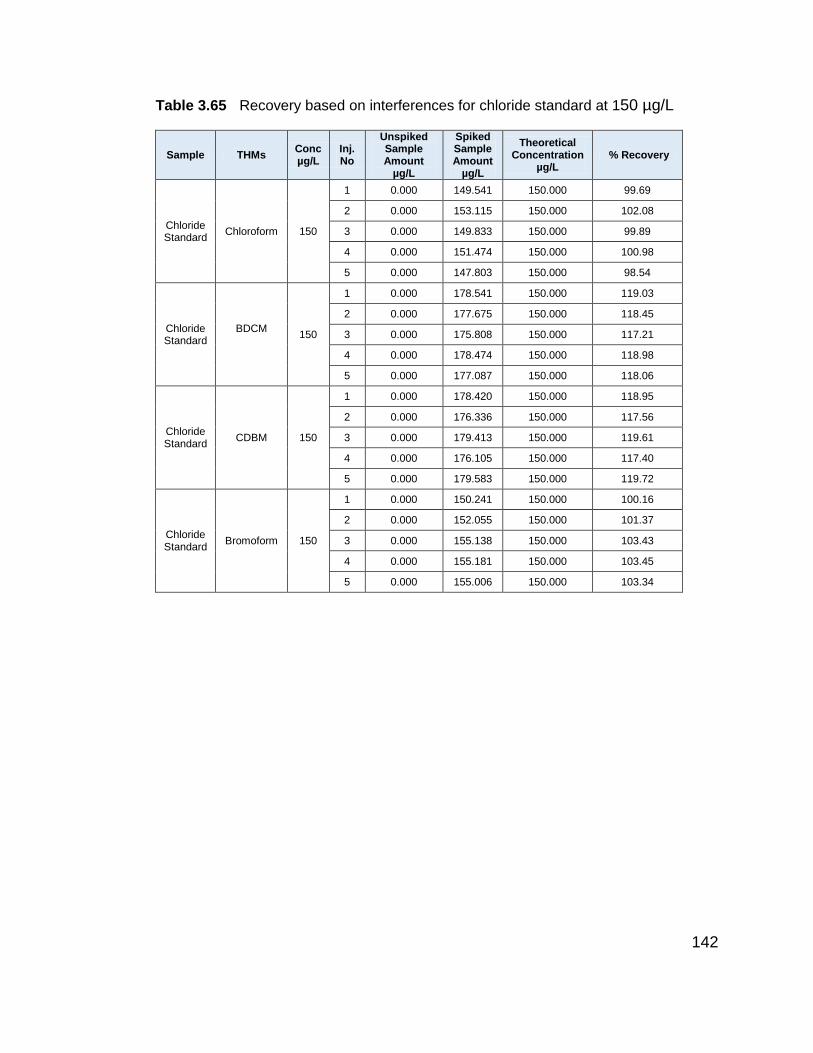
142
Table 3.65 Recovery based on interferences for chloride standard at 150 µg/L
Sample THMs Conc µg/L
Inj. No
Unspiked Sample Amount
µg/L
Spiked Sample Amount
µg/L
Theoretical Concentration
µg/L % Recovery
Chloride Standard
Chloroform 150
1 0.000 149.541 150.000 99.69
2 0.000 153.115 150.000 102.08
3 0.000 149.833 150.000 99.89
4 0.000 151.474 150.000 100.98
5 0.000 147.803 150.000 98.54
Chloride Standard
BDCM
150
1 0.000 178.541 150.000 119.03
2 0.000 177.675 150.000 118.45
3 0.000 175.808 150.000 117.21
4 0.000 178.474 150.000 118.98
5 0.000 177.087 150.000 118.06
Chloride Standard
CDBM 150
1 0.000 178.420 150.000 118.95
2 0.000 176.336 150.000 117.56
3 0.000 179.413 150.000 119.61
4 0.000 176.105 150.000 117.40
5 0.000 179.583 150.000 119.72
Chloride Standard
Bromoform 150
1 0.000 150.241 150.000 100.16
2 0.000 152.055 150.000 101.37
3 0.000 155.138 150.000 103.43
4 0.000 155.181 150.000 103.45
5 0.000 155.006 150.000 103.34
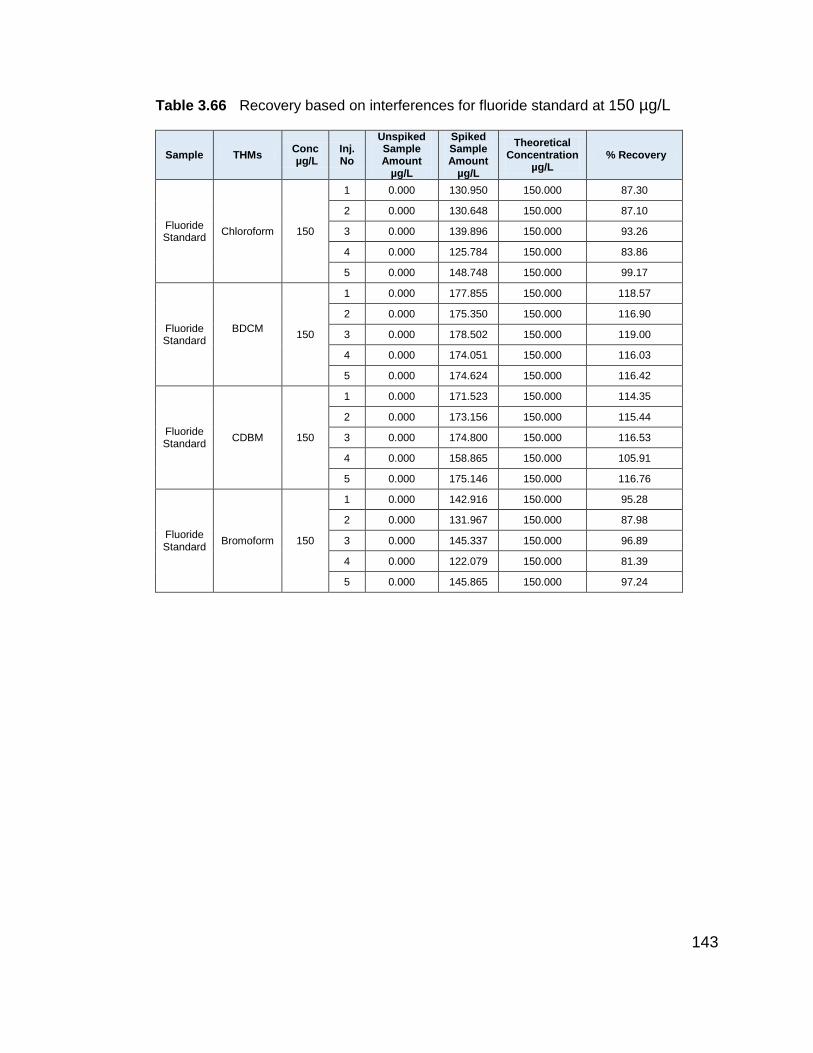
143
Table 3.66 Recovery based on interferences for fluoride standard at 150 µg/L
Sample THMs Conc µg/L
Inj. No
Unspiked Sample Amount
µg/L
Spiked Sample Amount
µg/L
Theoretical Concentration
µg/L % Recovery
Fluoride Standard
Chloroform 150
1 0.000 130.950 150.000 87.30
2 0.000 130.648 150.000 87.10
3 0.000 139.896 150.000 93.26
4 0.000 125.784 150.000 83.86
5 0.000 148.748 150.000 99.17
Fluoride Standard
BDCM
150
1 0.000 177.855 150.000 118.57
2 0.000 175.350 150.000 116.90
3 0.000 178.502 150.000 119.00
4 0.000 174.051 150.000 116.03
5 0.000 174.624 150.000 116.42
Fluoride Standard
CDBM 150
1 0.000 171.523 150.000 114.35
2 0.000 173.156 150.000 115.44
3 0.000 174.800 150.000 116.53
4 0.000 158.865 150.000 105.91
5 0.000 175.146 150.000 116.76
Fluoride Standard
Bromoform 150
1 0.000 142.916 150.000 95.28
2 0.000 131.967 150.000 87.98
3 0.000 145.337 150.000 96.89
4 0.000 122.079 150.000 81.39
5 0.000 145.865 150.000 97.24
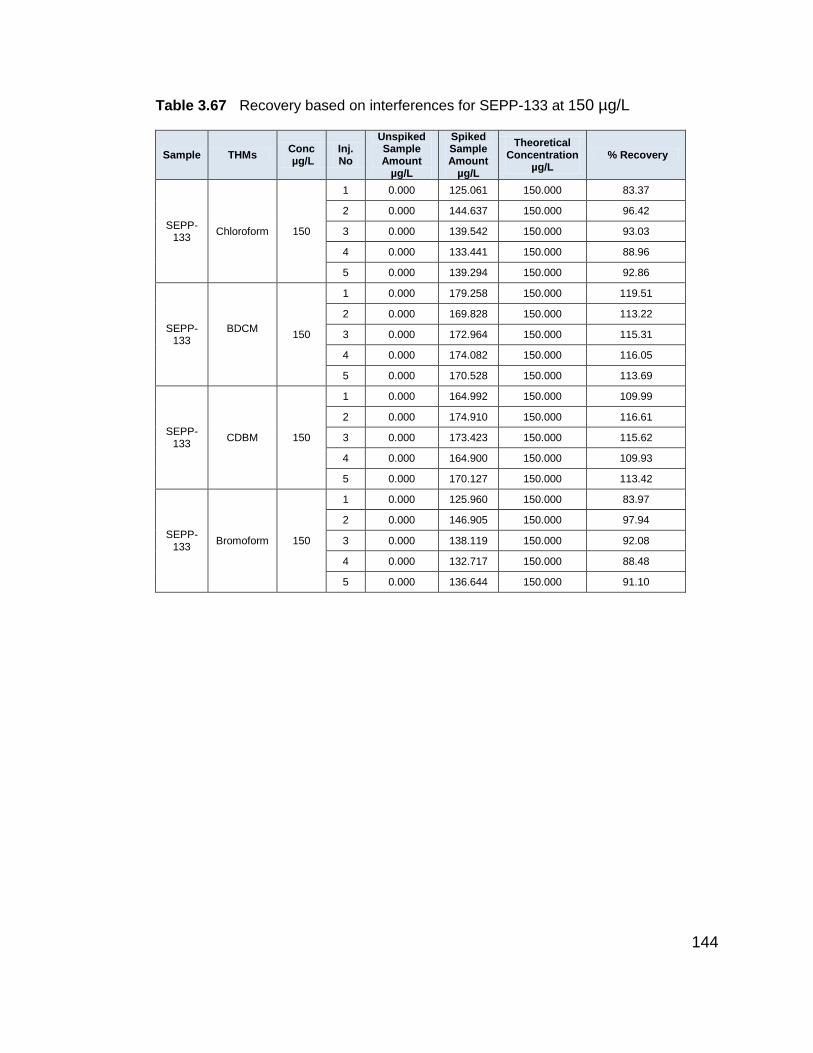
144
Table 3.67 Recovery based on interferences for SEPP-133 at 150 µg/L
Sample THMs Conc µg/L
Inj. No
Unspiked Sample Amount
µg/L
Spiked Sample Amount
µg/L
Theoretical Concentration
µg/L % Recovery
SEPP-133
Chloroform 150
1 0.000 125.061 150.000 83.37
2 0.000 144.637 150.000 96.42
3 0.000 139.542 150.000 93.03
4 0.000 133.441 150.000 88.96
5 0.000 139.294 150.000 92.86
SEPP-133
BDCM
150
1 0.000 179.258 150.000 119.51
2 0.000 169.828 150.000 113.22
3 0.000 172.964 150.000 115.31
4 0.000 174.082 150.000 116.05
5 0.000 170.528 150.000 113.69
SEPP-133
CDBM 150
1 0.000 164.992 150.000 109.99
2 0.000 174.910 150.000 116.61
3 0.000 173.423 150.000 115.62
4 0.000 164.900 150.000 109.93
5 0.000 170.127 150.000 113.42
SEPP-133
Bromoform 150
1 0.000 125.960 150.000 83.97
2 0.000 146.905 150.000 97.94
3 0.000 138.119 150.000 92.08
4 0.000 132.717 150.000 88.48
5 0.000 136.644 150.000 91.10
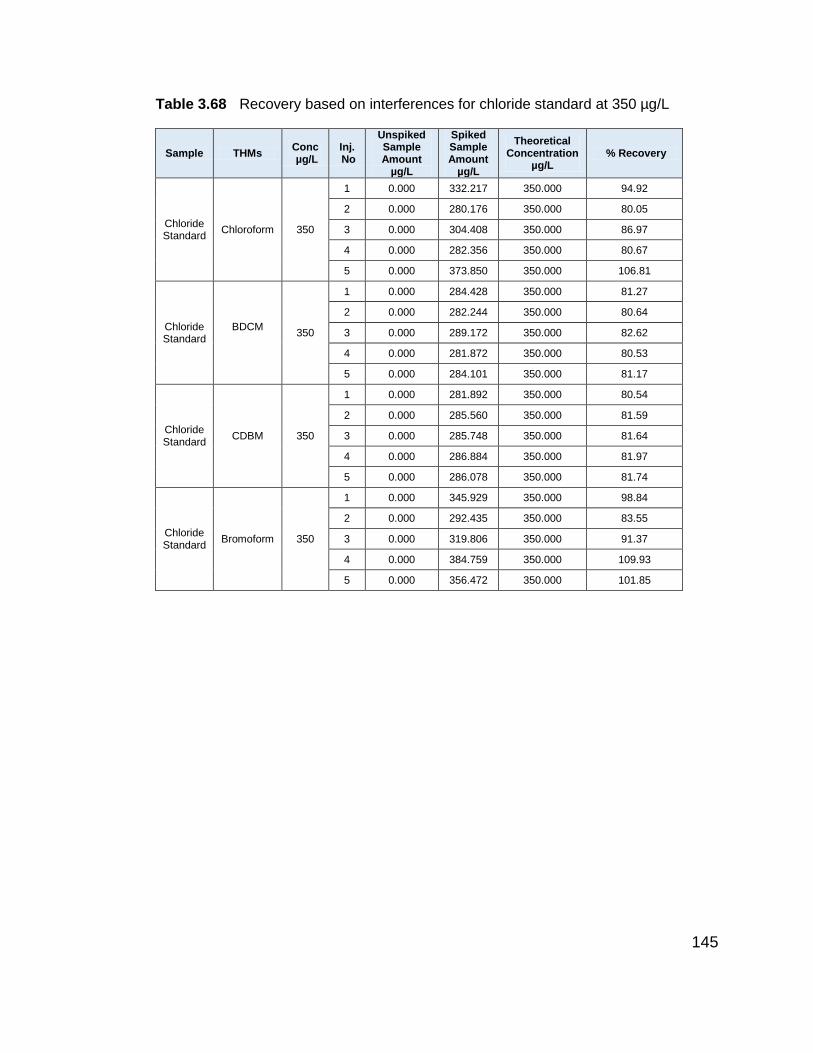
145
Table 3.68 Recovery based on interferences for chloride standard at 350 µg/L
Sample THMs Conc µg/L
Inj. No
Unspiked Sample Amount
µg/L
Spiked Sample Amount
µg/L
Theoretical Concentration
µg/L % Recovery
Chloride Standard
Chloroform 350
1 0.000 332.217 350.000 94.92
2 0.000 280.176 350.000 80.05
3 0.000 304.408 350.000 86.97
4 0.000 282.356 350.000 80.67
5 0.000 373.850 350.000 106.81
Chloride Standard
BDCM
350
1 0.000 284.428 350.000 81.27
2 0.000 282.244 350.000 80.64
3 0.000 289.172 350.000 82.62
4 0.000 281.872 350.000 80.53
5 0.000 284.101 350.000 81.17
Chloride Standard
CDBM 350
1 0.000 281.892 350.000 80.54
2 0.000 285.560 350.000 81.59
3 0.000 285.748 350.000 81.64
4 0.000 286.884 350.000 81.97
5 0.000 286.078 350.000 81.74
Chloride Standard
Bromoform 350
1 0.000 345.929 350.000 98.84
2 0.000 292.435 350.000 83.55
3 0.000 319.806 350.000 91.37
4 0.000 384.759 350.000 109.93
5 0.000 356.472 350.000 101.85

146
Table 3.69 Recovery based on interferences for chloride standard at 350 µg/L
Sample THMs Conc. µg/L
Inj. No
Unspiked Sample Amount
µg/L
Spiked Sample Amount
µg/L
Theoretical Concentration
µg/L % Recovery
Fluoride Standard
Chloroform 350
1 0.000 363.025 350.000 103.72
2 0.000 375.870 350.000 107.39
3 0.000 376.212 350.000 107.49
4 0.000 382.362 350.000 109.25
5 0.000 333.229 350.000 95.21
Fluoride Standard
BDCM
350
1 0.000 282.055 350.000 80.59
2 0.000 285.027 350.000 81.44
3 0.000 280.155 350.000 80.04
4 0.000 280.153 350.000 80.04
5 0.000 283.150 350.000 80.90
Fluoride Standard
CDBM 350
1 0.000 285.756 350.000 81.64
2 0.000 287.458 350.000 82.13
3 0.000 280.244 350.000 80.07
4 0.000 280.130 350.000 80.04
5 0.000 284.302 350.000 81.23
Fluoride Standard
Bromoform 350
1 0.000 348.583 350.000 99.60
2 0.000 357.452 350.000 102.13
3 0.000 368.271 350.000 105.22
4 0.000 368.254 350.000 105.22
5 0.000 333.229 350.000 95.21
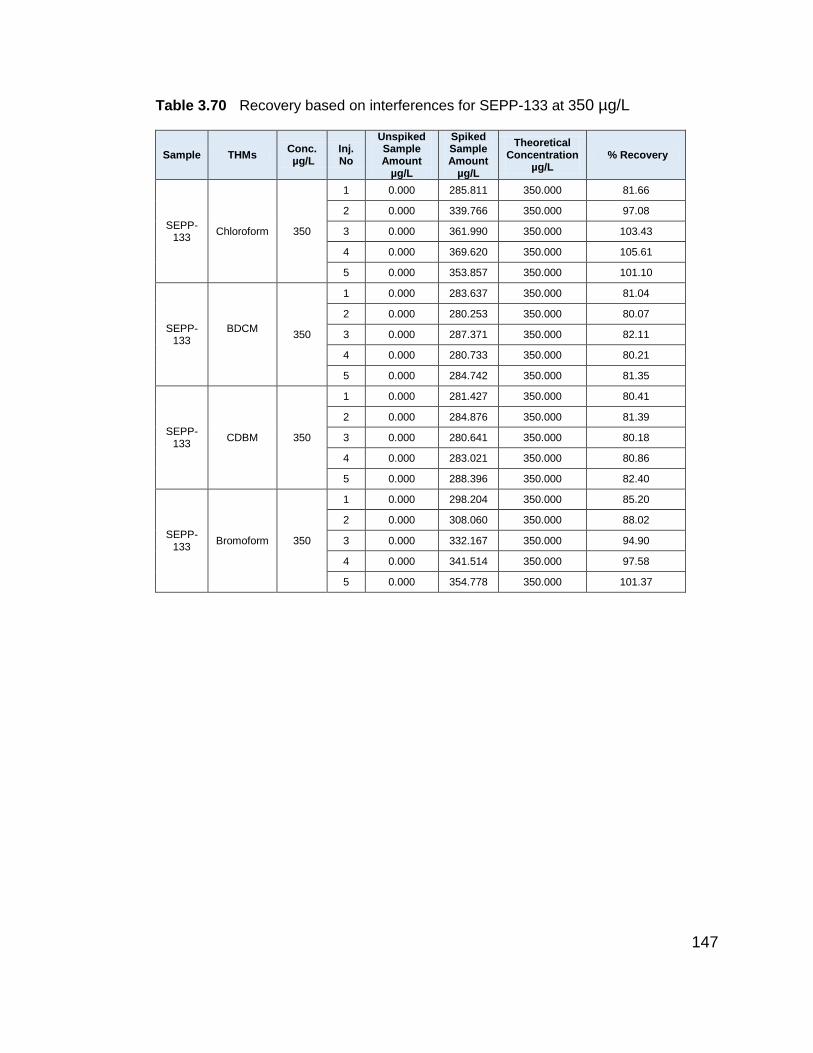
147
Table 3.70 Recovery based on interferences for SEPP-133 at 350 µg/L
Sample THMs Conc. µg/L
Inj. No
Unspiked Sample Amount
µg/L
Spiked Sample Amount
µg/L
Theoretical Concentration
µg/L % Recovery
SEPP-133
Chloroform 350
1 0.000 285.811 350.000 81.66
2 0.000 339.766 350.000 97.08
3 0.000 361.990 350.000 103.43
4 0.000 369.620 350.000 105.61
5 0.000 353.857 350.000 101.10
SEPP-133
BDCM
350
1 0.000 283.637 350.000 81.04
2 0.000 280.253 350.000 80.07
3 0.000 287.371 350.000 82.11
4 0.000 280.733 350.000 80.21
5 0.000 284.742 350.000 81.35
SEPP-133
CDBM 350
1 0.000 281.427 350.000 80.41
2 0.000 284.876 350.000 81.39
3 0.000 280.641 350.000 80.18
4 0.000 283.021 350.000 80.86
5 0.000 288.396 350.000 82.40
SEPP-133
Bromoform 350
1 0.000 298.204 350.000 85.20
2 0.000 308.060 350.000 88.02
3 0.000 332.167 350.000 94.90
4 0.000 341.514 350.000 97.58
5 0.000 354.778 350.000 101.37
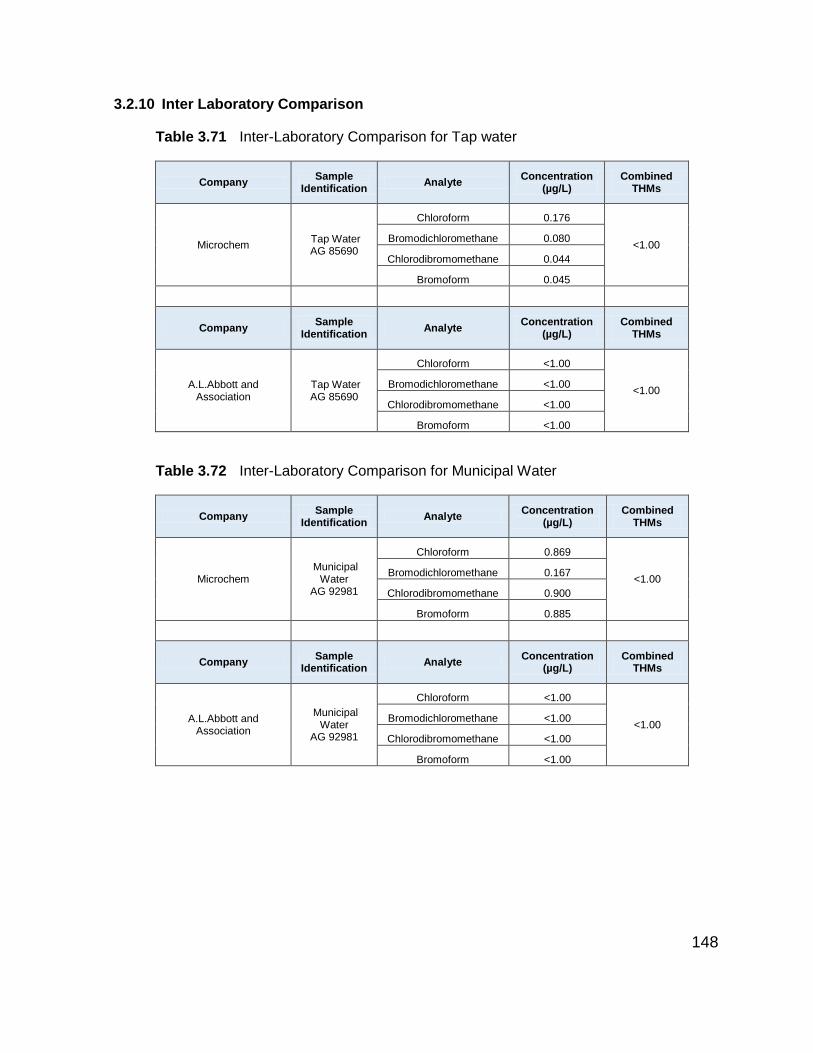
148
3.2.10 Inter Laboratory Comparison
Table 3.71 Inter-Laboratory Comparison for Tap water
Company Sample
Identification Analyte
Concentration (µg/L)
Combined THMs
Microchem Tap Water AG 85690
Chloroform 0.176
<1.00 Bromodichloromethane 0.080
Chlorodibromomethane 0.044
Bromoform 0.045
Company Sample
Identification Analyte
Concentration (µg/L)
Combined THMs
A.L.Abbott and Association
Tap Water AG 85690
Chloroform <1.00
<1.00 Bromodichloromethane <1.00
Chlorodibromomethane <1.00
Bromoform <1.00
Table 3.72 Inter-Laboratory Comparison for Municipal Water
Company Sample
Identification Analyte
Concentration (µg/L)
Combined THMs
Microchem Municipal
Water AG 92981
Chloroform 0.869
<1.00 Bromodichloromethane 0.167
Chlorodibromomethane 0.900
Bromoform 0.885
Company Sample
Identification Analyte
Concentration (µg/L)
Combined THMs
A.L.Abbott and Association
Municipal Water
AG 92981
Chloroform <1.00
<1.00 Bromodichloromethane <1.00
Chlorodibromomethane <1.00
Bromoform <1.00
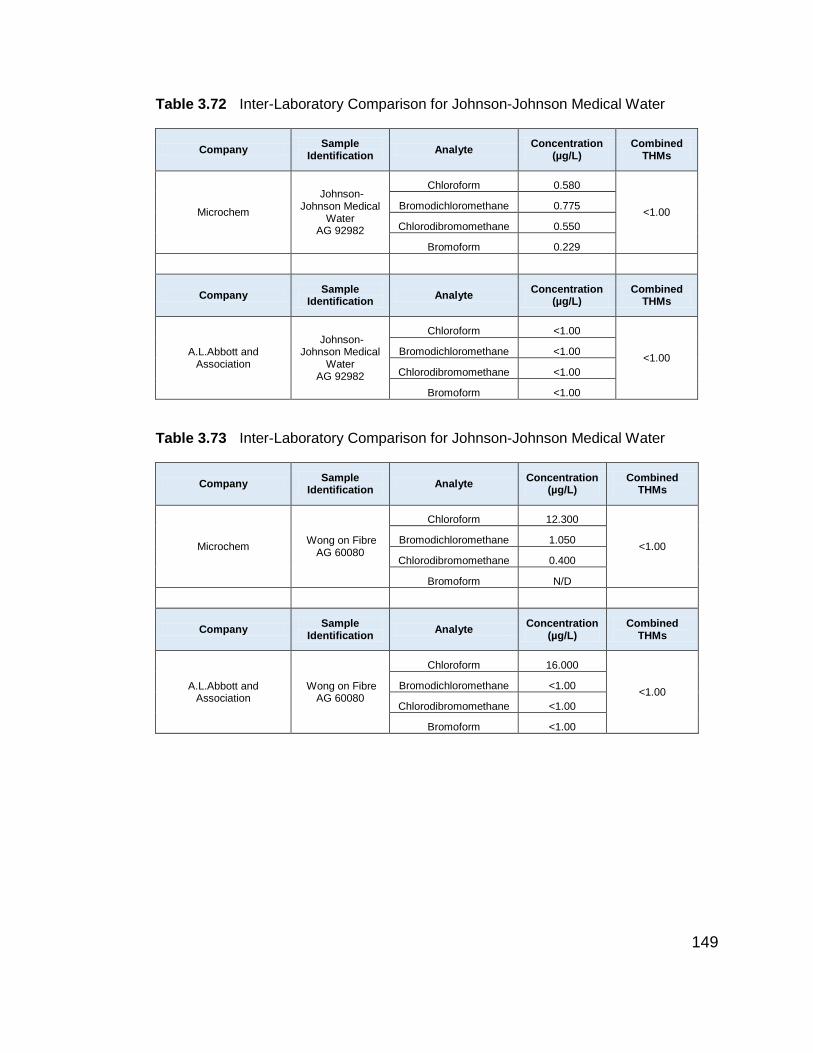
149
Table 3.72 Inter-Laboratory Comparison for Johnson-Johnson Medical Water
Company Sample
Identification Analyte
Concentration (µg/L)
Combined THMs
Microchem
Johnson-Johnson Medical
Water AG 92982
Chloroform 0.580
<1.00 Bromodichloromethane 0.775
Chlorodibromomethane 0.550
Bromoform 0.229
Company Sample
Identification Analyte
Concentration (µg/L)
Combined THMs
A.L.Abbott and Association
Johnson-Johnson Medical
Water AG 92982
Chloroform <1.00
<1.00 Bromodichloromethane <1.00
Chlorodibromomethane <1.00
Bromoform <1.00
Table 3.73 Inter-Laboratory Comparison for Johnson-Johnson Medical Water
Company Sample
Identification Analyte
Concentration (µg/L)
Combined THMs
Microchem Wong on Fibre
AG 60080
Chloroform 12.300
<1.00 Bromodichloromethane 1.050
Chlorodibromomethane 0.400
Bromoform N/D
Company Sample
Identification Analyte
Concentration (µg/L)
Combined THMs
A.L.Abbott and Association
Wong on Fibre AG 60080
Chloroform 16.000
<1.00 Bromodichloromethane <1.00
Chlorodibromomethane <1.00
Bromoform <1.00
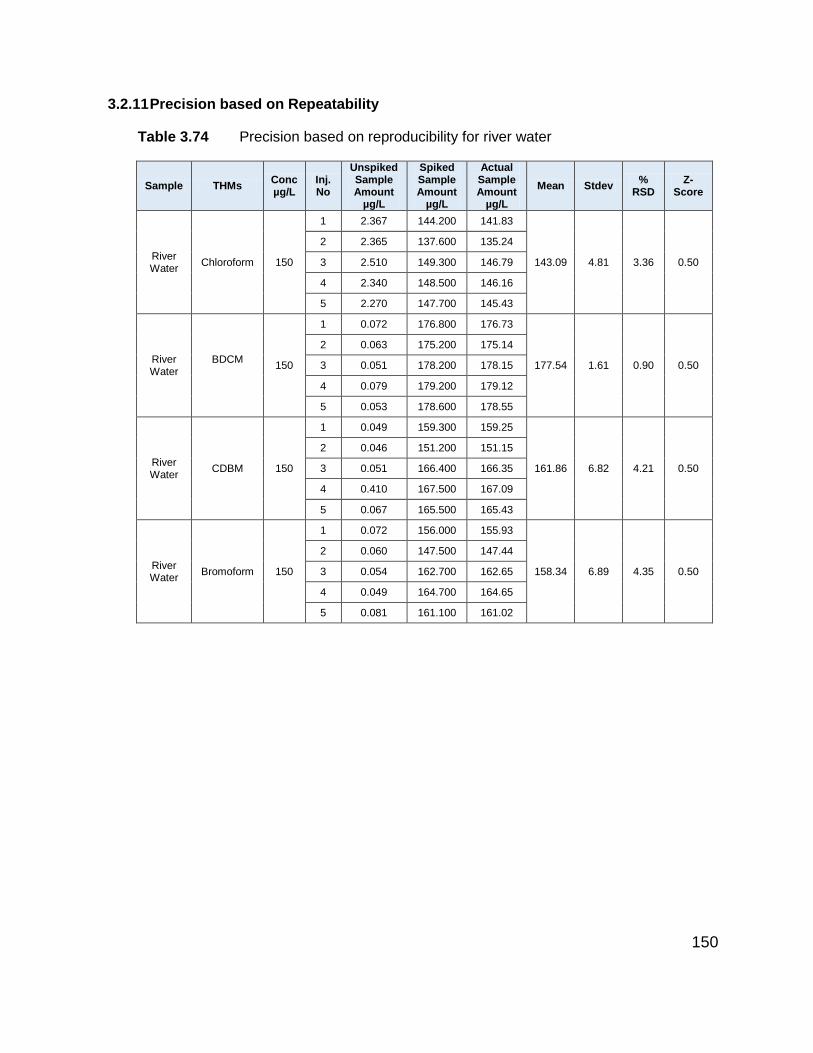
150
3.2.11 Precision based on Repeatability
Table 3.74 Precision based on reproducibility for river water
Sample THMs Conc µg/L
Inj. No
Unspiked Sample Amount
µg/L
Spiked Sample Amount
µg/L
Actual Sample Amount
µg/L
Mean Stdev %
RSD Z-
Score
River Water
Chloroform 150
1 2.367 144.200 141.83
143.09 4.81 3.36 0.50
2 2.365 137.600 135.24
3 2.510 149.300 146.79
4 2.340 148.500 146.16
5 2.270 147.700 145.43
River Water
BDCM
150
1 0.072 176.800 176.73
177.54 1.61 0.90 0.50
2 0.063 175.200 175.14
3 0.051 178.200 178.15
4 0.079 179.200 179.12
5 0.053 178.600 178.55
River Water
CDBM 150
1 0.049 159.300 159.25
161.86 6.82 4.21 0.50
2 0.046 151.200 151.15
3 0.051 166.400 166.35
4 0.410 167.500 167.09
5 0.067 165.500 165.43
River Water
Bromoform 150
1 0.072 156.000 155.93
158.34 6.89 4.35 0.50
2 0.060 147.500 147.44
3 0.054 162.700 162.65
4 0.049 164.700 164.65
5 0.081 161.100 161.02

151
Table 3.75 Precision based on reproducibility for municipal water
Sample THMs Conc µg/L
Inj No
Unspiked Sample Amount
µg/L
Spiked Sample Amount
µg/L
Actual Sample Amount
µg/L
Mean Stdev %
RSD Z-
Score
Municipal Water
Chloroform 150
1 2.208 165.110 162.902
161.85 4.82 2.98 0.50
2 2.230 160.150 157.920
3 2.230 169.910 167.680
4 2.258 167.100 164.842
5 2.391 158.310 155.919
Municipal Water
BDCM
150
1 0.138 170.360 170.222
171.89 2.60 1.51 0.50
2 0.139 169.500 169.361
3 0.149 171.000 170.851
4 0.147 175.910 175.763
5 0.123 173.360 173.237
Municipal Water
CDBM 150
1 0.068 168.600 168.532
174.11 5.02 2.88 0.50
2 0.070 169.030 168.960
3 0.091 177.170 177.079
4 0.075 179.510 179.435
5 0.067 176.595 176.528
Municipal Water
Bromoform 150
1 0.073 160.347 160.274
165.96 5.03 3.03 0.50
2 0.080 161.050 160.970
3 0.069 169.170 169.101
4 0.050 171.511 171.461
5 0.091 168.082 167.991
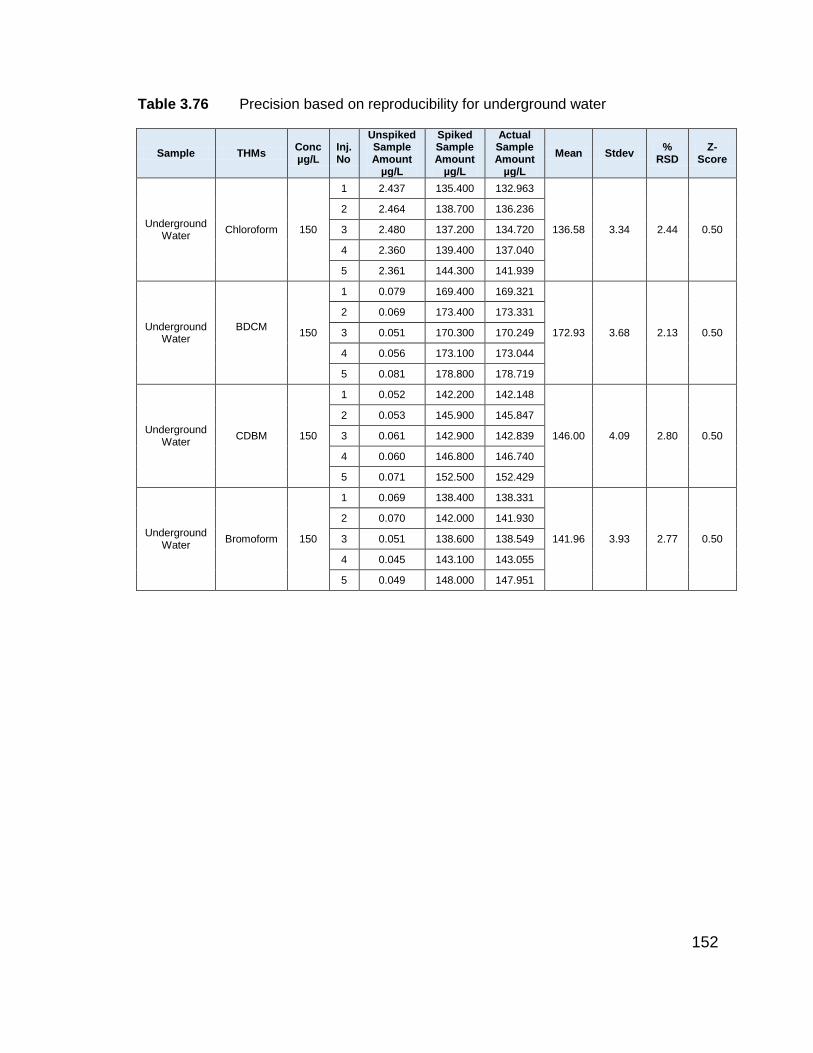
152
Table 3.76 Precision based on reproducibility for underground water
Sample THMs Conc µg/L
Inj. No
Unspiked Sample Amount
µg/L
Spiked Sample Amount
µg/L
Actual Sample Amount
µg/L
Mean Stdev %
RSD Z-
Score
Underground Water
Chloroform 150
1 2.437 135.400 132.963
136.58 3.34 2.44 0.50
2 2.464 138.700 136.236
3 2.480 137.200 134.720
4 2.360 139.400 137.040
5 2.361 144.300 141.939
Underground Water
BDCM
150
1 0.079 169.400 169.321
172.93 3.68 2.13 0.50
2 0.069 173.400 173.331
3 0.051 170.300 170.249
4 0.056 173.100 173.044
5 0.081 178.800 178.719
Underground Water
CDBM 150
1 0.052 142.200 142.148
146.00 4.09 2.80 0.50
2 0.053 145.900 145.847
3 0.061 142.900 142.839
4 0.060 146.800 146.740
5 0.071 152.500 152.429
Underground Water
Bromoform 150
1 0.069 138.400 138.331
141.96 3.93 2.77 0.50
2 0.070 142.000 141.930
3 0.051 138.600 138.549
4 0.045 143.100 143.055
5 0.049 148.000 147.951
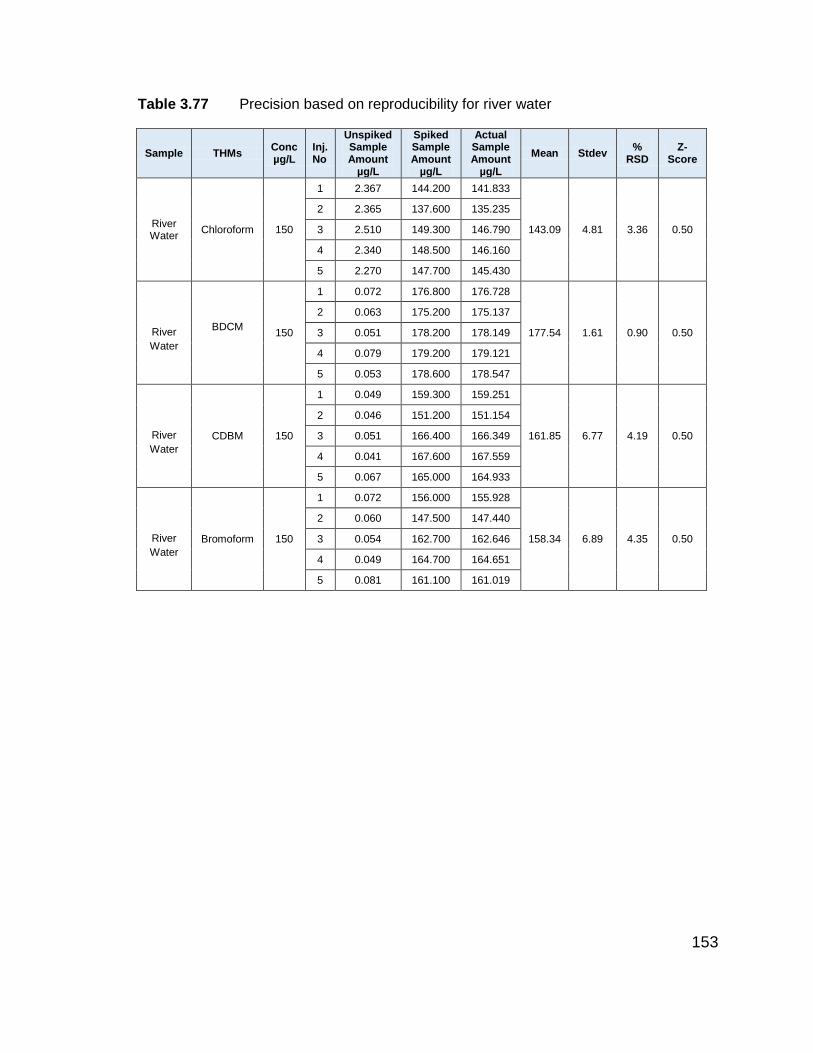
153
Table 3.77 Precision based on reproducibility for river water
Sample THMs Conc µg/L
Inj. No
Unspiked Sample Amount
µg/L
Spiked Sample Amount
µg/L
Actual Sample Amount
µg/L
Mean Stdev %
RSD Z-
Score
River Water
Chloroform 150
1 2.367 144.200 141.833
143.09 4.81 3.36 0.50
2 2.365 137.600 135.235
3 2.510 149.300 146.790
4 2.340 148.500 146.160
5 2.270 147.700 145.430
River
Water
BDCM
150
1 0.072 176.800 176.728
177.54 1.61 0.90 0.50
2 0.063 175.200 175.137
3 0.051 178.200 178.149
4 0.079 179.200 179.121
5 0.053 178.600 178.547
River
Water
CDBM 150
1 0.049 159.300 159.251
161.85 6.77 4.19 0.50
2 0.046 151.200 151.154
3 0.051 166.400 166.349
4 0.041 167.600 167.559
5 0.067 165.000 164.933
River
Water
Bromoform 150
1 0.072 156.000 155.928
158.34 6.89 4.35 0.50
2 0.060 147.500 147.440
3 0.054 162.700 162.646
4 0.049 164.700 164.651
5 0.081 161.100 161.019
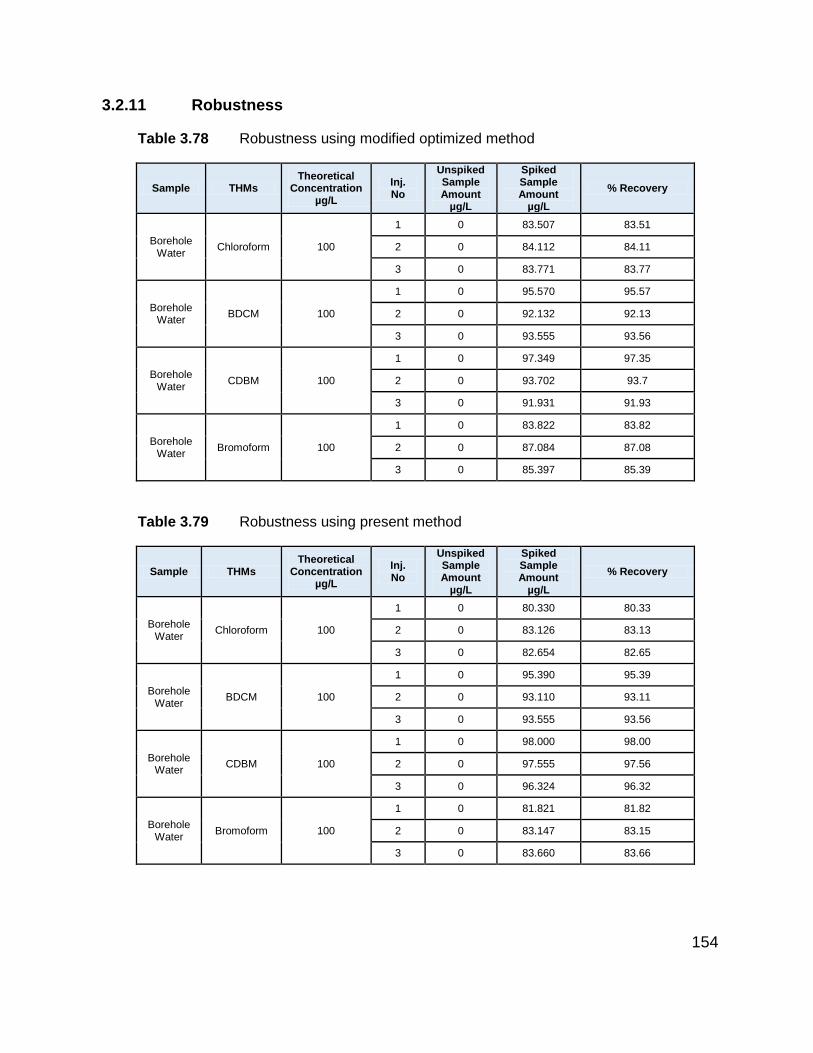
154
3.2.11 Robustness
Table 3.78 Robustness using modified optimized method
Sample THMs Theoretical
Concentration µg/L
Inj. No
Unspiked Sample Amount
µg/L
Spiked Sample Amount
µg/L
% Recovery
Borehole Water
Chloroform 100
1 0 83.507 83.51
2 0 84.112 84.11
3 0 83.771 83.77
Borehole Water
100
1 0 95.570 95.57
BDCM 2 0 92.132 92.13
3 0 93.555 93.56
Borehole Water
CDBM 100
1 0 97.349 97.35
2 0 93.702 93.7
3 0 91.931 91.93
Borehole Water
Bromoform 100
1 0 83.822 83.82
2 0 87.084 87.08
3 0 85.397 85.39
Table 3.79 Robustness using present method
Sample THMs Theoretical
Concentration µg/L
Inj. No
Unspiked Sample Amount
µg/L
Spiked Sample Amount
µg/L
% Recovery
Borehole Water
Chloroform 100
1 0 80.330 80.33
2 0 83.126 83.13
3 0 82.654 82.65
Borehole Water
BDCM
100
1 0 95.390 95.39
2 0 93.110 93.11
3 0 93.555 93.56
Borehole Water
CDBM 100
1 0 98.000 98.00
2 0 97.555 97.56
3 0 96.324 96.32
Borehole Water
Bromoform 100
1 0 81.821 81.82
2 0 83.147 83.15
3 0 83.660 83.66
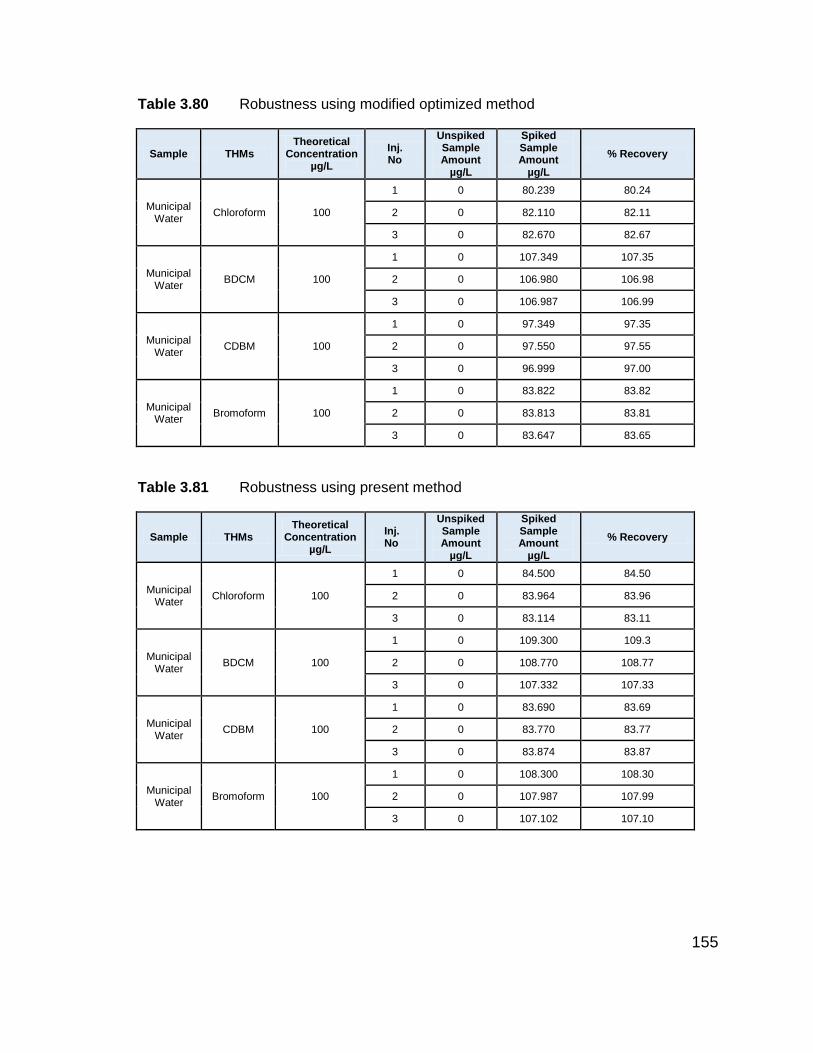
155
Table 3.80 Robustness using modified optimized method
Sample THMs Theoretical
Concentration µg/L
Inj. No
Unspiked Sample Amount
µg/L
Spiked Sample Amount
µg/L
% Recovery
Municipal Water
Chloroform 100
1 0 80.239 80.24
2 0 82.110 82.11
3 0 82.670 82.67
Municipal Water
BDCM
100
1 0 107.349 107.35
2 0 106.980 106.98
3 0 106.987 106.99
Municipal Water
CDBM 100
1 0 97.349 97.35
2 0 97.550 97.55
3 0 96.999 97.00
Municipal Water
Bromoform 100
1 0 83.822 83.82
2 0 83.813 83.81
3 0 83.647 83.65
Table 3.81 Robustness using present method
Sample THMs Theoretical
Concentration µg/L
Inj. No
Unspiked Sample Amount
µg/L
Spiked Sample Amount
µg/L
% Recovery
Municipal Water
Chloroform 100
1 0 84.500 84.50
2 0 83.964 83.96
3 0 83.114 83.11
Municipal Water
BDCM
100
1 0 109.300 109.3
2 0 108.770 108.77
3 0 107.332 107.33
Municipal Water
CDBM 100
1 0 83.690 83.69
2 0 83.770 83.77
3 0 83.874 83.87
Municipal Water
Bromoform 100
1 0 108.300 108.30
2 0 107.987 107.99
3 0 107.102 107.10
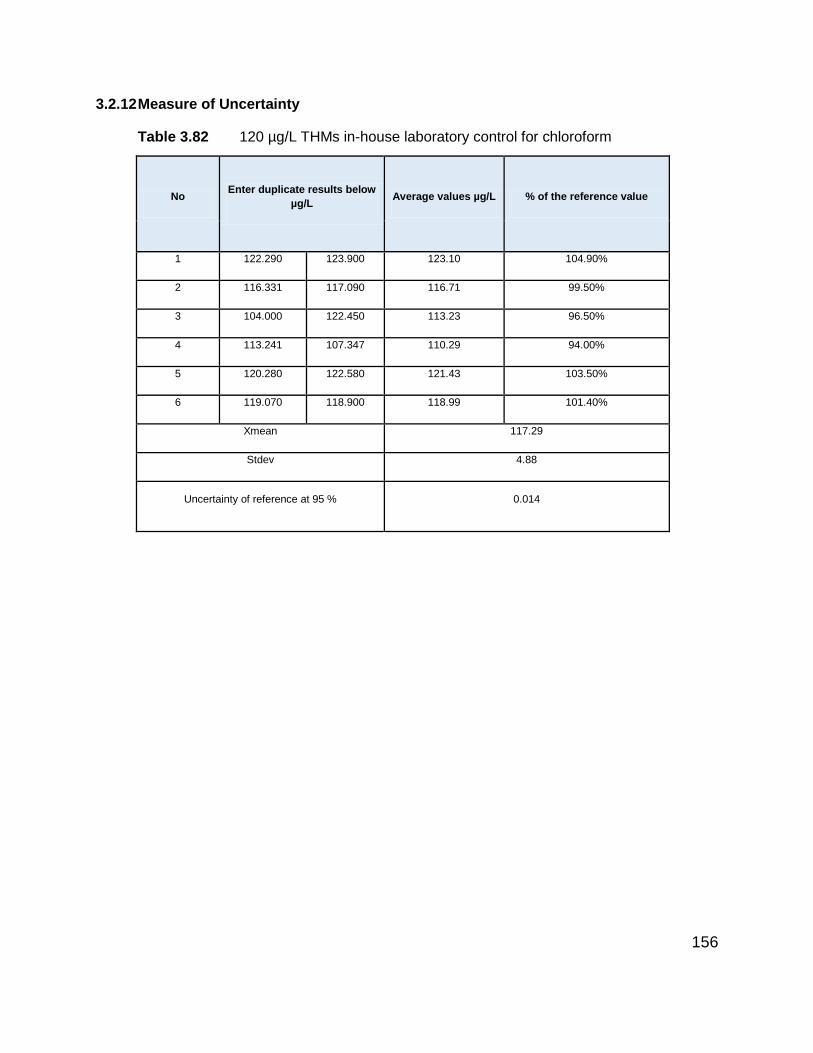
156
3.2.12 Measure of Uncertainty
Table 3.82 120 µg/L THMs in-house laboratory control for chloroform
No Enter duplicate results below
µg/L Average values µg/L % of the reference value
1 122.290 123.900 123.10 104.90%
2 116.331 117.090 116.71 99.50%
3 104.000 122.450 113.23 96.50%
4 113.241 107.347 110.29 94.00%
5 120.280 122.580 121.43 103.50%
6 119.070 118.900 118.99 101.40%
Xmean 117.29
Stdev 4.88
Uncertainty of reference at 95 % 0.014

157
Table 3.83 Measure of Uncertainty for Chloroform
Statistical calculations
Number of valid values
Detection of suspect values
Tolerance interval
Classical
Min
109.24
Max
125.34
Conclusion
There is no suspect value
Analysis of trueness vs. Reference Sample
Classical
Median / mean of results
117.290
SD(results) 4.88906
SD(iR)
6.3157
Recovery 100.0%
SD(Recovery)
0.017
t test 0.000
p value
100.0%
Uncertainty of recovery 0.017
Relative uncertainty of recovery
1.70%
Confidence interval Min 95.6%
Max
104.4%
The recovery is NOT different from 100% (at 95% confidence)
MU - Eurolab - Technical Report No.1/2007 March 2007 "Measurement uncertainty revisited: Alternative approaches to uncertainty evaluation"
Delta -
0.000
Bias - b 2.5784
uncertainty - u
5.5273
Expanded overall u (K=2): u = 11.0546
Relative uncertainty
4.71%
Expanded overall relative u : u% = 9.42%
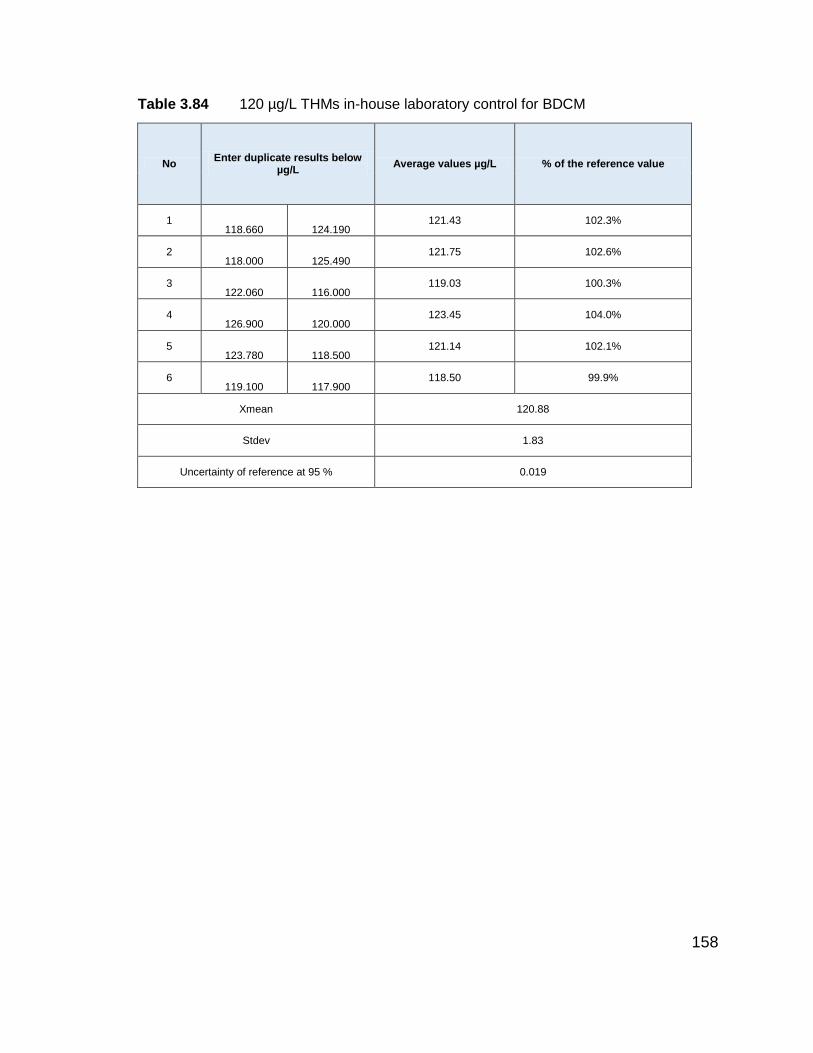
158
Table 3.84 120 µg/L THMs in-house laboratory control for BDCM
No Enter duplicate results below
µg/L Average values µg/L % of the reference value
1 118.660 124.190
121.43 102.3%
2 118.000 125.490
121.75 102.6%
3 122.060 116.000
119.03 100.3%
4 126.900 120.000
123.45 104.0%
5 123.780 118.500
121.14 102.1%
6 119.100 117.900
118.50 99.9%
Xmean 120.88
Stdev 1.83
Uncertainty of reference at 95 % 0.019
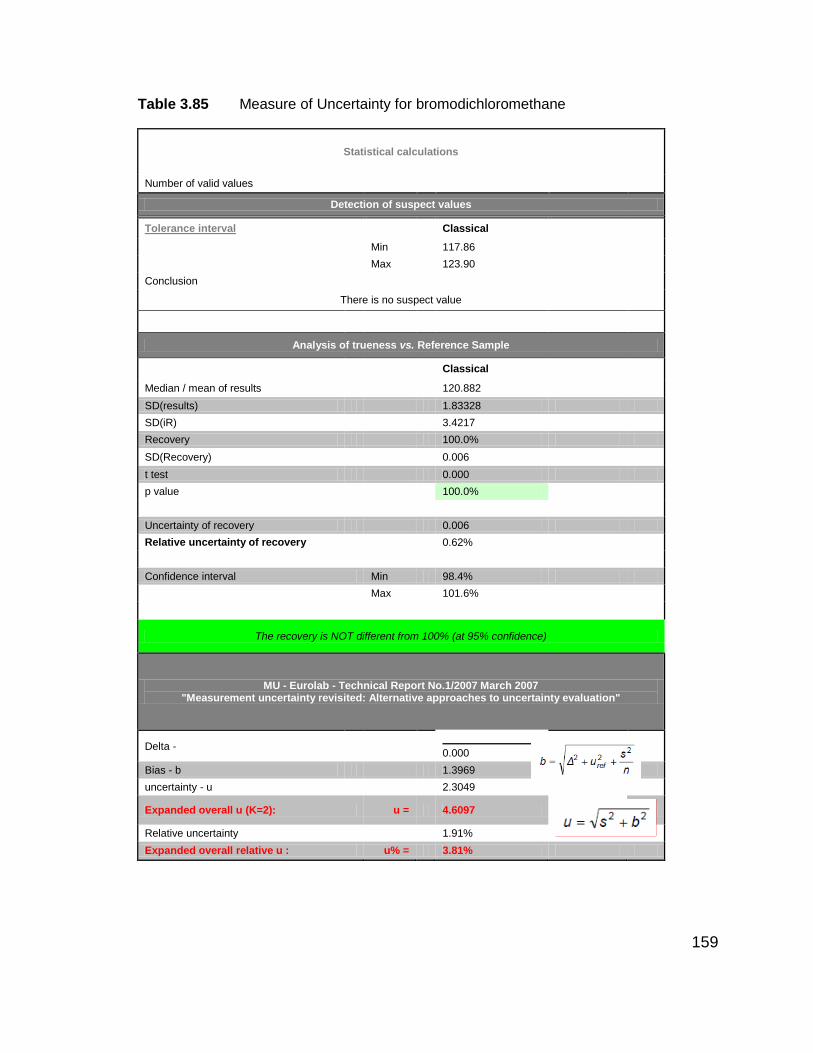
159
Table 3.85 Measure of Uncertainty for bromodichloromethane
Statistical calculations
Number of valid values
Detection of suspect values
Tolerance interval
Classical
Min
117.86
Max
123.90
Conclusion
There is no suspect value
Analysis of trueness vs. Reference Sample
Classical
Median / mean of results
120.882
SD(results) 1.83328
SD(iR)
3.4217
Recovery 100.0%
SD(Recovery)
0.006
t test 0.000
p value
100.0%
Uncertainty of recovery 0.006
Relative uncertainty of recovery
0.62%
Confidence interval Min 98.4%
Max
101.6%
The recovery is NOT different from 100% (at 95% confidence)
MU - Eurolab - Technical Report No.1/2007 March 2007 "Measurement uncertainty revisited: Alternative approaches to uncertainty evaluation"
Delta -
0.000
Bias - b 1.3969
uncertainty - u
2.3049
Expanded overall u (K=2): u = 4.6097
Relative uncertainty
1.91%
Expanded overall relative u : u% = 3.81%
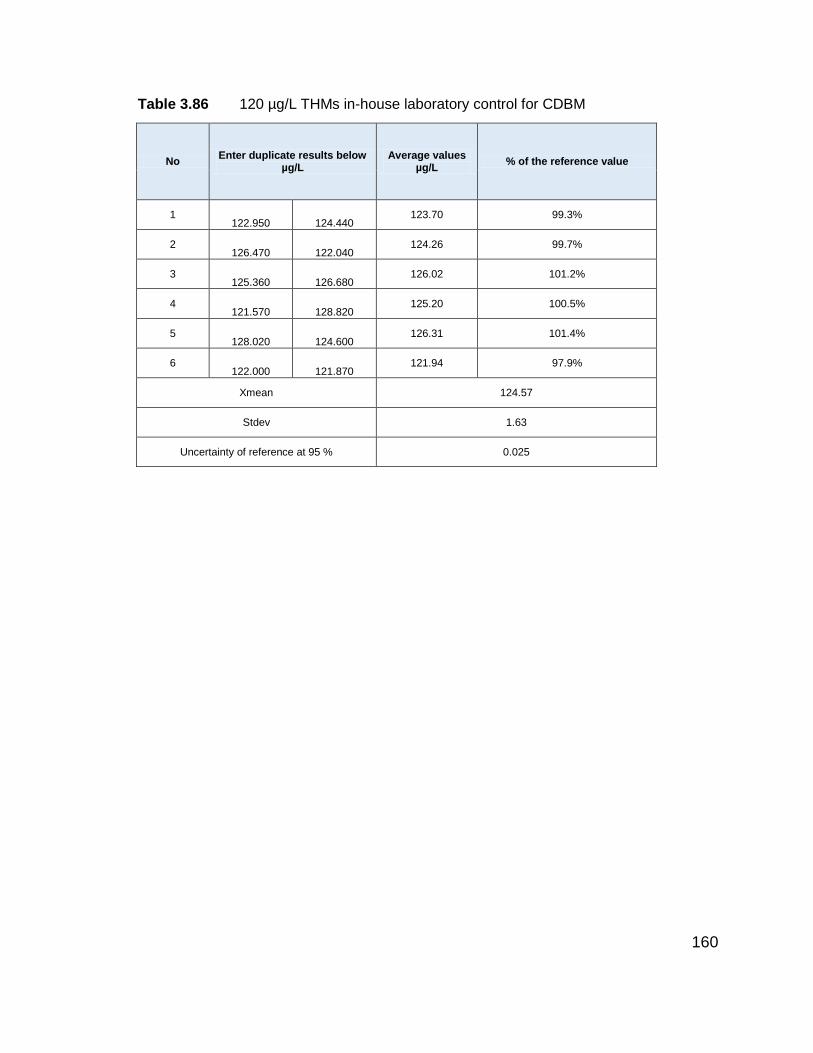
160
Table 3.86 120 µg/L THMs in-house laboratory control for CDBM
No Enter duplicate results below
µg/L Average values
µg/L % of the reference value
1 122.950 124.440
123.70 99.3%
2 126.470 122.040
124.26 99.7%
3 125.360 126.680
126.02 101.2%
4 121.570 128.820
125.20 100.5%
5 128.020 124.600
126.31 101.4%
6 122.000 121.870
121.94 97.9%
Xmean 124.57
Stdev 1.63
Uncertainty of reference at 95 % 0.025

161
Table 3.87 Measure of Uncertainty for chlorodibromomethane
Statistical calculations
Number of valid values
Detection of suspect values
Tolerance interval
Classical
Min
121.88
Max
127.26
Conclusion
There is no suspect value
Analysis of trueness vs. Reference Sample
Classical
Median / mean of results
124.568
SD(results) 1.63271
SD(iR)
2.5153
Recovery 100.0%
SD(Recovery)
0.005
t test 0.000
p value
100.0%
Uncertainty of recovery 0.005
Relative uncertainty of recovery
0.54%
Confidence interval Min 98.6%
Max
101.4%
The recovery is NOT different from 100% (at 95% confidence)
MU - Eurolab - Technical Report No.1/2007 March 2007 "Measurement uncertainty revisited: Alternative approaches to uncertainty evaluation"
Delta -
0.000
Bias - b 1.0269
uncertainty - u
1.9288
Expanded overall u (K=2): u = 3.8577
Relative uncertainty
1.55%
Expanded overall relative u : u% = 3.10%
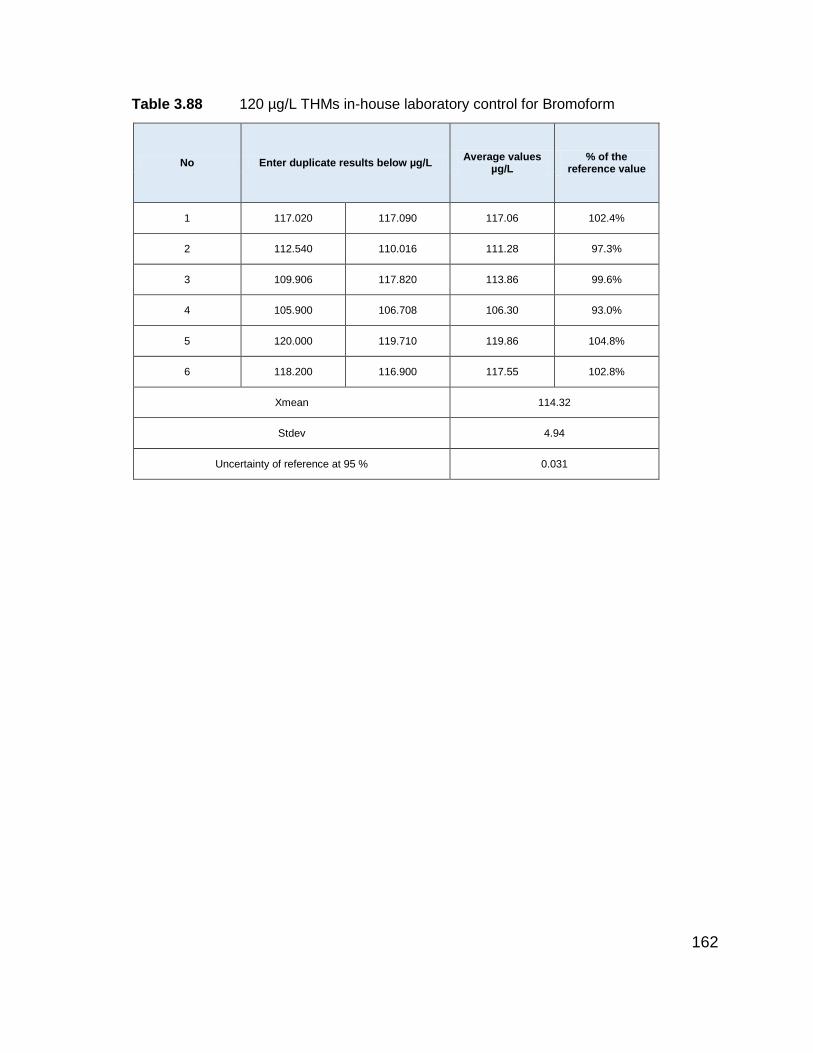
162
Table 3.88 120 µg/L THMs in-house laboratory control for Bromoform
No Enter duplicate results below µg/L Average values
µg/L % of the
reference value
1 117.020 117.090 117.06 102.4%
2 112.540 110.016 111.28 97.3%
3 109.906 117.820 113.86 99.6%
4 105.900 106.708 106.30 93.0%
5 120.000 119.710 119.86 104.8%
6 118.200 116.900 117.55 102.8%
Xmean 114.32
Stdev 4.94
Uncertainty of reference at 95 % 0.031
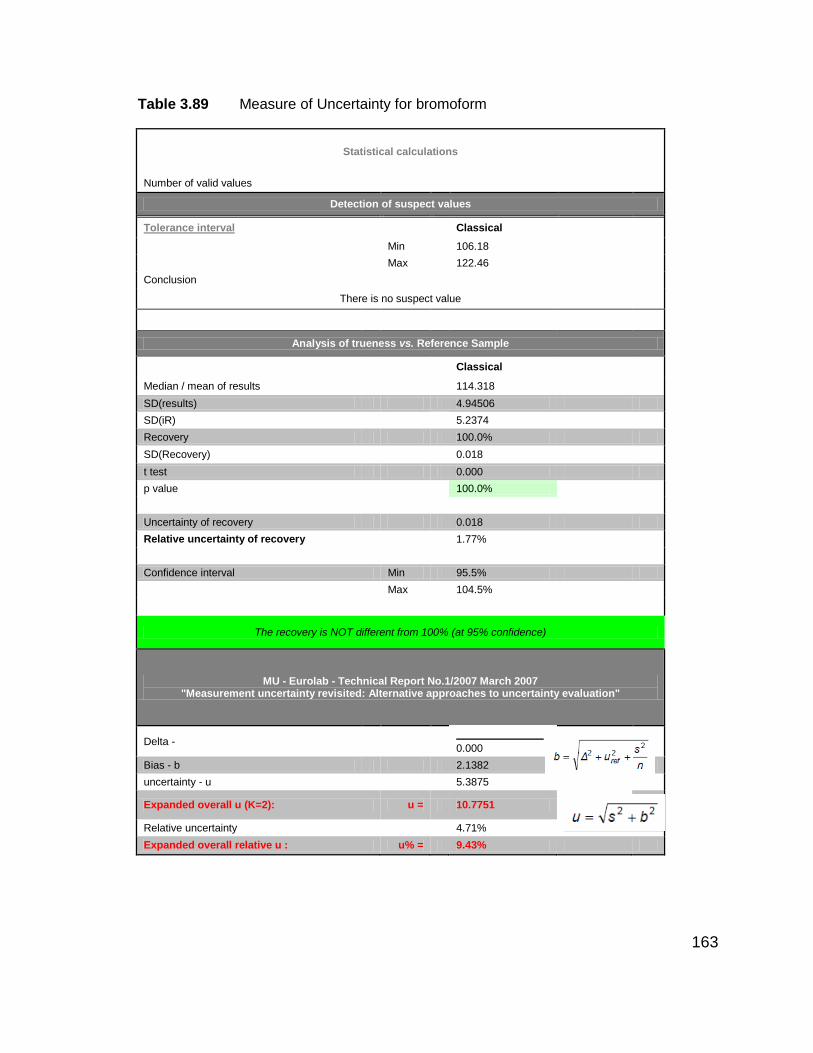
163
Table 3.89 Measure of Uncertainty for bromoform
Statistical calculations
Number of valid values
Detection of suspect values
Tolerance interval
Classical
Min
106.18
Max
122.46
Conclusion
There is no suspect value
Analysis of trueness vs. Reference Sample
Classical
Median / mean of results
114.318
SD(results) 4.94506
SD(iR)
5.2374
Recovery 100.0%
SD(Recovery)
0.018
t test 0.000
p value
100.0%
Uncertainty of recovery 0.018
Relative uncertainty of recovery
1.77%
Confidence interval Min 95.5%
Max
104.5%
The recovery is NOT different from 100% (at 95% confidence)
MU - Eurolab - Technical Report No.1/2007 March 2007 "Measurement uncertainty revisited: Alternative approaches to uncertainty evaluation"
Delta -
0.000
Bias - b 2.1382
uncertainty - u
5.3875
Expanded overall u (K=2): u = 10.7751
Relative uncertainty
4.71%
Expanded overall relative u : u% = 9.43%
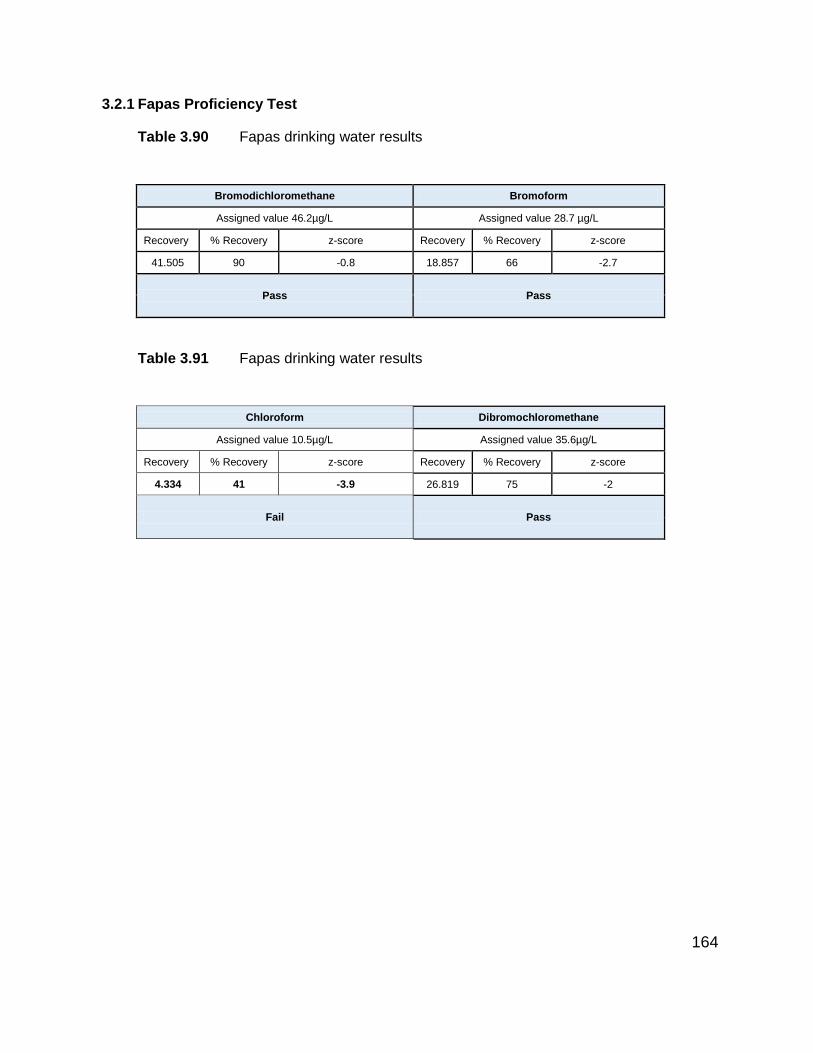
164
3.2.1 Fapas Proficiency Test
Table 3.90 Fapas drinking water results
Bromodichloromethane Bromoform
Assigned value 46.2µg/L Assigned value 28.7 µg/L
Recovery % Recovery z-score Recovery % Recovery z-score
41.505 90 -0.8 18.857 66 -2.7
Pass Pass
Table 3.91 Fapas drinking water results
Chloroform Dibromochloromethane
Assigned value 10.5µg/L Assigned value 35.6µg/L
Recovery % Recovery z-score Recovery % Recovery z-score
4.334 41 -3.9 26.819 75 -2
Fail Pass
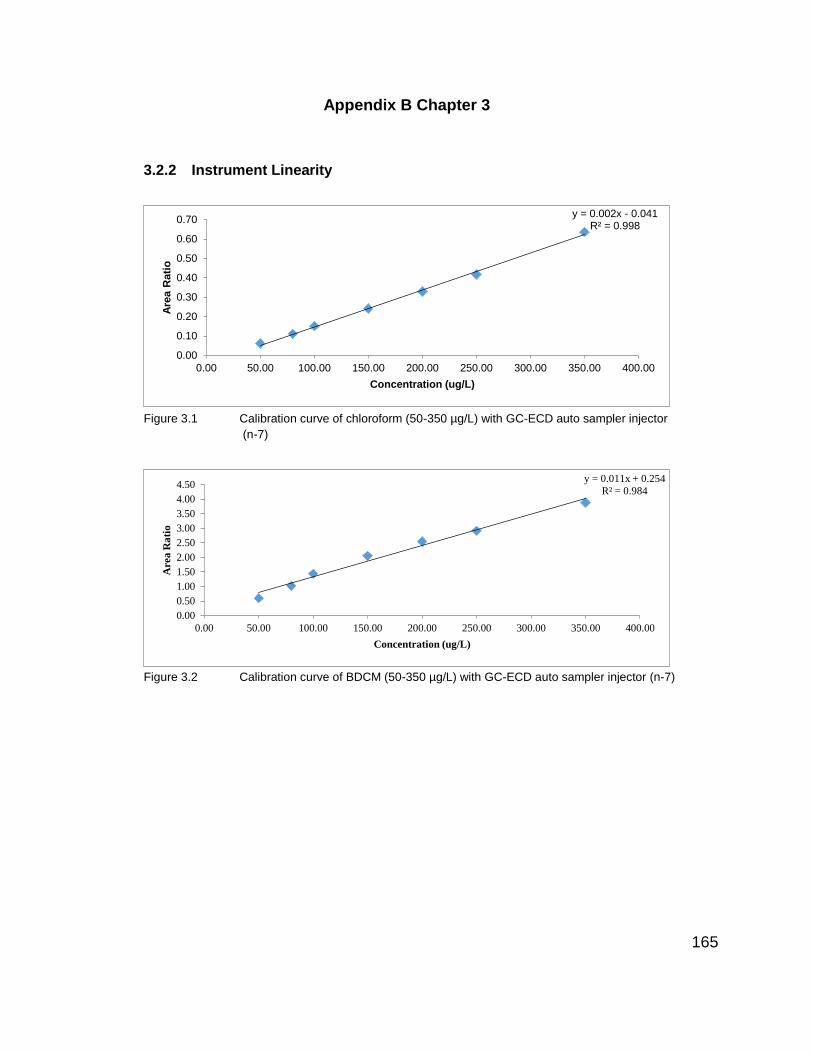
165
Appendix B Chapter 3
3.2.2 Instrument Linearity
Figure 3.1 Calibration curve of chloroform (50-350 µg/L) with GC-ECD auto sampler injector
(n-7)
Figure 3.2 Calibration curve of BDCM (50-350 µg/L) with GC-ECD auto sampler injector (n-7)
y = 0.002x - 0.041R² = 0.998
0.00
0.10
0.20
0.30
0.40
0.50
0.60
0.70
0.00 50.00 100.00 150.00 200.00 250.00 300.00 350.00 400.00
Are
a R
ati
o
Concentration (ug/L)
y = 0.011x + 0.254
R² = 0.984
0.00
0.50
1.00
1.50
2.00
2.50
3.00
3.50
4.00
4.50
0.00 50.00 100.00 150.00 200.00 250.00 300.00 350.00 400.00
Area
Ra
tio
Concentration (ug/L)
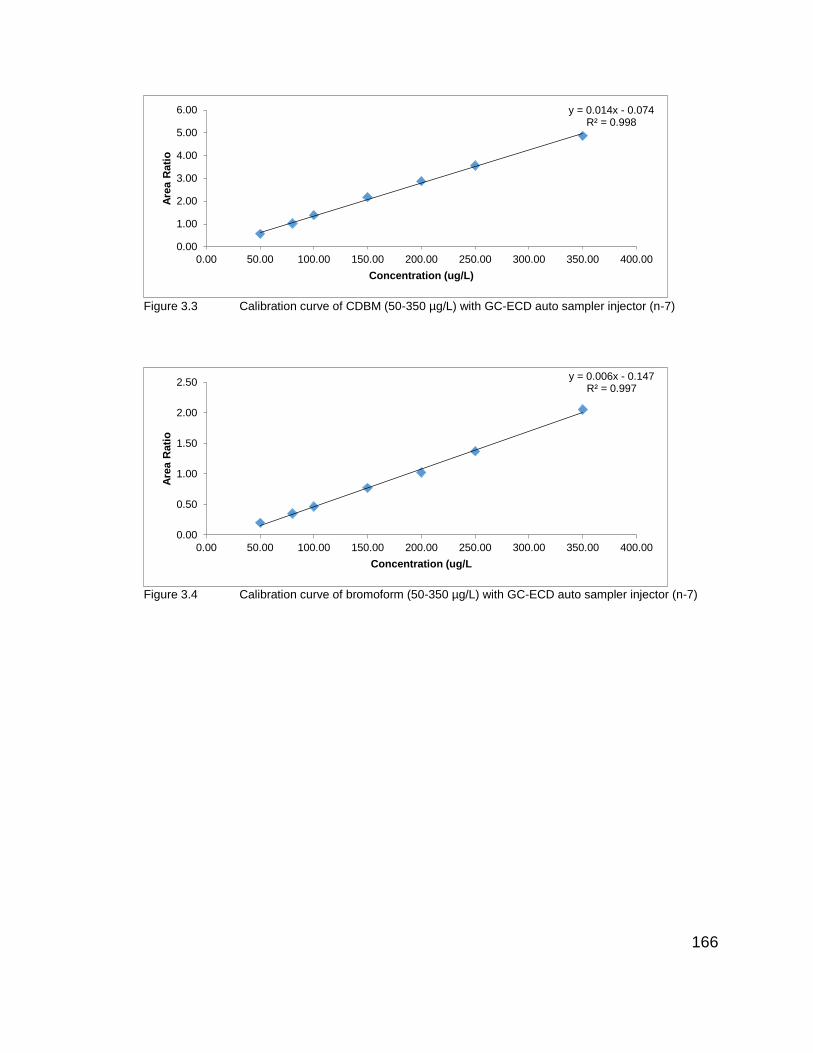
166
Figure 3.3 Calibration curve of CDBM (50-350 µg/L) with GC-ECD auto sampler injector (n-7)
Figure 3.4 Calibration curve of bromoform (50-350 µg/L) with GC-ECD auto sampler injector (n-7)
y = 0.014x - 0.074R² = 0.998
0.00
1.00
2.00
3.00
4.00
5.00
6.00
0.00 50.00 100.00 150.00 200.00 250.00 300.00 350.00 400.00
Are
a R
ati
o
Concentration (ug/L)
y = 0.006x - 0.147R² = 0.997
0.00
0.50
1.00
1.50
2.00
2.50
0.00 50.00 100.00 150.00 200.00 250.00 300.00 350.00 400.00
Are
a R
ati
o
Concentration (ug/L

167
3.2.8 Selectivity based on recovery
Figure 3.5 0 µg/L unspiked river water sample recoveries for the individual trihalomethanes
GC-ECD HP 7683 auto-sampler series injector.
`
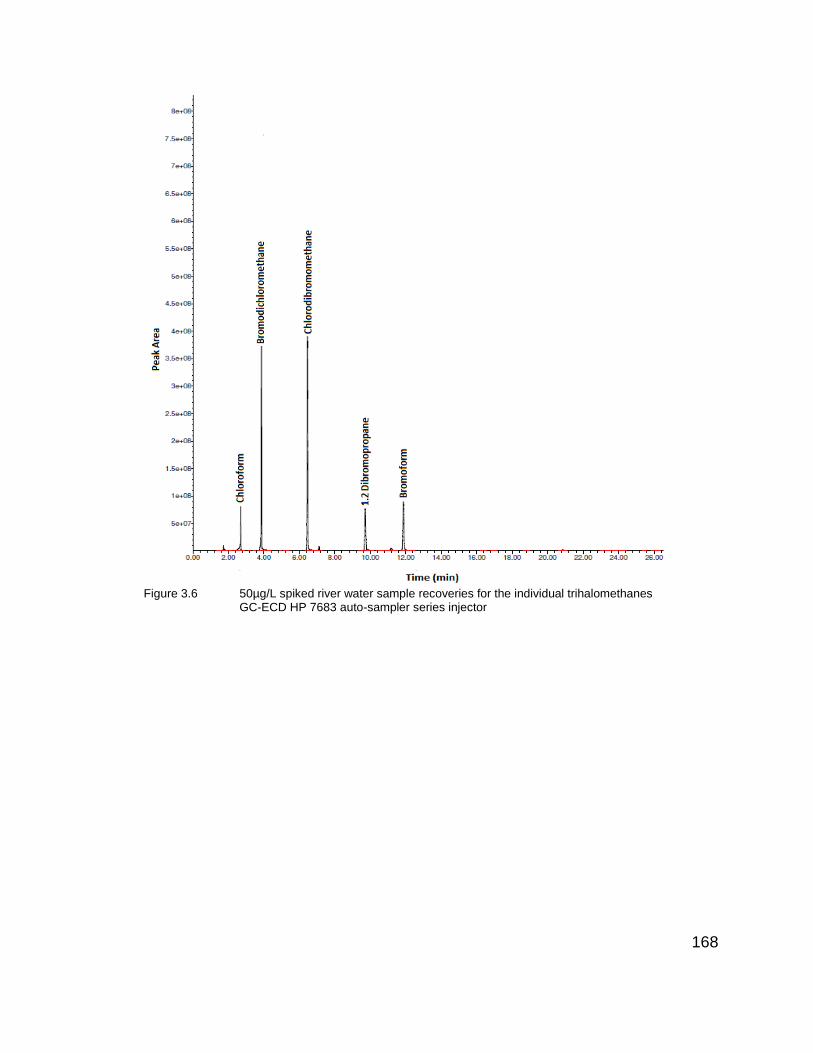
168
Figure 3.6 50µg/L spiked river water sample recoveries for the individual trihalomethanes
GC-ECD HP 7683 auto-sampler series injector
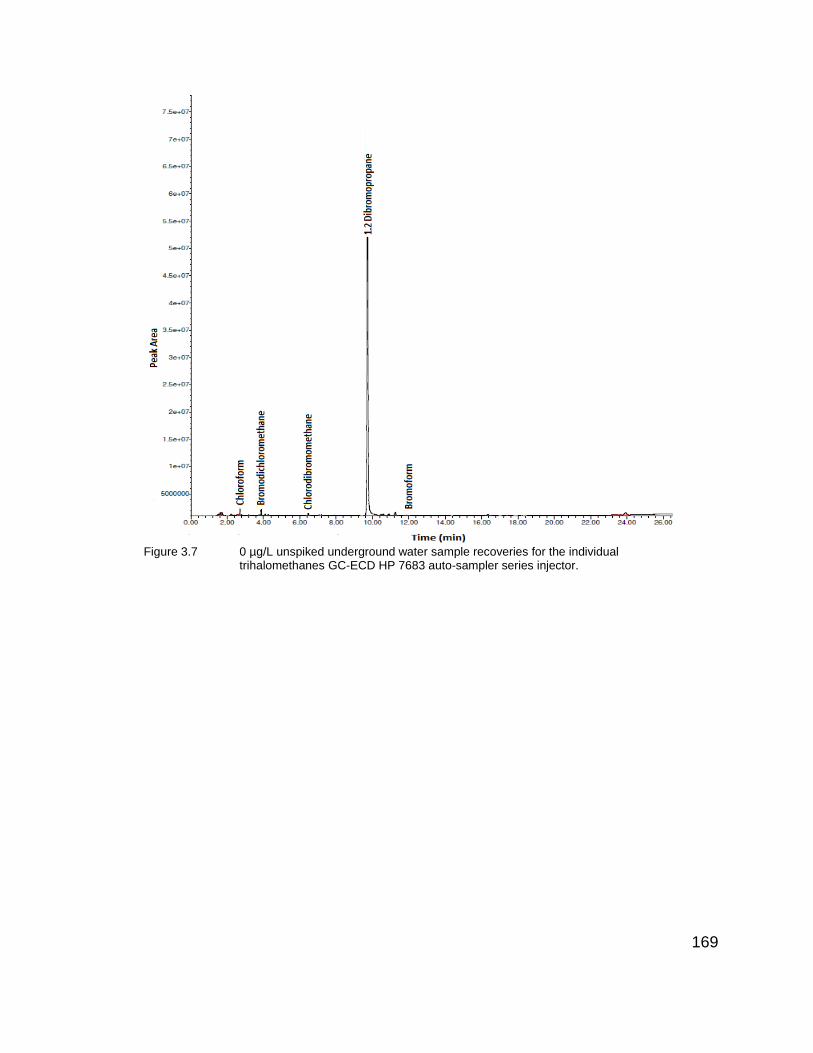
169
Figure 3.7 0 µg/L unspiked underground water sample recoveries for the individual
trihalomethanes GC-ECD HP 7683 auto-sampler series injector.
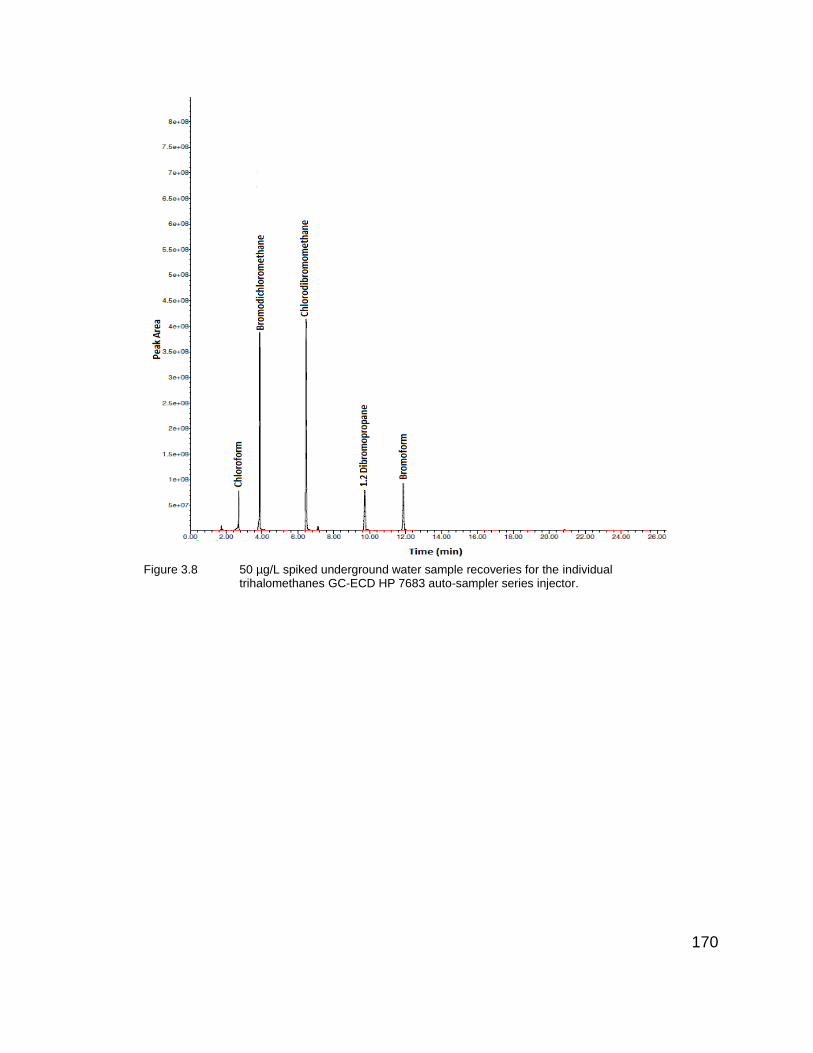
170
Figure 3.8 50 µg/L spiked underground water sample recoveries for the individual
trihalomethanes GC-ECD HP 7683 auto-sampler series injector.
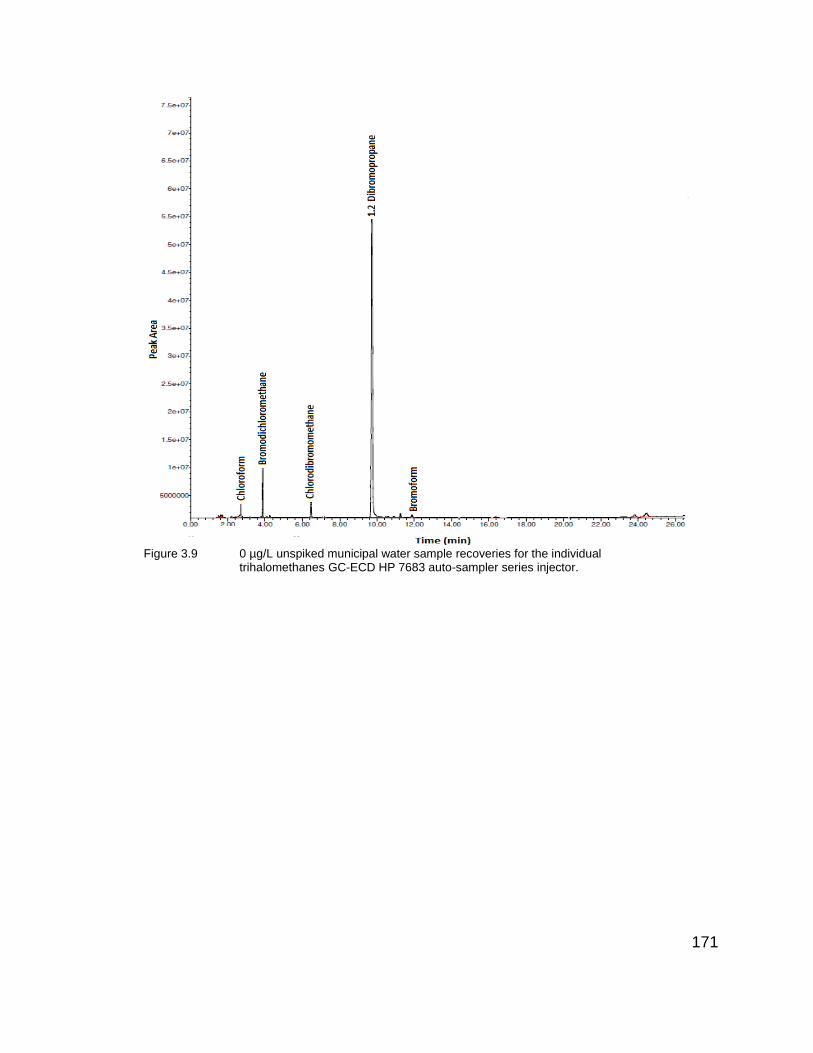
171
Figure 3.9 0 µg/L unspiked municipal water sample recoveries for the individual
trihalomethanes GC-ECD HP 7683 auto-sampler series injector.
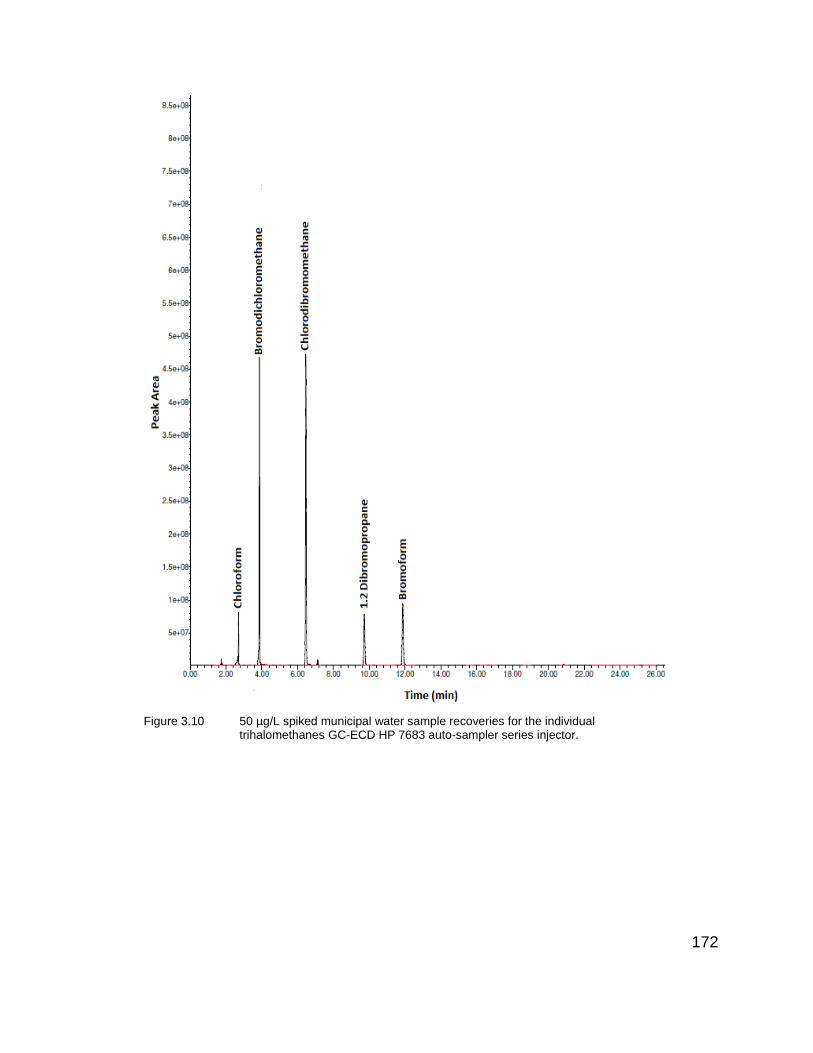
172
Figure 3.10 50 µg/L spiked municipal water sample recoveries for the individual
trihalomethanes GC-ECD HP 7683 auto-sampler series injector.
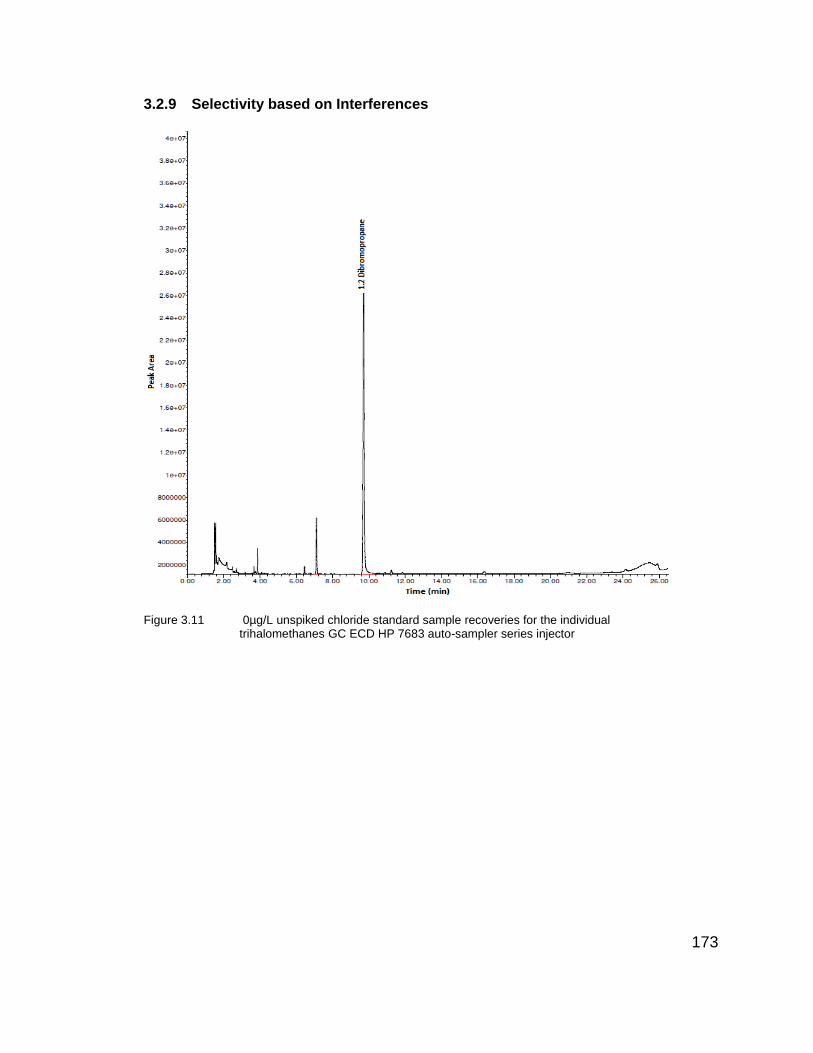
173
3.2.9 Selectivity based on Interferences
Figure 3.11 0µg/L unspiked chloride standard sample recoveries for the individual trihalomethanes GC ECD HP 7683 auto-sampler series injector
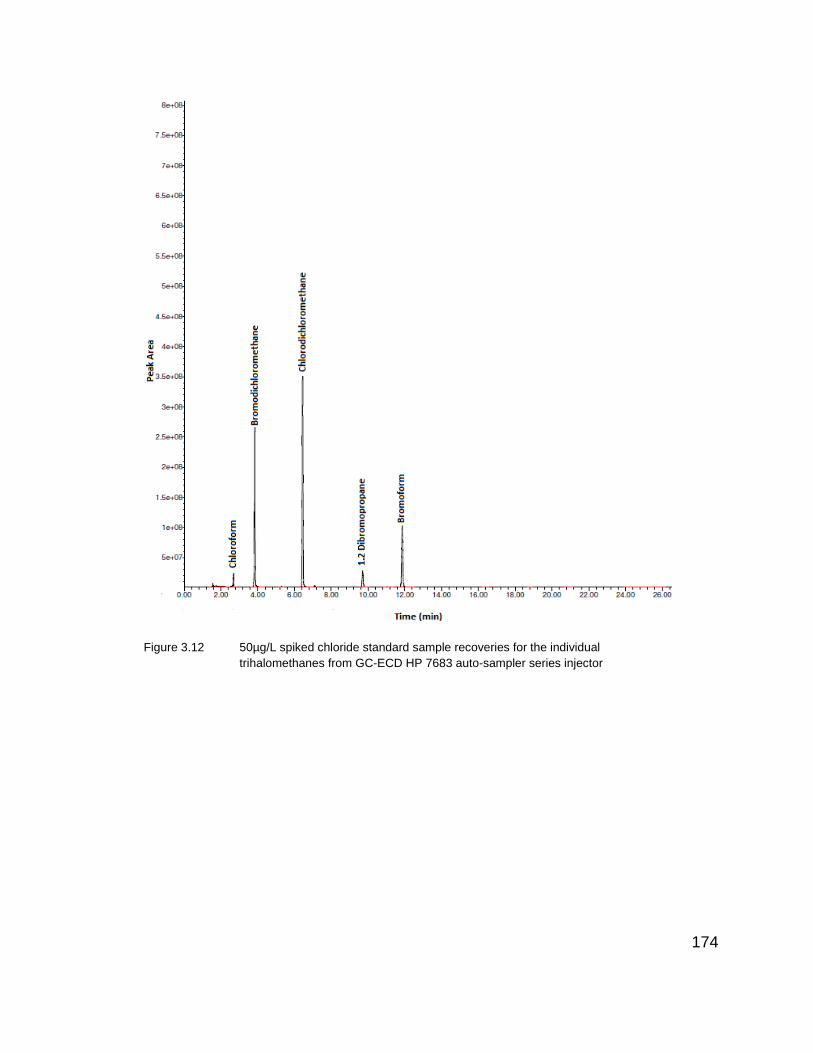
174
Figure 3.12 50µg/L spiked chloride standard sample recoveries for the individual
trihalomethanes from GC-ECD HP 7683 auto-sampler series injector
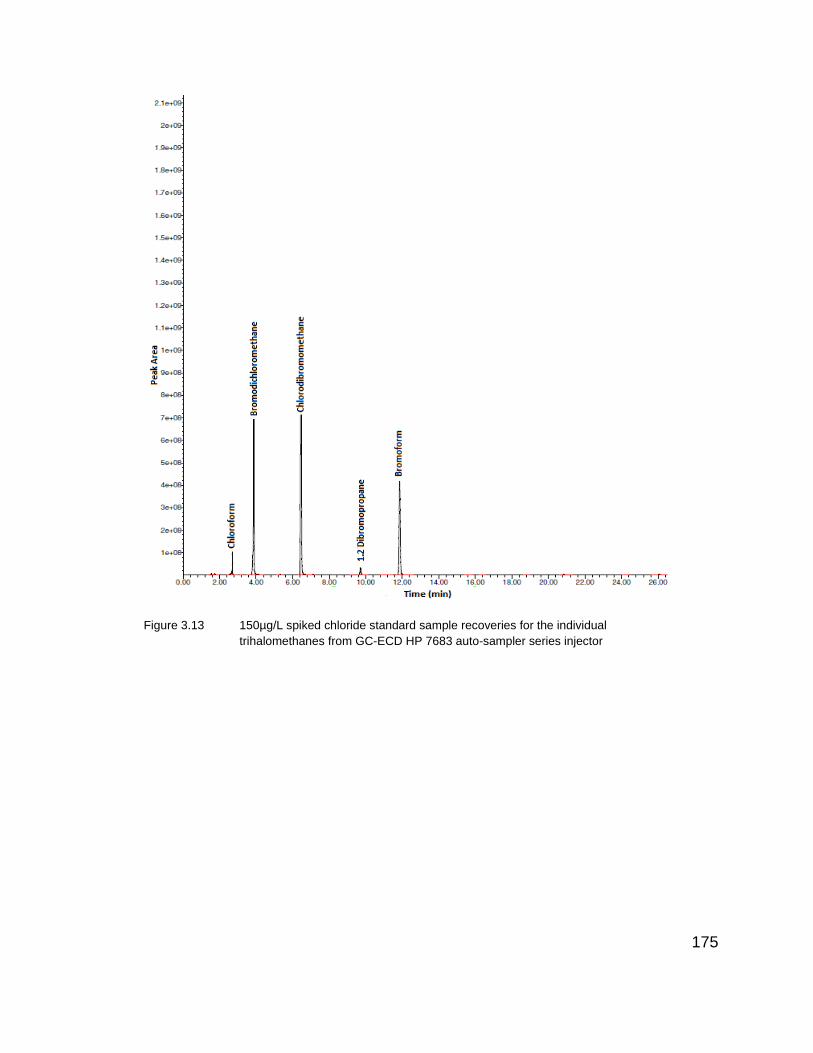
175
Figure 3.13 150µg/L spiked chloride standard sample recoveries for the individual
trihalomethanes from GC-ECD HP 7683 auto-sampler series injector
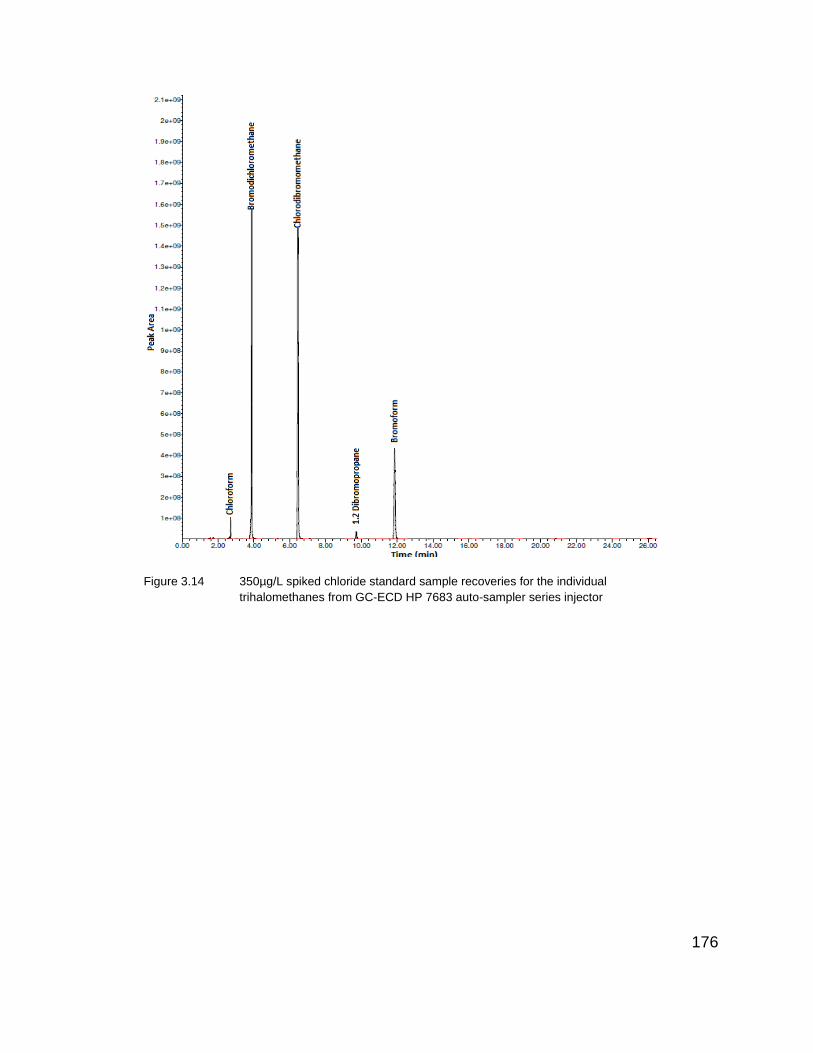
176
Figure 3.14 350µg/L spiked chloride standard sample recoveries for the individual
trihalomethanes from GC-ECD HP 7683 auto-sampler series injector

177
Figure 3.15 0µg/L unspiked fluoride standard sample recoveries for the individual
trihalomethanes from GC-ECD HP 7683 auto-sampler series injector
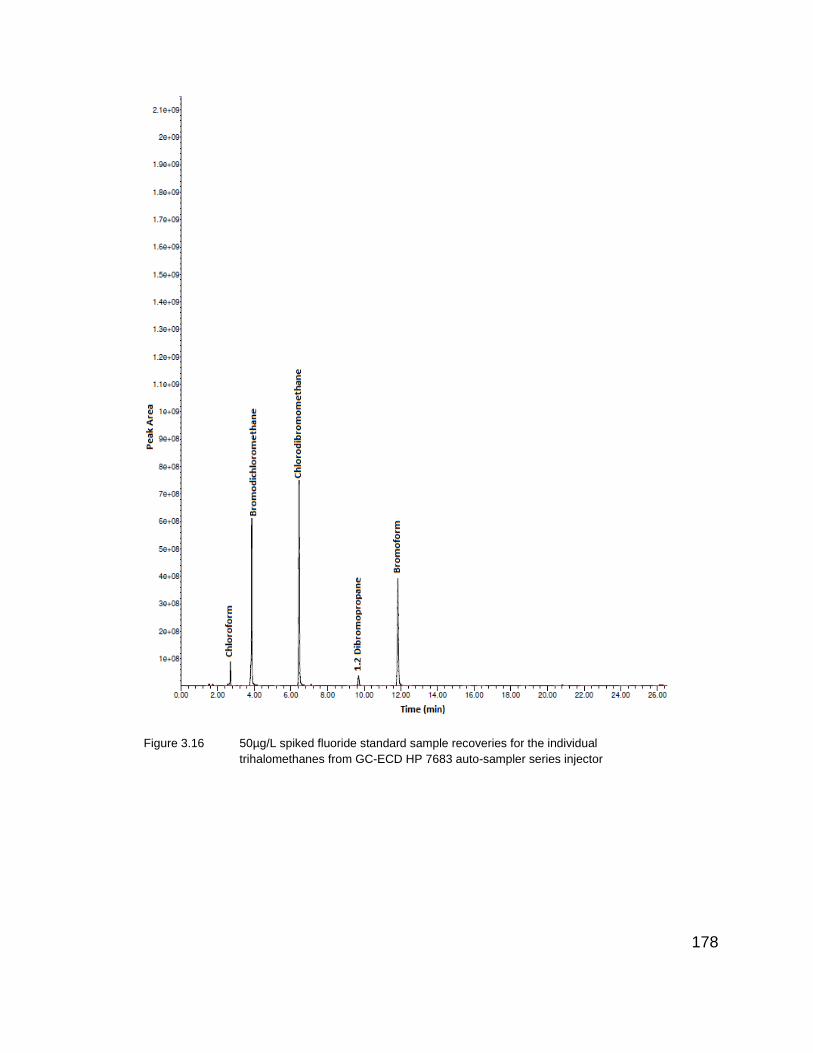
178
Figure 3.16 50µg/L spiked fluoride standard sample recoveries for the individual
trihalomethanes from GC-ECD HP 7683 auto-sampler series injector
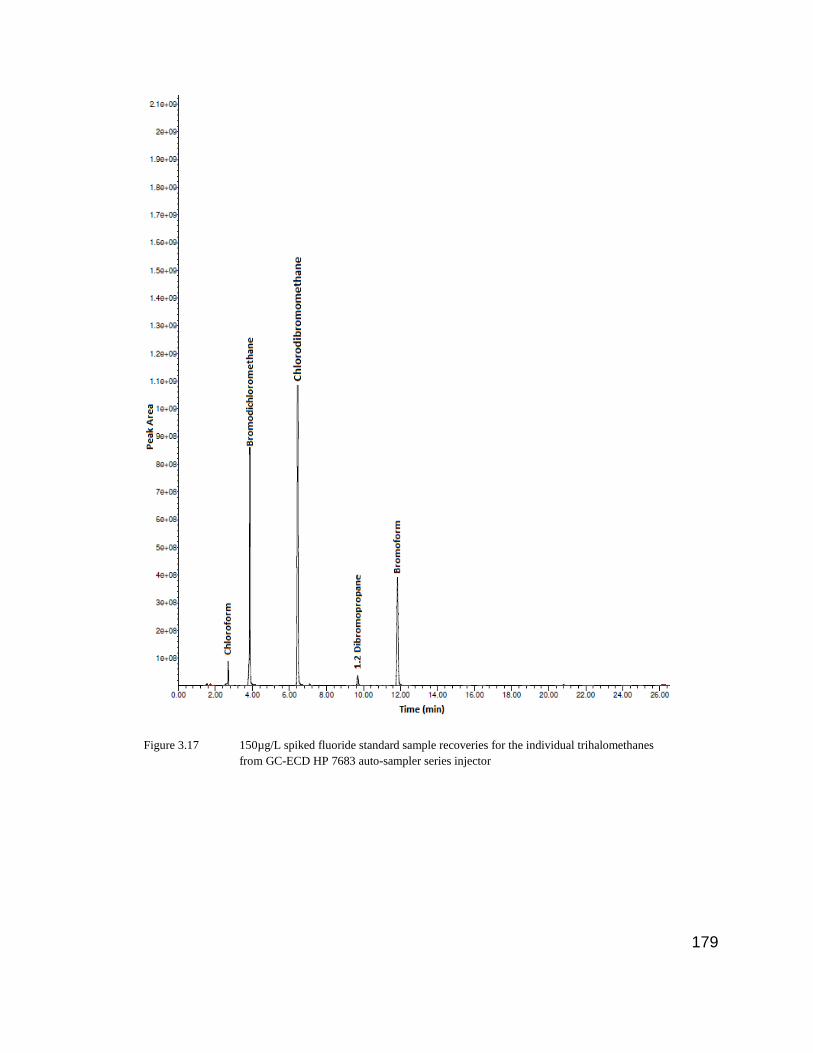
179
Figure 3.17 150µg/L spiked fluoride standard sample recoveries for the individual trihalomethanes
from GC-ECD HP 7683 auto-sampler series injector
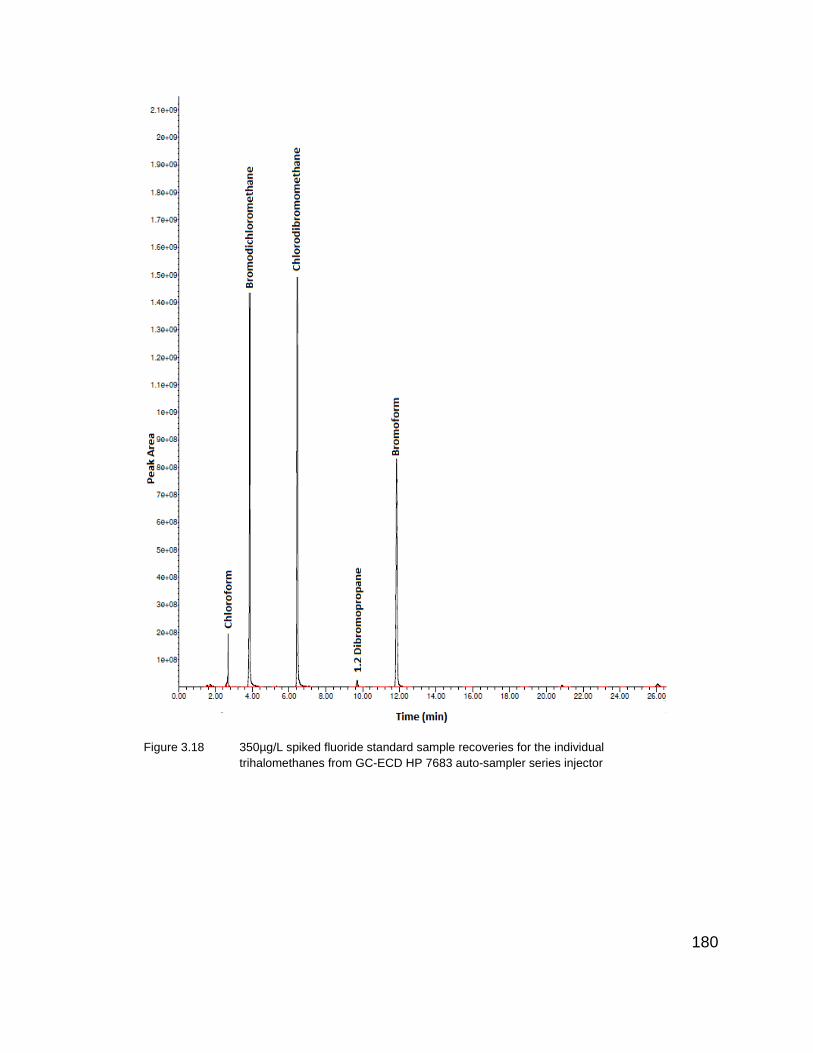
180
Figure 3.18 350µg/L spiked fluoride standard sample recoveries for the individual
trihalomethanes from GC-ECD HP 7683 auto-sampler series injector
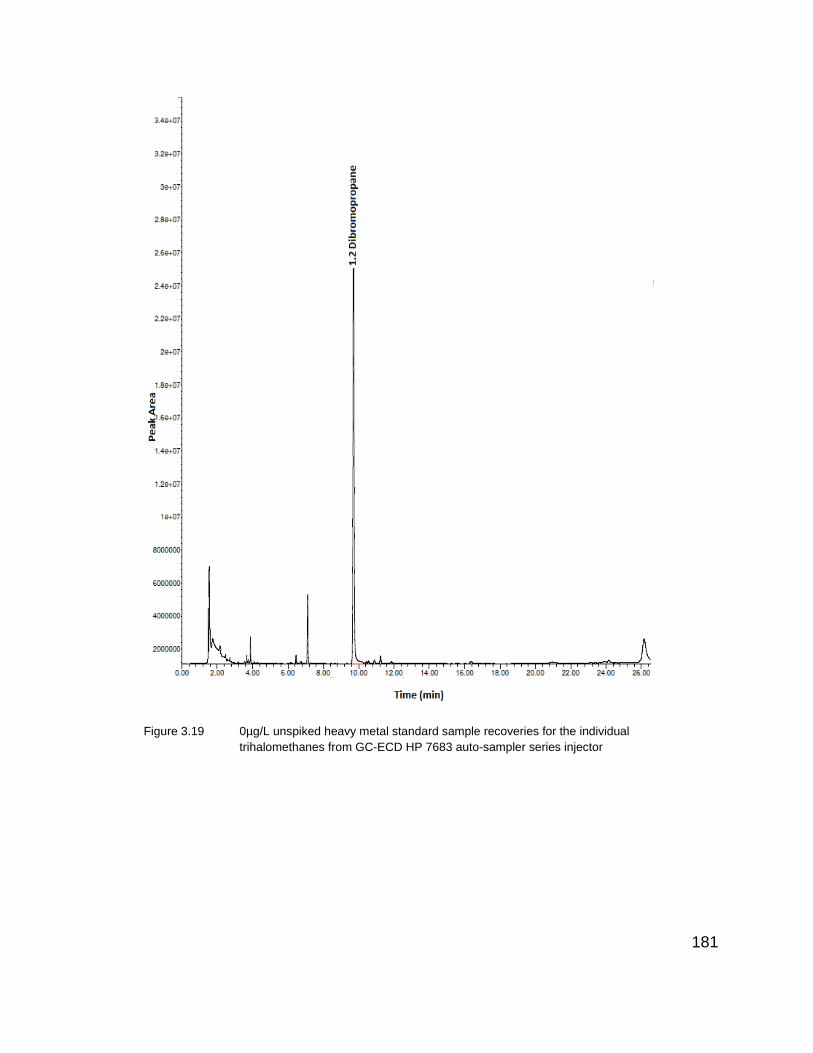
181
Figure 3.19 0µg/L unspiked heavy metal standard sample recoveries for the individual
trihalomethanes from GC-ECD HP 7683 auto-sampler series injector
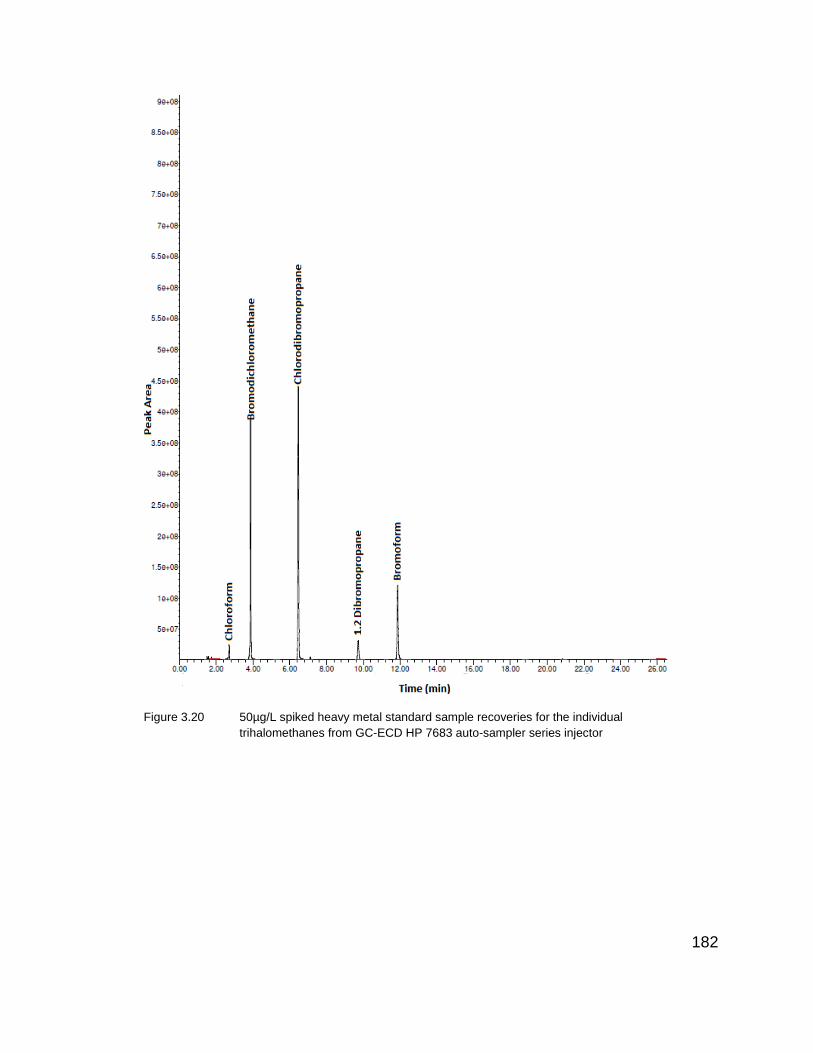
182
Figure 3.20 50µg/L spiked heavy metal standard sample recoveries for the individual
trihalomethanes from GC-ECD HP 7683 auto-sampler series injector
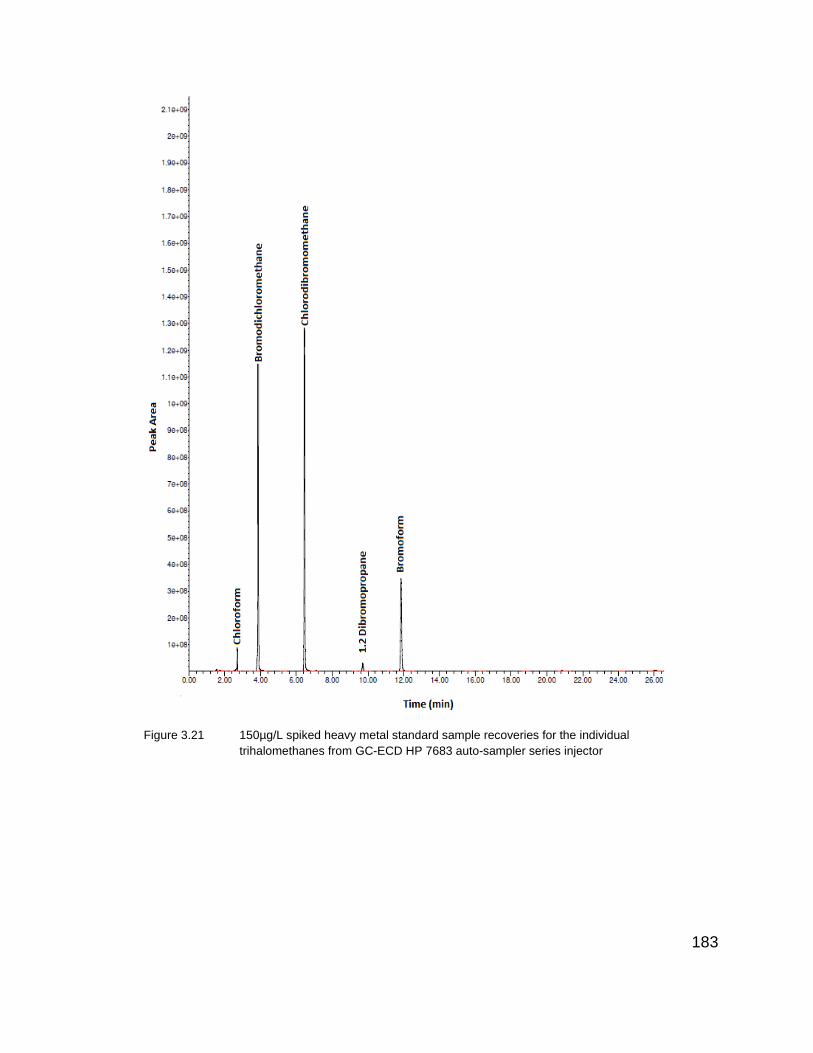
183
Figure 3.21 150µg/L spiked heavy metal standard sample recoveries for the individual
trihalomethanes from GC-ECD HP 7683 auto-sampler series injector
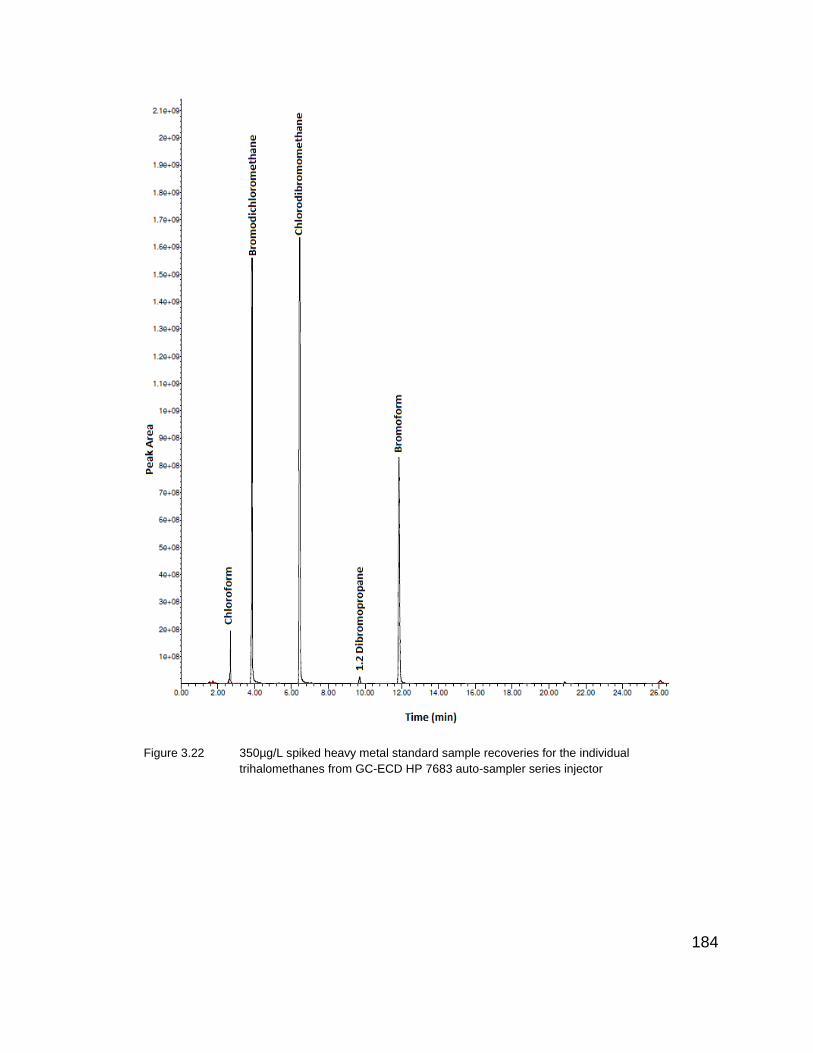
184
Figure 3.22 350µg/L spiked heavy metal standard sample recoveries for the individual
trihalomethanes from GC-ECD HP 7683 auto-sampler series injector

185
3.2.12 Robustness
Figure 3.23 0µg/L unspiked municipal water sample chromatogram for modified method. GC-
ECD HP 7683 auto-sampler series injector
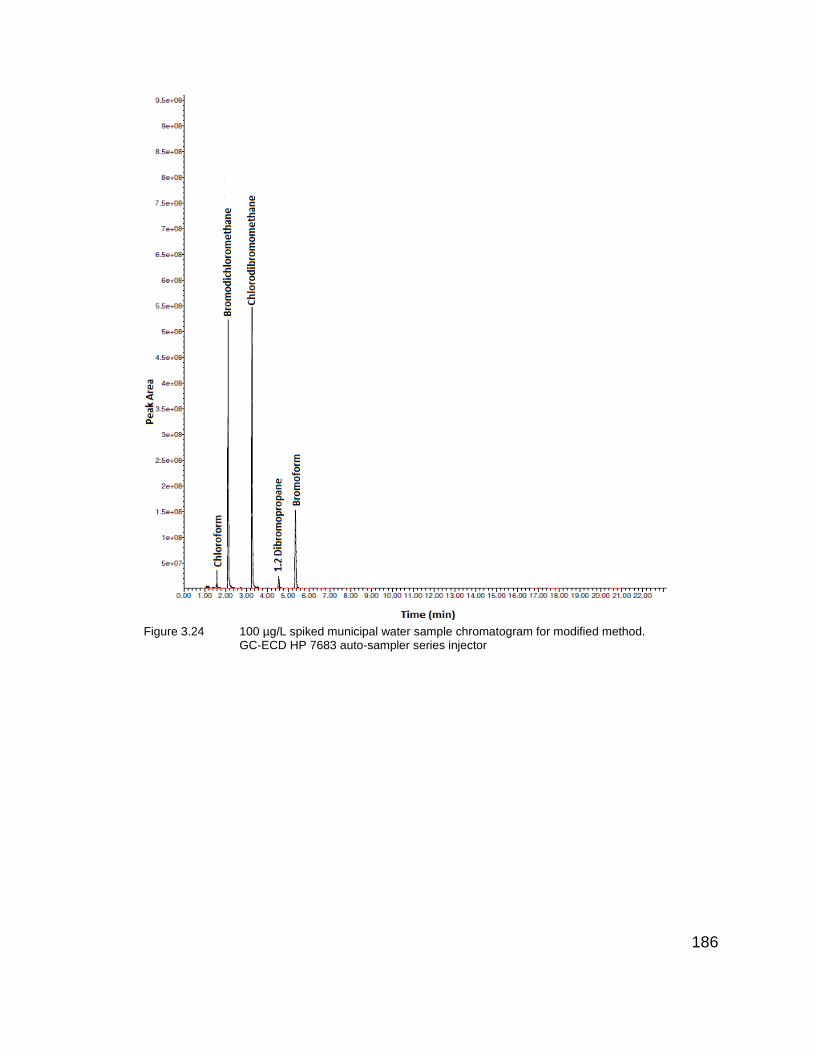
186
Figure 3.24 100 µg/L spiked municipal water sample chromatogram for modified method.
GC-ECD HP 7683 auto-sampler series injector
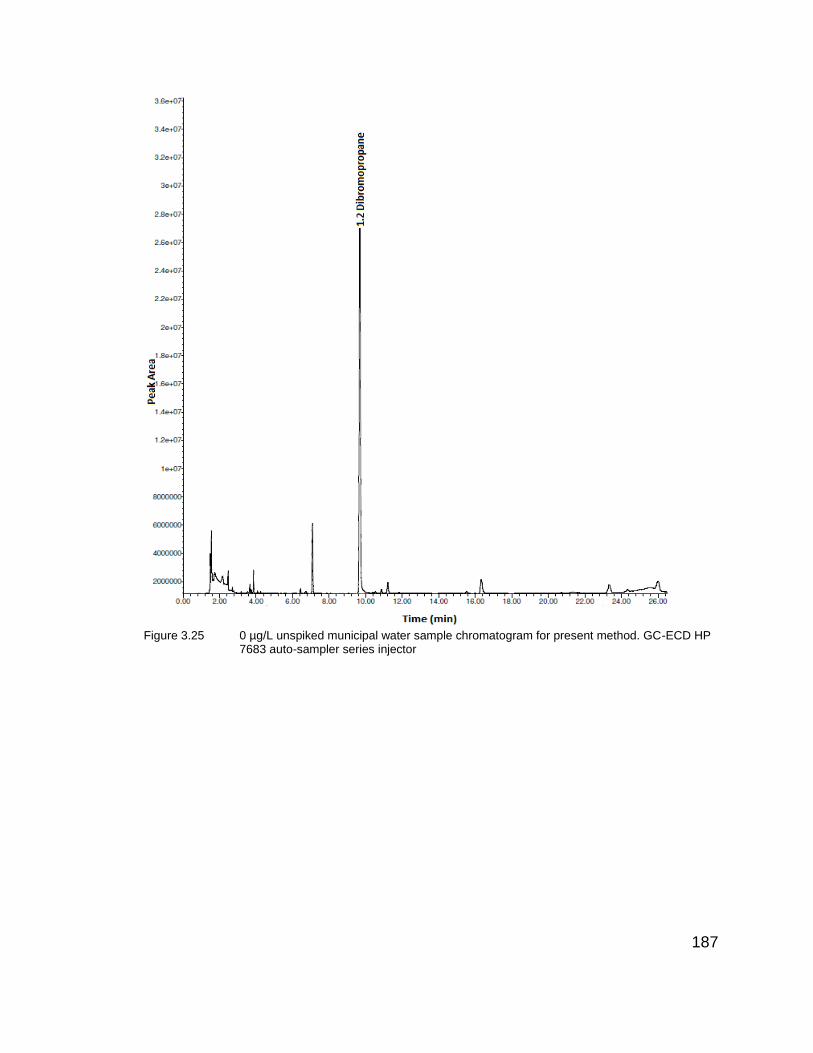
187
Figure 3.25 0 µg/L unspiked municipal water sample chromatogram for present method. GC-ECD HP
7683 auto-sampler series injector
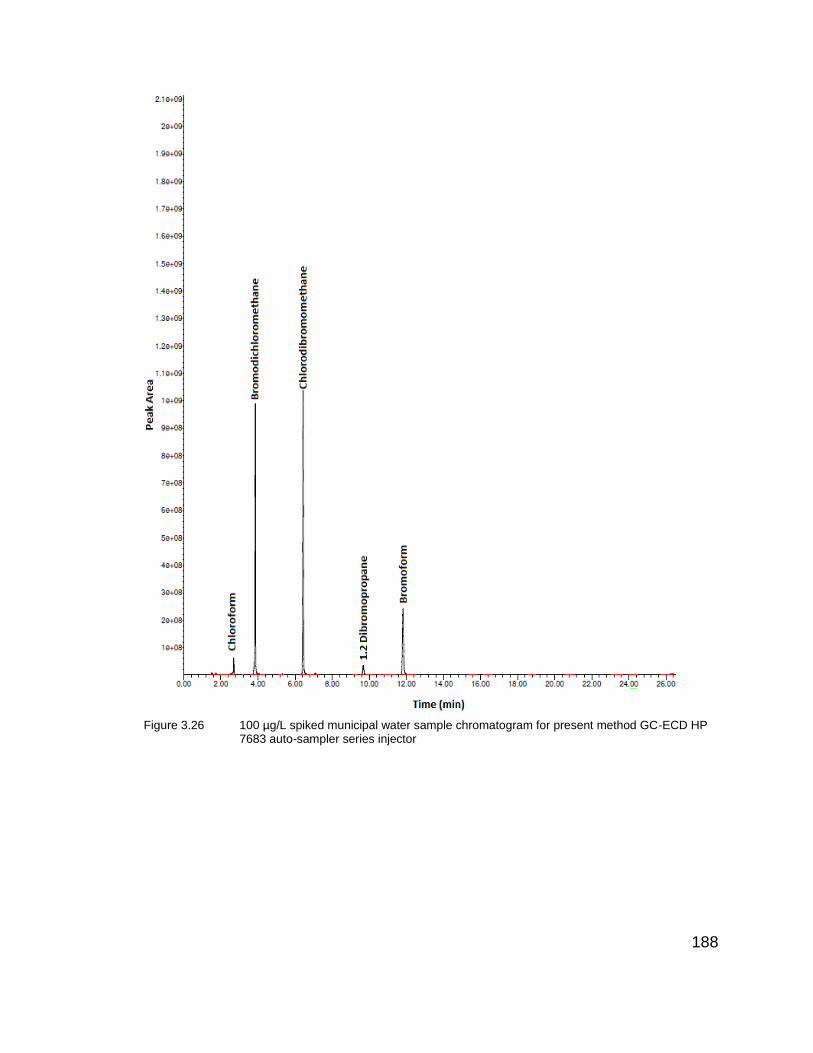
188
Figure 3.26 100 µg/L spiked municipal water sample chromatogram for present method GC-ECD HP
7683 auto-sampler series injector

189
Figure 3.27 0 µg/L spiked borehole water sample chromatogram for modified method. GC-
ECD HP 7683 auto-sampler series injector
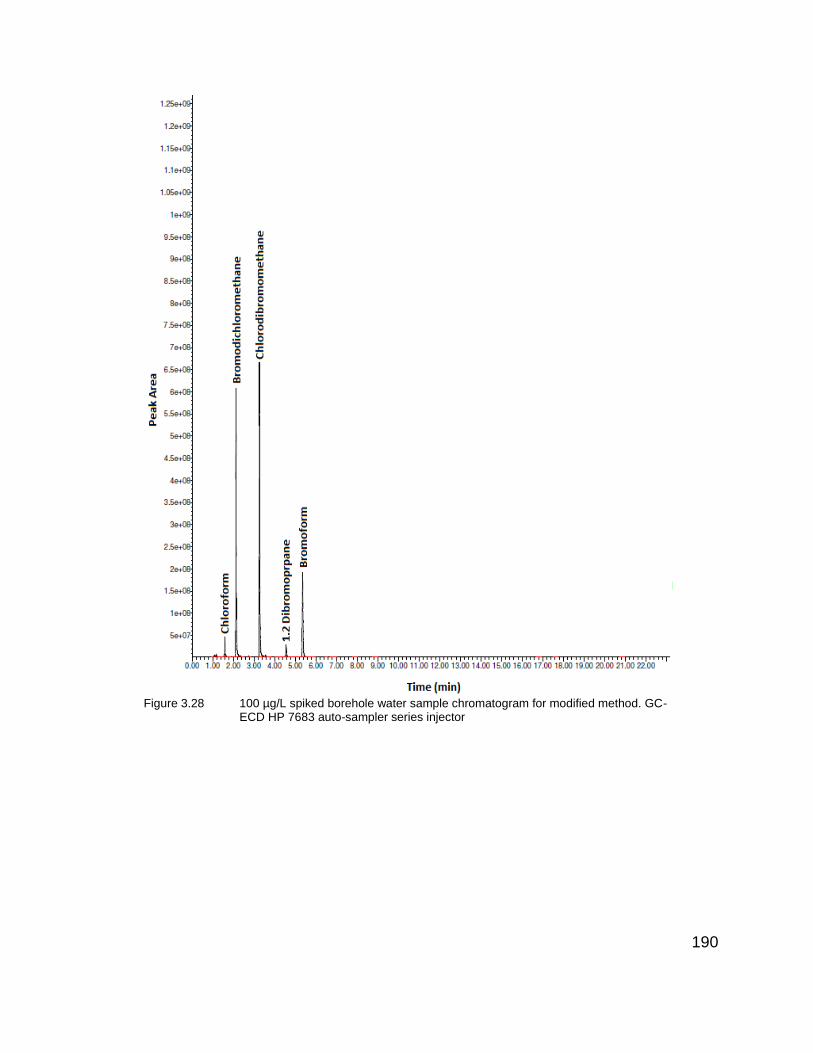
190
Figure 3.28 100 µg/L spiked borehole water sample chromatogram for modified method. GC-
ECD HP 7683 auto-sampler series injector
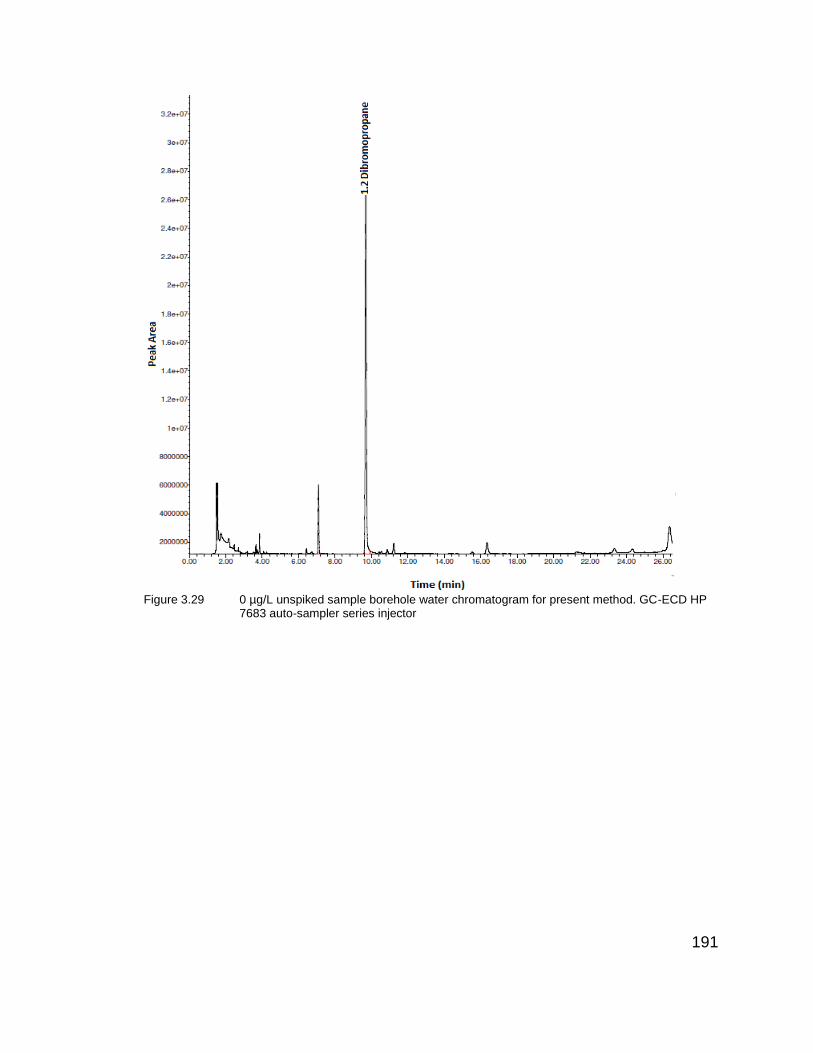
191
Figure 3.29 0 µg/L unspiked sample borehole water chromatogram for present method. GC-ECD HP
7683 auto-sampler series injector
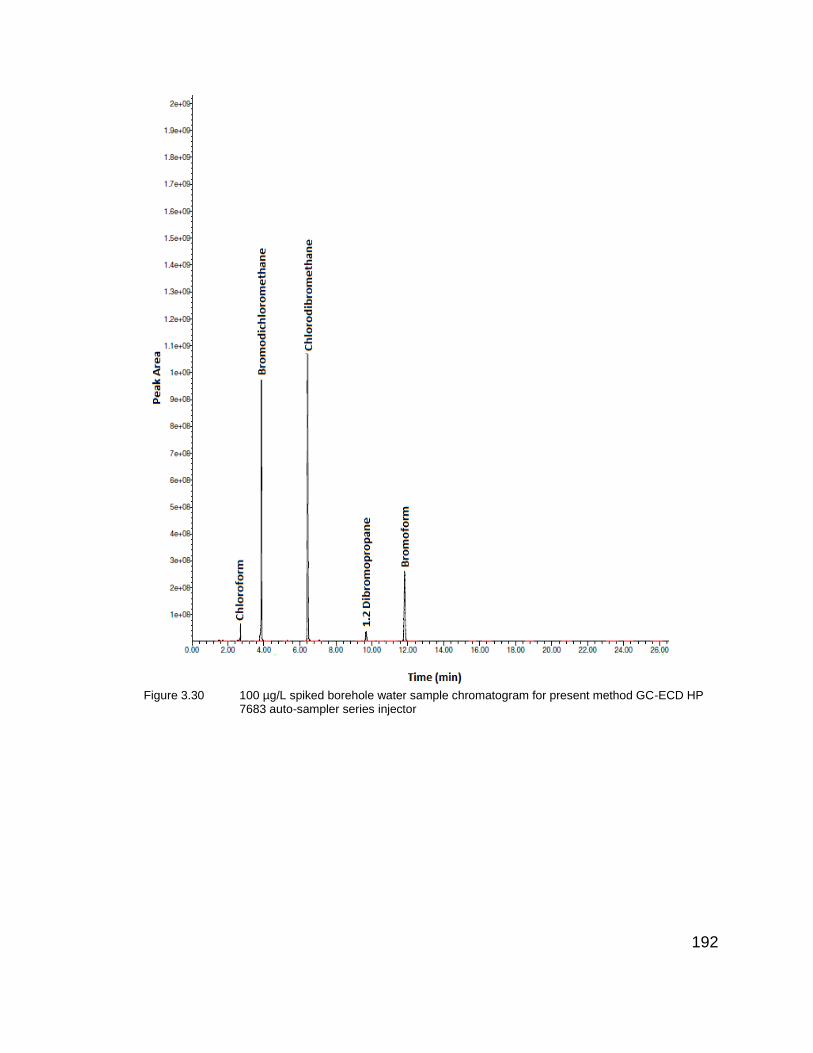
192
Figure 3.30 100 µg/L spiked borehole water sample chromatogram for present method GC-ECD HP
7683 auto-sampler series injector

193
Appendix C Chapter 3

Sampler : Unknown This report relates only to the samples tested and is issued subject to the company’s standard terms and conditions of business.
Page 1of 1
A.L. ABBOTT AND ASSOCIATES (PTY) LTD (Reg. No. 1982/004379/07)
Consulting Analytical & Industrial Chemists Specialists in Water & Waste Water Treatment Telephone (021)448 6340/1 After Hours (021)712 0940 Telefax (021)448 6342 e-Mail Address : [email protected]
Doc.No. 5.10/1 Rev.3
No. 1, Vine Park Vine Road 7925 P.O. Box 483 WOODSTOCK, CAPE 7915
Certificate of Analysis
MICROCHEM LAB SERVICES (PTY) LTD
ANALYSIS
AG60080
OUR REF. :
REPORT NO . :
2017/02/14/4152
716
2017/02/14
2017/02/14
2017/02/14
T0276
DATE SAMPLED :
DATE RECEIVED :
DATE ANALYSIS
COMMENCED :
Sample Number 4152
MthdALANo.
Analyses
Results
SANS 241-1:2015
N/A Total microcystin (µg/l) <0.15 ≤1
N/A Combined Trihalomethane 0.09 ≤1.0
N/A Trihalomethane (Bromodichloromethane) (µg/l) <1.0 ≤60 Chronic Health
N/A Trihalomethane (Bromoform) (µg/l) <1.0 ≤100 Chronic Health
N/A Trihalomethane (Chloroform) (µg/l) 16.0 ≤300 Chronic Health
N/A Trihalomethane (Dibromochloromethane) (µg/l) <1.0 ≤100 Chronic Health
JOSE DA SILVA (Cert.Sci.Nat.)
TECHNICAL MANAGER 23 February 2017
ORDER:PO100432
TO: MICROCHEM 176 Sir Lowry Road WOODSTOCK CAPE TOWN 7925 Att: Salwa Banien<[email protected]>

Sampler : Unknown This report relates only to the samples tested and is issued subject to the company’s standard terms and conditions of business.
Page 1of 1
A.L. ABBOTT AND ASSOCIATES (PTY) LTD (Reg. No. 1982/004379/07)
Consulting Analytical & Industrial Chemists Specialists in Water & Waste Water Treatment Telephone (021)448 6340/1 After Hours (021)712 0940 Telefax (021)448 6342 e-Mail Address : [email protected]
Doc.No. 5.10/1 Rev.3
No. 1, Vine Park Vine Road 7925 P.O. Box 483 WOODSTOCK, CAPE 7915
Certificate of Analysis
MICROCHEM LAB SERVICES (PTY) LTD
ANALYSIS
AG 85690
OUR REF. :
REPORT NO . :
2017/05/10/11094
2101
2017/05/10
2017/05/10
2017/05/10
T0276
DATE SAMPLED :
DATE RECEIVED :
DATE ANALYSIS
COMMENCED :
Sample Number 11094
MthdALANo.
Analyses
Results
SANS 241-1:2015
N/A Total microcystin (µg/l) <0.15 ≤1
N/A Combined Trihalomethane 0.04 ≤1.0
N/A Trihalomethane (Bromodichloromethane) (µg/l) <1.0 ≤60 Chronic Health
N/A Trihalomethane (Bromoform) (µg/l) <1.0 ≤100 Chronic Health
N/A Trihalomethane (Chloroform) (µg/l) <1.0 ≤300 Chronic Health
N/A Trihalomethane (Dibromochloromethane) (µg/l) <1.0 ≤100 Chronic Health
N. VAN BINSBERGEN ( Pr.Sci.Nat.) X DIRECTOR X 22 May 2017
ORDER: PO.100931
TO: MICROCHEM 176 Sir Lowry Road WOODSTOCK CAPE TOWN 7925 Att: SALWA BADIEN <[email protected]>

Sampler : Unknown This report relates only to the samples tested and is issued subject to the company’s standard terms and conditions of business.
Page 1of 1
A.L. ABBOTT AND ASSOCIATES (PTY) LTD (Reg. No. 1982/004379/07)
Consulting Analytical & Industrial Chemists Specialists in Water & Waste Water Treatment Telephone (021)448 6340/1 After Hours (021)712 0940 Telefax (021)448 6342 e-Mail Address : [email protected]
Doc.No. 5.10/1 Rev.3
No. 1, Vine Park Vine Road 7925 P.O. Box 483 WOODSTOCK, CAPE 7915
Certificate of Analysis
MICROCHEM LAB SERVICES (PTY) LTD
ANALYSIS
AG 92981
OUR REF. :
REPORT NO . :
2017/06/07/13121
2538
2017/06/07
2017/06/07
2017/06/07
T0276
DATE SAMPLED :
DATE RECEIVED :
DATE ANALYSIS
COMMENCED :
Sample Number 13121
MthdALANo.
Analyses
Results
SANS 241-1:2015
N/A Total microcystin (µg/l) <0.15 ≤1
N/A Combined Trihalomethane 0.04 ≤1.0
N/A Trihalomethane (Bromodichloromethane) (µg/l) <1.0 ≤60 Chronic Health
N/A Trihalomethane (Bromoform) (µg/l) <1.0 ≤100 Chronic Health
N/A Trihalomethane (Chloroform) (µg/l) <1.0 ≤300 Chronic Health
N/A Trihalomethane (Dibromochloromethane) (µg/l) <1.0 ≤100 Chronic Health
JOSE DA SILVA (Cert.Sci.Nat.)
TECHNICAL MANAGER 26 June 2017
PO:101098
TO: MICROCHEM 176 Sir Lowry Road WOODSTOCK CAPE TOWN 7925 Att: SALWA BADIEN <[email protected]>
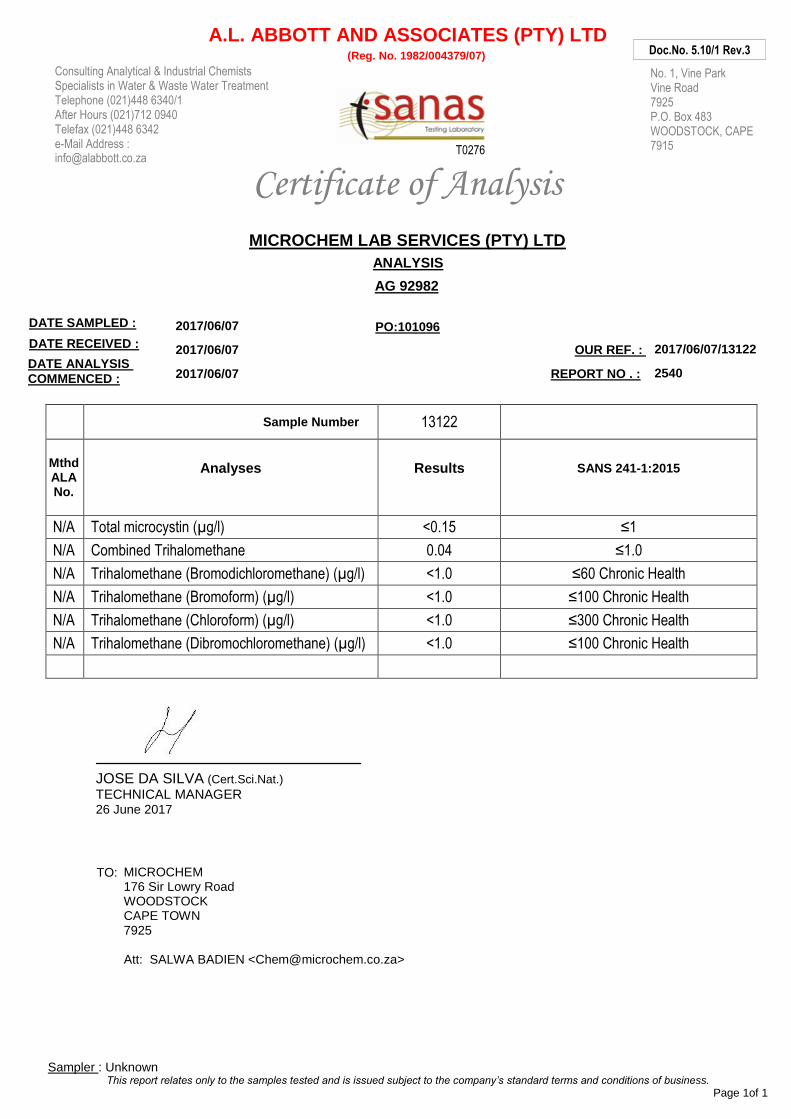
Sampler : Unknown This report relates only to the samples tested and is issued subject to the company’s standard terms and conditions of business.
Page 1of 1
A.L. ABBOTT AND ASSOCIATES (PTY) LTD (Reg. No. 1982/004379/07)
Consulting Analytical & Industrial Chemists Specialists in Water & Waste Water Treatment Telephone (021)448 6340/1 After Hours (021)712 0940 Telefax (021)448 6342 e-Mail Address : [email protected]
Doc.No. 5.10/1 Rev.3
No. 1, Vine Park Vine Road 7925 P.O. Box 483 WOODSTOCK, CAPE 7915
Certificate of Analysis
MICROCHEM LAB SERVICES (PTY) LTD
ANALYSIS
AG 92982
OUR REF. :
REPORT NO . :
2017/06/07/13122
2540
2017/06/07
2017/06/07
2017/06/07
T0276
DATE SAMPLED :
DATE RECEIVED :
DATE ANALYSIS
COMMENCED :
Sample Number 13122
MthdALANo.
Analyses
Results
SANS 241-1:2015
N/A Total microcystin (µg/l) <0.15 ≤1
N/A Combined Trihalomethane 0.04 ≤1.0
N/A Trihalomethane (Bromodichloromethane) (µg/l) <1.0 ≤60 Chronic Health
N/A Trihalomethane (Bromoform) (µg/l) <1.0 ≤100 Chronic Health
N/A Trihalomethane (Chloroform) (µg/l) <1.0 ≤300 Chronic Health
N/A Trihalomethane (Dibromochloromethane) (µg/l) <1.0 ≤100 Chronic Health
JOSE DA SILVA (Cert.Sci.Nat.)
TECHNICAL MANAGER 26 June 2017
PO:101096
TO: MICROCHEM 176 Sir Lowry Road WOODSTOCK CAPE TOWN 7925 Att: SALWA BADIEN <[email protected]>