Embed Size (px)
Citation preview

Kenneth Lee
Photos\Lee_Ken\IMG_0530_ppt.JPG
Kenneth LeeKenneth LeeCentre for Offshore Oil, Gas and Energy Research (COOGER)Centre for Offshore Oil, Gas and Energy Research (COOGER)
Fisheries and Oceans CanadaFisheries and Oceans [email protected]@dfo--mpo.gc.campo.gc.ca
Dispersion of Oil released from the Dispersion of Oil released from the Deepwater Horizon MC 252 Oil Spill Deepwater Horizon MC 252 Oil Spill
following Subsurface Injection following Subsurface Injection of Corexit 9500of Corexit 9500

DFO Oil Spill Countermeasure Research By the conduct of laboratory, mesocosm and “controlled oil spill”experiments in the field, DFO developed oil spill countermeasuretechnologies (bioremediation, phyto-remediation and surf-washing) and methodologies to quantify habitat recovery

• There is no single response technique that is suitable for all circumstances
• Oil spill responses: • Booming and skimming• In-situ burning • Bioremediation• Chemical dispersion
• At open sea, dispersant use attracts most attention due to restrictions to other methods
Why Chemical Dispersants?

Enhanced Dispersion for Oil Spill Response
• Based on the concept of transferring oil from the sea surface into the water column, as small oil droplets
• These are diluted by natural processes to concentrations below toxicity threshold limits
• Dispersed oil droplets are degraded more rapidly by natural bacteria
• Achieved with chemical oil dispersants and/or facilitation of oil mineral aggregate formation

DFO Research PrioritiesUncertainties remain high regarding dispersant use at sea
• Dispersant efficacy at different sea states is not clear • Biological effects of dispersed oils are poorly understood
To address this issue, a wave tank facility was constructed by Fisheries and Oceans Canada (DFO) and the U.S. Environmental Protection Agency (EPA)
National Research Council (NRC) Committee on Understanding Oil Spill Dispersants: Efficacy and Effects (2005) Identified two factors to be addressed in oil dispersant efficacy studies:
• Energy dissipation rate (turbulence/sea state conditions)• Particle size distribution and mass balance

BIO Wave Tank• Constructed with co funding from DFO A-Base, PERD, NOAA,
US MMS, PWSRCAC.• Tidal current simulation by vertical manifolds along the sides
of the tank• Reproducible breaking waves produced (of known energy
dissipation rate) at precise locations along length of tank• Development of experimental protocols and instrumentation
to monitor dispersed oil in the water column
LISST

Oil Droplet Size Distribution
Mean Diameter (μm)10 100
0.0
0.5Par
ticle
Con
cent
ratio
n (μ
l/L)
0.0
0.5
1.0
0.0
0.5
0.0
0.5
t = 1 min
t = 10 min
t = 30 min
t = 60 min
Mean Diameter (μm)10 100
0.0
0.5P
artic
le C
once
ntra
tion
(μl/L
)
0.0
0.5
0.0
0.5
0.0
0.5
1.0
t = 1 min
t = 10 min
t = 30 min
t = 60 min
- Dispersant + Dispersant

600
550
500
450
400
350
Emis
sion
(nm
)
300290 200 310 320 330 340 350280 290 200 310 320 330 340 350280
Excitation (nm)
Brent Brent + Corexit
The 3D spectra can be summarized as the ratio of Slope or Em intensity at 340 nm divided by intensity at 445 nm. (FIR)
510152025
Int.
Oil Fluorescence – 3D Spectra

Gulf of Mexico Oil Spill
The Deepwater Horizon oil spill is the largest accidental marine oil spill in the history of the petroleum industry.
• Occurred as a result of an explosion on the Deepwater Horizon drilling rig, April 20, 2010. The explosion killed 11 platform workers and injured 17 others.
• On July 15, the leak was stopped by capping the wellhead which had released 4.9 million barrels (780×103 m3) of crude oil.
• On September 19, the relief well process was successfully completed and the federal government declared the well "effectively dead".

Gulf of Mexico – May 24, 2010

Application of Oil Dispersants - GoM
• Based on discharge rates - final estimate of 53,000 barrels per day (8,400 m3/d) - each day the Gulf of Mexico Oil Spill would be considered a major incident
• In addition to mechanical recovery techniques (skimming and booming) and in situ burning, oil dispersants were used to prevent landfall of the oil in the Deepwater Horizon Spill
• Beginning in early May responders began injecting dispersants at the source of the release (~1500m depth) to reduce oil from reaching the surface
• Advantages of subsurface injection:
• Reduced VOCs (volatile organic compounds)
• Reduced Oil Emulsification
• Volume of dispersant needed

Dispersant Effectiveness vs. Viscosity
Source: SINTEF

Cumulative Dispersant Use
* 4,200,000 L of dispersant added by subsurface injection

Plume Monitoring and Assessment for Subsurface Dispersant Application (US EPA Directive – May 10, 2010)
PART 1: “Proof of Concept” to determine if subsurface dispersant operation is chemically dispersing the oil plume.
Following review by the RRT….
PART 2: Robust sampling to detect and delineate the dispersed plume based on the results of PART 1 and input from hydrodynamic modeling
DFO COOGER was requested by US EPA to provide scientific expertise to implement the directive
All data provided to the United States Coast Guard (USCG)Federal On-Scene Coordinator, and the Environmental Protection Agency (EPA) Regional Response Team (RRT)

DFO Sampling EffortPerson Days Stations Samples
May 91 68 1020June 136 107 1674July 136 65 1060
August 143 92 1439Total 506 320 5193
R/V Ocean Veritas R/V Brooks McCall
* Cost recovery from the U.S. Government with BP as the responsible party accountable for all cleanup costs

Dispersant Monitoring and Assessment for Subsurface Dispersant Application
• Directives issued by US EPA and USCG required BP to implement a monitoring and assessment plan for subsurface and surface use of dispersants
• Shutdown Criteria• Significant reduction in dissolved oxygen (< 2 mg/L)• Rotifer acute toxicity tests
• Later addenda to implement SMART Tier 3 Monitoring Program• Droplet size distribution (LISST)• CTD instrument equipped with CDOM fluorometer• Discreet sample collection to measure fluorometry (FIR)• Eliminate surface application altogether • Subsea limited to < 15,000 gpd


• Working group of scientists from EPA, NOAA, OSTP, BP and DFO
• Analyze an evolving database of sub-surface oceanographic data by BP, NOAA, and academic scientists
• Near term actions: • Integrate the data • Analyze the data to describe the distribution of oil
and the oceanographic processes affecting its transport
• Issue periodic reports
Joint Analysis Group (JAG) Surface and Subsurface Oceanographic, Oil, and Dispersant Data

DFO Station Locations
Total of 320 Stations

Vertical Profile - DO2 Depression (coincident with fluorescence and <60µm LISST particle count
peaks between 1100 and 1200 m)
Particles (2.5 ~ 60 um)
-1500
-1300
-1100
-900
-700
-500
-300
-100
0.0 0.1 0.2 0.3 0.4 0.5 0.6 0.7 0.8
Concentration (ul/l)
Dep
th (m
)
Small particles (2.5 - 60µm) were indicative of oil droplets in the subsurface plume
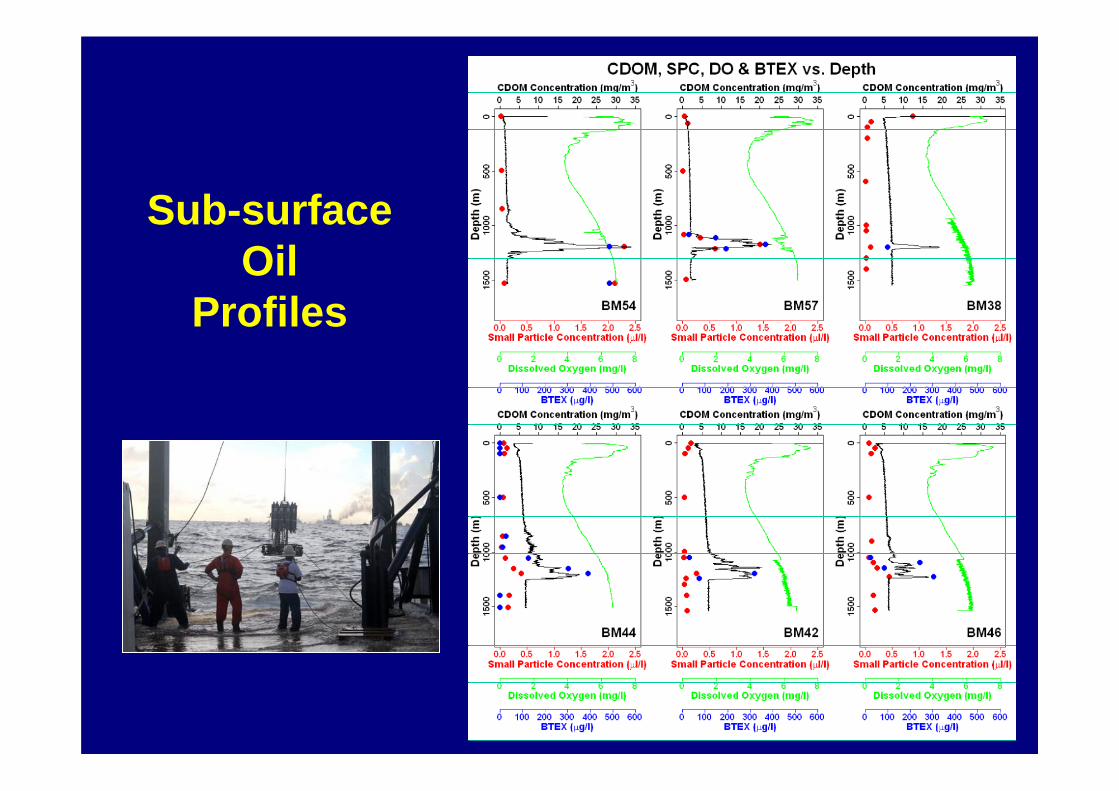
Sub-surface Oil
Profiles

Concentration(ppb)
Total VOA TPH
<10 1484 1836
10 - 100 104 33
100 – 1,000 129 0
> 1,000 16 0
Oil Chemistry Results as number in concentration range for subsurface plume samples (1000 – 1300 m Depth)
These results represent the chemistry results for 2779 individual samples from May 8 – July 22, 2010.

Level and Trend in DO2 Depressions
Total of 419 DO2 profiles compared to annual mean climatology

Particle Size DataR/V Brooks McCall - Plume
Plume = maximum small particle concentration below 800m

FOR INTERNAL USE ONLY
0 10000 20000 30000 40000 50000 60000
Distance from wellhead, m
0
2
4
6
8
10
12
14
Brooks McCall
Walton Smith
Ocean Veritas
Gordon Gunter
Thomas Jefferson
Nor
mal
ized
CD
OM
Flu
ores
cenc
eNormalized Mean CDOM Fluorescence (1000-1300 m) vs. Distance from Wellhead
CDOM (Colored Dissolved Organic Matter Fluorescence)

UV-Fluorescence

Fate of Dispersed Oil Droplets
Source: http://www.response.restoration.noaa.gov
Analysis of Near-field Oil Droplet Data (JAG Analysis DFO Data: Dr. J.A. Galt, NOAA, HAZMAT)
● Within 15 km of the well and below 1000 m oil droplet concentrations (< 65 microns) were fully consistent with an essentially neutrally buoyant plume.
● The plume was filamentous, a significant fraction of the bottle casts missed it and thus exhibited little or no oil in droplet form. Significant non-zero sample results, assumed to be within the filaments, showed total droplet volumes in the 10 ppm range with a max observed value of 16 ppm.
● Observed values appeared to drop off by an order of magnitude within 10 km. If we use this as a rough scaling distance for the mixing and dilution of the oil droplet filaments or plume then we would expect to have total droplet concentrations reduced to the ppb level within about 40 km.
● Although this is a rough estimate it is consistent with the bulk of the available observations and by the time the droplets get 40 kilometers away numerous other physical and biological processes will start to alter the state and composition of the plume.

Fate of the Oil:
GOM spill
Oil Budget CalculatorOctober 2010
NOAA (National Oceanic and Atmospheric Administration)
Other: Remaining oil is at the surface as light sheen or weathered tar balls, biodegraded, or already came ashore
Response estimates expressed as % cumulative volume of oil discharged in the best, expected, and worst cases

Future of Dispersant Use• The ability to effectively deploy and monitor an unprecedented
dispersant response in the GoM was based on the past decades’ improvements
• Misperceptions and knowledge gaps over their use remain. Areas for improvement include:
• Need to be a common understanding of the risks and benefits of dispersant use, as well as the safety and effectiveness of dispersant products.
• Additional research is needed on the behavior and long term fate of dispersed oil in the water column when dispersants are applied at the sea floor.


![8-fira-flaminia [Mode de compatibilité] - wwz.cedre.fr · Identification des risques spécifiques à l'accident du MSC Flaminia, les "risques spécifiques" sont ceux qui ne sont](https://img.dokumen.tips/doc/110x75/5c669cb809d3f2d0218c9382/8-fira-flaminia-mode-de-compatibilite-wwzcedrefr-identification-des-risques.jpg)


![TC900ELOGV03-01T-16578- FORMATO PARA INTERNET · (menu [LUMI]) Light intensity above the value configured in [On,,] (menu [LUMI]) Function Command Action 6.3.5 Manual defrost The](https://img.dokumen.tips/doc/110x75/5fae330c32f18336f14d9ff7/tc900elogv03-01t-16578-formato-para-internet-menu-lumi-light-intensity-above.jpg)


