Embed Size (px)
Citation preview

Health and Safety Executive
© Crown Copyright, HSE 2017
Dispersion model predictions of the Jack Rabbit II chlorine release experiments
10th Euro Chlor International Chlorine Technology Conference & Exhibition, Berlin, Germany, 16-18 May 2017
Simon Gant*, Harvey Tucker, Bryan McKenna, Maria Garcia, Alison McGillivray, Rachel Batt, Jim Stewart (HSE)
Graham Tickle (GT Science & Software)
Henk Witlox (DNV GL)

© Crown Copyright, HSE 2017 2
Outline
• Brief introduction to the Health and Safety Laboratory (HSL)
• Objectives
• Overview of models
– DRIFT
– PHAST
– Computational Fluid Dynamics (CFD)
• Analysis of Jack Rabbit II data from 2015 trials
– Comparison to Chlorine Institute Pamphlet 74 Guidance
• Model validation
• Conclusions and Future Directions
© Crown Copyright, HSE 2017 3
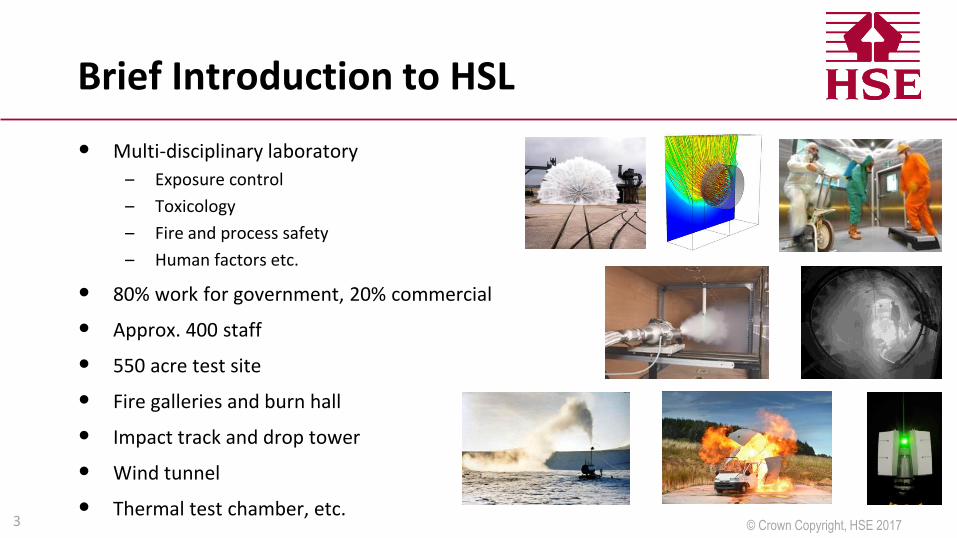
• Multi-disciplinary laboratory
– Exposure control
– Toxicology
– Fire and process safety
– Human factors etc.
• 80% work for government, 20% commercial
• Approx. 400 staff
• 550 acre test site
• Fire galleries and burn hall
• Impact track and drop tower
• Wind tunnel
• Thermal test chamber, etc.
Brief Introduction to HSL
© Crown Copyright, HSE 2017 4
Objectives
Aims of our involvement in Jack Rabbit II:
• Before the experiments
– To help setup the experiments by providing dispersion model predictions for positioning of sensors
• After the experiments
– To help interpret measurement data
– To validate DRIFT and PHAST models
– To use CFD to investigate the near-field dispersion behaviour
• To collaborate with other experts in the Modelers’ Working Group and share findings

© Crown Copyright, HSE 2017 5
1. DRIFT version 3.7.2
– Used by HSE for land-use planning purposes in the UK
– Validated against many field and wind-tunnel dispersion datasets
Overview of Models
2. PHAST version 7.11
– Comprehensive hazard analysis software, widely used by industry
– Validated against many field and wind-tunnel dispersion datasets
3. CFX version 17
– General-purpose CFD software for fluid flow analysis, widely used by engineering consultancies
– Previously validated by HSL for various two-phase jets and liquid sprays
– Computer run time: hours to days on multiple CPUs
Integral-type dispersion models Computer run-time: seconds

© Crown Copyright, HSE 2017 6
Overview of DRIFT and PHAST Models
Stage 1.) Discharge sub-model
Wind Vessel
Jet entrains air and droplets evaporate until it impinges
Model sensitivity tests performed to assess the impact of the flow regime through the orifice
Ground
Two possible flow regimes through the orifice:
Jet expansion to atmospheric pressure
Two-phase flow of chlorine vapour and liquid droplets
‒ Meta-stable liquid ‒ Two-phase flashing fluid
Cross-section through orifice

© Crown Copyright, HSE 2017 7
Overview of DRIFT and PHAST Models
Stage 2.) Modelling interaction of the two-phase jet with the ground
Evaporating aerosol of chlorine droplets and condensed water vapour
Pool spread and evaporation
Wind Vessel
Model sensitivity tests performed to assess impact of liquid rain-out and pool formation
‒ “Rain-out” fraction at impingement is uncertain
Models account for heat transfer: conduction from ground (inc. ground cooling effects), air convection and thermal radiation
Models ignore additional turbulence and re-entrainment at impingement

© Crown Copyright, HSE 2017 8
Overview of DRIFT and PHAST Models
Stage 3.) Modelling dispersion of cloud
Initial gravity spreading and dilution of the source
DRIFT
PHAST
Accounts for along-wind diffusion and gravity spreading
• DRIFT may over-predict concentrations for short-duration releases in far-field due to use of smaller Froude number for gravity spreading derived for continuous releases
Later…
Does not account for along-wind diffusion and gravity spreading
• PHAST can produce clouds that spread laterally more than along-wind, and over-predict concentrations in near-field • Found to under-predict extent of cloud in stable conditions • New PHAST version 8.0 (not used here, released in late 2017) accounts for along-wind diffusion and gravity spreading
Later…
No additional initial spreading

© Crown Copyright, HSE 2017 9
CFD Model
Expanded jet of vapour and evaporating chlorine droplets (Lagrangian particles): source conditions taken from PHAST
Mesh: 1 – 2 million nodes
Conex blocks resolved in model geometry (whereas DRIFT/PHAST modelled mock urban array as uniform region of increased surface roughness)
SST turbulence model Ground and all solid surfaces assumed to be smooth Impinging droplets assumed to stick or bounce, but model
does not account for evaporating liquid pool
Cross-section through source
Model accounts for additional turbulence and re-entrainment at impingement

© Crown Copyright, HSE 2017 10
Outline
• Brief introduction to the Health and Safety Laboratory (HSL)
• Objectives
• Overview of models
– DRIFT
– PHAST
– Computational Fluid Dynamics (CFD)
• Analysis of Jack Rabbit II data from 2015 trials
– Comparison to Chlorine Institute Pamphlet 74 Guidance
• Model validation
• Conclusions and Future Directions
© Crown Copyright, HSE 2017 11
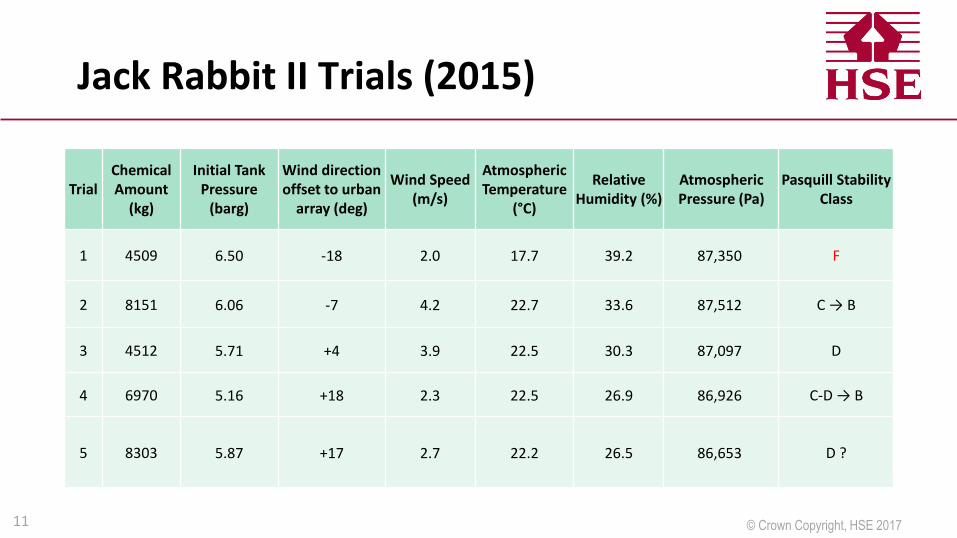
Jack Rabbit II Trials (2015)
Trial Chemical Amount
(kg)
Initial Tank Pressure
(barg)
Wind direction offset to urban
array (deg)
Wind Speed (m/s)
Atmospheric Temperature
(°C)
Relative Humidity (%)
Atmospheric Pressure (Pa)
Pasquill Stability Class
1 4509 6.50 -18 2.0 17.7 39.2 87,350 F
2 8151 6.06 -7 4.2 22.7 33.6 87,512 C → B
3 4512 5.71 +4 3.9 22.5 30.3 87,097 D
4 6970 5.16 +18 2.3 22.5 26.9 86,926 C-D → B
5 8303 5.87 +17 2.7 22.2 26.5 86,653 D ?

© Crown Copyright, HSE 2017 12
Trial 1
Release size
Trial 2 Trial 3 Trial 4 Trial 5
4509 kg 8151 kg 4512 kg 6970 kg 8303 kg
Wind vector 2.0 m/s -18°
4.2 m/s -7° 3.9 m/s
+4°
2.7 m/s +17°
2.3 m/s +18°
Measured concentrations in urban array

© Crown Copyright, HSE 2017 13
Is there any evidence of bifurcated cloud behavior at the 200 m and 500 m arcs?
Wind
200 m arc
500 m arc
1 km arc
CFD Prediction
Measured concentrations in near field

© Crown Copyright, HSE 2017 14
Trial 3 Trial 5 Trial 1 Trial 2 Trial 4
4509 kg 8151 kg 4512 kg 6970 kg 8303 kg
2.0 m/s -18°
4.2 m/s -7° 3.9 m/s
+4°
2.7 m/s +17° 2.3 m/s
+18°

© Crown Copyright, HSE 2017 15
Trial 3 Trial 5 Trial 1 Trial 2 Trial 4
4509 kg 8151 kg 4512 kg 6970 kg 8303 kg
2.0 m/s -18°
4.2 m/s -7° 3.9 m/s
+4°
2.7 m/s +17° 2.3 m/s
+18°
Bifurcated Bifurcated Bifurcated

© Crown Copyright, HSE 2017 16
• Brief introduction to the Health and Safety Laboratory (HSL)
• Objectives
• Overview of models
– DRIFT
– PHAST
– Computational Fluid Dynamics (CFD)
• Analysis of Jack Rabbit II data from 2015 trials
– Comparison to Chlorine Institute Pamphlet 74 Guidance
• Model validation
• Conclusions and Future Directions
Outline
© Crown Copyright, HSE 2017 17
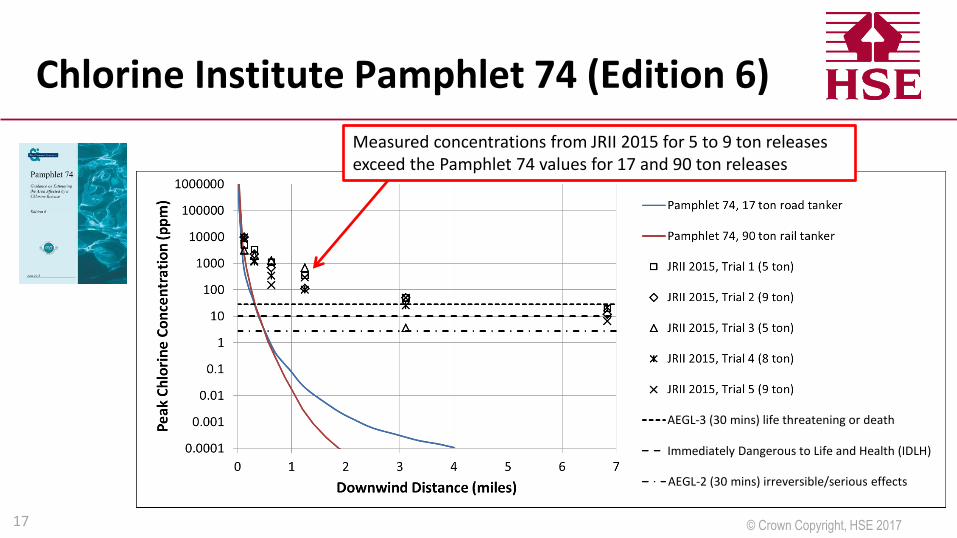
Chlorine Institute Pamphlet 74 (Edition 6)
Measured concentrations from JRII 2015 for 5 to 9 ton releases exceed the Pamphlet 74 values for 17 and 90 ton releases
AEGL-3 (30 mins) life threatening or death
AEGL-2 (30 mins) irreversible/serious effects
Immediately Dangerous to Life and Health (IDLH)

© Crown Copyright, HSE 2017 18
Outline
• Brief introduction to the Health and Safety Laboratory (HSL)
• Objectives
• Overview of models
– DRIFT
– PHAST
– Computational Fluid Dynamics (CFD)
• Analysis of Jack Rabbit II data from 2015 trials
– Comparison to Chlorine Institute Pamphlet 74 Guidance
• Model validation
• Conclusions and Future Directions

© Crown Copyright, HSE 2017 19
Model Validation: JRII 2015 Discharge
PHAST meta-stable liquid
PHAST flashing in orifice
DRIFT meta-stable liquid
DRIFT flashing in orifice
Measurements from load cell data
Trial 2 Trial 1 Trial 3 Trial 4
Vessel
Results from HSE’s STREAM outflow model

© Crown Copyright, HSE 2017 20
Model Validation: JRII 2015 Concentration
PHAST without droplet rainout
PHAST with droplet rainout
Both PHAST and DRIFT models assumed meta-stable liquid discharge from the vessel
DRIFT without droplet rainout
DRIFT with droplet rainout
Measured maximum arc-wise concentration
Canary sensor data: only 3 sensors, may have missed plume maximum
Plume passed beyond edge of arc: plume maximum may have been missed
MiniRAE sensor saturated
ToxiRAE sensor saturated
Narrow plume passed between sensors: plume maximum may have been missed

© Crown Copyright, HSE 2017 21
Model Validation: JRII 2015 Toxic Load
Specified Level of Toxicity (SLOT)
Significant Likelihood of Death (SLOD)
Results presented here using UK HSE value n = 2.0 (USA value is n = 2.75)
Measured maximum arc-wise concentration
Canary sensor data: only 3 sensors, may have missed plume maximum
Plume passed beyond edge of arc: plume maximum may have been missed
MiniRAE sensor saturated
ToxiRAE sensor saturated
Narrow plume passed between sensors: plume maximum may have been missed
DRIFT without droplet rainout
DRIFT with droplet rainout

© Crown Copyright, HSE 2017 22
CFD Analysis of source conditions
Choice of droplet impingement conditions has a strong effect
200 m
Droplets bounce elastically
Droplets stick on impact
50% of droplets bounce with 50% of momentum
Measured maximum concentration (MiniRAE)
Measured maximum concentration (Canary)
From: Bai, Rusche & Gosman (2002) “Modeling of gasoline spray impingement”, Atomization and Sprays 12, p1-27
Maximum concentrations at height of sensors in Trial 1
Bounce
Stick
50% Bounce
50% momentum
500 m

© Crown Copyright, HSE 2017 23
CFD Simulation of JRII 2016 Trial 7
Play Videos
http://www.uvu.edu/esa/jackrabbit/

© Crown Copyright, HSE 2017 24
• Brief introduction to the Health and Safety Laboratory (HSL)
• Objectives
• Overview of models
– DRIFT
– PHAST
– Computational Fluid Dynamics (CFD)
• Analysis of Jack Rabbit II data from 2015 trials
– Comparison to Chlorine Institute Pamphlet 74 Guidance
• Model validation
• Conclusions and Future Directions
Outline

© Crown Copyright, HSE 2017 25
Conclusions and Future Directions
• Model validation
– Preliminary results for Jack Rabbit II 2015 show that DRIFT and PHAST provide reasonably good predictions of concentration when the models account for rainout
Concentrations are generally over-predicted slightly, but sometimes under-predicted
– When models assume no rainout, concentrations are over-predicted (significantly for PHAST)
• Effect of averaging time used to process JRII 2015 data has been investigated
– No significant influence on results
• Wind speed, wind direction and atmospheric stability conditions in JRII 2015 tests
– Further analysis of weather data is required
– Conditions changed during the experiments (the cloud typically took 1 hour to reach 11 km), whereas models assumed constant conditions
– Sensitivity tests are currently ongoing
© Crown Copyright, HSE 2017 26
Conclusions and Future Directions
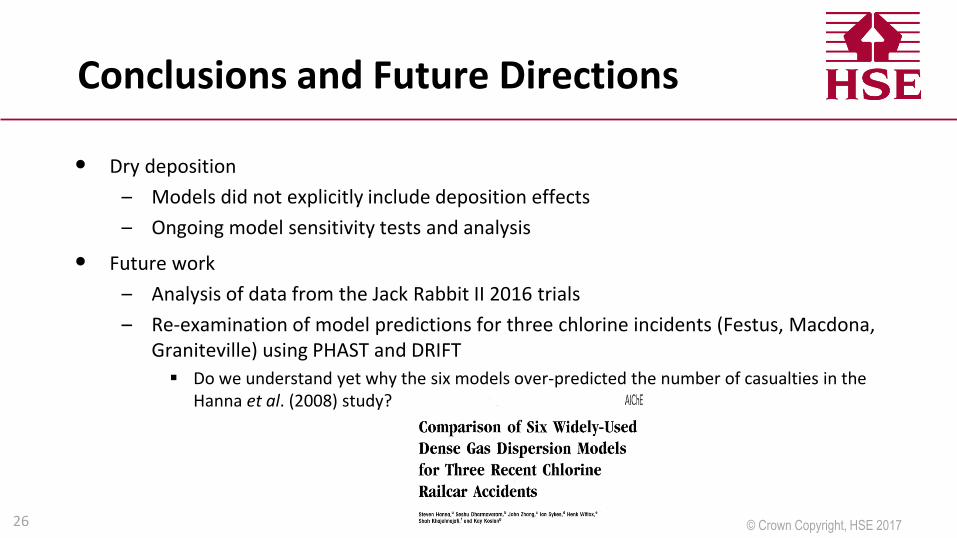
• Dry deposition
– Models did not explicitly include deposition effects
– Ongoing model sensitivity tests and analysis
• Future work
– Analysis of data from the Jack Rabbit II 2016 trials
– Re-examination of model predictions for three chlorine incidents (Festus, Macdona, Graniteville) using PHAST and DRIFT
Do we understand yet why the six models over-predicted the number of casualties in the Hanna et al. (2008) study?
© Crown Copyright, HSE 2017 27
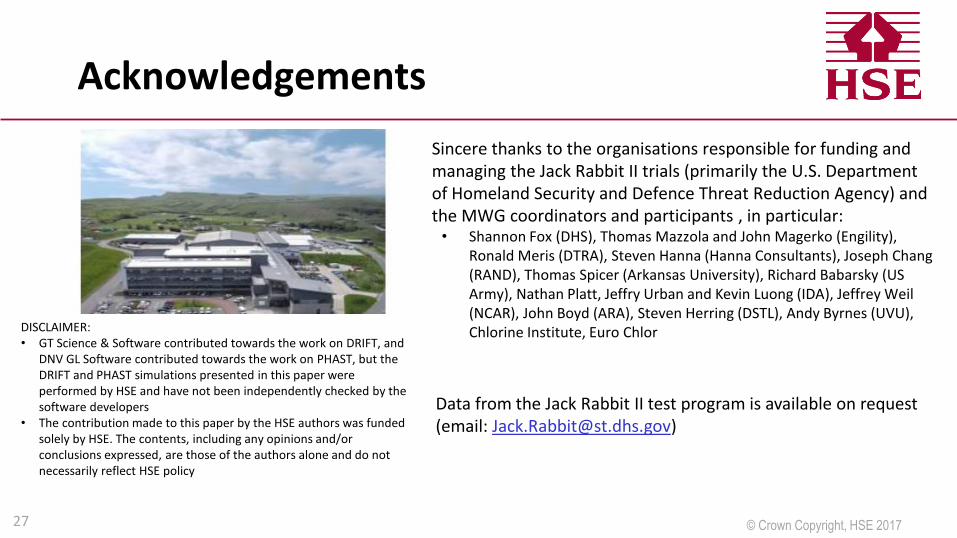
Acknowledgements
Sincere thanks to the organisations responsible for funding and managing the Jack Rabbit II trials (primarily the U.S. Department of Homeland Security and Defence Threat Reduction Agency) and the MWG coordinators and participants , in particular: • Shannon Fox (DHS), Thomas Mazzola and John Magerko (Engility),
Ronald Meris (DTRA), Steven Hanna (Hanna Consultants), Joseph Chang (RAND), Thomas Spicer (Arkansas University), Richard Babarsky (US Army), Nathan Platt, Jeffry Urban and Kevin Luong (IDA), Jeffrey Weil (NCAR), John Boyd (ARA), Steven Herring (DSTL), Andy Byrnes (UVU), Chlorine Institute, Euro Chlor
DISCLAIMER: • GT Science & Software contributed towards the work on DRIFT, and
DNV GL Software contributed towards the work on PHAST, but the DRIFT and PHAST simulations presented in this paper were performed by HSE and have not been independently checked by the software developers
• The contribution made to this paper by the HSE authors was funded solely by HSE. The contents, including any opinions and/or conclusions expressed, are those of the authors alone and do not necessarily reflect HSE policy
Data from the Jack Rabbit II test program is available on request (email: [email protected])


![INTHISISSUE INDEXOF ADOPTEDRULES VOLUME …...7:25-5.[2]3 Cottontail rabbit (Sylvilagus floridanus), black tailed jack rabbit (Lepus californicus), white-tailed jack rabbit (Lepus](https://img.dokumen.tips/doc/110x75/5fe2d497cac76717c9620356/inthisissue-indexof-adoptedrules-volume-725-523-cottontail-rabbit-sylvilagus.jpg)