Embed Size (px)
Citation preview
University of Arkansas, FayettevilleScholarWorks@UARKIndustrial Engineering Undergraduate HonorsTheses Industrial Engineering
5-2018
Dispensing Medical Countermeasures in PublicHealth Emergencies via Home Health Agenciesand Points of DistributionAnna Hudgeons
Follow this and additional works at: https://scholarworks.uark.edu/ineguhtPart of the Industrial Engineering Commons, Other Public Health Commons, Service Learning
Commons, and the Systems Engineering Commons
This Thesis is brought to you for free and open access by the Industrial Engineering at ScholarWorks@UARK. It has been accepted for inclusion inIndustrial Engineering Undergraduate Honors Theses by an authorized administrator of ScholarWorks@UARK. For more information, please [email protected].
Recommended CitationHudgeons, Anna, "Dispensing Medical Countermeasures in Public Health Emergencies via Home Health Agencies and Points ofDistribution" (2018). Industrial Engineering Undergraduate Honors Theses. 59.https://scholarworks.uark.edu/ineguht/59
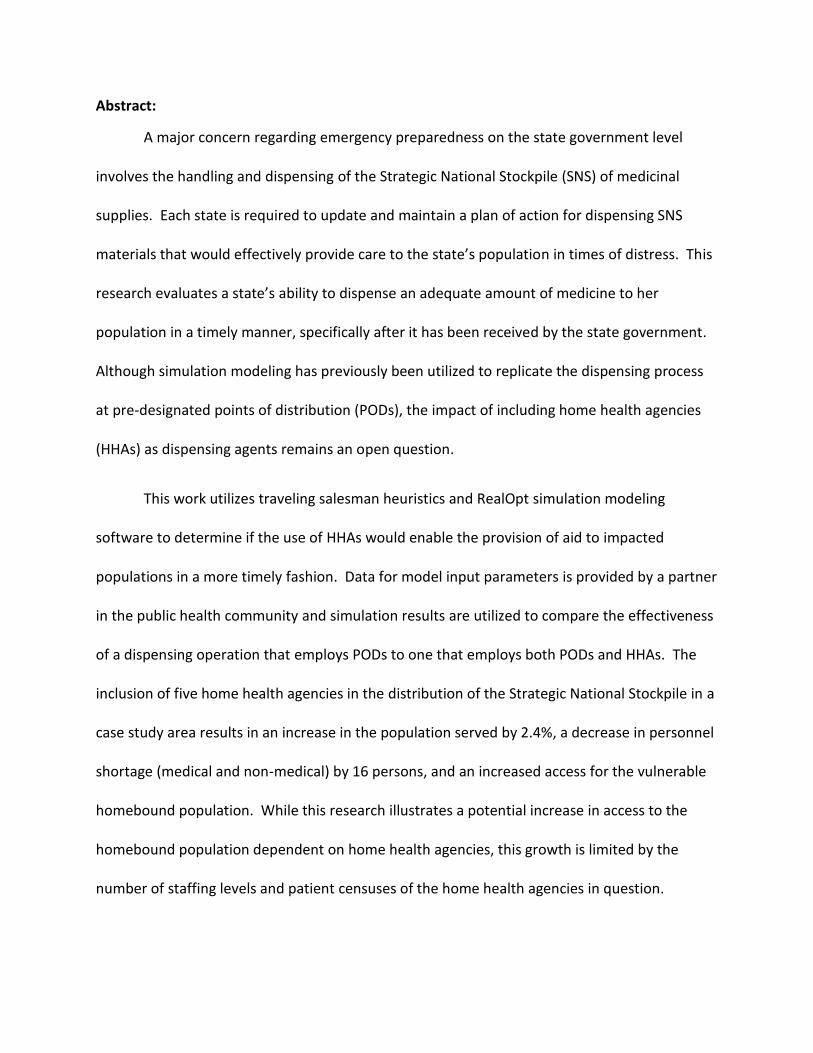
Abstract:
A major concern regarding emergency preparedness on the state government level
involves the handling and dispensing of the Strategic National Stockpile (SNS) of medicinal
supplies. Each state is required to update and maintain a plan of action for dispensing SNS
materials that would effectively provide care to the state’s population in times of distress. This
research evaluates a state’s ability to dispense an adequate amount of medicine to her
population in a timely manner, specifically after it has been received by the state government.
Although simulation modeling has previously been utilized to replicate the dispensing process
at pre-designated points of distribution (PODs), the impact of including home health agencies
(HHAs) as dispensing agents remains an open question.
This work utilizes traveling salesman heuristics and RealOpt simulation modeling
software to determine if the use of HHAs would enable the provision of aid to impacted
populations in a more timely fashion. Data for model input parameters is provided by a partner
in the public health community and simulation results are utilized to compare the effectiveness
of a dispensing operation that employs PODs to one that employs both PODs and HHAs. The
inclusion of five home health agencies in the distribution of the Strategic National Stockpile in a
case study area results in an increase in the population served by 2.4%, a decrease in personnel
shortage (medical and non-medical) by 16 persons, and an increased access for the vulnerable
homebound population. While this research illustrates a potential increase in access to the
homebound population dependent on home health agencies, this growth is limited by the
number of staffing levels and patient censuses of the home health agencies in question.

1 | P a g e
Acknowledgements:
First and foremost, none of this would be possible without God. I thank Him every day
for His amazing blessings. I would also like to thank Dr. Milburn for her guidance, wisdom, and
patience throughout this research process. She has been an amazing influence in my life and I
will forever treasure our time working together. I would also like to thank the State of Arkansas
for the financial support through the State Undergraduate Research Fellowship. Lastly, I would
like to thank my family and friends for all the support they have shown in this adventure. I love
you all to the moon and back!
“Don’t cry because it’s over, smile because it happened.” -- Dr. Seuss
2 | P a g e
Table of Contents:
Abstract …………………………………………………………………………………………………………………… 1
Acknowledgements …………………………………………………………………………………………………. 2
Background Information ………………………………………………………………………………………….. 4
Research Questions ……………………………………………………………………….………………………... 6
Objectives …………………………………….………………………………………………………………………….. 7
Literature Review ……………………………………………………..……………………………………………… 8
Methods
[i] Overview ………………………………………………………………………………….………………. 13
[ii] Replicating the Current State of a Point of Distribution …………………………… 14
[iii] Identifying the Processes Required of Home Health Agencies ………………… 18
[a] In-Home Requirements ………………………………………………………………… 19
[b] In-Transit Requirements ………………………………………………………………. 21
[iv] Analyzing the Impact of a Proposed Model Incorporating HHA Support .... 23
Experimentation and Results
[i] Current State of a Point of Distribution …………………………………………………….. 23
[ii] Case Study Application: Five Major Home Health Agencies …………………….. 25
[a] In-Home Home Health Agency Calculations …………………………………. 27
[b] In-Transit Home Health Agency Calculations ………………………………… 28
[c] Combining In-Home and In-Transit HHA Calculations ………………..…. 28
[d] Incorporating HHAs into Open POD Simulation …………………………….. 29
Conclusions and Future Research ……………………………………………………………………………… 29
References ………………………………………………………………………………………………………………… 32
3 | P a g e
Dispensing Medical Countermeasures in Public Health Emergencies via Home Health Agencies and Points of Distribution
Undergraduate Researcher: Anna Hudgeons
Mentor: Ashlea Milburn
Background Information:
In the event of a national emergency, it is crucial the appropriate quantities and types of
medical supplies be accessible to the public. Depending on the severity of the emergency, local
supplies may not be adequate to provide protection during a public health threat. To prepare
for and thwart a potential national health emergency, Congress charged the Department of
Health and Human Services (DHS) and the Centers for Disease Control and Prevention (CDC)
with the establishment of the National Pharmaceutical Stockpile in 1999. This program was
later named the Strategic National Stockpile (SNS) in 2003 [19]. The goal is to maintain a
reserve of drugs, vaccines, and other medical items in “Push Packages” which can be delivered
to the United States and her territories within 12 hours of federal deployment [7]. After
reaching their destinations, the materials become the responsibility of the states.
Emergencies resulting from crises such as major earthquakes, contagious disease
outbreaks, or even terrorist attacks may require an overwhelming amount of supplies to
medically aid potential victims. The SNS currently consists of items such as antibiotics, chemical
antidotes, and other medical/surgical items [19]. To access this stockpile, utilization requests
submitted by the state are evaluated by the DHS and the CDC before assets are released [19].
To provide timely support in moments of need, the Centers for Disease Control and Prevention
administered the Cities Readiness Initiative (CRI) to provide technical expertise and funding to
state public health departments to improve their ability to dispense medical supplies to their

4 | P a g e
entire populations within 48 hours [21]. This 48-hour limit is differentiated into the time
required to request and transport SNS supplies from state receiving points to regional
distribution points (also known as Points of Distribution or PODs) and the time allowed for the
dispensing of these supplies to the public. PODs are strategically designated locations that the
public must visit to access the supplies [3]. PODs can be distinguished as either open or closed.
Open PODs are operated by the government and open to the entire public, while closed PODs
are establishments, such as large churches or private businesses, that are limited in the
clientele they serve [12]. Current dispensing plans for several states call for both open and
closed PODs. The flow of these supplies from federal storage to the end-users is illustrated in
Figure 1:
Figure 1: Distribution of SNS Supplies [21]
5 | P a g e
All states are required by the federal government to have a plan of emergency
preparation for the dispensing of medicinal drugs. States’ plans must be reviewed and updated
annually to avoid deficiencies revealed during SNS Program Assessments and state and local
training exercises [18, 16, 17, 20]. While the Cities Readiness Initiative has had a great effect on
strengthening preparedness capacities [22], performance has proven to be somewhat lower in
three critical areas of the distribution process: coordination and guidance for dispensing,
security, and distribution [15]. Furthermore, the Cities Readiness Initiative is only applied in a
few designated cities in the United States, leaving room for inadequacies in cities or counties
who are not qualified for this government program. The case study area for this research is not
located in a CRI certified area, making it vulnerable to failure for emergency response within
the 48-hour time period. A lack of feasibility in a state’s emergency readiness could lead to
disaster and potential loss of life in times of trial. This research provides a model that states
can use to analyze whether home health agencies can be used as resource multipliers in their
states to achieve dispensing to their populations within required timeframes.
Research Questions:
In conjunction with the use of PODs in the distribution of the SNS, home health agencies
have great potential to act as private dispensing entities. A home health agency (HHA) is an
organization which is primarily engaged in providing skilled nursing services to patients in their
homes and is licensed pursuant to state or local law [10]. In-home dispensing via HHAs would
allow increased access to the homebound population of the state and extend the beneficial
6 | P a g e
reach of SNS. Citizens with restricted mobility represent a vulnerable population and may not
be able to reach established PODs. Additionally, using HHAs to dispense to HHA nurses,
patients, and their families can divert congestion away from the PODs other members of the
public will use. This research establishes the comparative effectiveness of dispensing
operations exclusive and inclusive of HHAs.
Objectives:
The purpose of this research is to analyze and evaluate current SNS distribution
methods to determine if improvements are available and/or necessary to achieve complete SNS
dispensation within the 48-hour target range. Emphasis is placed on dispensing activities that
occur within open PODs, closed PODs, and HHAs rather than the logistics activities required to
distribute supplies to all PODs. Simulation models of POD operations will be utilized to
replicate the existing distribution methods as well as to create alternative SNS allocation
strategies. These strategies will specifically consider one major modification to the current
method in which supplies are dispensed at the local level: utilizing home health agencies (HHAs)
as closed PODs. A comparison of the effectiveness of a dispensing operation that uses only
PODs to one that utilizes both PODs and HHAs will be conducted based on simulation modeling
results. A case study area will serve as the basis for all existing and potential models.
7 | P a g e
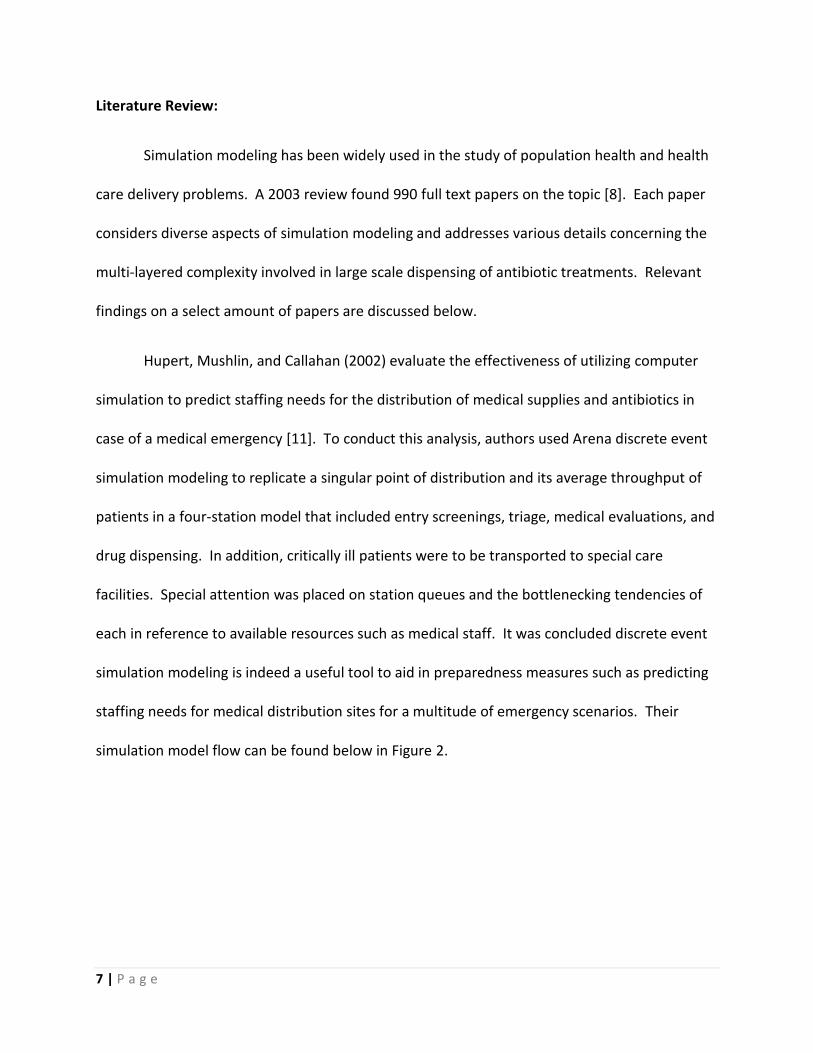
Literature Review:
Simulation modeling has been widely used in the study of population health and health
care delivery problems. A 2003 review found 990 full text papers on the topic [8]. Each paper
considers diverse aspects of simulation modeling and addresses various details concerning the
multi-layered complexity involved in large scale dispensing of antibiotic treatments. Relevant
findings on a select amount of papers are discussed below.
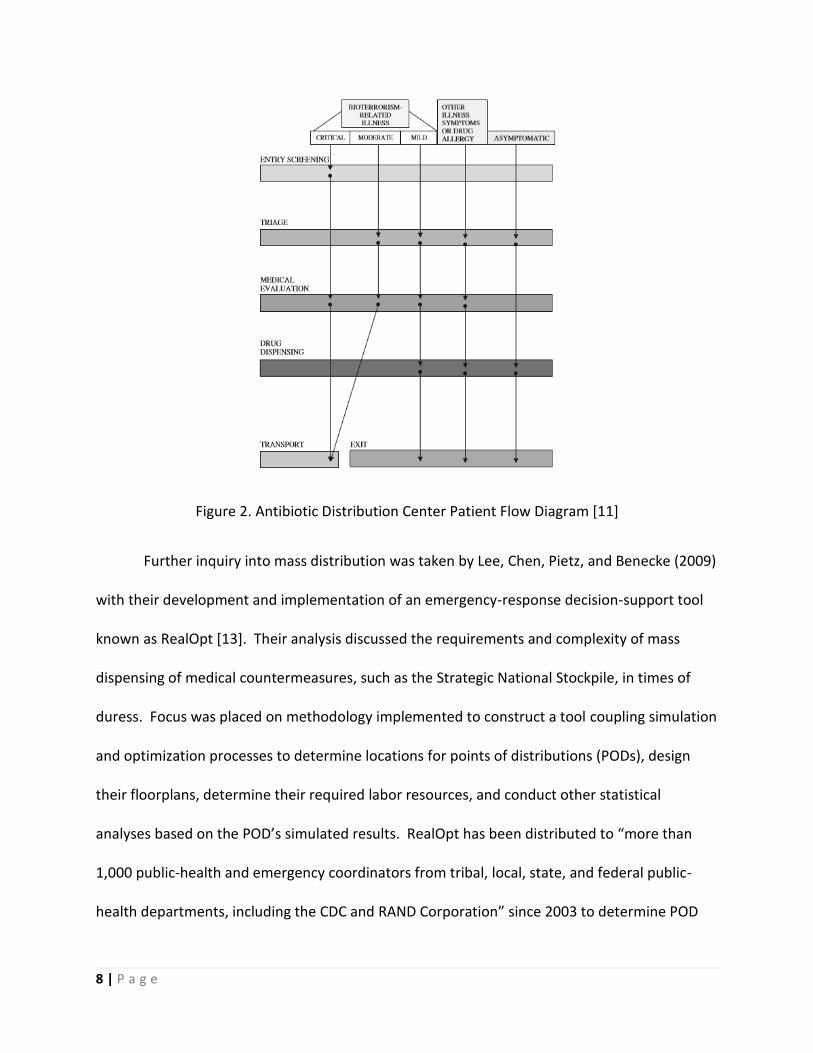
Hupert, Mushlin, and Callahan (2002) evaluate the effectiveness of utilizing computer
simulation to predict staffing needs for the distribution of medical supplies and antibiotics in
case of a medical emergency [11]. To conduct this analysis, authors used Arena discrete event
simulation modeling to replicate a singular point of distribution and its average throughput of
patients in a four-station model that included entry screenings, triage, medical evaluations, and
drug dispensing. In addition, critically ill patients were to be transported to special care
facilities. Special attention was placed on station queues and the bottlenecking tendencies of
each in reference to available resources such as medical staff. It was concluded discrete event
simulation modeling is indeed a useful tool to aid in preparedness measures such as predicting
staffing needs for medical distribution sites for a multitude of emergency scenarios. Their
simulation model flow can be found below in Figure 2.
8 | P a g e
Figure 2. Antibiotic Distribution Center Patient Flow Diagram [11]
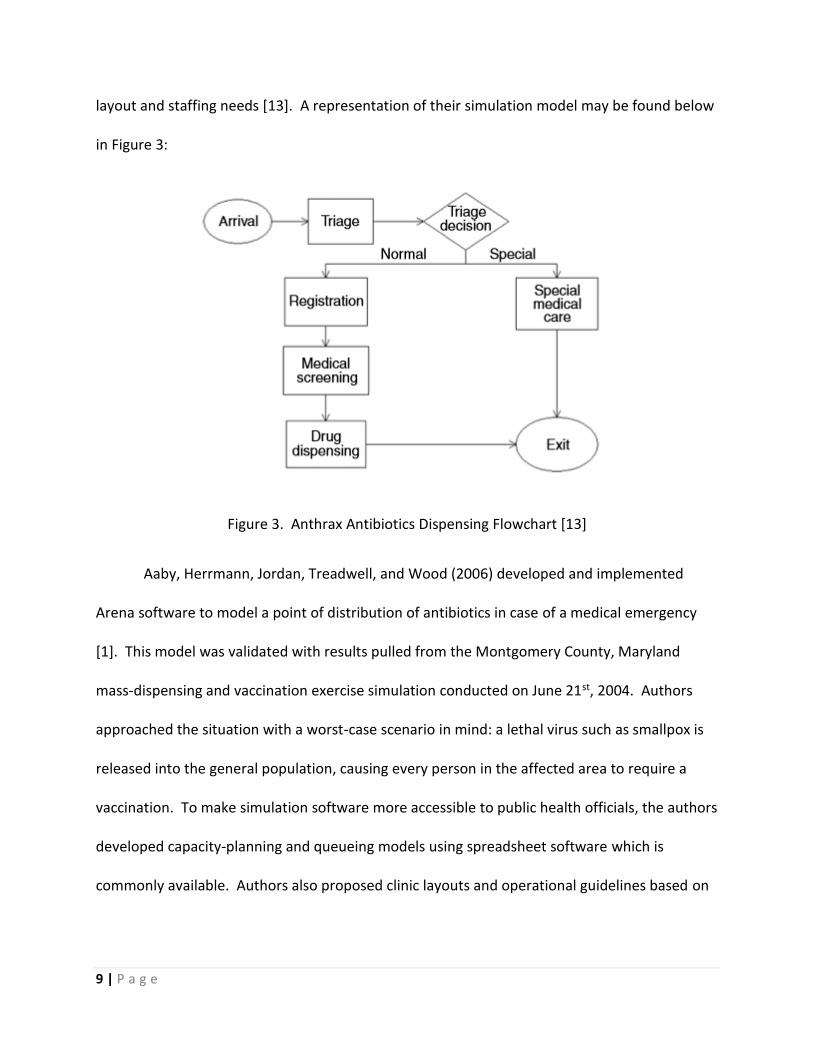
Further inquiry into mass distribution was taken by Lee, Chen, Pietz, and Benecke (2009)
with their development and implementation of an emergency-response decision-support tool
known as RealOpt [13]. Their analysis discussed the requirements and complexity of mass
dispensing of medical countermeasures, such as the Strategic National Stockpile, in times of
duress. Focus was placed on methodology implemented to construct a tool coupling simulation
and optimization processes to determine locations for points of distributions (PODs), design
their floorplans, determine their required labor resources, and conduct other statistical
analyses based on the POD’s simulated results. RealOpt has been distributed to “more than
1,000 public-health and emergency coordinators from tribal, local, state, and federal public-
health departments, including the CDC and RAND Corporation” since 2003 to determine POD
9 | P a g e
layout and staffing needs [13]. A representation of their simulation model may be found below
in Figure 3:
Figure 3. Anthrax Antibiotics Dispensing Flowchart [13]
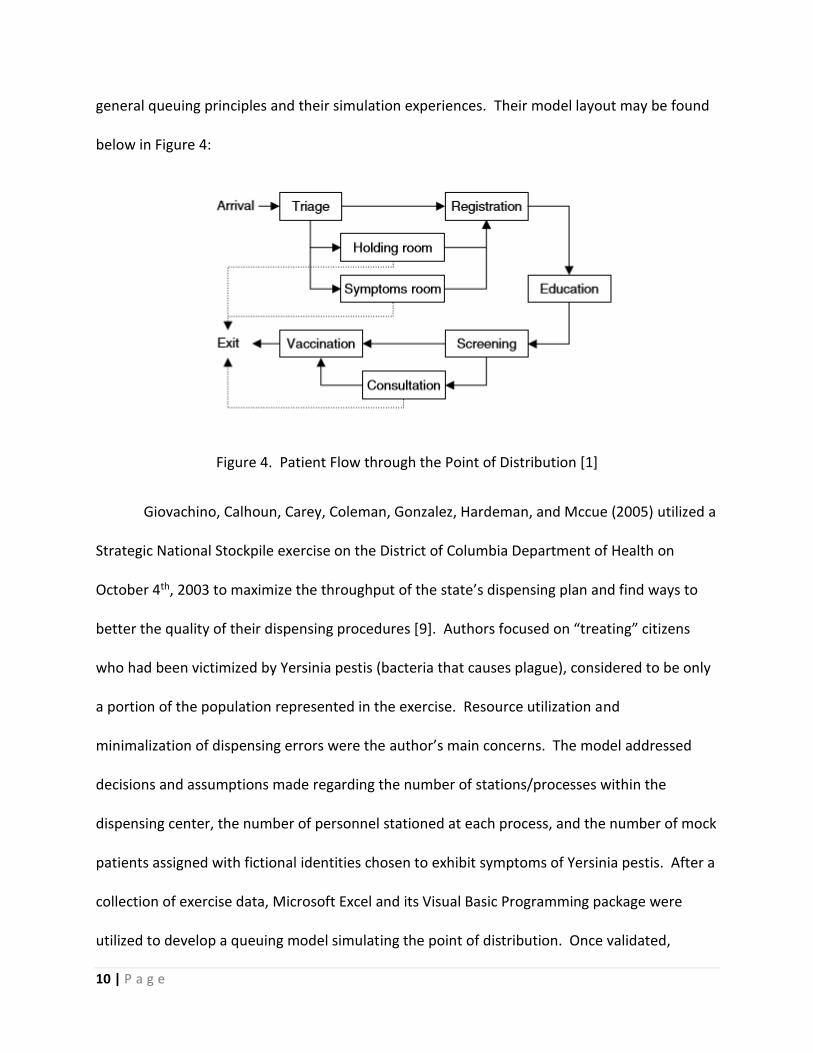
Aaby, Herrmann, Jordan, Treadwell, and Wood (2006) developed and implemented
Arena software to model a point of distribution of antibiotics in case of a medical emergency
[1]. This model was validated with results pulled from the Montgomery County, Maryland
mass-dispensing and vaccination exercise simulation conducted on June 21st, 2004. Authors
approached the situation with a worst-case scenario in mind: a lethal virus such as smallpox is
released into the general population, causing every person in the affected area to require a
vaccination. To make simulation software more accessible to public health officials, the authors
developed capacity-planning and queueing models using spreadsheet software which is
commonly available. Authors also proposed clinic layouts and operational guidelines based on
10 | P a g e
general queuing principles and their simulation experiences. Their model layout may be found
below in Figure 4:
Figure 4. Patient Flow through the Point of Distribution [1]
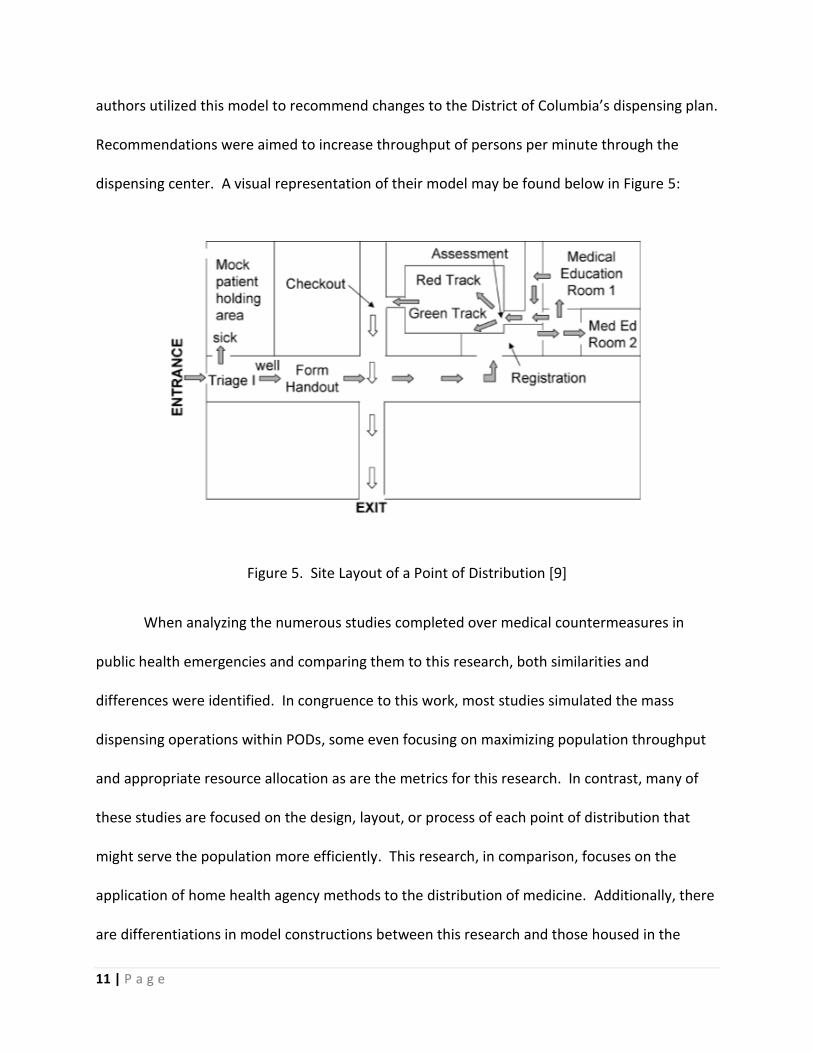
Giovachino, Calhoun, Carey, Coleman, Gonzalez, Hardeman, and Mccue (2005) utilized a
Strategic National Stockpile exercise on the District of Columbia Department of Health on
October 4th, 2003 to maximize the throughput of the state’s dispensing plan and find ways to
better the quality of their dispensing procedures [9]. Authors focused on “treating” citizens
who had been victimized by Yersinia pestis (bacteria that causes plague), considered to be only
a portion of the population represented in the exercise. Resource utilization and
minimalization of dispensing errors were the author’s main concerns. The model addressed
decisions and assumptions made regarding the number of stations/processes within the
dispensing center, the number of personnel stationed at each process, and the number of mock
patients assigned with fictional identities chosen to exhibit symptoms of Yersinia pestis. After a
collection of exercise data, Microsoft Excel and its Visual Basic Programming package were
utilized to develop a queuing model simulating the point of distribution. Once validated,
11 | P a g e
authors utilized this model to recommend changes to the District of Columbia’s dispensing plan.
Recommendations were aimed to increase throughput of persons per minute through the
dispensing center. A visual representation of their model may be found below in Figure 5:
Figure 5. Site Layout of a Point of Distribution [9]
When analyzing the numerous studies completed over medical countermeasures in
public health emergencies and comparing them to this research, both similarities and
differences were identified. In congruence to this work, most studies simulated the mass
dispensing operations within PODs, some even focusing on maximizing population throughput
and appropriate resource allocation as are the metrics for this research. In contrast, many of
these studies are focused on the design, layout, or process of each point of distribution that
might serve the population more efficiently. This research, in comparison, focuses on the
application of home health agency methods to the distribution of medicine. Additionally, there
are differentiations in model constructions between this research and those housed in the

12 | P a g e
literature review (as seen in Figures 2 – 5). Many models contained separate tracks or paths
through the point of distribution based on severity of illness or treatment requirements, though
an assumption in this research concerns the equality of patient illness levels thereby including
only one path through the point of distribution. Additionally, other models include additional
steps in the distribution process such as education or screening, while the model in this
research is primarily focused on dispensing.
Methods:
Overview
In achieving the desired objectives for this research, an overview was constructed
outlining the deliverables required to analyze the effects of utilizing home health agencies in
public health emergencies:
1. Replicate the current state of PODs without the use of home health agencies
2. Identify the processes required of home health agencies in medical emergencies
a. Establish the requirements and effects of the in-home demands faced by
home health nurses distributing SNS supplies
b. Establish the requirements and effects of the in-transit demands faced by
home health nurses distributing SNS supplies
3. Analyze the impact of a proposed model incorporating in-home and in-transit pieces
of home health on the current model
13 | P a g e
Models inclusive and exclusive of home health agency effects are analyzed respectively
based on population of the general public served (throughput) as well as personnel shortages
for complete population service (minimizing resource allocation).
Replicating the Current State of a Point of Distribution
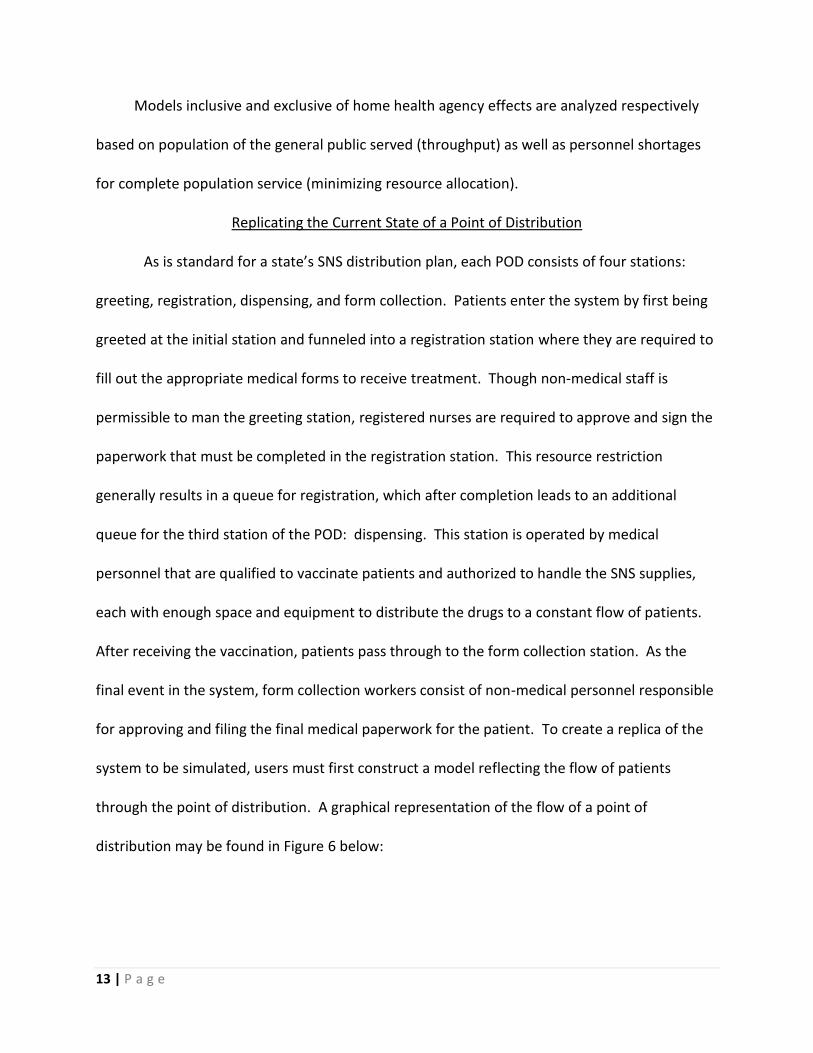
As is standard for a state’s SNS distribution plan, each POD consists of four stations:
greeting, registration, dispensing, and form collection. Patients enter the system by first being
greeted at the initial station and funneled into a registration station where they are required to
fill out the appropriate medical forms to receive treatment. Though non-medical staff is
permissible to man the greeting station, registered nurses are required to approve and sign the
paperwork that must be completed in the registration station. This resource restriction
generally results in a queue for registration, which after completion leads to an additional
queue for the third station of the POD: dispensing. This station is operated by medical
personnel that are qualified to vaccinate patients and authorized to handle the SNS supplies,
each with enough space and equipment to distribute the drugs to a constant flow of patients.
After receiving the vaccination, patients pass through to the form collection station. As the
final event in the system, form collection workers consist of non-medical personnel responsible
for approving and filing the final medical paperwork for the patient. To create a replica of the
system to be simulated, users must first construct a model reflecting the flow of patients
through the point of distribution. A graphical representation of the flow of a point of
distribution may be found in Figure 6 below:

14 | P a g e
Figure 6: Process Flow of a SNS Point of Distribution
To fulfill state requirements regarding plans for the distribution of the Strategic National
Stockpile, a partner in the public health community simulated its state’s current model via a
POD simulation support tool known as RealOpt. This software package enables decision makers
to analyze “various decision support capabilities for modeling and optimizing the public health
infrastructure for all hazard emergency response” [14]. The public health partner utilized an
offshoot of the program, RealOpt-POD, to prepare a real-time resource allocation in
congruence to the medical facilities available with its state. This specific branch of the RealOpt
software “couples large-scale simulation and fast optimization routines into one decision
support system” by “determining optimal labor resources required” to “maximize the number
of individuals who can be treated and minimize the average time spent in the clinic” [14]. With
appropriate inputs to the system, including a patient interarrival rate as well as resource levels
and service times for a single shift of a point of distribution, RealOpt users are able to simulate
an influx of patients needing to receive treatment in an event of a widespread vaccination.
15 | P a g e
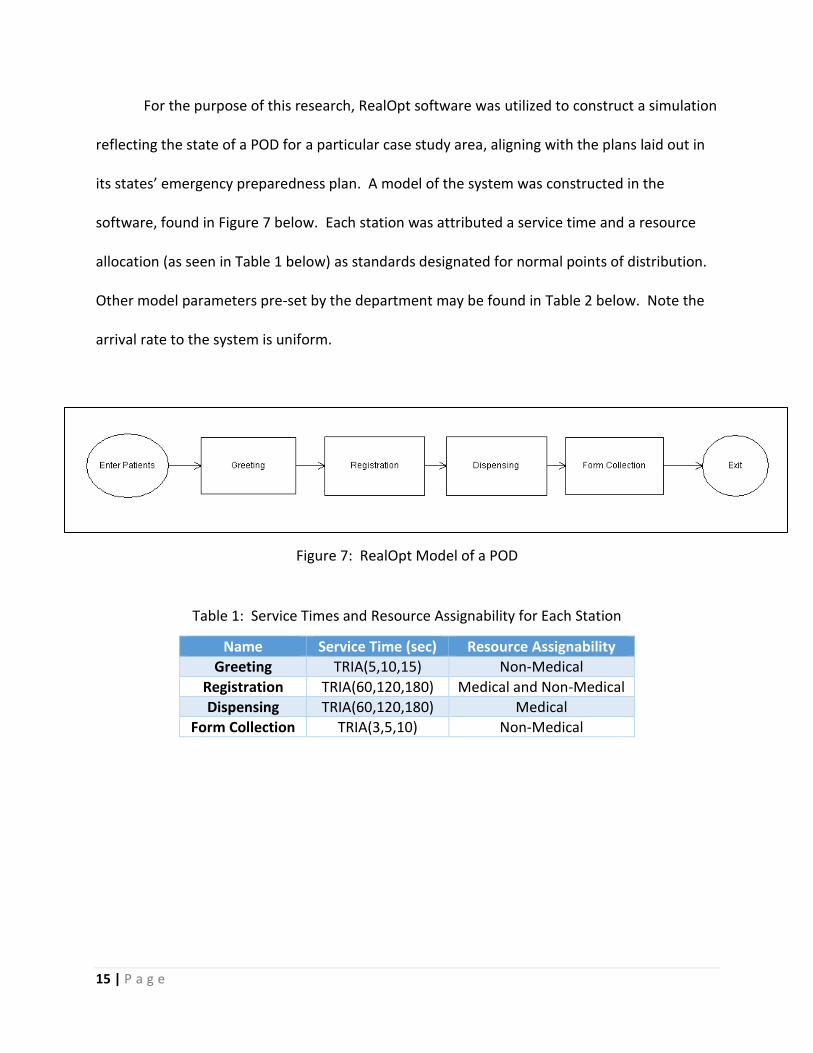
For the purpose of this research, RealOpt software was utilized to construct a simulation
reflecting the state of a POD for a particular case study area, aligning with the plans laid out in
its states’ emergency preparedness plan. A model of the system was constructed in the
software, found in Figure 7 below. Each station was attributed a service time and a resource
allocation (as seen in Table 1 below) as standards designated for normal points of distribution.
Other model parameters pre-set by the department may be found in Table 2 below. Note the
arrival rate to the system is uniform.
Figure 7: RealOpt Model of a POD
Table 1: Service Times and Resource Assignability for Each Station
Name Service Time (sec) Resource Assignability
Greeting TRIA(5,10,15) Non-Medical
Registration TRIA(60,120,180) Medical and Non-Medical
Dispensing TRIA(60,120,180) Medical
Form Collection TRIA(3,5,10) Non-Medical

16 | P a g e
Table 2: Simulation Parameters
Simulation Model Inputs
Resource Availabilities 32 medical, 36 non-medical
Simulation Time 12 hours
Number of Shifts 2
Arrival Rate Uniform
Maximum Operation Time After Simulation Completion Time 1 hour
Maximum Average Flow Time 8 minutes
Maximum Average Waiting at Any Service Station 2 minutes
Fatigue Factor 1 reserves per 10 assigned workers
RealOpt software has the potential to be utilized in two major analyses for effective
points of distribution: maximizing throughput and minimizing resource allocation. These two
functions are independent of one another, each yielding separate outputs aligned with their
respective purposes. In its first functionality, RealOpt software has the ability (in the case of
maximizing throughput) to statistically approximate the population served based on the
parameters previously stated above. With these parameters, users may determine the largest
number of patients which may be treated subject to a fixed number of personnel
predetermined by system constraints. In its second functionality of minimizing resource
allocation, users must additionally provide the minimum required total throughput per POD per
shift. This additional input represents the target throughput of (or the population to be served
by) the point of distribution. In providing this information, RealOpt allows for the
determination of the number of personnel (and their allocation to the stations) required to
achieve 100% throughput of patient population, repurposing previously required resource
availabilities from Table 2 a suggestion rather than a system constraint. The minimum required
total throughput for one POD in the case study area per shift is 23,761 patients.
17 | P a g e
Identifying the Processes Required of Home Health Agencies
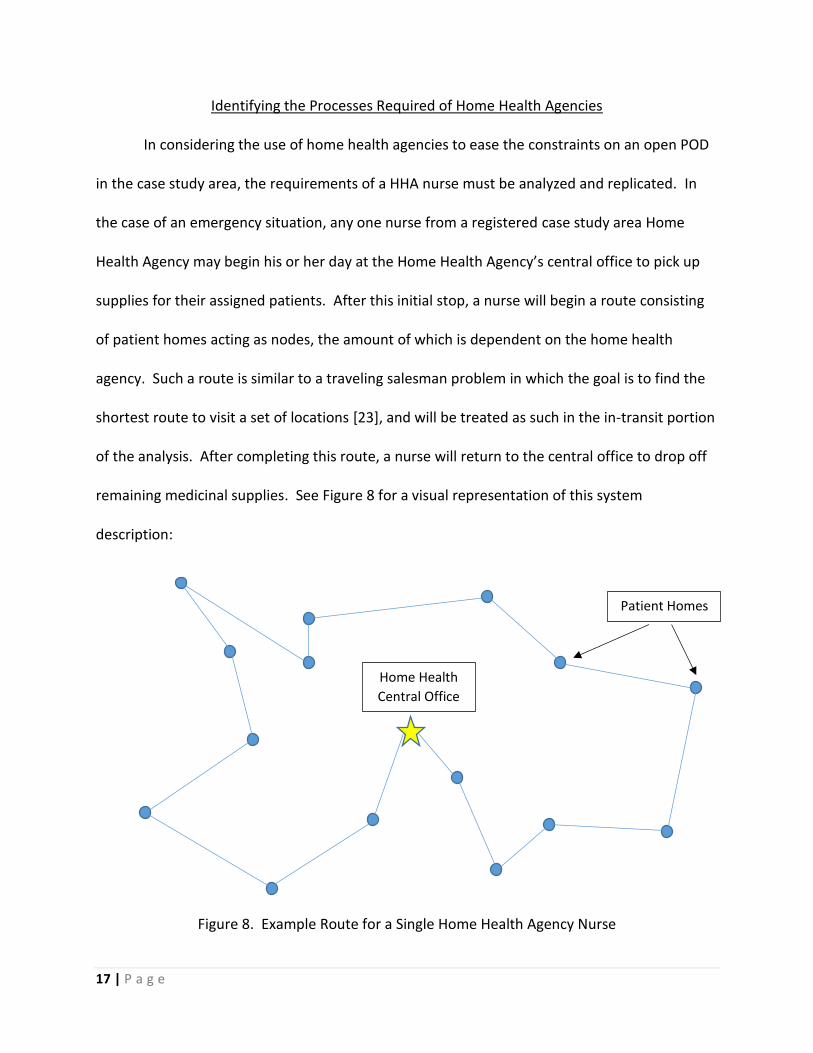
In considering the use of home health agencies to ease the constraints on an open POD
in the case study area, the requirements of a HHA nurse must be analyzed and replicated. In
the case of an emergency situation, any one nurse from a registered case study area Home
Health Agency may begin his or her day at the Home Health Agency’s central office to pick up
supplies for their assigned patients. After this initial stop, a nurse will begin a route consisting
of patient homes acting as nodes, the amount of which is dependent on the home health
agency. Such a route is similar to a traveling salesman problem in which the goal is to find the
shortest route to visit a set of locations [23], and will be treated as such in the in-transit portion
of the analysis. After completing this route, a nurse will return to the central office to drop off
remaining medicinal supplies. See Figure 8 for a visual representation of this system
description:
Figure 8. Example Route for a Single Home Health Agency Nurse
Home Health
Central Office
Patient Homes
18 | P a g e
The responsibilities of a home health nurse may be broken down into two portions: in-
home and in-transit. Note that due to the unprecedented nature of this research, expert
advice, literature estimates, and simulated exercises were sought to determine the detailed
responsibilities of each portion. In-home requirements of a HHA nurse in the distribution of
SNS supplies encompass the actions completed by the nurse from the moment they enter a
patient’s driveway until they exit the patient’s place of residence. In contrast, the in-transit
portion of the HHA nurse’s responsibilities include the time it takes to travel to a patient’s
house from his or her previous location.
In-Home Requirements
When nurses enter a home purposed with administering drugs in a public health
emergency, there are certain precautions which must be taken to ensure all medicine is
distributed responsibly. Due to the novelty of utilizing home health agencies for emergency
readiness, a series of eight steps outlining the actions of nurses administering SNS supplies in a
patient’s home was constructed based on information provided by nursing faculty of the
University of Arkansas Eleanor Mann School of Nursing led by Dr. Charleen McNeill. Each of
these steps were replicated in time studies completed by University of Arkansas nursing
students to gather per-patient estimates of each step in the in-home portion. After ridding the
data set of any significant outliers (outside three standard deviations from the mean), input
analyzer was employed to quantify a triangular distribution encompassing duration of these
actions and can be referenced in Table 5. KS and Chi-Squared p-values showing the significance
of each triangular distribution for its respective data sets were also included, demonstrating
that a triangular fit is appropriate for steps 1 through 6. Though steps 7 and 8 did not result in
19 | P a g e
significant p-values for the triangular distribution, no other distribution fit showed significant
improvement in its p-values, so the triangular distribution was adopted for simplicity.
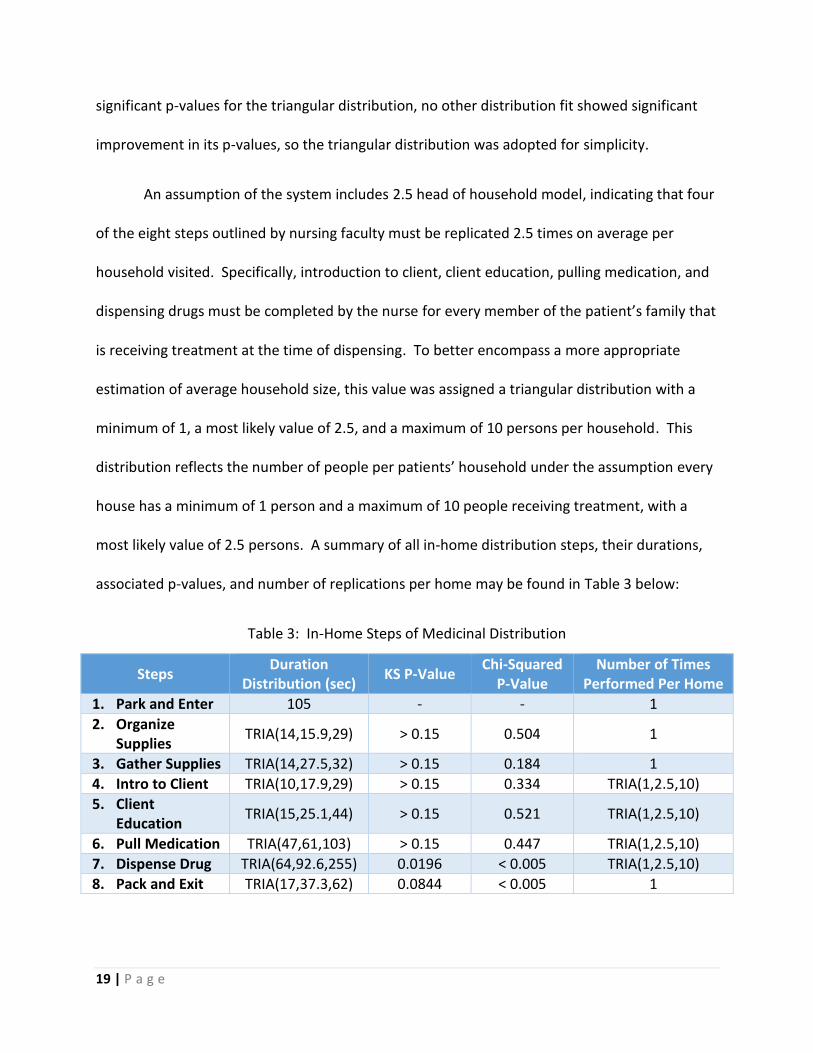
An assumption of the system includes 2.5 head of household model, indicating that four
of the eight steps outlined by nursing faculty must be replicated 2.5 times on average per
household visited. Specifically, introduction to client, client education, pulling medication, and
dispensing drugs must be completed by the nurse for every member of the patient’s family that
is receiving treatment at the time of dispensing. To better encompass a more appropriate
estimation of average household size, this value was assigned a triangular distribution with a
minimum of 1, a most likely value of 2.5, and a maximum of 10 persons per household. This
distribution reflects the number of people per patients’ household under the assumption every
house has a minimum of 1 person and a maximum of 10 people receiving treatment, with a
most likely value of 2.5 persons. A summary of all in-home distribution steps, their durations,
associated p-values, and number of replications per home may be found in Table 3 below:
Table 3: In-Home Steps of Medicinal Distribution
Steps Duration
Distribution (sec) KS P-Value
Chi-Squared P-Value
Number of Times Performed Per Home
1. Park and Enter 105 - - 1
2. Organize Supplies
TRIA(14,15.9,29) > 0.15 0.504 1
3. Gather Supplies TRIA(14,27.5,32) > 0.15 0.184 1
4. Intro to Client TRIA(10,17.9,29) > 0.15 0.334 TRIA(1,2.5,10)
5. Client Education
TRIA(15,25.1,44) > 0.15 0.521 TRIA(1,2.5,10)
6. Pull Medication TRIA(47,61,103) > 0.15 0.447 TRIA(1,2.5,10)
7. Dispense Drug TRIA(64,92.6,255) 0.0196 < 0.005 TRIA(1,2.5,10)
8. Pack and Exit TRIA(17,37.3,62) 0.0844 < 0.005 1
20 | P a g e
With these estimates, Monte Carlo simulation via @Risk Excel software was employed
to create an estimate for the entire process. By simulating the individual steps and multiplying
their summed time estimate by an additionally simulated household size, @Risk was able to
provide a single average value representing the nurse’s entire visit to a single arbitrary home on
their route. To gain a better approximation of this value, processes were simulated three times
each for one hundred replications. Single values may be multiplied by the number of patient
homes visited by a particular home health agency nurse to gather the full amount of time spent
in patient homes by any single home health agency nurse.
In-Transit Requirements
As stated above, the approach to solving the in-transit portion of a HH nurses’ duties
focused on its similarities to the traveling salesman problem (TSP). In 1959, Beardwood,
Halton, and Hammersley proposed an estimation of the length of a route subject to the number
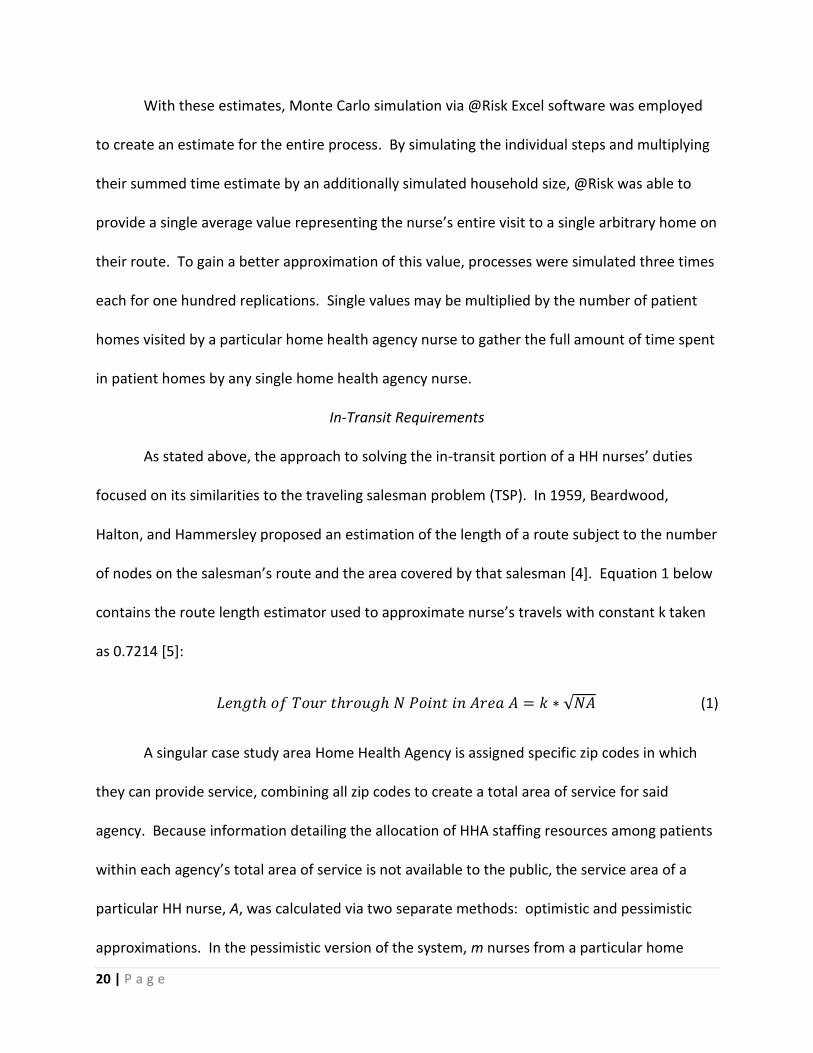
of nodes on the salesman’s route and the area covered by that salesman [4]. Equation 1 below
contains the route length estimator used to approximate nurse’s travels with constant k taken
as 0.7214 [5]:
𝐿𝑒𝑛𝑔𝑡ℎ 𝑜𝑓 𝑇𝑜𝑢𝑟 𝑡ℎ𝑟𝑜𝑢𝑔ℎ 𝑁 𝑃𝑜𝑖𝑛𝑡 𝑖𝑛 𝐴𝑟𝑒𝑎 𝐴 = 𝑘 ∗ √𝑁𝐴 (1)
A singular case study area Home Health Agency is assigned specific zip codes in which
they can provide service, combining all zip codes to create a total area of service for said
agency. Because information detailing the allocation of HHA staffing resources among patients
within each agency’s total area of service is not available to the public, the service area of a
particular HH nurse, A, was calculated via two separate methods: optimistic and pessimistic
approximations. In the pessimistic version of the system, m nurses from a particular home
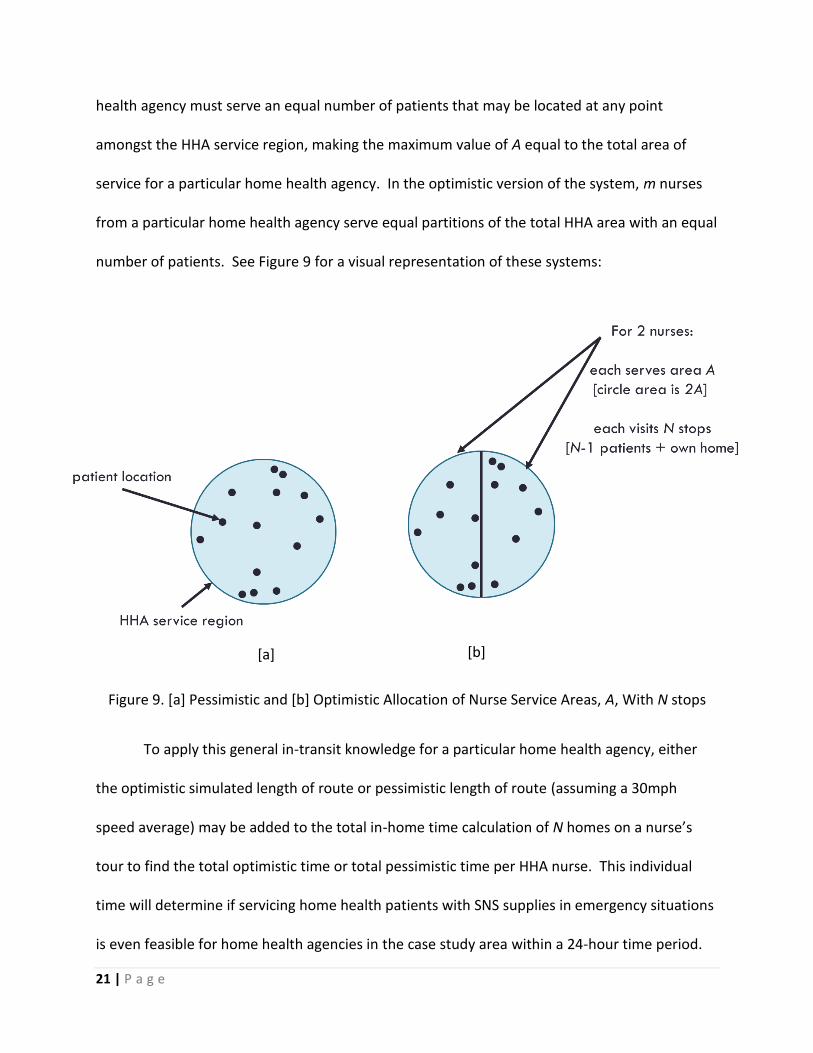
21 | P a g e
health agency must serve an equal number of patients that may be located at any point
amongst the HHA service region, making the maximum value of A equal to the total area of
service for a particular home health agency. In the optimistic version of the system, m nurses
from a particular home health agency serve equal partitions of the total HHA area with an equal
number of patients. See Figure 9 for a visual representation of these systems:
Figure 9. [a] Pessimistic and [b] Optimistic Allocation of Nurse Service Areas, A, With N stops
To apply this general in-transit knowledge for a particular home health agency, either
the optimistic simulated length of route or pessimistic length of route (assuming a 30mph
speed average) may be added to the total in-home time calculation of N homes on a nurse’s
tour to find the total optimistic time or total pessimistic time per HHA nurse. This individual
time will determine if servicing home health patients with SNS supplies in emergency situations
is even feasible for home health agencies in the case study area within a 24-hour time period.
[a] [b]
22 | P a g e
This reasoning will either support or deny the inclusion of home health agencies in open model
calculations.
Analyze the Impact of a Proposed Model Incorporating Home Health Agency Support
By validating the feasibility of incorporating home health agencies in a 24-hour period,
the number of patients touched by utilizing these resources can be calculated and applied to
the open POD model prepared for the case study area. Identifying this patient count requires a
calculation encompassing five major home health agencies whose zip codes provide coverage
for the case study area. This patient count may be eliminated from the required population
throughput to be served by a single POD in the area, thereby increasing the count of patients
receiving treatment as well as decreasing the personnel shortage to treat all citizens desiring
medical vaccination. Incorporating the original model with slightly altered input parameters
will quantify the impact of utilizing home health agencies in emergency situations.
Experimentation and Results:
Current State of a Point of Distribution
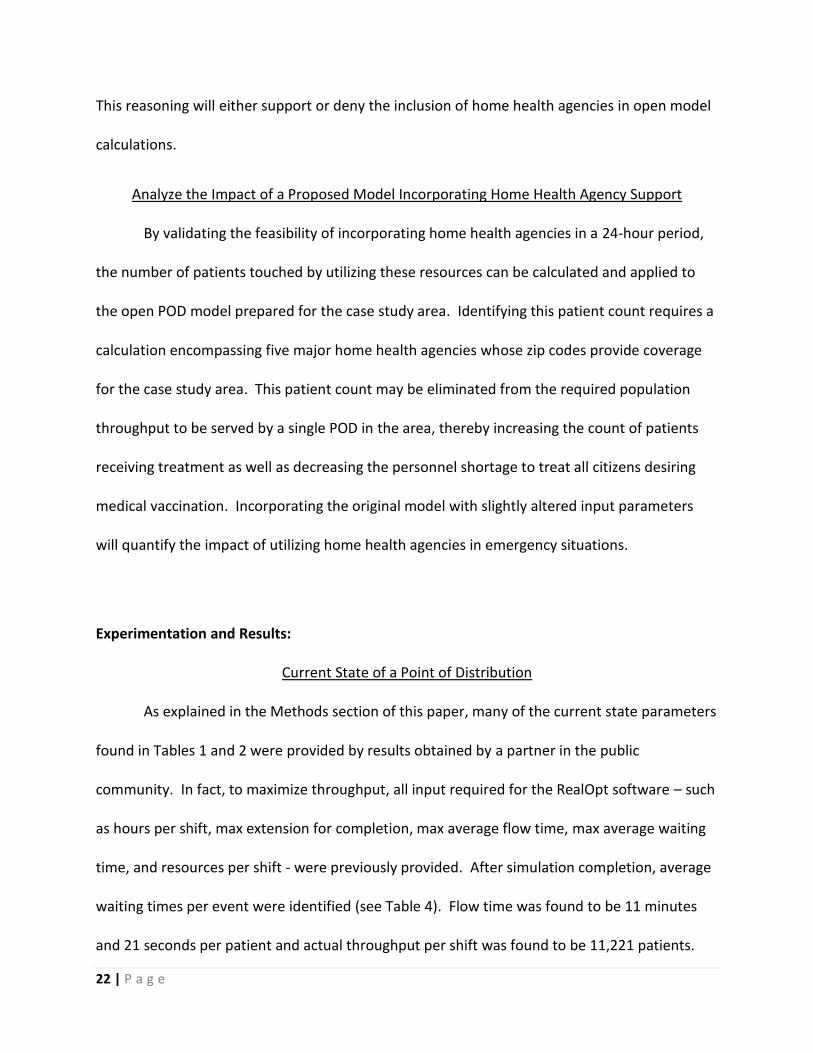
As explained in the Methods section of this paper, many of the current state parameters
found in Tables 1 and 2 were provided by results obtained by a partner in the public
community. In fact, to maximize throughput, all input required for the RealOpt software – such
as hours per shift, max extension for completion, max average flow time, max average waiting
time, and resources per shift - were previously provided. After simulation completion, average
waiting times per event were identified (see Table 4). Flow time was found to be 11 minutes
and 21 seconds per patient and actual throughput per shift was found to be 11,221 patients.
23 | P a g e
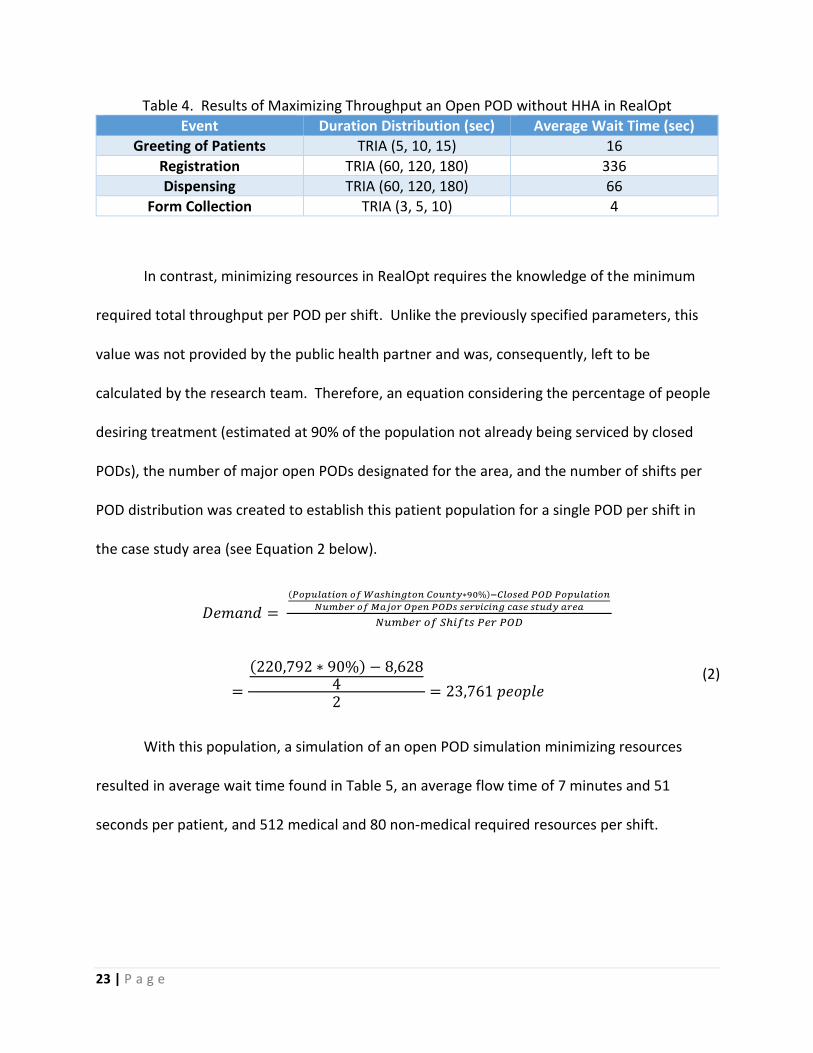
Table 4. Results of Maximizing Throughput an Open POD without HHA in RealOpt
Event Duration Distribution (sec) Average Wait Time (sec)
Greeting of Patients TRIA (5, 10, 15) 16
Registration TRIA (60, 120, 180) 336
Dispensing TRIA (60, 120, 180) 66
Form Collection TRIA (3, 5, 10) 4
In contrast, minimizing resources in RealOpt requires the knowledge of the minimum
required total throughput per POD per shift. Unlike the previously specified parameters, this
value was not provided by the public health partner and was, consequently, left to be
calculated by the research team. Therefore, an equation considering the percentage of people
desiring treatment (estimated at 90% of the population not already being serviced by closed
PODs), the number of major open PODs designated for the area, and the number of shifts per
POD distribution was created to establish this patient population for a single POD per shift in
the case study area (see Equation 2 below).
𝐷𝑒𝑚𝑎𝑛𝑑 =
(𝑃𝑜𝑝𝑢𝑙𝑎𝑡𝑖𝑜𝑛 𝑜𝑓 𝑊𝑎𝑠ℎ𝑖𝑛𝑔𝑡𝑜𝑛 𝐶𝑜𝑢𝑛𝑡𝑦∗90%)−𝐶𝑙𝑜𝑠𝑒𝑑 𝑃𝑂𝐷 𝑃𝑜𝑝𝑢𝑙𝑎𝑡𝑖𝑜𝑛
𝑁𝑢𝑚𝑏𝑒𝑟 𝑜𝑓 𝑀𝑎𝑗𝑜𝑟 𝑂𝑝𝑒𝑛 𝑃𝑂𝐷𝑠 𝑠𝑒𝑟𝑣𝑖𝑐𝑖𝑛𝑔 𝑐𝑎𝑠𝑒 𝑠𝑡𝑢𝑑𝑦 𝑎𝑟𝑒𝑎
𝑁𝑢𝑚𝑏𝑒𝑟 𝑜𝑓 𝑆ℎ𝑖𝑓𝑡𝑠 𝑃𝑒𝑟 𝑃𝑂𝐷
=
(220,792 ∗ 90%) − 8,62842
= 23,761 𝑝𝑒𝑜𝑝𝑙𝑒
With this population, a simulation of an open POD simulation minimizing resources
resulted in average wait time found in Table 5, an average flow time of 7 minutes and 51
seconds per patient, and 512 medical and 80 non-medical required resources per shift.
(2)
24 | P a g e
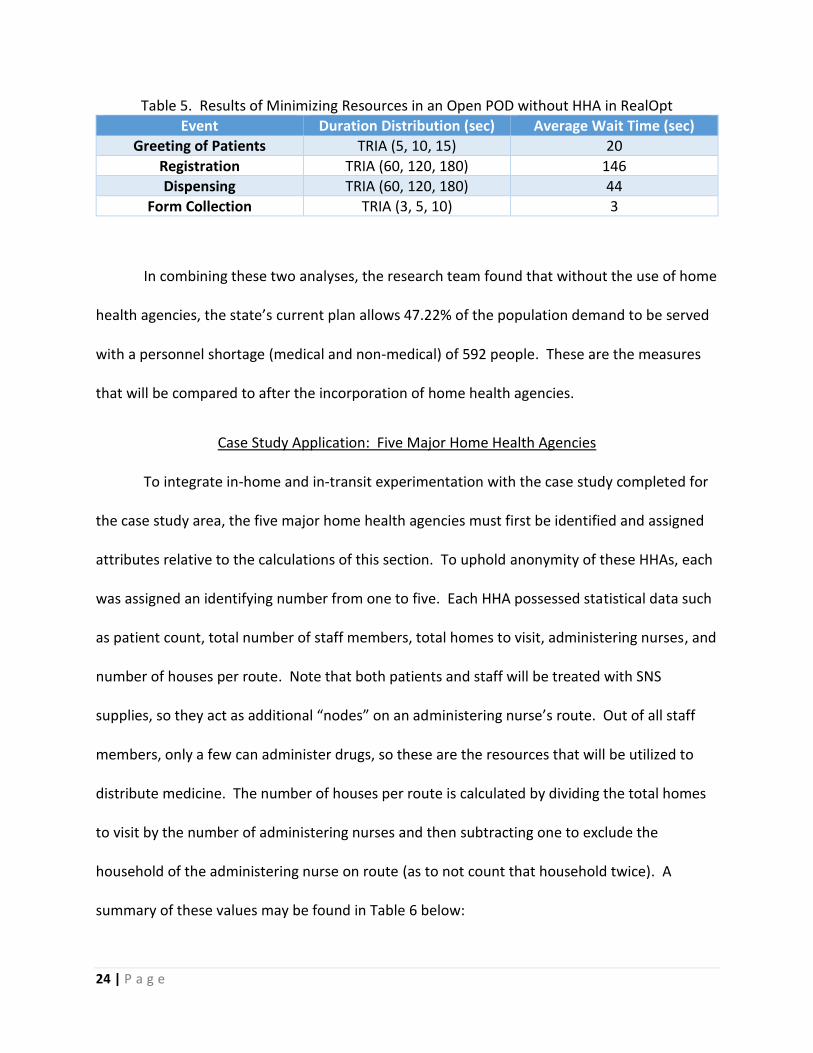
Table 5. Results of Minimizing Resources in an Open POD without HHA in RealOpt
Event Duration Distribution (sec) Average Wait Time (sec)
Greeting of Patients TRIA (5, 10, 15) 20
Registration TRIA (60, 120, 180) 146
Dispensing TRIA (60, 120, 180) 44
Form Collection TRIA (3, 5, 10) 3
In combining these two analyses, the research team found that without the use of home
health agencies, the state’s current plan allows 47.22% of the population demand to be served
with a personnel shortage (medical and non-medical) of 592 people. These are the measures
that will be compared to after the incorporation of home health agencies.
Case Study Application: Five Major Home Health Agencies
To integrate in-home and in-transit experimentation with the case study completed for
the case study area, the five major home health agencies must first be identified and assigned
attributes relative to the calculations of this section. To uphold anonymity of these HHAs, each
was assigned an identifying number from one to five. Each HHA possessed statistical data such
as patient count, total number of staff members, total homes to visit, administering nurses, and
number of houses per route. Note that both patients and staff will be treated with SNS
supplies, so they act as additional “nodes” on an administering nurse’s route. Out of all staff
members, only a few can administer drugs, so these are the resources that will be utilized to
distribute medicine. The number of houses per route is calculated by dividing the total homes
to visit by the number of administering nurses and then subtracting one to exclude the
household of the administering nurse on route (as to not count that household twice). A
summary of these values may be found in Table 6 below:
25 | P a g e
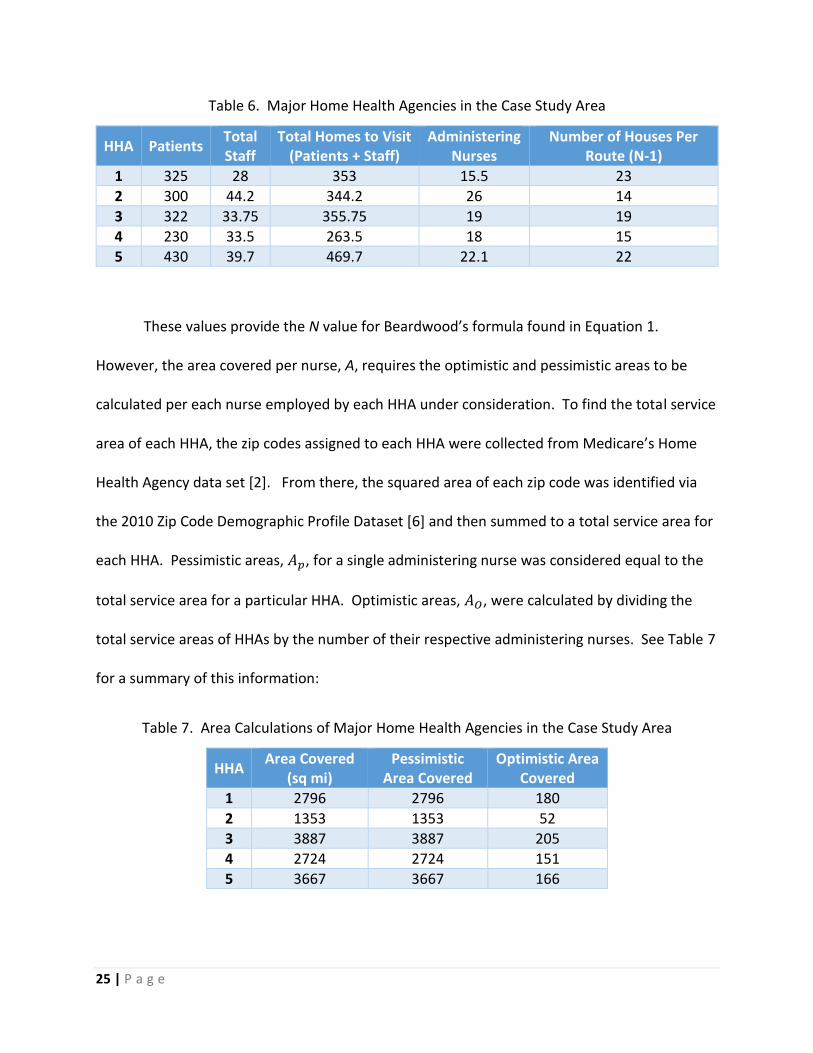
Table 6. Major Home Health Agencies in the Case Study Area
HHA Patients Total Staff
Total Homes to Visit (Patients + Staff)
Administering Nurses
Number of Houses Per Route (N-1)
1 325 28 353 15.5 23
2 300 44.2 344.2 26 14
3 322 33.75 355.75 19 19
4 230 33.5 263.5 18 15
5 430 39.7 469.7 22.1 22
These values provide the N value for Beardwood’s formula found in Equation 1.
However, the area covered per nurse, A, requires the optimistic and pessimistic areas to be
calculated per each nurse employed by each HHA under consideration. To find the total service
area of each HHA, the zip codes assigned to each HHA were collected from Medicare’s Home
Health Agency data set [2]. From there, the squared area of each zip code was identified via
the 2010 Zip Code Demographic Profile Dataset [6] and then summed to a total service area for
each HHA. Pessimistic areas, 𝐴𝑝, for a single administering nurse was considered equal to the
total service area for a particular HHA. Optimistic areas, 𝐴𝑂, were calculated by dividing the
total service areas of HHAs by the number of their respective administering nurses. See Table 7
for a summary of this information:
Table 7. Area Calculations of Major Home Health Agencies in the Case Study Area
HHA Area Covered
(sq mi) Pessimistic
Area Covered Optimistic Area
Covered
1 2796 2796 180
2 1353 1353 52
3 3887 3887 205
4 2724 2724 151
5 3667 3667 166
26 | P a g e
In-Home Home Health Agency Calculations
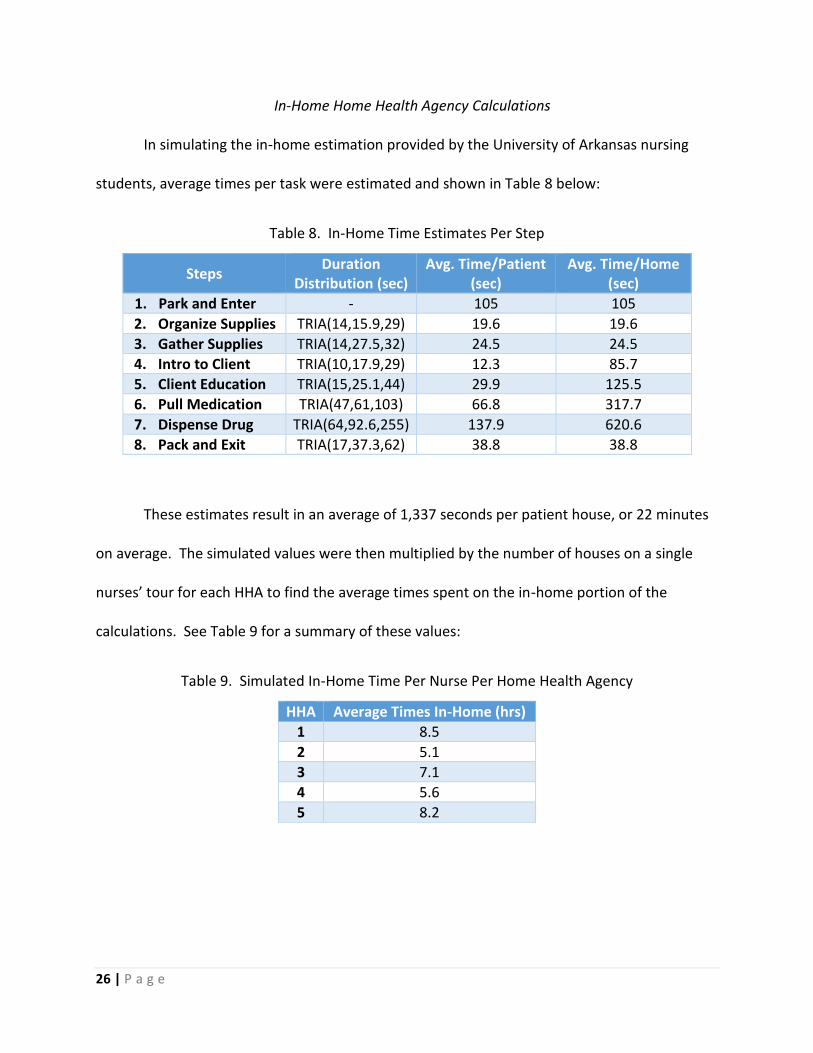
In simulating the in-home estimation provided by the University of Arkansas nursing
students, average times per task were estimated and shown in Table 8 below:
Table 8. In-Home Time Estimates Per Step
Steps Duration
Distribution (sec) Avg. Time/Patient
(sec) Avg. Time/Home
(sec)
1. Park and Enter - 105 105
2. Organize Supplies TRIA(14,15.9,29) 19.6 19.6
3. Gather Supplies TRIA(14,27.5,32) 24.5 24.5
4. Intro to Client TRIA(10,17.9,29) 12.3 85.7
5. Client Education TRIA(15,25.1,44) 29.9 125.5
6. Pull Medication TRIA(47,61,103) 66.8 317.7
7. Dispense Drug TRIA(64,92.6,255) 137.9 620.6
8. Pack and Exit TRIA(17,37.3,62) 38.8 38.8
These estimates result in an average of 1,337 seconds per patient house, or 22 minutes
on average. The simulated values were then multiplied by the number of houses on a single
nurses’ tour for each HHA to find the average times spent on the in-home portion of the
calculations. See Table 9 for a summary of these values:
Table 9. Simulated In-Home Time Per Nurse Per Home Health Agency
HHA Average Times In-Home (hrs)
1 8.5
2 5.1
3 7.1
4 5.6
5 8.2

27 | P a g e
In-Transit Home Health Agency Calculations
In simulating the in-transit estimations optimistic and pessimistic route lengths for each
major HHA in the case study area, Beardwood’s formula in Equation 1 was utilized as
demonstrated in Table 10 below. Note that N is used to incorporate the beginning and end
point of a nurse’s route). This table also consists of the optimistic and pessimistic transit times
for each nurse, calculated by multiplying distance by an assumed 30mph average speed.
Table 10. Transit Times Per Nurse Per HHA
HHA Optimistic Area, 𝑨𝑶
Pessimistic Area, 𝑨𝒑
N (homes visited + 1)
Optimistic Miles Driven
Per Nurse
Pessimistic Miles Driven
Per Nurse
Optimistic Time in Transit Per Nurse (hrs)
Pessimistic Time in Transit Per Nurse (hrs)
1 180 2796 24 47.5 186.9 1.6 6.2
2 52 1353 15 20.2 102.8 0.7 3.4
3 205 3887 20 46.1 201.1 1.5 6.7
4 151 2724 16 35.5 150.6 1.2 5.0
5 166 3667 23 44.6 209.5 1.5 7.0
Combining In-Home and In-Transit Home Health Agency Calculations
To find the total time commitments of each HHA in optimistic and pessimistic scenarios,
the in-home and the in-transit portions of the research were summed and can be found in
Table 11 below:
Table 11. Total Average Times Per Nurse Per Home Health Agency
HHA Average Time In-Home (hrs)
Optimistic Time in Transit (hrs)
Pessimistic Time in Transit (hrs)
Optimistic Total Time, on Avg. (hrs)
Pessimistic Total Time on Avg. (hrs)
1 8.5 1.6 6.2 10.1 14.7
2 5.1 0.7 3.4 5.8 8.5
3 7.1 1.5 6.7 8.6 13.8
4 5.6 1.2 5.0 6.8 10.6
5 8.2 1.5 7.0 9.7 15.2
28 | P a g e
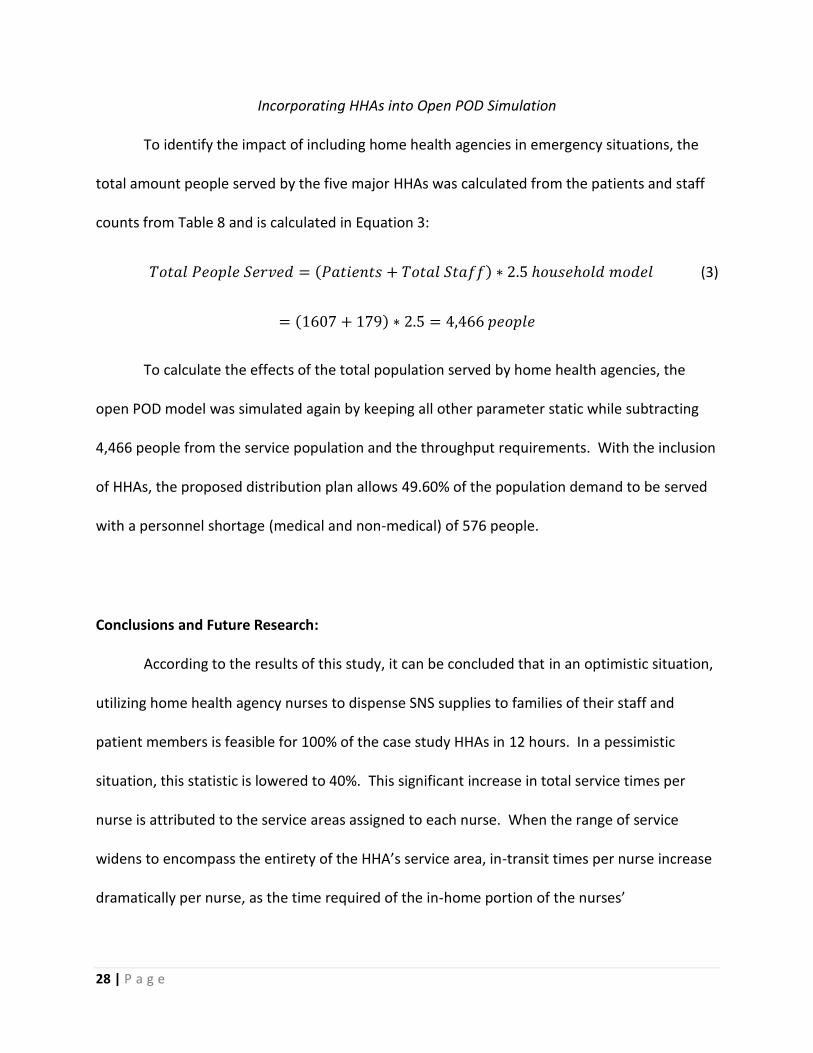
Incorporating HHAs into Open POD Simulation
To identify the impact of including home health agencies in emergency situations, the
total amount people served by the five major HHAs was calculated from the patients and staff
counts from Table 8 and is calculated in Equation 3:
𝑇𝑜𝑡𝑎𝑙 𝑃𝑒𝑜𝑝𝑙𝑒 𝑆𝑒𝑟𝑣𝑒𝑑 = (𝑃𝑎𝑡𝑖𝑒𝑛𝑡𝑠 + 𝑇𝑜𝑡𝑎𝑙 𝑆𝑡𝑎𝑓𝑓) ∗ 2.5 ℎ𝑜𝑢𝑠𝑒ℎ𝑜𝑙𝑑 𝑚𝑜𝑑𝑒𝑙 (3)
= (1607 + 179) ∗ 2.5 = 4,466 𝑝𝑒𝑜𝑝𝑙𝑒
To calculate the effects of the total population served by home health agencies, the
open POD model was simulated again by keeping all other parameter static while subtracting
4,466 people from the service population and the throughput requirements. With the inclusion
of HHAs, the proposed distribution plan allows 49.60% of the population demand to be served
with a personnel shortage (medical and non-medical) of 576 people.
Conclusions and Future Research:
According to the results of this study, it can be concluded that in an optimistic situation,
utilizing home health agency nurses to dispense SNS supplies to families of their staff and
patient members is feasible for 100% of the case study HHAs in 12 hours. In a pessimistic
situation, this statistic is lowered to 40%. This significant increase in total service times per
nurse is attributed to the service areas assigned to each nurse. When the range of service
widens to encompass the entirety of the HHA’s service area, in-transit times per nurse increase
dramatically per nurse, as the time required of the in-home portion of the nurses’

29 | P a g e
responsibilities will remain relatively static among average households. Demonstrations of
these results are displayed graphically in Figures 10a and 10b below:
Figure 10. [a] Optimistic and [b] Pessimistic In-Home and In-Transit Times
To ensure the success of home health agency nurses within a normal shift time of 12
hours, collaboration between home health agencies within the specified service area should be
pursued ahead of time. In fact, a recommended extension of this research concerns the
optimization of this service area designation such that specific areas may be assigned to
individual nurses as a part of the emergency preparation plan. In optimizing these service areas
ahead of time, the in-transit times associated with each nurse may in turn be approximated,
and nurses with completed routes may be reallocated as resources for the case study area’s
open PODs for the duration of their shifts, allowing for increased access to service for the
population.
As mentioned earlier, two metrics were considered when determining the direct impact
of this research on the area’s emergency preparedness: population demand to be served and
personnel shortage. By including home health agencies in the distribution of SNS supplies in
0
2
4
6
8
10
12
14
16
1 2 3 4 5
Tim
e (h
ou
rs)
Home Health Agency
Optimistic In Home vs In Transit Time
In Home In Transit
0
2
4
6
8
10
12
14
16
1 2 3 4 5
Tim
e (h
ou
rs)
Home Health Agency
Pessimistic In Home vs In Transit Time
In Home In Transit
30 | P a g e
emergency situations, the population served increases by 2.4% from 47.2% to 49.6% and the
personnel shortage (both medical and non-medical) decreases by 16 people from 592 to 576.
An additional asset of this inclusion involves increasing access to medical aid for the vulnerable,
homebound population of the area in question. Therefore, it must be concluded that an
inclusion of home health agencies in the emergency preparedness of the state has the potential
to positively impact the effectiveness of its plan in times of emergency.
31 | P a g e
References:
[1] Aaby, K., Herrmann, J. W., Jordan, C. S., Treadwell, M., & Wood, K. (2006). Montgomery
County’s Public Health Service Uses Operations Research to Plan Emergency Mass Dispensing
and Vaccination Clinics. Interfaces, 36(6), 569-579. doi:10.1287/inte.1060.0229
[2] Archived Datasets | Data.Medicare.gov. (2017). Retrieved December 23, 2017, from
https://data.medicare.gov/data/archives/home-health-compare
[3] Aweather. "Points of Distribution Instructional Overview." Welcome to the Community
Points of Distribution Instructional Overview (n.d.): n. pag. Federal Emergency Management
Agency. Web. 13 Sept. 2016. <https://training.fema.gov/emiweb/is/is26/pod_transcript.pdf>.
[4] Beardwood,J., Halton,J.H., & Hammersley, J.M. (1959). The shortest path through many
points. In Mathematical proceedings of the Cambridge Philosophical Society (Vol. 55), pp. 299 –
327). Cambridge University Press.
[5] Çavdar, B., & Sokol, J. (2015). A distribution-free TSP tour length estimation model for
random graphs. European Journal of Operational Research, 243(2), 588-598.
doi:10.1016/j.ejor.2014.12.020
[6] Census 2010 ZIP Code ZCTA Demographic Profile Dataset. (2017). Retrieved December 23,
2017, from http://proximityone.com/cen2010_zcta_dp.htm
[7] "Emergency Use Authorization Toolkit." Strategic National Stockpile Fact Sheet. Association
of State and Territorial Health Officials, 2016. Web. 13 Sept. 2016.
[8] Fone, D., Hollinghurst, S., Temple, M., Round, A., Lester, N., Weightman, A., . . . Palmer, S.
(2003, December 25). Management of queues in out-patient departments: the use of computer
simulation. Retrieved February 13, 2017, from
https://www.ncbi.nlm.nih.gov/pubmed/10538033,14747592/
[9] Giovachino, M., Calhoun, T., Carey, N., Coleman, B., Gonzalez, G., Hardeman, B., & Mccue, B.
(2005). Optimizing a District of Columbia Strategic National Stockpile Dispensing Center. Journal
of Public Health Management and Practice,11(4), 282-290. doi:10.1097/00124784-200507000-
00004
[10] "HHAs." Home Health Providers. Centers for Medicare and Medicaid Services, n.d. Web. 21
Sept. 2016.
[11] Hupert, N., Mushlin, A. I., & Callahan, M. A. (2002). Modeling the Public Health Response to
Bioterrorism: Using Discrete Event Simulation to Design Antibiotic Distribution Centers. Medical
Decision Making, 22(1_suppl), 17-25. doi:10.1177/027298902237709
32 | P a g e
[12] Kennedy, Bobby. "Developing Your Closed Point of Dispensing (POD) Guidance Manual." 3-
5-09 Closed POD Overview (n.d.): n. pag. Mecklenburg County Department of Health, 5 Mar.
2009. Web. 24 Sept. 2016.
[13] Lee, E. K., Chen, C., Pietz, F., & Benecke, B. (2009). Modeling and Optimizing the Public-
Health Infrastructure for Emergency Response. Interfaces, 39(5), 476-490.
doi:10.1287/inte.1090.0463
[14] Lee, E. (2016). Overview of RealOpt@ Software Enterprise. Retrieved November 27, 2017,
from http://www2.isye.gatech.edu/medicalor/realopt/research.php
[15] Nelson, C., Parker, A., Shelton, S. R., Chan, E., & Pillemer, F. (2012, March 27). Analysis of
the Cities Readiness Initiative. Retrieved January 17, 2018, from
https://www.rand.org/pubs/technical_reports/TR1200.html
[16] Strategic National Stockpile. (2017, November 3). Retrieved January 17, 2018, from
http://www.alabamapublichealth.gov/cep/sns.html
[17] Strategic National Stockpile. (2018). Retrieved January 17, 2018, from
https://dhhr.wv.gov/healthprep/programs/SNS/Pages/default.aspx
[18] "Strategic National Stockpile (SNS) ." ADH: Strategic National Stockpile. Arkansas
Department of Health, 2011. Web. 21 Sept. 2016.
[19] "Strategic National Stockpile (SNS)." Centers for Disease Control and Prevention. Centers
for Disease Control and Prevention, 17 June 2016. Web. 13 Sept. 2016.
[20] Strategic National Stockpile Transportation Security Plan Tested in North Georgia. (2015,
January 20). Retrieved January 17, 2018, from https://dph.georgia.gov/blog/2015-01-
20/strategic-national-stockpile-transportation-security-plan-tested-north-georgia
[21] Stroud, Clare. Current Dispensing Strategies for Medical Countermeasures for Anthrax. U.S.
National Library of Medicine
[22] The Strategic National Stockpile: Origin, Policy Foundations, and Federal Context. (2016,
October 24). Retrieved January 17, 2018, from
https://www.ncbi.nlm.nih.gov/books/NBK396378/
[23] Traveling Salesman Problem | Optimization | Google Developers. (2017, November 10).
Retrieved December 21, 2017, from
https://developers.google.com/optimization/routing/tsp/tsp