Embed Size (px)
Citation preview
Nathan Barrett, Tulane UniversityAndrew McEachin, RAND Corporation
Jonathan N. Mills, University of ArkansasJon Valant, Brookings Institution
Updated January 4, 2018Published November 20, 2017
Education Research Alliance NOLA.org
Technical Report
DISPARITIES IN STUDENT DISCIPLINE BY
RACE AND FAMILY INCOME
Barrett, McEachin, Mills, & Valant 1
Disparities in Student Discipline by Race and Family Income
Nathan Barrett Tulane University
Andrew McEachin RAND Corporation
Jonathan Mills
University of Arkansas
Jon Valant Brookings Institution
Abstract
This study explores student discipline disparities by race (black/white) and family income. First,
we decompose gaps across districts, across schools in the same district, and within schools.
Second, we assess disparities using regression models. Third, we examine punishments for fights
between black and white or poor and non-poor students. We find that black and poor students are
disciplined more often and harshly than their peers, with disparities arising across districts,
across schools, and within schools. Moreover, black students receive slightly longer suspensions
after interracial fights (controlling for discipline histories and background characteristics),
suggesting at least some degree of intentional discrimination.
Acknowledgements: This study was supported by funders of the Education Research Alliance for New Orleans at Tulane University: the John and Laura Arnold Foundation, William T. Grant Foundation, Spencer Foundation and, at Tulane, the Department of Economics, Murphy Institute, and School of Liberal Arts. The Louisiana Department of Education provided data and assistance. We thank Kaitlin Anderson, F. Chris Curran, Douglas Harris, Sara Slaughter, and Matthew Steinberg for their thoughtful comments. We also thank participants at the AEFP and APPAM annual meetings as well as seminar participants at Lafayette College, Tulane University, and the University of Southern California.
Barrett, McEachin, Mills, & Valant 2
I. Introduction
In the United States, students of color are suspended and expelled from school at higher
rates than white students. The U.S. Department of Education’s Office for Civil Rights (2016)
reports that, compared to white children, black children are 3.6 times more likely to receive an
out-of-school suspension in preschool, 3.8 times more likely to receive an out-of-school
suspension in grades K-12, and 2.2 times more likely to be referred to law enforcement or
subject to a school-related arrest. Among K-12 students, 18% of black boys and 10% of black
girls received an out-of-school suspension in 2013-14, compared to only 5% of white boys and
2% of white girls. Although the Office for Civil Rights does not release similar comparisons for
poor and non-poor students nationwide, researchers have observed higher suspension rates for
Arkansas students from low-income families than their peers (Anderson & Ritter, 2017) and
found that black students who attend high-poverty schools are suspended at higher rates than
black students who attend other schools (Loveless, 2017).
These gaps are among the most discussed and disputed topics in education policy today.
The Obama administration issued a “Dear Colleague” letter in January 2014 that outlines the
federal laws prohibiting discrimination in school discipline, provides examples of both
intentional discrimination (e.g., a school issuing unequal punishments to “similarly situated”
students of different races who get into a fight) and disparate impact (e.g., a facially neutral
school uniform policy that adversely impact students of a particular race), and describes
remedies for violations (U.S. Department of Justice & U.S. Department of Education, 2014). The
letter has become a topic of fierce debate. Much of that debate focuses on the evidence, or lack
thereof, that differences in suspension rates reflect discriminatory practices. Researchers have
found evidence of discrimination in many aspects of American life, including employee hiring

Barrett, McEachin, Mills, & Valant 3
(Lavergne & Mullainathan, 2004), criminal justice (Park, 2017), mortgage lending (Munnell et
al., 1996), peer-to-peer lending (Pope & Sydnor, 2011), and medical care (Schulman et al.,
1999). However, evidence of intentional discrimination in student punishment by race or family
income remains elusive. This is true despite documentation of markedly different punishment
patterns by race, family income, and gender (e.g., Skiba et al., 2012) and evidence that school
leaders’ incentives affect how severely they punish high-performing and low-performing
students (Figlio, 2006).
Fundamental questions about discipline gaps remain, partly because identifying the
causes of these disparities is empirically challenging. Gaps could arise from actual differences in
student behaviors across groups, differences in how schools respond to the same behaviors from
different groups, or a combination of the two. Ideally, researchers would be able to observe the
true behaviors of many students, observe whether and how schools punish those behaviors, and
then assess whether schools treat students of different backgrounds similarly. Unfortunately, this
type of analysis is not feasible at a large scale using conventional data, which tend to include
information about infractions but not behaviors.
What is possible, however, is a careful examination of where disparities arise, along with
a targeted look at whether disparities appear where the likeliest explanation is intentional
discrimination. For example, do gaps arise within schools, across schools in the same district, or
across districts? To what extent do observably similar student behaviors give rise to disparate
punishments? Answers to these questions would help to diagnose the causes of discipline gaps
and identify their solutions. If the gaps arise from true differences in students’ behaviors, then
eliminating gaps might require addressing the root causes of student misbehavior, whether inside
or outside of schools. If gaps arise within schools that punish black and poor students more
Barrett, McEachin, Mills, & Valant 4
harshly than other students for similar behaviors, then eliminating gaps might require oversight
and training of school staff. If, however, gaps arise across schools or districts (due to harsher
discipline practices in schools with higher proportions of black or poor students), policymakers
might need to compel certain schools to adopt less punitive practices.
This study uses statewide, student-level data from Louisiana from the 2000-01 through
2013-14 school years to examine gaps in exclusionary discipline between black and white
students and between poor and non-poor students.1 We define students’ poverty status by their
eligibility for free or reduced-price lunch (FRPL).2 These data enable us to explore, within and
across schools, whether schools punish black and poor students more often and more harshly
than they punish white and non-poor students. Furthermore, the data distinguish between
potentially violent or harmful infractions (such as possessing a weapon) and seemingly
nonviolent infractions (such as disrespecting authority), which provides an opportunity to assess
what types of offenses lead to students missing school and developing records of misbehavior.
This paper focuses on three sets of analyses. First, we decompose raw, black/white and
poor/non-poor gaps in discipline into across-district, across-school-within-district, and within-
school components. Second, to examine possible explanations for these gaps, we estimate the
conditional probabilities of various discipline outcomes by race and poverty status, controlling
for observable student characteristics, details about the infraction, and various combinations of
school, grade, and year fixed effects. Third, to assess whether schools treat students of different
backgrounds similarly, we test for gaps in a context in which gaps seemingly should not arise if
not for discriminatory school practices: fights between black and white or poor and non-poor
students with similar prior discipline records and background characteristics.
Barrett, McEachin, Mills, & Valant 5
Our findings reveal clear patterns in exclusionary discipline by race and poverty status.
First, large discipline gaps exist. Black students account for 46% of the student population during
this period but 64% of the student suspensions, while poor students account for 62% of the
population but 74% of the suspensions. These disparities are the product of substantial within-
school and across-school gaps in discipline. Within a regression framework, being black and
poor are consistently significant predictors of several discipline outcomes—being suspended,
being suspended multiple times in the same year, and length of suspension in days—even in
models with rich sets of covariates and fixed effects. Among those with no prior suspensions,
black and poor students are more likely than their peers to be suspended for both a nonviolent
infraction and a violent infraction, although suspensions for nonviolent infractions are more
common. Finally, when black and white students with similar discipline records fight each other,
black students tend to receive slightly longer suspensions. This finding, which is robust to
numerous model and sample specifications, suggests at least some degree of intentional
discrimination towards black students.
The paper proceeds with a description of the existing research on student discipline gaps.
We then describe our data, methods, and results, before concluding with discussion of the
study’s implications for diagnosing and addressing these gaps.
II. Background on Discipline Gaps
A. The Incidence and Effects of Exclusionary Discipline
Concerns about the overuse of exclusionary disciplinary practices have persisted for
decades, along with concerns that the practices disproportionately affect certain populations. The
Children’s Defense Fund (1974, 1975) released reports in the mid-1970s with profiles of
suspended and expelled students, noting that the suspension rate for black children was twice as
Barrett, McEachin, Mills, & Valant 6
high as the rate for any other group and that many of those suspensions were imposed for non-
dangerous, nonviolent infractions. More recently, in the summer of 2011, the U.S. Departments
of Education and Justice announced a collaborative project, the Supportive School Discipline
Initiative, that would “support the use of school discipline practices that foster safe, supportive,
and productive learning environments while keeping students in school” (U.S. Department of
Education, 2016). They reported that of the 49 million students enrolled in public schools in
2011-12, 3.5 million received an in-school suspension, 3.45 million received an out-of-school
suspension, and 130,000 were expelled. Suspension and expulsion rates, according to their
analysis, were three times higher for black students than white students.3
Many states and districts have responded to the heightened attention to discipline gaps—
and clarification of the related Federal laws—by limiting, postponing, or outright banning
exclusionary discipline practices (Anderson & Ritter, 2017). Steinberg and Lacoe (2017)
reported that 22 states and the District of Columbia had revised their laws as of May 2015 to
deemphasize exclusionary discipline, while 23 of the largest 100 school districts have required
non-punitive discipline strategies or limits to the use of suspension. They noted evidence in U.S.
Department of Education data of a recent decline in the rates of exclusionary discipline from
2006 to 2011. Such a decline is evident in California, which has emphasized reducing
suspensions for relatively minor “disruption” or “willful defiance” incidents that account for a
large portion of the gap in black and white suspension rates (Losen, Martinez, & Okelola, 2014;
Loveless, 2017). A recent study of student discipline in Maryland also shows exclusionary
discipline rates declining across student racial categories, although large black/white discipline
gaps remain (Porowski, O’Conner, & Passa, 2014).

Barrett, McEachin, Mills, & Valant 7
Experts have seen these rates, and the associated gaps between student subgroups, as
problematic in part because of the associations between exclusionary discipline and negative
outcomes for students. Being suspended from school is correlated with lower academic
achievement (Arcia, 2006; Beck & Muschkin, 2012; Raffaele Mendez, Knoff, & Ferron, 2002;
Raffaele Mendez, 2003; Skiba & Rausch, 2004), lower probability of on-time graduation
(Ekstrom, Goertz, Pollack, & Rock, 1986; Raffaele Mendez, 2003; Suh, Suh, & Houston, 2007;
Wehlage & Rutter, 1986), and greater contact with the juvenile justice system via the “school-to-
prison pipeline” (Morgan, Salomon, Plotkin, & Cohen, 2014; Fabelo et al., 2011; Nicholson-
Crotty, Birchmeier, & Valentine, 2009; Skiba, Arredondo, & Williams, 2014). These
relationships are largely correlational, leaving unanswered questions about whether suspended
students’ outcomes would have been better had they not been suspended or expelled (Steinberg
& Lacoe, 2017). Yet the lack of causal evidence does not mean that causal relationships do not
exist, and there is an intuitive argument that students are more likely to learn when they are
present in school.4
B. Possible Explanations for Gaps
While certain groups of students are suspended and expelled at higher rates than their
peers, basic questions about the causes of those gaps remain unanswered. Understanding gaps in
student discipline requires attention to student behaviors, infractions, and punishments, and the
relationships between them. We refer to behaviors as what students do in school, infractions as
behaviors that schools document as misconduct, and punishments as the penalties associated with
those infractions. In this context, discipline gaps could arise through some combination of three
basic pathways. First, there could be actual differences in the behaviors of black or poor students
and their peers. Second, there could be differences in the ways that schools translate behaviors to

Barrett, McEachin, Mills, & Valant 8
infractions for black and poor students relative to their peers (e.g., if schools more commonly
write up black students for the same behaviors). Third, there could be differences by race and
income in the ways that schools translate infractions to punishments (e.g., if schools suspend
black students for more days than white students for similar infractions).
The first possible explanation for discipline gaps—not exclusive of the others—is that
students of different races and family incomes simply behave differently from one another.
These differences, if they exist, could arise within schools (if poor and minority students behave
differently from their schoolmates) or across schools (if students in schools with higher
proportions of black or poor students behave differently from students in other schools).
Discipline gaps that arise from true differences in behaviors may not be attributable to
discriminatory practices by schools. If, for example, black and white students are suspended at
different rates or lengths of time but those differences are proportionate to these groups’ actual
rates and severity of misbehavior, then schools might be responding in nondiscriminatory ways
to the behaviors they observe. Of course, this exonerates neither schools nor broader societal
forces from contributing to varying levels of misbehavior. School culture can affect student
behavior, perhaps especially for poor and minority students (Haynes, Emmons, & Ben-Avie,
1997), and black and poor students might behave differently from their peers due to their
disproportionate experiences with poverty and the challenges that accompany it. This includes
challenges related to physical health (Chen, 2004), stress and anxiety (Bradley & Corwyn, 2002),
exposure to violence (Gorman-Smith & Tolan, 1998), and varying norms and home
environments (Leventhal & Brooks-Gunn, 2000). A review of the related literature by Gregory,
Skiba, and Noguera (2010) concluded that poverty-related factors likely account for part of the
discipline gaps observed but that black/white gaps often persist after controlling for

Barrett, McEachin, Mills, & Valant 9
socioeconomic status (SES). These black/white differences among students of similar SES might
reflect actual differences in behaviors, with a variety of possible explanations that include
cultural mismatches between students and teachers (Monroe, 2005), perceived pressures to “act
white” (Fordham & Ogbu, 1986; Fryer, 2006), or students’ reactions to other forms of bias in
schools (Gershenson, Holt, & Papageorge, 2016). True behavior differences are hard to identify
empirically, since researchers seldom have data on students’ actual behaviors beyond whether
schools recorded those behaviors as infractions.
A second explanation for discipline gaps is that schools might translate behaviors to
infractions differently for students of different races or family income. Whether a student is
referred to the office for punishment depends on both the student’s behavior and the educator’s
perception of, or tolerance for, that behavior (Skiba & Williams, 2014). If a black student and
white student engage in the same behaviors, the black student could be more likely to receive an
infraction if teachers or administrators disregard, forgive, or never notice the white student’s
misbehavior. This would be more plainly reflective of discrimination. It could arise across
schools—without any particular school or person treating different groups differently—if schools
with predominantly poor or minority students respond to misbehavior differently than other
schools. It also could arise within schools as a direct result of discriminatory behavior.
Two recent studies provide suggestive evidence. Gilliam, Maupin, Reyes, Accavitti, and
Shic (2016) asked 135 early childhood teachers to observe videos of four children—a black boy,
black girl, white boy, and white girl—to watch for “challenging behavior in the classroom,”
noting to the teachers that “sometimes this involves seeing behavior before it becomes
problematic.” The researchers selected videos with, in their view, no signs of challenging
behavior, and then tracked participants’ eye movements to see whether teachers tended to
Barrett, McEachin, Mills, & Valant 10
monitor some students more than others when looking for misbehavior. They found that teachers
focused a disproportionate share of their time gazing at black children, and particularly black
boys. They accompanied this task with a vignette experiment to test whether teachers’ attitudes
differed toward students with stereotypically black and white names. They found that teachers
rated white students’ misbehavior as more severe, which they interpreted as consistent with a
“shifting standards” hypothesis (Biernat & Manis, 1994). They found no relationship between
the children’s race and whether teachers thought they should be suspended or expelled.
Okonofua and Eberhardt (2015) experimented with names in a similar context. With a group of
K-12 teachers as study participants, they described students who had misbehaved twice,
randomly assigning participants to see either stereotypically black or white student names. They
found that teachers felt more troubled by black students’ misbehaviors and were more inclined to
regard the black students as troublemakers. A second experiment, designed similarly to the first,
showed that teachers were more likely to see themselves suspending the black students in the
future.
If, as these studies suggest, teachers monitor and assess similar-behaving black and white
students in their classrooms differently, we might expect within-school racial gaps in how
schools translate behaviors to infractions. At the same time, across-school gaps could arise if
schools with higher proportions of black students tend to write up students for behaviors that
would not yield write-ups in other schools. An assortment of theories and findings support this
possibility. Welch and Payne (2010) looked to schools to test the “racial threat” theory (Blalock,
1967) that authorities use more aggressive forms of control in settings with higher proportions of
blacks relative to whites. Using survey responses from 294 public middle and high schools, they
found that leaders of schools with higher proportions of black students reported being more

Barrett, McEachin, Mills, & Valant 11
likely to use punitive and extremely punitive discipline, with those differences persisting even
after controlling for an assortment of school characteristics.5 This stricter enforcement in schools
with higher proportions of black students seems consistent with a trend toward “no excuses”
philosophies in urban schools (Thernstrom & Thernstrom, 2004). It is also consistent with
findings that black/white gaps in office referrals often arise not from severe or objectively clear
misbehaviors but rather from behaviors like loitering and disrespectful conduct that are more
subject to the discretion of school officials (Shaw & Braden, 1990; Skiba et al., 2002).
Anderson and Ritter (2017) used longitudinal, student-level infraction data from
Arkansas to study exclusionary discipline gaps within and across schools. The authors
conditioned their analysis on a sample of students who were referred to the principal’s office for
a behavioral infraction. Discipline outcomes were coded either exclusionary (i.e., expulsion or
out-of-school suspension) or inclusionary/no discipline (i.e., in-school suspension or no
discipline). Using logistic regression models that controlled for student and infraction
characteristics (but omitted school fixed effects), they found that black students are
approximately 2.4 times as likely as white students—and FRPL-eligible students are 1.2 to 1.5
times as likely as non-FRPL students—to receive exclusionary discipline. While the FRPL
results persisted in models with school fixed effects, the race results did not, leading them to
conclude that the key driver of black/white discipline gaps was likely related to differences in the
types of schools that black and white students attend. There are two notable differences between
the authors’ work and the current analysis. First, we focus on in-school and out-of-school
suspensions as forms of discipline that remove students from their typical educational settings
(disregarding distinctions in the location of that suspension). Second, we use a decomposition
approach to explore the origins of discipline disparities. As this paper shows, comparisons of
Barrett, McEachin, Mills, & Valant 12
regression models with and without school fixed effects can yield misleading impressions of the
relative balance of within-school and across-school sources of the gaps. The addition of school
fixed effects leads to students in relatively (or fully) segregated schools receiving little (or no)
weight in the resulting analyses. This makes comparisons to models without school fixed effects
difficult to interpret, as highly segregated schools play an important part in understanding across-
school gaps.6
A third possible explanation for discipline gaps is that schools translate the same
infractions to more severe punishments for black and poor students than their peers. For
example, black and white students might both receive write-ups for chronic tardiness, but gaps
would arise if schools punish black students more severely for that infraction. This type of gap
also would suggest intentional discrimination, whether as a product of different treatment within
schools or across them.
Similar to Anderson and Ritter (2017), Kinsler (2011) estimated differential referral rates
for behavioral infractions, as well as the occurrence and length of North Carolina students’
suspensions by race, using school fixed effects and indicators for infraction types. He found that
black students were more likely to be referred to administrators for behavioral infractions, but
once students were referred to the administrators, schools treated black and white students
similarly for similar infractions, with most variation in discipline arising across schools.
However, as noted previously, comparing within-school and between-school sources of
discipline gaps in this context relies on potentially misleading comparisons of models with and
without school fixed effects. Skiba et al. (2014) used hierarchical linear models to test the
relationships between exclusionary discipline and the characteristics of infractions, student
demographics, and schools in a Midwestern state. They found that variables at each level were
Barrett, McEachin, Mills, & Valant 13
independently predictive of students’ likelihood of being suspended. However, school-level
variables explained a large part of the racial gaps in exclusionary discipline, rendering the
contributions of infraction and student characteristics statistically insignificant.
Although recent attention to discipline gaps has generated more and better evidence about
the origins of race- and income-based gaps in exclusionary discipline, there remains much to
learn. This study contributes to this literature in several ways. First, perhaps the most elusive
question in researching student discipline gaps is whether schools discriminate by punishing
black and white or poor and non-poor students differently for the same behaviors. Using rich
student-level discipline data from Louisiana, we can isolate punishments from infractions that
seemingly should not generate gaps: fights between black and white, and poor and non-poor,
students with similar prior discipline records. Second, we decompose discipline gaps into their
within-school, across-school (within-district), and across-district components. In doing so, we
show why comparing regression models with and without school fixed effects to infer about the
relative within-school and between-school components of these gaps can yield misleading
interpretations. Third, we use regression models to add nuance to our understanding of these
gaps and to explore questions of policy interest (e.g., disaggregating suspensions for violent and
nonviolent suspensions and considering students who develop records of repeated suspensions).7
Fourth, by focusing on gaps in the southern state of Louisiana, we illuminate the race and class
dynamics of student discipline in a state with large populations of black and poor students and a
long history of problems where race, class, and schools collide (Egalite, Mills, & Wolf, 2017).
III. Data
This study uses data provided by the Louisiana Department of Education (LDOE) for the
2000-01 through 2013-14 school years. LDOE provided records for students in grades K-12 in
Barrett, McEachin, Mills, & Valant 14
Louisiana public schools, which includes both traditional public schools and charter schools.
Taken together, this provides nearly 10 million student-year observations, with approximately
1.8 million unique observations spread over 14 school years.
The LDOE data contain variables commonly found in state administrative data, including
students’ basic demographic characteristics (e.g., race, free or reduced-price lunch eligibility,
gender, and special education status), grade levels, and test scores from Louisiana’s state
assessments, which we standardized by test type, subject, year, and grade. Our free/reduced-price
lunch (FRPL) variable contains a non-missing value for each student observation, and we
generally combine students’ eligibility for free or reduced-price lunch into a single “FRPL”
category to facilitate interpretation. As shown in Table 1, approximately 55% of the sample is
eligible for free lunch and 7% is eligible for reduced-price lunch. A much higher percentage of
black students (83%) than white students (42%) in the sample is eligible for FRPL. Our race
variable contains a non-missing value for nearly all student observations. We coded that variable
into three categories: black (46% of the sample), white (48%), and other race (5%), with the
latter encompassing several racial and ethnic groups. The sample is split almost evenly between
male (51%) and female (49%) students, and approximately 12% of students have a disability and
the corresponding special education (SPED) status. SPED status is an important covariate for
studying discipline gaps by race and poverty status, since black and poor students comprise a
disproportionate share of the population of disabled students and students with disabilities are
suspended at higher rates than their peers (Losen et al., 2015). This is true despite federal rules
protecting students from punishments for behaviors caused by their disabilities.
LDOE also provided rich data on student infractions and their corresponding
punishments. The infraction variable distinguishes between 49 types of offenses that could yield

Barrett, McEachin, Mills, & Valant 15
a suspension. We coded these infractions as “violent” if they had a relatively high probability of
inflicting serious physical or emotional harm on a classmate or staff member and “nonviolent” if
they had a relatively low probability of inflicting serious harm.8
Table 1 shows large raw differences in suspension rates by race and poverty (FRPL)
status. With respect to race, 25% of black students were suspended in a given year, with 13%
suspended for a violent infraction and 19% for a nonviolent infraction (some students were
suspended for both a violent and nonviolent infraction in the same year).9 This compares to 12%
of white students suspended in a given year, with 5% suspended for a violent infraction and 9%
for a nonviolent infraction. With respect to FRPL status, 21% of poor students were suspended in
a given year (11% for a violent infraction and 16% for a nonviolent infraction), which compares
to 12% of non-poor students suspended (5% for a violent infraction and 10% for a nonviolent
infraction).
Table 2 displays the counts and percentages of these infractions statewide—and
disaggregated for black, white, poor (FRPL), and non-poor (non-FRPL) students. The nine most
common infraction types account for 92% of the recorded infractions. We grouped all other
infraction codes in an “Other” category. The most common infractions, in order, are willful
disobedience (23% of all infractions), fights in school (14%), habitually violates a rule (13%),
and disrespects authority (13%). In general, the distribution of infractions that yield suspensions
for black, white, poor, and non-poor students is similar, although relatively large proportions of
black students’ suspensions and poor students’ suspensions resulted from fights in school (16%
and 15%, respectively, compared to 10% for white and non-poor students). Approximately 29%
of black students’ suspensions and 30% of poor students’ suspensions resulted from violent
Barrett, McEachin, Mills, & Valant 16
infractions. This compares to 28% of white students’ suspensions and 26% of non-poor students’
suspensions.
Our data on punishments also include a variable showing the length, in days, of each
suspension, which we use as a measure of the punishment’s severity.10 The data show where the
suspension was administered (i.e., an in-school suspension, out-of-school suspension, or off-site
suspension), although our analyses do not distinguish based on this location. Critically for
analyzing fights involving black and white students, or poor and non-poor students, we observe
the date when each infraction occurred. To identify these interracial or inter-FRPL fights, we
flagged infractions coded as fights that occurred on the same day in the same school. Our data do
not explicitly link the students who fought one another, so we limited our sample to cases in
which only two students were disciplined for fighting on the same day: a black student and white
student (for the race analyses) or a FRPL and non-FRPL student (for the poverty analyses).11
IV. Methods
We examine discipline disparities in three ways. First, we decompose raw discipline gaps
across districts, across schools within the same district, and within schools. Second, we use an
assortment of regression models to examine the size and predictors of various types of
disparities. Third, we examine the possibility of discriminatory school practices by comparing
the punishments that result when black and white, or poor and non-poor students, get into fights
with each other.
A. Decomposing Gaps into Across-District, Across-School, and Within-School Components
We begin by breaking the average raw black/white and poor/non-poor discipline gaps
into across-district, across-school-within-district, and within-school components. We do so for
two discipline outcomes: whether students were suspended and for how many days they were
Barrett, McEachin, Mills, & Valant 17
suspended. Decomposing the raw gaps into these three components is useful for identifying
where gaps arise and which interventions might reduce those gaps.
Specifically, we start by defining the raw average discipline rate (𝑅!"#) for a given group
of students in a given grade weighted across students, schools, and districts. Specifically, we
define 𝑅!"# as:
1 𝑅!"# =∑!∑! !"#$%!"#!!"#!∑!∑! !"#!"!"#!
,
where 𝐺𝑟𝑜𝑢𝑝!"# takes a “1” for a black (or FRPL) student, and a “0” for a white (or non-FRPL)
student, and 𝑌!"# indicates a suspension outcome for student i in school s and district d. We
define 𝑅!"# as the discipline rate for the historically non-disadvantaged group (white or non-
poor). The overall gap in suspension rates between two groups of students is simply 𝑅!"# − 𝑅!"#.
We then take an approach similar to others who have decomposed gaps related to
students’ exposure to teachers of varying experience (Clotfelter, Ladd, & Vigdor, 2005) and
performance (Goldhaber, Lavery, & Theobald, 2015) into across-district, across-school, and
within-school components. To do this, we define additional sets of suspensions rates. The first,
𝑅! and 𝑅!, replaces 𝑌!"# with the average suspension outcome in a given district, 𝑌!. Assigning
students the average suspension rate in a given district, gaps between 𝑅! and 𝑅!arise from black
and white (or poor and non-poor) students attending different districts. The second, 𝑅!" and 𝑅!",
replaces 𝑌!"# with the average suspension outcome in a given school, 𝑌!". With these two rates in
hand, we decompose the overall gap into the following components:
2 𝑅!"# − 𝑅!"# = 𝑅! − 𝑅! + 𝑅!" − 𝑅!" − 𝑅! − 𝑅! + 𝑅!"# − 𝑅!"# − 𝑅!" − 𝑅!" .
Given that 𝑅! and 𝑅!are a function of the same variable (𝑌!), any difference between these two
rates arises from black/white or poor/non-poor students attending different districts. Similarly, a

Barrett, McEachin, Mills, & Valant 18
non-zero value of 𝑅!" − 𝑅!" − 𝑅! − 𝑅! is due to black/white or poor/non-poor students
attending different schools within the same district. Finally, a non-zero value of 𝑅!"# −
𝑅!"# − 𝑅!" − 𝑅!" is due to within-school differences in suspensions for black/white or
poor/non-poor students. We present kernel density plots of these gaps by grade, as well as the
raw numerical gaps and the share of gaps explained at each level.12
B. Regression Analyses Examining Gaps
Second, we estimate linear probability and OLS regression models to more closely
examine gaps and explore questions of substantive interest. These models assess several
outcomes: whether students were suspended in a given school year; whether they were
suspended multiple times in the same school year (which might yield a record or reputation for
being a troubled student); whether a student’s first suspension of the school year was for a
violent or nonviolent infraction; length of suspension (in days) for a particular infraction; and
length of suspension for a particular infraction for a student’s first suspension of the year.
An important goal of this study is to assess whether gaps are driven by discriminatory
behaviors by adults working in schools. Our models include covariates and fixed effects to
account for the nonrandom sorting of students to schools, as well as spurious correlations
between student characteristics and the propensity to get punished. Formally, we use models of
the following form:
3 𝑌!"#$ = 𝛼! + 𝛽!𝑅𝑎𝑐𝑒!"#$ + 𝛽!𝐹𝑅𝑃𝐿!"#$ + 𝛽!𝑋!"#$ + 𝛼!"# + 𝜀!"#$ ,
where discipline outcomes for student i in grade g in school s in time t are modeled as a linear
function of race, 𝑅𝑎𝑐𝑒!"#$, with binary indicators for black and other-race students (with white
students as the reference group); FRPL status, 𝐹𝑅𝑃𝐿!"#$, with a binary indicator for qualifying
Barrett, McEachin, Mills, & Valant 19
for either free or reduced-price lunch students (with non-FRPL students as the reference group);
a vector of observable student characteristics related to race, FRPL, special education, gender,
math and English language arts (ELA) scores from the prior school year, and a set of indicator
variables for the type of infraction (in certain specifications with suspension length as an
outcome); school-grade-year (SGY) fixed effects, 𝛼!"# (or grade and year fixed effects in some
models); and an idiosyncratic error term, 𝜀!"#$. We cluster our standard errors to the school-
grade-year level.
The primary coefficients of interest across our statistical models estimate the black/white
and poor/non-poor (FRPL/non-FRPL) differences in discipline outcomes. Models with and
without additional student covariates yield notably different results. Models with these covariates
are useful for comparing discipline outcomes for students who are similar but for their race or
poverty status. However, these models might control for characteristics that are fundamental to
how a group is perceived (e.g., preventing raw comparisons of how relatively low-scoring black
students and relatively high-scoring white students are punished). Since each type of comparison
is substantively important, we include models with and without student covariates.
Students in Louisiana are not randomly assigned to schools, and prior research suggests
that a large share of the variation in differential patterns of student punishment is explained
across, rather than within, schools (Anderson & Ritter, 2017; Kinsler, 2011; Skiba et al., 2014).
In order to ensure that our analysis is not conflated by across-school differences and to build on
the extant literature, our preferred specification for estimating the presence of discipline gaps
within students’ local environments uses SGY fixed effects. Students within these cells have
more similar in-school and out-of-school experiences, and focusing on gaps within SGYs helps
to identify gaps local to a cohort of peers within a particular grade and school.

Barrett, McEachin, Mills, & Valant 20
Models with infraction fixed effects, with days of suspension as their dependent variable,
are well suited for identifying gaps in suspension length that arise from similar infractions. These
models are not necessarily well suited for identifying evidence of discriminatory school
practices. For example, if black students are suspended for more days than white students for
getting into fights, it could reflect administrators discriminating against black students.
Alternatively (or additionally), it could reflect fights involving black students being
systematically more severe than—or otherwise different from—fights involving white students.
C. Gaps from Fights between Black and White, and Poor and Non-Poor, Students
Our third methodological approach explores a very particular setting in which disparities
seem most likely to reflect discriminatory school discipline practices. We test for differences in
the length of suspensions that black and white, and poor and non-poor, students receive when
they fight each other in school. We do so while controlling for these students’ prior discipline
histories and other background characteristics. These covariates account for the possibility that
administrators might punish students differently based on their prior discipline records—and that
certain groups of students (e.g., those who have fought previously or have lower test scores)
might be more likely to instigate or escalate these fights.
The key identifying assumption is that when black and white (or poor and non-poor)
students with similar discipline records and background characteristics get into a fight at school
that results in both students receiving a fighting infraction, the black and white students’
behaviors should warrant equal punishments. The assumption would be violated if, in these very
particular circumstances, black and white students exhibit systematically different behaviors
from each other. If this assumption holds, then gaps in suspension duration arising from these
Barrett, McEachin, Mills, & Valant 21
fights are likely attributable to discriminatory behavior from schools that treat similar-behaving
black and white (or poor and non-poor) students differently.
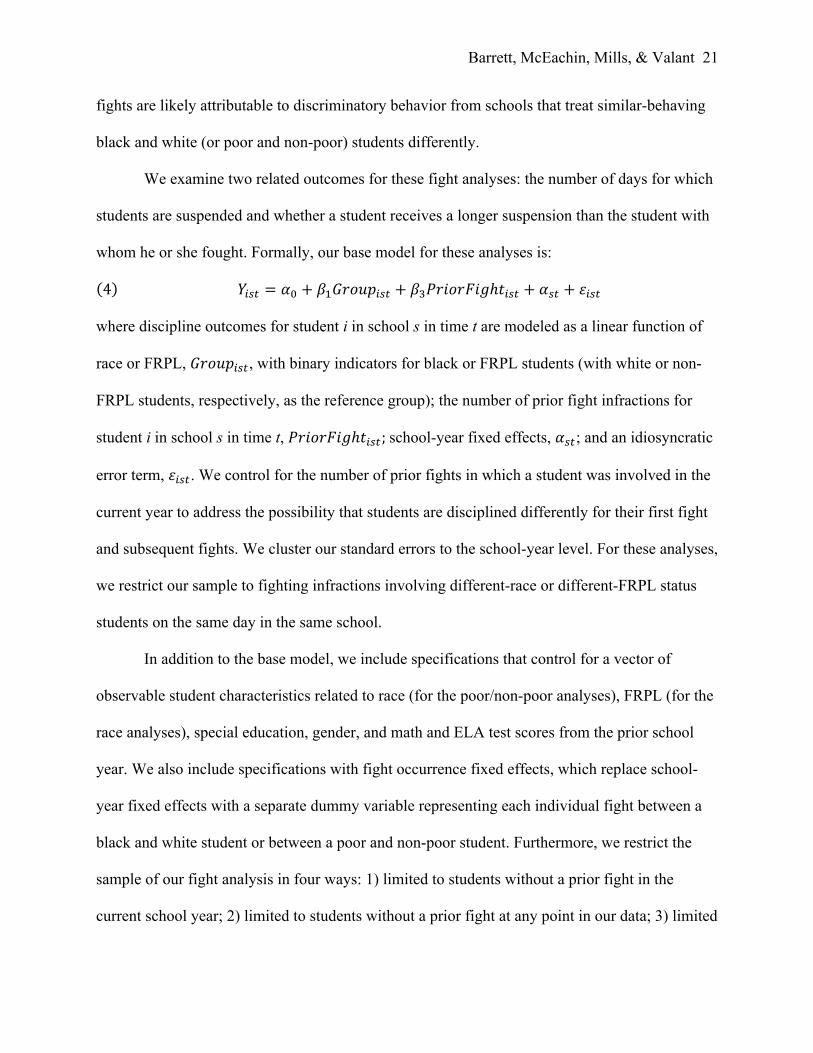
We examine two related outcomes for these fight analyses: the number of days for which
students are suspended and whether a student receives a longer suspension than the student with
whom he or she fought. Formally, our base model for these analyses is:
4 𝑌!"# = 𝛼! + 𝛽!𝐺𝑟𝑜𝑢𝑝!"# + 𝛽!𝑃𝑟𝑖𝑜𝑟𝐹𝑖𝑔ℎ𝑡!"# + 𝛼!" + 𝜀!"#
where discipline outcomes for student i in school s in time t are modeled as a linear function of
race or FRPL, 𝐺𝑟𝑜𝑢𝑝!"#, with binary indicators for black or FRPL students (with white or non-
FRPL students, respectively, as the reference group); the number of prior fight infractions for
student i in school s in time t, 𝑃𝑟𝑖𝑜𝑟𝐹𝑖𝑔ℎ𝑡!"#; school-year fixed effects, 𝛼!"; and an idiosyncratic
error term, 𝜀!"#. We control for the number of prior fights in which a student was involved in the
current year to address the possibility that students are disciplined differently for their first fight
and subsequent fights. We cluster our standard errors to the school-year level. For these analyses,
we restrict our sample to fighting infractions involving different-race or different-FRPL status
students on the same day in the same school.
In addition to the base model, we include specifications that control for a vector of
observable student characteristics related to race (for the poor/non-poor analyses), FRPL (for the
race analyses), special education, gender, and math and ELA test scores from the prior school
year. We also include specifications with fight occurrence fixed effects, which replace school-
year fixed effects with a separate dummy variable representing each individual fight between a
black and white student or between a poor and non-poor student. Furthermore, we restrict the
sample of our fight analysis in four ways: 1) limited to students without a prior fight in the
current school year; 2) limited to students without a prior fight at any point in our data; 3) limited
Barrett, McEachin, Mills, & Valant 22
to students whose first suspension in the current school year is a fight; and 4) limited to students
whose first suspension ever in our data is a fight. For all analyses with the number of suspension
days as their outcome, we censor the number of days to 20 to limit the influence of outlier (very
long) suspensions.
V. Results
A. Decomposing Gaps into Across-District, Across-School, and Within-School Components
First, we decompose gaps in two outcomes—the likelihood of getting suspended and the
number of days suspended—into across-district, across-schools-within-the-same-district, and
within-school components. We present this analysis visually in Figures 1 through 6, with the
underlying raw numbers presented in Appendix Tables A1 and A2. Figures 3 and 6 show
male/female gaps for purposes of comparison and illustration.
A few important patterns emerge from the data. The first relates to the changing size and
nature of discipline gaps across the age spectrum from kindergarten through grade 12. The
overall gap between black and white students in whether they were suspended (shaded gray
density in Figure 1) starts around 3 percentage points in kindergarten, grows to a peak of 21
percentage points in grades 6 and 7, and shrinks to 9 percentage points in grade 12. A similar
pattern appears in the poor/non-poor gaps in whether students were suspended (Figure 2) and for
the days suspended outcome (Figures 4 and 5). The larger gaps in middle school could reflect
higher rates of exclusionary discipline after students leave elementary school, with those rates
declining in high school as many struggling students drop out.
The second interesting pattern—different from patterns observed in other studies (e.g.,
Anderson & Ritter, 2017; Kinsler, 2011)—is that within-school differences account for a large
portion of the overall black/white and poor/non-poor gaps, especially in middle and high
Barrett, McEachin, Mills, & Valant 23
school.13 This is particularly the case for outcomes showing whether students were suspended.
For both the black/white and poor/non-poor comparisons, within-school differences account for
at least 50 percent of the gap in kindergarten and grades 5 through 12. Still, differences across
schools constitute an important share of the black/white and poor/non-poor gaps as well. This
stands in stark contrast to the male/female discipline gaps (Figure 3), which arise almost entirely
within schools (likely due largely to the more even balance of male and female students across
schools). With respect to the suspension length outcome (Figures 4 through 6), black/white and
poor/non-poor discipline gaps are spread more evenly across districts, across schools, and within
schools. For this outcome, too, within-school differences account for virtually all of the
male/female discipline gaps.
The relatively large within-school differences in suspension rates for black and white,
and poor and non-poor, students have important implications. They indicate that many Louisiana
students attend schools in which black and poor students are suspended at much higher rates than
white and non-poor students—and that many Louisiana administrators are suspending their black
and poor students at much higher rates than they suspend their white and non-poor students.
This, in itself, is not necessarily evidence of discrimination, as these differences in punishments
could reflect differences in behaviors. Our subsequent analyses examine this question more
closely. However, this does mean that discipline gaps are potentially evident to many students,
teachers, and administrators, and not simply a pattern that arises from differences across schools
that escape the view of those working within a single school.
B. Regression Analyses Examining Gaps
We next examine black/white and poor/non-poor discipline gaps within a regression
framework. The first three tables in this section use linear probability models (LPMs) to estimate
Barrett, McEachin, Mills, & Valant 24
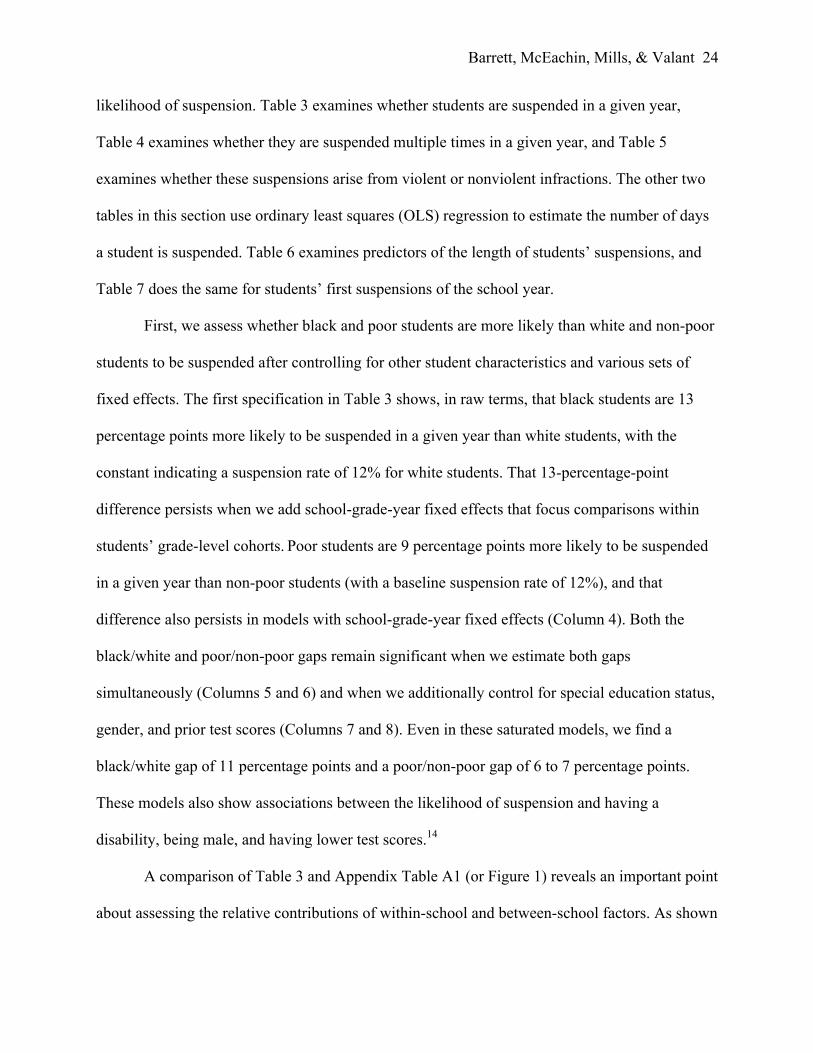
likelihood of suspension. Table 3 examines whether students are suspended in a given year,
Table 4 examines whether they are suspended multiple times in a given year, and Table 5
examines whether these suspensions arise from violent or nonviolent infractions. The other two
tables in this section use ordinary least squares (OLS) regression to estimate the number of days
a student is suspended. Table 6 examines predictors of the length of students’ suspensions, and
Table 7 does the same for students’ first suspensions of the school year.
First, we assess whether black and poor students are more likely than white and non-poor
students to be suspended after controlling for other student characteristics and various sets of
fixed effects. The first specification in Table 3 shows, in raw terms, that black students are 13
percentage points more likely to be suspended in a given year than white students, with the
constant indicating a suspension rate of 12% for white students. That 13-percentage-point
difference persists when we add school-grade-year fixed effects that focus comparisons within
students’ grade-level cohorts.Poor students are 9 percentage points more likely to be suspended
in a given year than non-poor students (with a baseline suspension rate of 12%), and that
difference also persists in models with school-grade-year fixed effects (Column 4). Both the
black/white and poor/non-poor gaps remain significant when we estimate both gaps
simultaneously (Columns 5 and 6) and when we additionally control for special education status,
gender, and prior test scores (Columns 7 and 8). Even in these saturated models, we find a
black/white gap of 11 percentage points and a poor/non-poor gap of 6 to 7 percentage points.
These models also show associations between the likelihood of suspension and having a
disability, being male, and having lower test scores.14
A comparison of Table 3 and Appendix Table A1 (or Figure 1) reveals an important point
about assessing the relative contributions of within-school and between-school factors. As shown

Barrett, McEachin, Mills, & Valant 25
in Table 3, introducing school-grade-year (SGY) fixed effects had virtually no impact on our gap
estimates. It might be tempting to compare coefficients across those models and conclude that
the gaps arose within schools, since the magnitude and significance of the estimates persisted
with SGY fixed effects. However, those comparisons can mislead. A model that regresses
suspension outcomes on race and includes SGY fixed effects will assign the greatest weight to
students in SGYs with a relatively even balance of white and black students. It will give no
weight at all to students in fully segregated SGYs, since there is no within-SGY variation in
student race. Yet these settings are particularly important for studying the source of discipline
gaps, since a potentially important driver of these gaps is the difference between predominantly
black (or poor) and predominantly white (or non-poor) schools. As a result, we do not compare,
for example, the first two columns of Table 3 for this purpose. We prefer the decomposition
method described above for assessing the relative impact of within-school, between-school
(within district), and between-district factors.15
Table 4 shows gaps in whether students receive multiple suspensions (and therefore
accrue lengthy discipline records, miss school repeatedly, and potentially acquire reputations as
troubled students). The model specifications used for this table are parallel to the specifications
from Table 3, and the results are largely parallel as well. Both with and without school-grade-
year fixed effects, we observe black/white gaps of 8 percentage points and poor/non-poor gaps of
6 percentage points in whether students receive multiple suspensions in the same year. These
compare to baseline multiple suspension rates of 6 percent for both white and non-poor students,
as indicated by the constants in Columns 1 and 4, respectively. These gaps also persist in the
presence of covariates, with similar associations evident in students’ disability status, gender,
and prior test scores.
Barrett, McEachin, Mills, & Valant 26
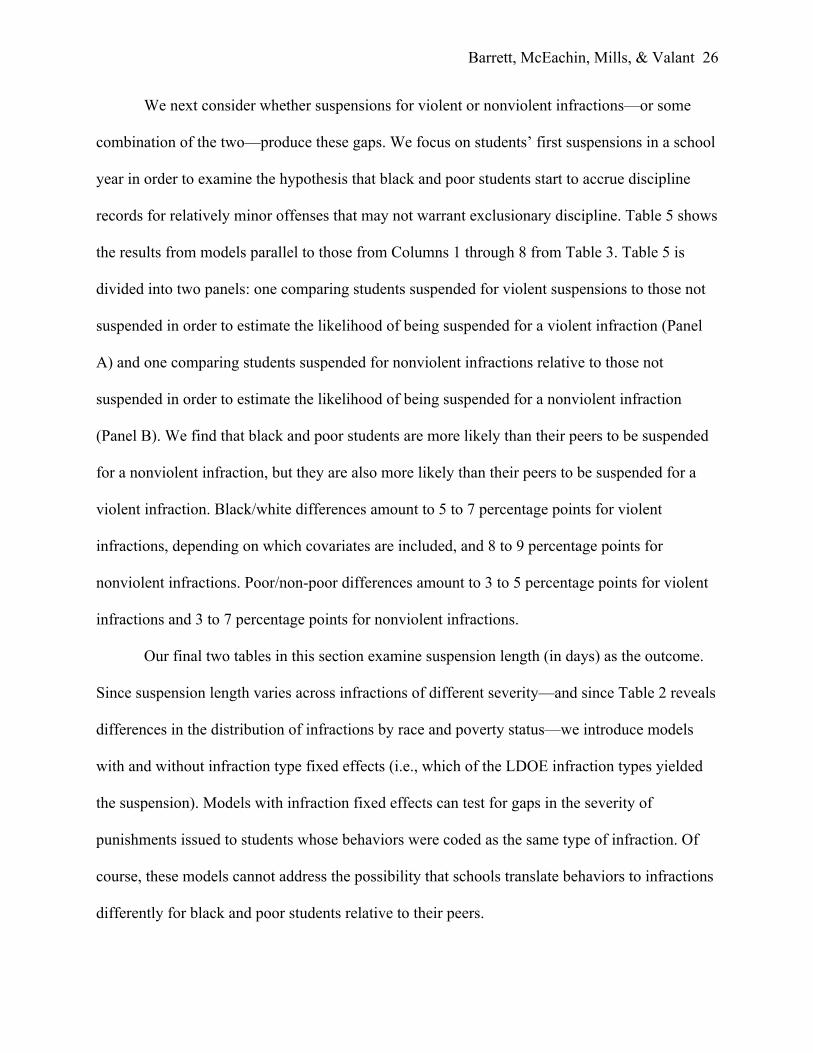
We next consider whether suspensions for violent or nonviolent infractions—or some
combination of the two—produce these gaps. We focus on students’ first suspensions in a school
year in order to examine the hypothesis that black and poor students start to accrue discipline
records for relatively minor offenses that may not warrant exclusionary discipline. Table 5 shows
the results from models parallel to those from Columns 1 through 8 from Table 3. Table 5 is
divided into two panels: one comparing students suspended for violent suspensions to those not
suspended in order to estimate the likelihood of being suspended for a violent infraction (Panel
A) and one comparing students suspended for nonviolent infractions relative to those not
suspended in order to estimate the likelihood of being suspended for a nonviolent infraction
(Panel B). We find that black and poor students are more likely than their peers to be suspended
for a nonviolent infraction, but they are also more likely than their peers to be suspended for a
violent infraction. Black/white differences amount to 5 to 7 percentage points for violent
infractions, depending on which covariates are included, and 8 to 9 percentage points for
nonviolent infractions. Poor/non-poor differences amount to 3 to 5 percentage points for violent
infractions and 3 to 7 percentage points for nonviolent infractions.
Our final two tables in this section examine suspension length (in days) as the outcome.
Since suspension length varies across infractions of different severity—and since Table 2 reveals
differences in the distribution of infractions by race and poverty status—we introduce models
with and without infraction type fixed effects (i.e., which of the LDOE infraction types yielded
the suspension). Models with infraction fixed effects can test for gaps in the severity of
punishments issued to students whose behaviors were coded as the same type of infraction. Of
course, these models cannot address the possibility that schools translate behaviors to infractions
differently for black and poor students relative to their peers.
Barrett, McEachin, Mills, & Valant 27
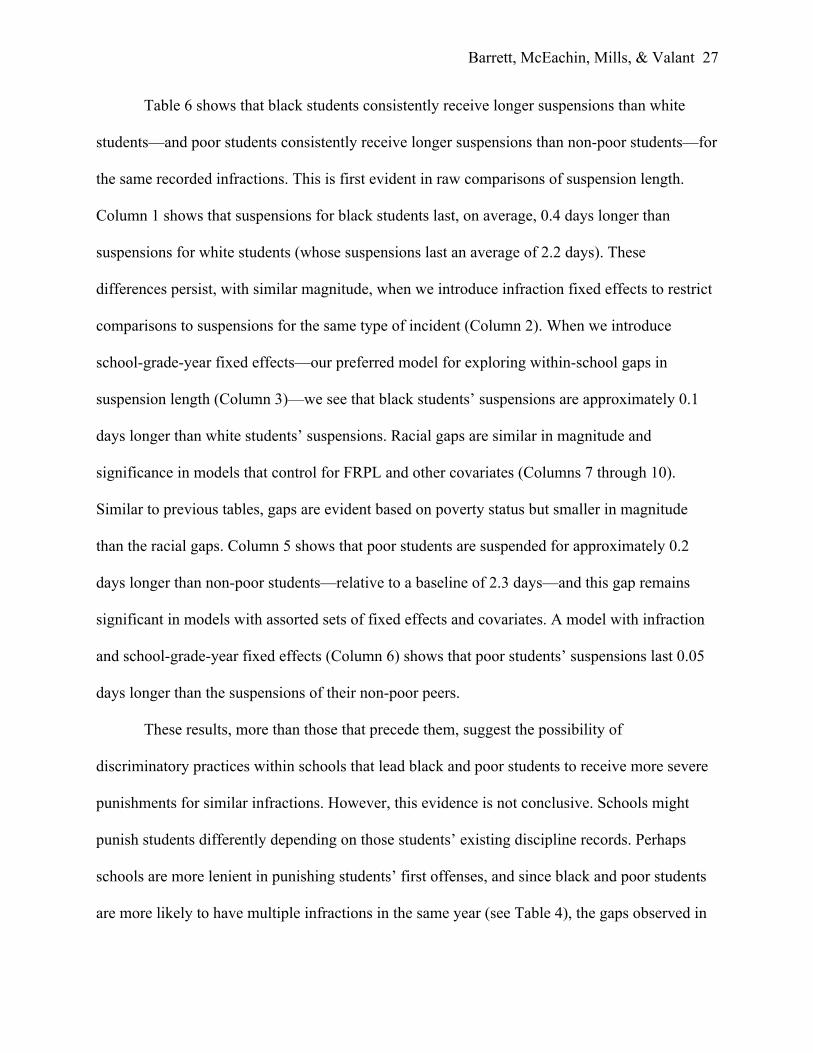
Table 6 shows that black students consistently receive longer suspensions than white
students—and poor students consistently receive longer suspensions than non-poor students—for
the same recorded infractions. This is first evident in raw comparisons of suspension length.
Column 1 shows that suspensions for black students last, on average, 0.4 days longer than
suspensions for white students (whose suspensions last an average of 2.2 days). These
differences persist, with similar magnitude, when we introduce infraction fixed effects to restrict
comparisons to suspensions for the same type of incident (Column 2). When we introduce
school-grade-year fixed effects—our preferred model for exploring within-school gaps in
suspension length (Column 3)—we see that black students’ suspensions are approximately 0.1
days longer than white students’ suspensions. Racial gaps are similar in magnitude and
significance in models that control for FRPL and other covariates (Columns 7 through 10).
Similar to previous tables, gaps are evident based on poverty status but smaller in magnitude
than the racial gaps. Column 5 shows that poor students are suspended for approximately 0.2
days longer than non-poor students—relative to a baseline of 2.3 days—and this gap remains
significant in models with assorted sets of fixed effects and covariates. A model with infraction
and school-grade-year fixed effects (Column 6) shows that poor students’ suspensions last 0.05
days longer than the suspensions of their non-poor peers.
These results, more than those that precede them, suggest the possibility of
discriminatory practices within schools that lead black and poor students to receive more severe
punishments for similar infractions. However, this evidence is not conclusive. Schools might
punish students differently depending on those students’ existing discipline records. Perhaps
schools are more lenient in punishing students’ first offenses, and since black and poor students
are more likely to have multiple infractions in the same year (see Table 4), the gaps observed in
Barrett, McEachin, Mills, & Valant 28
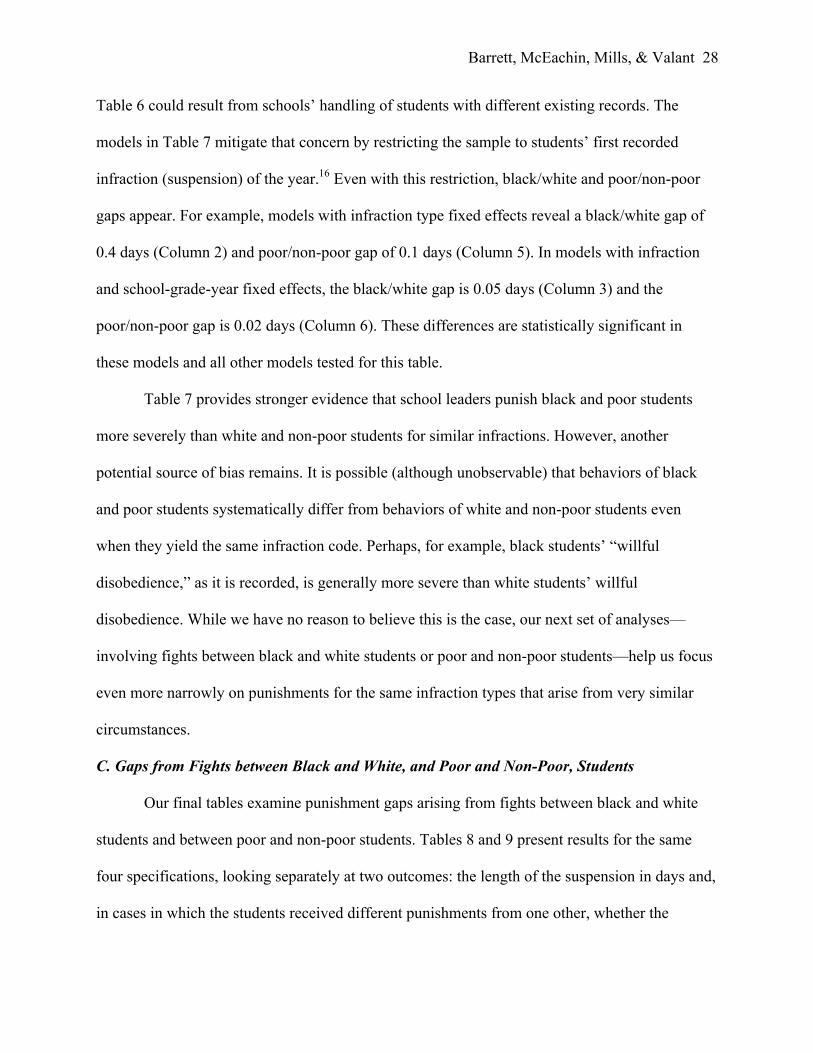
Table 6 could result from schools’ handling of students with different existing records. The
models in Table 7 mitigate that concern by restricting the sample to students’ first recorded
infraction (suspension) of the year.16 Even with this restriction, black/white and poor/non-poor
gaps appear. For example, models with infraction type fixed effects reveal a black/white gap of
0.4 days (Column 2) and poor/non-poor gap of 0.1 days (Column 5). In models with infraction
and school-grade-year fixed effects, the black/white gap is 0.05 days (Column 3) and the
poor/non-poor gap is 0.02 days (Column 6). These differences are statistically significant in
these models and all other models tested for this table.
Table 7 provides stronger evidence that school leaders punish black and poor students
more severely than white and non-poor students for similar infractions. However, another
potential source of bias remains. It is possible (although unobservable) that behaviors of black
and poor students systematically differ from behaviors of white and non-poor students even
when they yield the same infraction code. Perhaps, for example, black students’ “willful
disobedience,” as it is recorded, is generally more severe than white students’ willful
disobedience. While we have no reason to believe this is the case, our next set of analyses—
involving fights between black and white students or poor and non-poor students—help us focus
even more narrowly on punishments for the same infraction types that arise from very similar
circumstances.
C. Gaps from Fights between Black and White, and Poor and Non-Poor, Students
Our final tables examine punishment gaps arising from fights between black and white
students and between poor and non-poor students. Tables 8 and 9 present results for the same
four specifications, looking separately at two outcomes: the length of the suspension in days and,
in cases in which the students received different punishments from one other, whether the

Barrett, McEachin, Mills, & Valant 29
disadvantaged (black or poor) student received the longer suspension. The models differ in
which covariates they include and whether they include school-year or fight occurrence fixed
effects. Tables 10 and 11 show the robustness of our findings to analyses that restrict our
samples to fighting students’ first suspensions or fights in either the current school year or ever
in our data.
Table 8 shows consistent evidence that black students receive longer suspensions than
white students for these interracial fights, with the differences modest in magnitude but
statistically significant. In models that only control for a student’s prior number of fights—which
is positively associated with suspension length—black students receive suspensions that are
approximately 0.05 days longer, on average, than the white students with whom they fight. This
compares to a baseline suspension length of 2.9 days for white students. These gaps persist when
we control for students’ FRPL status, special education status, gender, and prior test scores. In
these models, the gaps range from 0.04 days (with fight occurrence fixed effects) to 0.05 days
(with school-year fixed effects).
Results from LPMs that instead test whether the black student received a longer
suspension than the white student appear in Columns 5 through 8. These results largely mirror
the others. In models that only control for a student’s prior number of fights, the probability that
the black student receives a longer suspension is 1.6 to 1.7 percentage points higher than the
probability that the white student receives a longer suspension. For example, Column 5 indicates
that white students received a longer suspension after 4.6 percent of interracial fights, while
black students received a longer suspension after 6.3 percent of interracial fights (controlling for
the number of prior fights). In models with additional covariates, the estimated differences range
from 1.1 to 1.2 percentage points and are also statistically significant.

Barrett, McEachin, Mills, & Valant 30
Table 9 contains some evidence of systematic differences in the punishments of poor and
non-poor students who fight each other, but the evidence is somewhat less consistent than for the
black/white comparisons. Columns 1 through 4 show no significant differences in the average
number of days of poor and non-poor students’ suspensions (although this could be a product of
larger standard errors). Columns 5 through 8, however, indicate that poor students are 1.1 to 1.4
percentage points more likely to receive a longer suspension than their non-poor fighting
partners. These differences, although modest, are statistically significant in all models.
We observe similar results when we restrict the samples to fights between two students
who had not been previously suspended for fighting (in some models) or suspended at all (in
other models). Tables 10 and 11 show black/white and poor/non-poor disparities after restricting
the sample two students who had previously: not been suspended for fighting in that school year,
never been suspended for fighting in our data, not been suspended at all in that school year, or
never been suspended in our data. In each case, we show results with and without student
covariates (race, FRPL, special education status, gender, and prior test scores). Each table
provides estimates for black/white gaps in Panel A and poor/non-poor gaps in Panel B.
Table 10 shows nearly identical estimates for black/white gaps across all samples and
models. The gaps range from 0.04 days to 0.05 days per fight, in each case significant ( p<.05),
which is consistent with the estimates in Table 8. The poor/non-poor gaps are consistent with the
estimates in Table 9 in that they have positive but not statistically significant coefficients (with
one exception), perhaps due to relatively large standard errors. Table 11 mirrors Table 10 but
replaces the outcome variable with whether the black or poor student received the longer
suspension. Here, too, the results are very similar to those from our preferred models. Table 11
shows that black students are 1.1 to 2.1 percentage points more likely to receive a longer
Barrett, McEachin, Mills, & Valant 31
suspension than white students (comparable to results in Columns 5 and 7 of Table 8) and poor
students are 1.1 to 1.5 percentage points more likely to receive a longer suspension than white
students (comparable to results in Columns 5 and 7 of Table 9). These differences are all
significant with p<.01.
The stability of our estimates with these various sample restrictions provides confidence
that our preferred models from Tables 8 and 9 are not biased from black or poor students being
systematically more disruptive or antagonistic than the students with whom they fight.
VI. Discussion
Questions about why poor and minority students are suspended at higher rates than their
peers and what to do about it have emerged among the most pressing and controversial issues
facing education policymakers. At this point there is little dispute that black and poor students
are suspended and expelled at higher rates than their peers. However, addressing inequities in
exclusionary discipline requires not only establishing that gaps exist but also explaining their
origins. Gaps in exclusionary discipline could arise from true differences in students’ behaviors,
differences in how schools translate those behaviors to infractions, and differences in how
schools punish students for the same infractions. The reality that gaps could arise within schools,
across schools within districts, or across districts adds complexity, while the lack of available
data on the true behaviors of large numbers of students imposes constraints on how researchers
can assess these gaps.
This study uses rich administrative data from the state of Louisiana to explore the causes
of black/white and poor/non-poor gaps in exclusionary discipline. Louisiana is an appropriate
setting for this study due to its large (and relatively even) populations of black and white students
and its historical challenges related to race, class, and schools. We observe large black/white and
Barrett, McEachin, Mills, & Valant 32
poor/non-poor differences in student discipline, with these gaps evident in a variety of contexts.
For example, we see that substantial portions of discipline gaps arise within schools, meaning
that these gaps are potentially observable to many students and staff—and not simply patterns
that arise from between-school differences that escape the view of individuals working within a
single school. Black and poor students tend to receive longer suspensions than white and non-
poor students for their first infractions, and while Louisiana’s black and poor students are more
likely than their peers to be suspended for nonviolent infractions, they are also more likely to be
suspended for violent infractions.
A fundamental—and much debated—question about discipline gaps is whether they arise
from intentional discrimination towards minority or poor students. Discrimination of this type is
extremely difficult to identify in large-scale administrative data, as these data typically do not
provide information about students’ true behaviors. This study tests for gaps arising from
situations so narrowly defined that explanations other than discrimination seem unlikely. In
particular, we examine what happens when a black student and a white student (or a poor student
and a non-poor student) fight each other, controlling for other characteristics related to students’
backgrounds and prior fight histories. Even in this very particular context, we find that black
students are punished more severely than white students. The difference averages about 0.05
days across black-white fights—with black students (and poor students) one to two percentage
points more likely to receive a longer suspension. These models cannot provide conclusive
evidence of racial bias, since we must rely on some unverifiable assumptions, including that
black students do not systematically behave differently than white students in these interracial
fights (after accounting for students’ background characteristics). Still, with our findings robust
to numerous alternate specifications, this study provides perhaps the strongest evidence to date of
Barrett, McEachin, Mills, & Valant 33
systematic discrimination in student discipline. Moreover, although these particular differences
are small in magnitude, there is reason to believe that disparities could be larger in circumstances
less amenable to this type of analysis. We examine black/white and poor/non-poor fights because
we believe they provide the most credible glimpse in our data at whether schools punish students
differently for similar behaviors. With these fights, however, differences in how students are
punished are likely known to the administrators who determine the punishments as well as many
other staff members, students, and parents. This awareness could temper the resulting disparities.
If so, one might expect larger disparities if black and white or poor and non-poor students are
punished at different times for different incidents.
Of course, discriminatory practices might also exist even where we observe gaps across
schools rather than within them. If schools that enroll high percentages of poor and minority
students employ harsher discipline practices than other schools, then poor and minority students
could accrue discipline records that non-poor and white students would not accrue for similar
behaviors. Moreover, broader economic and societal patterns of discrimination could yield
varying behaviors from students of different races and socioeconomic classes. These represent
different types of problems than within-school gaps—and would require solutions tailored to
those problems—but still can reflect discrimination in student discipline. As this study shows,
discipline gaps arise from multiple sources and likely require more than one type of response.
1 Some studies refer to in-school suspensions, in which students are removed from their classrooms but remain in the school building, as a form of exclusionary discipline. Others do not. This study regards both in-school and out-of-school suspensions as forms of exclusionary discipline, since they exclude students from their routine instruction and activities.
Barrett, McEachin, Mills, & Valant 34
2 Through the National School Lunch Program, students whose household income is at or below 130 percent of the poverty line are eligible for free lunch, while students whose household income is at or below 180 percent of the poverty line are eligible for reduced-price lunch. 3 See Losen, Hodson, Keith II, Morrison, and Belway (2015) for a description of the changes in racial discipline gaps from 1972-73 through 2011-12. 4 The decision of whether to remove a student from school could also have implications for that student’s classmates. These externalities have not received as much attention from researchers as the direct effects on the suspended students (see Kinsler, 2013, for analysis that considers the externalities of suspending students along with the deterrent and direct effects on suspended students). 5 Note that this also could affect how schools translate infractions to punishments. More generally, this distinction is conflated in studies that compare the severity of punishments for black and white students without separately comparing (or controlling for) the infractions that yielded those punishments. 6 It is important to note that a finding that discipline disparities arise across schools rather than within them does not rule out the possibility of discriminatory or inequitable causes of the disparities. For example, various forms of discrimination could lead black and white students to behave differently or attend different types of schools. This type of research is analogous in many ways to the expansive research on wage gaps by race and gender (e.g., Cotton, 1988; Groshen, 1991; Reimers, 1983; Weichselbaumer & Winter-Ebmer, 2005). This research tends to show that controlling for variables such as occupation, education, and experience yield smaller estimates of wage gaps than simple raw comparisons, although race and gender differences on these covariates could themselves result from various forms and sources of discrimination. 7 Questions about how to punish infractions of different severities have entered policy discussions about zero-tolerance laws, among other issues (e.g., see Curran, 2016). 8 The following infractions were coded as violent (as labeled in LDOE data): immoral or vicious practices; habits injurious to his/her associates; weapon (Sec 921 of Title 18 of the U.S. Code); weapon (not prohibited by federal law); throws missiles liable to injure others; fights while under school supervision; commits any other serious offense; murder; assault and/or battery; rape and/or sexual battery; kidnapping; arson; misappropriate with violence; use weapon prohibited by federal law; possess blade with length less than 2.5 in.; serious bodily injury; bullying; cyber bullying; and sexual harassment. 9 Some students were suspended for both a violent and nonviolent infraction in the same year. 10 In the decomposition, we measure punishment length at the student-year level. In the regression analyses, we measure it at the student-infraction-year level. 11 We also have a variable showing the race of each school administrator. We explored using this variable to test whether the punishments assigned for interracial fights vary by the race of the person administering the punishment (e.g., for evidence on the relationship between teacher-student race match and student discipline, see Lindsay & Hart, 2017; for both teacher-student and principal-student match, see Kinsler, 2011). However, we do not observe which administrator actually determined punishments (e.g., a principal or assistant principal), and our conversations with school leaders indicate that this varies considerably across schools. We tested whether punishments for interracial fights vary by the overall racial composition of the administrative staff (see Price & Wolfers, 2010, for an analogous approach), and we found no statistically significant relationships between administrators’ race and the punishment gaps

Barrett, McEachin, Mills, & Valant 35
between black and white students. Because of the data ambiguities, we omit those analyses from the paper, but they are available upon request. 12 Note that a negative gap would imply that white/non-poor students are more likely to be suspended or have longer suspensions than black/poor students. 13 Kinsler (2011) did find evidence of within-school differences in the likelihood of being referred to the principals’ office for a behavioral offense. However, conditional on being referred to the principal’s office and controlling for infraction, the within-school differences in the likelihood or length of suspensions were not statistically significant. 14 We also estimated models that allowed the black/white gap to vary by income and/or gender. In both cases we saw small but statistically significant negative effects for the interactions between black and low-income or black and male variables, on the order of 1 percentage point. 15 Appendix Tables A3 and A4 present results from regression models with assorted weights, although these weights cannot address the issue of empty cells for segregated SGYs. These tables include models like those presented in Tables 3 and 4, respectively. 16 We focus on first infractions—rather than controlling for prior discipline records—because students’ prior discipline records could make for problematic controls if black or poor students previously received suspensions for behaviors that would not have yielded suspensions for white or non-poor students.
Barrett, McEachin, Mills, & Valant 36
References
Anderson, K. P., & Ritter, G. W. (2017). Disparate use of exclusionary discipline: Evidence on inequities in school discipline from a U.S. state. Education Policy Analysis Archives, 25(49), 1-36.
Arcia, E. (2006). Achievement and enrollment status of suspended students: Outcomes in a large, multicultural school district. Education and Urban Society, 38(3), 359-369.
Beck, A. N., & Muschkin, C. G. (2012). The enduring impact of race: Understanding disparities in student disciplinary infractions and achievement. Sociological Perspectives, 55(4), 637-662.
Biernat, M., & Manis, M. (1994). Shifting standards and stereotype-based judgments. Journal of Personality and Social Psychology, 66(1), 5-20.
Blalock, H. M. (1967). Toward a theory of minority-group relations. New York, NY: Wiley and Sons.
Bradley, R. H., & Corwyn, R. F. (2002). Socioeconomic status and child development. Annual Review of Psychology, 53(1), 371-399.
Chen, E. (2004). Why socioeconomic status affects the health of children: A psychosocial perspective. Current Directions in Psychological Science, 13(3), 112-115.
Children’s Defense Fund. (1974). Children out of school in America. Cambridge, MA: Children’s Defense Fund.
Children’s Defense Fund. (1975). School suspensions: Are they helping children? Cambridge, MA: Children’s Defense Fund.
Clotfelter, C. T., Ladd, H. F., & Vigdor, J. (2005). Who teaches whom? Race and the distribution of novice teachers. Economics of Education Review, 24, 377–392.
Cotton, J. (1988). On the decomposition of wage differentials. Review of Economics and Statistics, 70(2), 236-243.
Curran, F. C. (2016). Estimating the effect of state zero tolerance laws on exclusionary discipline, racial discipline gaps, and student behavior. Educational Evaluation and Policy Analysis, 38(4), 647-668.
Egalite, A. J., Mills, J. N., & Wolf, P. J. (2017). The impact of targeted school vouchers on racial stratification in Louisiana schools. Education and Urban Society, 49(3), 271-296.
Ekstrom, R. B., Goertz, M. E., Pollack, J. M., & Rock, D. A. (1986). Who drops out of high school and why? Findings from a national study. Teachers College Record, 87(3), 356-73.
Fabelo, T., Thompson, M. D., Plotkin, M., Carmichael, D., Marchbanks III, M. P., Booth, E. A. (2011). Breaking schools’ rules: A statewide study of how school discipline relates to students’ success and juvenile justice involvement. New York, NY: Council of State Governments Justice Center.
Figlio, D. N. (2006). Testing, crime and punishment. Journal of Public Economics, 90(4), 837-851.

Barrett, McEachin, Mills, & Valant 37
Fordham, S., & Ogbu, J. U. (1986). Black students' school success: Coping with the “burden of ‘acting white’.” The Urban Review, 18(3), 176-206.
Fryer, R. G. (2006). “Acting white”: The social price paid by the best and brightest minority students. Education Next, 6(1), 52-59.
Gershenson, S., Holt, S. B., & Papageorge, N. W. (2016). Who believes in me? The effect of student–teacher demographic match on teacher expectations. Economics of Education Review, 52, 209-224.
Gilliam, W. S., Maupin, A. N., Reyes, C. R., Accavitti, M., & Shic, F. (2016). Do early educators’ implicit biases regarding sex and race relate to behavior expectations and recommendations of preschool expulsions and suspensions? New Haven, CT: Yale Child Study Center.
Goldhaber, D., Lavery, L., & Theobald, R. (2015). Uneven playing field? Assessing the teacher quality gap between advantaged and disadvantaged students. Educational Researcher, 44(5), 293–307.
Gorman–Smith, D., & Tolan, P. (1998). The role of exposure to community violence and developmental problems among inner-city youth. Development and Psychopathology, 10(1), 101-116.
Gregory, A., Skiba, R. J., & Noguera, P. A. (2010). The achievement gap and the discipline gap: Two sides of the same coin? Educational Researcher, 39(1), 59-68.
Groshen, E. L. (1991). The structure of the female/male wage differential: Is it who you are, what you do, or where you work?. Journal of Human Resources, 26(3), 457-472.
Haynes, N. M., Emmons, C., & Ben-Avie, M. (1997). School climate as a factor in student adjustment and achievement. Journal of Educational and Psychological Consultation, 8(3), 321-329.
Kinsler, J. (2011). Understanding the black–white school discipline gap. Economics of Education Review, 30(6), 1370-1383.
Kinsler, J. (2013). School discipline: a source or salve for the racial achievement gap? International Economic Review, 54(1), 355-383.
Lavergne, M., & Mullainathan, S. (2004). Are Emily and Greg more employable than Lakisha and Jamal? A field experiment on labor market discrimination. American Economic Review, 94(4), 991-1013.
Leventhal, T., & Brooks-Gunn, J. (2000). The neighborhoods they live in: the effects of neighborhood residence on child and adolescent outcomes. Psychological Bulletin, 126(2), 309-337.
Lindsay, C. A., & Hart, C. M. D. (2017). Exposure to same-race teachers and student disciplinary outcomes for black students in North Carolina. Educational Evaluation and Policy Analysis, 39(3), 485-510.
Losen, D., Hodson, C., Keith II, M. A., Morrison, K., & Belway, S. (2015). Are we closing the school discipline gap? Los Angeles, CA: The Center for Civil Rights Remedies, University of California.

Barrett, McEachin, Mills, & Valant 38
Losen, D. J., Martinez, T. E., & Okelola, V. (2014). Keeping California’s kids in school: Fewer students of color missing school for minor misbehavior. Los Angeles, CA: The Center for Civil Rights Remedies, University of California.
Loveless, T. (2017). The 2017 Brown Center report on American education: How well are American students learning? Washington, DC: Brookings Institution.
Monroe, C. R. (2005). Understanding the discipline gap through a cultural lens: Implications for the education of African American students. Intercultural Education, 16(4), 317-330.
Morgan, E., Salomon, N., Plotkin, M., & Cohen, R. (2014). The school discipline consensus report: Strategies from the field to keep students engaged in school and out of the juvenile justice system. New York, NY: Council of State Governments Justice Center.
Munnell, A. H., Tootell, G. M., Browne, L. E., & McEneaney, J. (1996). Mortgage lending in Boston: Interpreting HMDA data. American Economic Review, 86(1), 25-53.
Nicholson-Crotty, S., Birchmeier, Z., & Valentine, D. (2009). Exploring the impact of school discipline on racial disproportion in the juvenile justice system. Social Science Quarterly, 90(4), 1003-1018.
Okonofua, J. A., & Eberhardt, J. L. (2015). Two strikes race and the disciplining of young students. Psychological Science, 26(5), 617-624.
Park, K. H. (2017). The impact of judicial elections in the sentencing of black crime. Journal of Human Resources, 52(4), 998-1031.
Pope, D. G., & Sydnor, J. R. (2011). What’s in a Picture? Evidence of Discrimination from Prosper. com. Journal of Human Resources, 46(1), 53-92.
Porowski, A., O’Conner, R., & Passa, A. (2014). Disproportionality in school discipline: An assessment of trends in Maryland, 2009-12. Washington, DC: U.S. Department of Education, Institute of Education Sciences.
Price, J., & Wolfers, J. (2010). Racial discrimination among NBA referees. Quarterly Journal of Economics, 125(4), 1859-1887.
Raffaele Mendez, L. M. (2003). Predictors of suspension and negative outcomes: A longitudinal investigation. New Directions for Youth Development, 99, 17-33.
Raffaele Mendez, L. M., Knoff, H. M., & Ferron, J. M. (2002). School demographic variables and out-of-school suspension rates: A quantitative and qualitative analysis of a large, ethnically diverse school district. Psychology in the Schools, 39(3), 259-277.
Reimers, C. W. (1983). Labor market discrimination against Hispanic and black men. Review of Economics and Statistics, 65(4), 570-579.
Schulman, K. A., Berlin, J. A., Harless, W., Kerner, J. F., Sistrunk, S., Gersh, B. J., Dubé, R., Taleghani, C. K., Burke, J. E., Williams, S., Eisenberg, J. M., Ayers, W., & Escarce, J. J. (1999). The effect of race and sex on physicians' recommendations for cardiac catheterization. New England Journal of Medicine, 340(8), 618-626.
Shaw, S. R., & Braden, J. P. (1990). Race and gender bias in the administration of corporal punishment. School Psychology Review, 19(3), 378-383.
Barrett, McEachin, Mills, & Valant 39
Skiba, R. J., Arredondo, M. I., & Williams, N. T. (2014). More than a metaphor: The contribution of exclusionary discipline to a school-to-prison pipeline. Equity and Excellence in Education, 47(4), 546-564.
Skiba, R. J., Chung, C. G., Trachok, M., Baker, T. L., Sheya, A., & Hughes, R. L. (2014). Parsing disciplinary disproportionality contributions of infraction, student, and school characteristics to out-of-school suspension and expulsion. American Educational Research Journal, 51(4), 640-670.
Skiba, R. J., Michael, R. S., Nardo, A. C., & Peterson, R. L. (2002). The color of discipline: Sources of racial and gender disproportionality in school punishment. The Urban Review, 34(4), 317-342.
Skiba, R., & Rausch, M. K. (2004). The relationship between achievement, discipline, and race: An analysis of actors predicting ISTEP scores. Children Left Behind Policy Briefs, Supplementary analysis 2-D. Bloomington, IN: Center for Evaluation and Education Policy, Indiana University. Retrieved from http://files.eric.ed.gov/fulltext/ED488899.pdf
Skiba, R. J., & Williams, N. T. (2014). Are black kids worse? Myths and facts about racial differences in behavior: A summary of the literature. Bloomington, IN: The Equity Project at Indiana University. Retrieved from http://www.indiana.edu/~atlantic/wp-content/uploads/2014/03/African-American-Differential-Behavior_031214.pdf
Steinberg, M. P., & Lacoe, J. (2017). What do we know about school discipline reform?: Assessing the alternatives to suspensions and expulsions. Education Next, 17(1), 44-52.
Suh, S., Suh, J., & Houston, I. (2007). Predictors of categorical at-risk high school dropouts. Journal of Counseling and Development, 85(2), 196-203.
Thernstrom, A., & Thernstrom, S. (2004). No excuses: Closing the racial gap in learning. New York, NY: Simon & Schuster.
U. S. Department of Education. (2016). School climate and discipline: Know the data. Retrieved from http://www2.ed.gov/policy/gen/guid/school-discipline/index.html#featured
U. S. Department of Education Office for Civil Rights. (2016). 2013-14 Civil Rights Data Collection: A first look. Retrieved from https://www2.ed.gov/about/offices/list/ocr/docs/2013-14-first-look.pdf
U. S. Department of Justice, & U.S. Department of Education. (2014). Dear Colleague Letter on the nondiscriminatory administration of school discipline. Retrieved from https://www2.ed.gov/about/offices/list/ocr/letters/colleague-201401-title-vi.html
Wehlage, G. G., & Rutter, R. A. (1986). Dropping out: How much do schools contribute to the problem?. Teachers College Record, 87(3), 374-92.
Weichselbaumer, D., & Winter-Ebmer, R. (2005). A meta-analysis of the international gender wage gap. Journal of Economic Surveys, 19(3), 479-511.
Welch, K., & Payne, A. A. (2010). Racial threat and punitive school discipline. Social Problems, 57(1), 25-48.
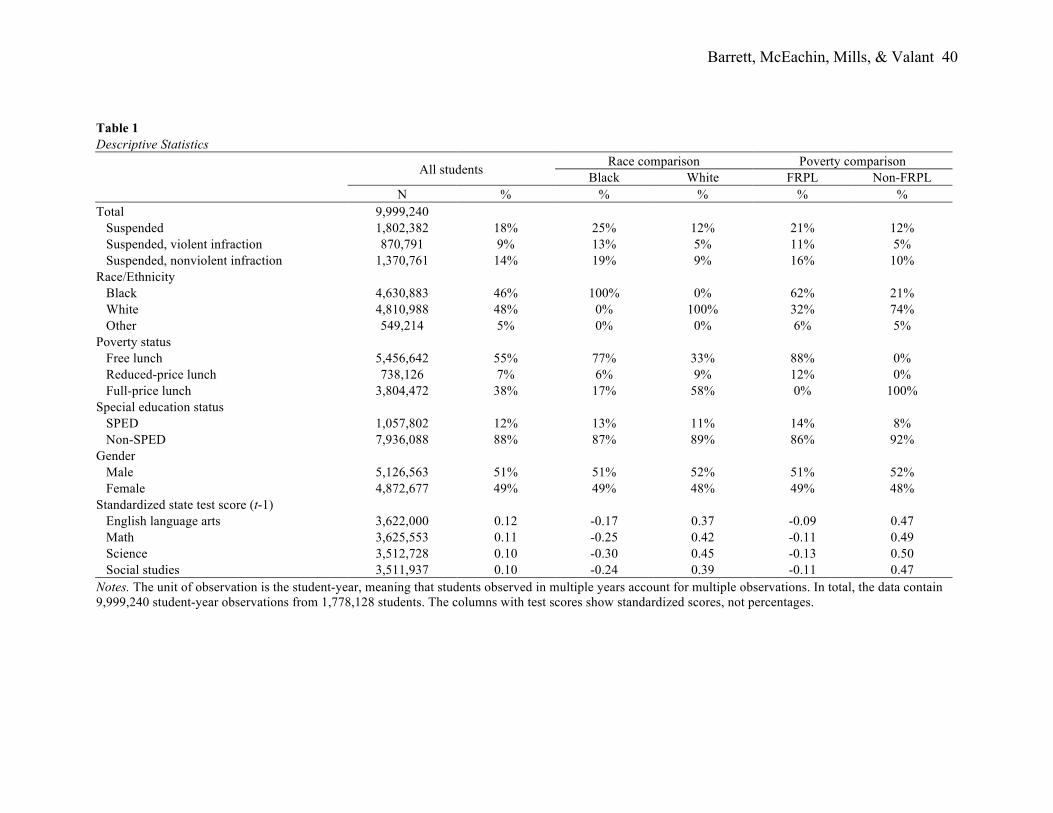
Barrett, McEachin, Mills, & Valant 40
Table 1 Descriptive Statistics All students Race comparison Poverty comparison Black White FRPL Non-FRPL N % % % % % Total 9,999,240 Suspended 1,802,382 18% 25% 12% 21% 12% Suspended, violent infraction 870,791 9% 13% 5% 11% 5% Suspended, nonviolent infraction 1,370,761 14% 19% 9% 16% 10% Race/Ethnicity Black 4,630,883 46% 100% 0% 62% 21% White 4,810,988 48% 0% 100% 32% 74% Other 549,214 5% 0% 0% 6% 5% Poverty status Free lunch 5,456,642 55% 77% 33% 88% 0% Reduced-price lunch 738,126 7% 6% 9% 12% 0% Full-price lunch 3,804,472 38% 17% 58% 0% 100% Special education status SPED 1,057,802 12% 13% 11% 14% 8% Non-SPED 7,936,088 88% 87% 89% 86% 92% Gender Male 5,126,563 51% 51% 52% 51% 52% Female 4,872,677 49% 49% 48% 49% 48% Standardized state test score (t-1) English language arts 3,622,000 0.12 -0.17 0.37 -0.09 0.47 Math 3,625,553 0.11 -0.25 0.42 -0.11 0.49 Science 3,512,728 0.10 -0.30 0.45 -0.13 0.50 Social studies 3,511,937 0.10 -0.24 0.39 -0.11 0.47 Notes. The unit of observation is the student-year, meaning that students observed in multiple years account for multiple observations. In total, the data contain 9,999,240 student-year observations from 1,778,128 students. The columns with test scores show standardized scores, not percentages.

Barrett, McEachin, Mills, & Valant 41
Table 2 Number of Infractions by Infraction Type and Student Subgroup All students Race Comparison Poverty Comparison
Black White FRPL Non-FRPL
N % N % N % N % N % Total number of suspensions 4,258,559 100% 2,915,863 100% 1,223,363 100% 3,272,024 100% 986,535 100% Willful disobedience 999,339 23% 699,943 24% 273,162 22% 774,576 24% 224,763 23% Fights in school 604,719 14% 467,074 16% 125,606 10% 504,000 15% 100,719 10% Habitually violates a rule 559,983 13% 393,453 13% 151,917 12% 436,237 13% 123,746 13% Disrespects authority 536,668 13% 393,442 13% 131,529 11% 426,962 13% 109,706 11% Any other serious offense 315,827 7% 186,856 6% 118,142 10% 221,356 7% 94,471 10% Profane 255,728 6% 164,830 6% 83,912 7% 191,955 6% 63,773 6% Leaves school 256,553 6% 157,183 5% 88,563 7% 172,977 5% 83,576 8% Habitually tardy 203,312 5% 133,782 5% 61,372 5% 137,799 4% 65,513 7% Injurious habits 183,594 4% 118,794 4% 58,913 5% 149,304 5% 34,290 3% Other 342,836 8% 200,506 7% 130,247 11% 256,858 8% 85,978 9% Violent infractions 1,232,478 29% 856,312 29% 343,206 28% 977,094 30% 255,384 26% Nonviolent infractions 3,026,081 71% 2,059,551 71% 880,157 72% 2,294,930 70% 731,151 74% Notes. The unit of observation is the infraction, so some students have multiple observations within the same year while students who did not commit an infraction are not represented. The table lists the nine most common infractions and aggregates all other infractions as “Other.” Columns with percentages show the percentage of infractions recorded for that group of students that were of the infraction type listed. The following infractions were coded as violent (as labeled in LDOE data): immoral or vicious practices; habits injurious to his/her associates; weapon (Sec 921 of Title 18 of the U.S. Code); weapon (not prohibited by federal law); throws missiles liable to injure others; fights while under school supervision; commits any other serious offense; murder; assault and/or battery; rape and/or sexual battery; kidnapping; arson; misappropriate with violence; use weapon prohibited by federal law; possess blade with length less than 2.5 in.; serious bodily injury; bullying; cyber bullying; and sexual harassment.

Barrett, McEachin, Mills, & Valant 42
Table 3 Predictors of Whether Students were Suspended in Given School Year (1) (2) (3) (4) (5) (6) (7) (8) Black 0.128*** 0.126***
0.109*** 0.105*** 0.106*** 0.114***
(0.001) (0.001)
(0.001) (0.001) (0.001) (0.001) Other race -0.017*** -0.014***
-0.028*** -0.025*** -0.031*** -0.036***
(0.001) (0.001)
(0.001) (0.001) (0.001) (0.001) FRPL
0.091*** 0.088*** 0.047*** 0.062*** 0.067*** 0.064***
(0.001) (0.000) (0.001) (0.000) (0.001) (0.001)
SPED
0.024*** 0.020***
(0.001) (0.001)
Male
0.106*** 0.103***
(0.001) (0.001)
Math score (t-1)
-0.022*** -0.019***
(0.000) (0.000)
ELA score (t-1)
-0.050*** -0.045***
(0.000) (0.000)
Constant 0.122*** 0.123*** 0.124*** 0.126*** 0.102*** 0.095*** 0.056 0.088***
(0.001) (0.000) (0.001) (0.000) (0.001) (0.000) (0.145) (0.001)
Observations 9,981,117 9,981,117 9,989,263 9,989,263 9,981,117 9,981,117 3,615,828 3,615,828 R-squared 0.029 0.190 0.013 0.184 0.031 0.195 0.119 0.211 Year FEs No No No No No No Yes No Grade FEs No No No No No No Yes No SGY FEs No Yes No Yes No Yes No Yes Notes. The unit of observation is the student-year. Standard errors appear in parentheses and account for the clustering of students within school-grade-year. “SGY FEs” refers to school-grade-year fixed effects. *** p<0.01, ** p<0.05, * p<0.1
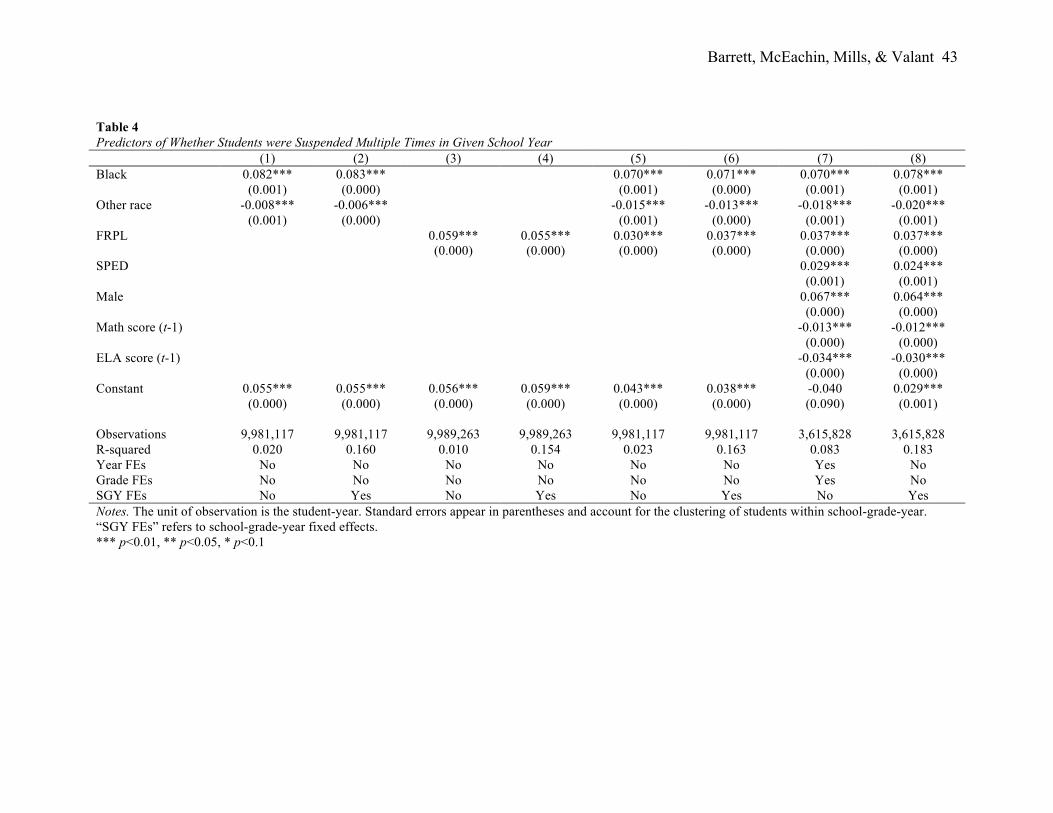
Barrett, McEachin, Mills, & Valant 43
Table 4 Predictors of Whether Students were Suspended Multiple Times in Given School Year (1) (2) (3) (4) (5) (6) (7) (8) Black 0.082*** 0.083***
0.070*** 0.071*** 0.070*** 0.078***
(0.001) (0.000)
(0.001) (0.000) (0.001) (0.001) Other race -0.008*** -0.006***
-0.015*** -0.013*** -0.018*** -0.020***
(0.001) (0.000)
(0.001) (0.000) (0.001) (0.001) FRPL
0.059*** 0.055*** 0.030*** 0.037*** 0.037*** 0.037***
(0.000) (0.000) (0.000) (0.000) (0.000) (0.000)
SPED
0.029*** 0.024***
(0.001) (0.001)
Male
0.067*** 0.064***
(0.000) (0.000)
Math score (t-1)
-0.013*** -0.012***
(0.000) (0.000)
ELA score (t-1)
-0.034*** -0.030***
(0.000) (0.000)
Constant 0.055*** 0.055*** 0.056*** 0.059*** 0.043*** 0.038*** -0.040 0.029***
(0.000) (0.000) (0.000) (0.000) (0.000) (0.000) (0.090) (0.001)
Observations 9,981,117 9,981,117 9,989,263 9,989,263 9,981,117 9,981,117 3,615,828 3,615,828 R-squared 0.020 0.160 0.010 0.154 0.023 0.163 0.083 0.183 Year FEs No No No No No No Yes No Grade FEs No No No No No No Yes No SGY FEs No Yes No Yes No Yes No Yes Notes. The unit of observation is the student-year. Standard errors appear in parentheses and account for the clustering of students within school-grade-year. “SGY FEs” refers to school-grade-year fixed effects. *** p<0.01, ** p<0.05, * p<0.1
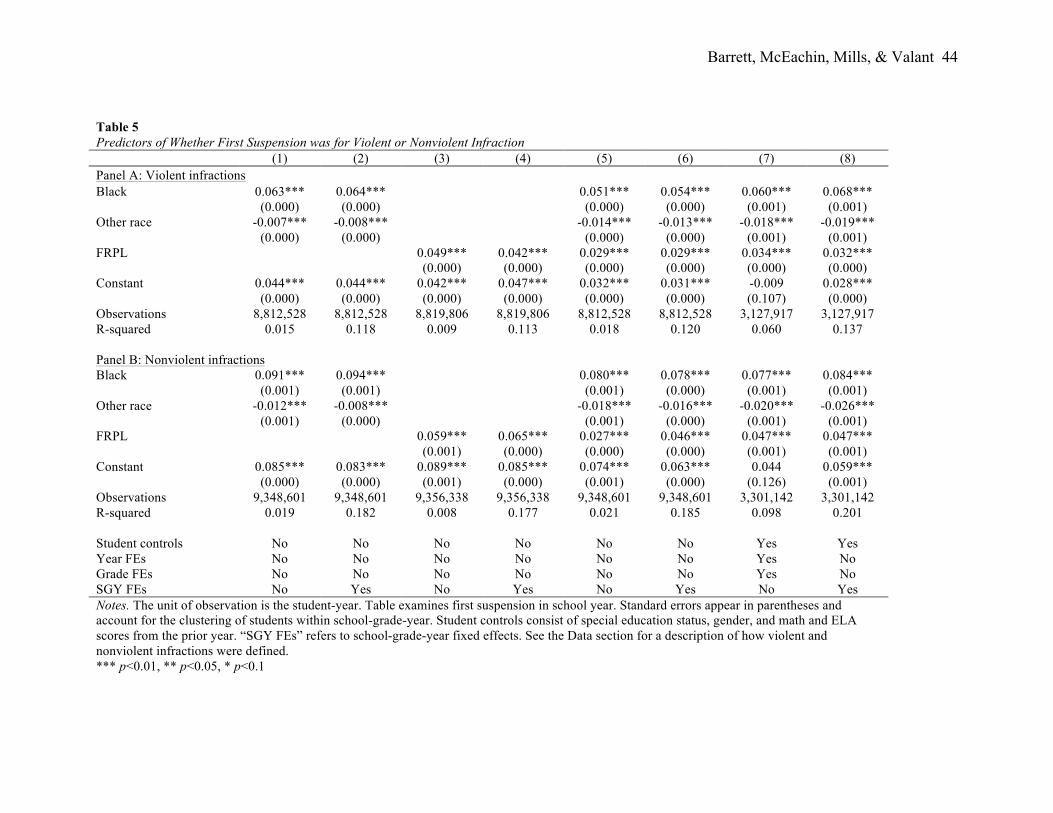
Barrett, McEachin, Mills, & Valant 44
Table 5 Predictors of Whether First Suspension was for Violent or Nonviolent Infraction (1) (2) (3) (4) (5) (6) (7) (8) Panel A: Violent infractions Black 0.063*** 0.064*** 0.051*** 0.054*** 0.060*** 0.068***
(0.000) (0.000) (0.000) (0.000) (0.001) (0.001) Other race -0.007*** -0.008*** -0.014*** -0.013*** -0.018*** -0.019***
(0.000) (0.000) (0.000) (0.000) (0.001) (0.001) FRPL 0.049*** 0.042*** 0.029*** 0.029*** 0.034*** 0.032***
(0.000) (0.000) (0.000) (0.000) (0.000) (0.000) Constant 0.044*** 0.044*** 0.042*** 0.047*** 0.032*** 0.031*** -0.009 0.028***
(0.000) (0.000) (0.000) (0.000) (0.000) (0.000) (0.107) (0.000) Observations 8,812,528 8,812,528 8,819,806 8,819,806 8,812,528 8,812,528 3,127,917 3,127,917 R-squared 0.015 0.118 0.009 0.113 0.018 0.120 0.060 0.137 Panel B: Nonviolent infractions Black 0.091*** 0.094*** 0.080*** 0.078*** 0.077*** 0.084***
(0.001) (0.001) (0.001) (0.000) (0.001) (0.001) Other race -0.012*** -0.008*** -0.018*** -0.016*** -0.020*** -0.026***
(0.001) (0.000) (0.001) (0.000) (0.001) (0.001) FRPL 0.059*** 0.065*** 0.027*** 0.046*** 0.047*** 0.047***
(0.001) (0.000) (0.000) (0.000) (0.001) (0.001) Constant 0.085*** 0.083*** 0.089*** 0.085*** 0.074*** 0.063*** 0.044 0.059***
(0.000) (0.000) (0.001) (0.000) (0.001) (0.000) (0.126) (0.001) Observations 9,348,601 9,348,601 9,356,338 9,356,338 9,348,601 9,348,601 3,301,142 3,301,142 R-squared 0.019 0.182 0.008 0.177 0.021 0.185 0.098 0.201 Student controls No No No No No No Yes Yes Year FEs No No No No No No Yes No Grade FEs No No No No No No Yes No SGY FEs No Yes No Yes No Yes No Yes Notes. The unit of observation is the student-year. Table examines first suspension in school year. Standard errors appear in parentheses and account for the clustering of students within school-grade-year. Student controls consist of special education status, gender, and math and ELA scores from the prior year. “SGY FEs” refers to school-grade-year fixed effects. See the Data section for a description of how violent and nonviolent infractions were defined. *** p<0.01, ** p<0.05, * p<0.1
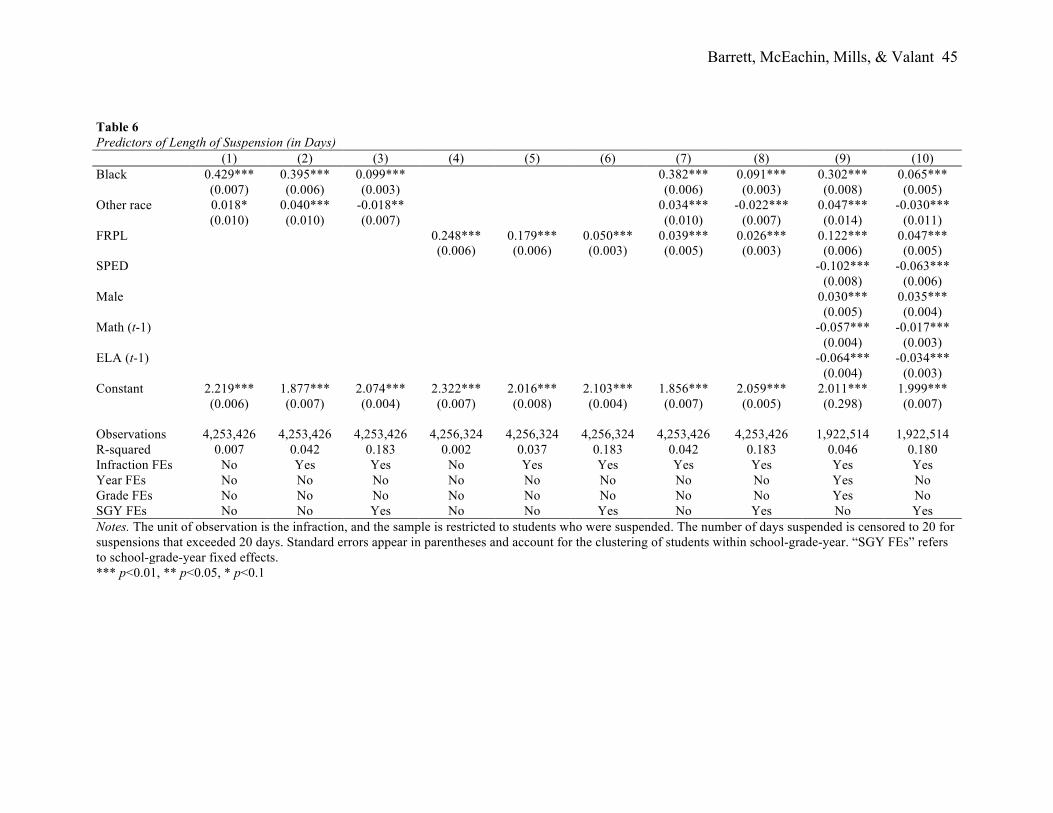
Barrett, McEachin, Mills, & Valant 45
Table 6 Predictors of Length of Suspension (in Days) (1) (2) (3) (4) (5) (6) (7) (8) (9) (10) Black 0.429*** 0.395*** 0.099***
0.382*** 0.091*** 0.302*** 0.065***
(0.007) (0.006) (0.003)
(0.006) (0.003) (0.008) (0.005) Other race 0.018* 0.040*** -0.018**
0.034*** -0.022*** 0.047*** -0.030***
(0.010) (0.010) (0.007)
(0.010) (0.007) (0.014) (0.011) FRPL
0.248*** 0.179*** 0.050*** 0.039*** 0.026*** 0.122*** 0.047***
(0.006) (0.006) (0.003) (0.005) (0.003) (0.006) (0.005)
SPED
-0.102*** -0.063***
(0.008) (0.006)
Male
0.030*** 0.035***
(0.005) (0.004)
Math (t-1)
-0.057*** -0.017***
(0.004) (0.003)
ELA (t-1)
-0.064*** -0.034***
(0.004) (0.003)
Constant 2.219*** 1.877*** 2.074*** 2.322*** 2.016*** 2.103*** 1.856*** 2.059*** 2.011*** 1.999***
(0.006) (0.007) (0.004) (0.007) (0.008) (0.004) (0.007) (0.005) (0.298) (0.007)
Observations 4,253,426 4,253,426 4,253,426 4,256,324 4,256,324 4,256,324 4,253,426 4,253,426 1,922,514 1,922,514 R-squared 0.007 0.042 0.183 0.002 0.037 0.183 0.042 0.183 0.046 0.180 Infraction FEs No Yes Yes No Yes Yes Yes Yes Yes Yes Year FEs No No No No No No No No Yes No Grade FEs No No No No No No No No Yes No SGY FEs No No Yes No No Yes No Yes No Yes Notes. The unit of observation is the infraction, and the sample is restricted to students who were suspended. The number of days suspended is censored to 20 for suspensions that exceeded 20 days. Standard errors appear in parentheses and account for the clustering of students within school-grade-year. “SGY FEs” refers to school-grade-year fixed effects. *** p<0.01, ** p<0.05, * p<0.1

Barrett, McEachin, Mills, & Valant 46
Table 7 Predictors of Length of Suspension for First Offense (in Days) (1) (2) (3) (4) (5) (6) (7) (8) (9) (10) Black 0.411*** 0.361*** 0.047***
0.365*** 0.044*** 0.292*** 0.024***
(0.006) (0.006) (0.004)
(0.006) (0.004) (0.008) (0.006) Other race 0.013 0.040*** -0.023**
0.043*** -0.025*** 0.058*** -0.013
(0.011) (0.010) (0.009)
(0.010) (0.009) (0.015) (0.014) FRPL
0.210*** 0.124*** 0.022*** -0.013** 0.010** 0.107*** 0.028***
(0.006) (0.006) (0.004) (0.006) (0.004) (0.007) (0.006)
SPED
-0.064*** -0.027***
(0.008) (0.008)
Male
-0.019*** -0.025***
(0.005) (0.005)
Math (t-1)
-0.041*** -0.005
(0.004) (0.004)
ELA (t-1)
-0.045*** -0.014***
(0.004) (0.004)
Constant 2.106*** 1.728*** 1.904*** 2.216*** 1.875*** 1.918*** 1.735*** 1.898*** 1.745*** 1.890***
(0.005) (0.006) (0.005) (0.007) (0.007) (0.005) (0.007) (0.006) (0.471) (0.009)
Observations 1,801,105 1,801,105 1,801,105 1,802,382 1,802,382 1,802,382 1,801,105 1,801,105 802,597 802,597 R-squared 0.008 0.056 0.247 0.002 0.051 0.247 0.056 0.247 0.064 0.245 Infraction FEs No Yes Yes No Yes Yes Yes Yes Yes Yes Year FEs No No No No No No No No Yes No Grade FEs No No No No No No No No Yes No SGY FEs No No Yes No No Yes No Yes No Yes Notes. The unit of observation is the infraction, and the sample is restricted to students who were suspended. The number of days suspended is censored to 20 for suspensions that exceeded 20 days. Standard errors appear in parentheses and account for the clustering of students within school-grade-year. “SGY FEs” refers to school-grade-year fixed effects. *** p<0.01, ** p<0.05, * p<0.1
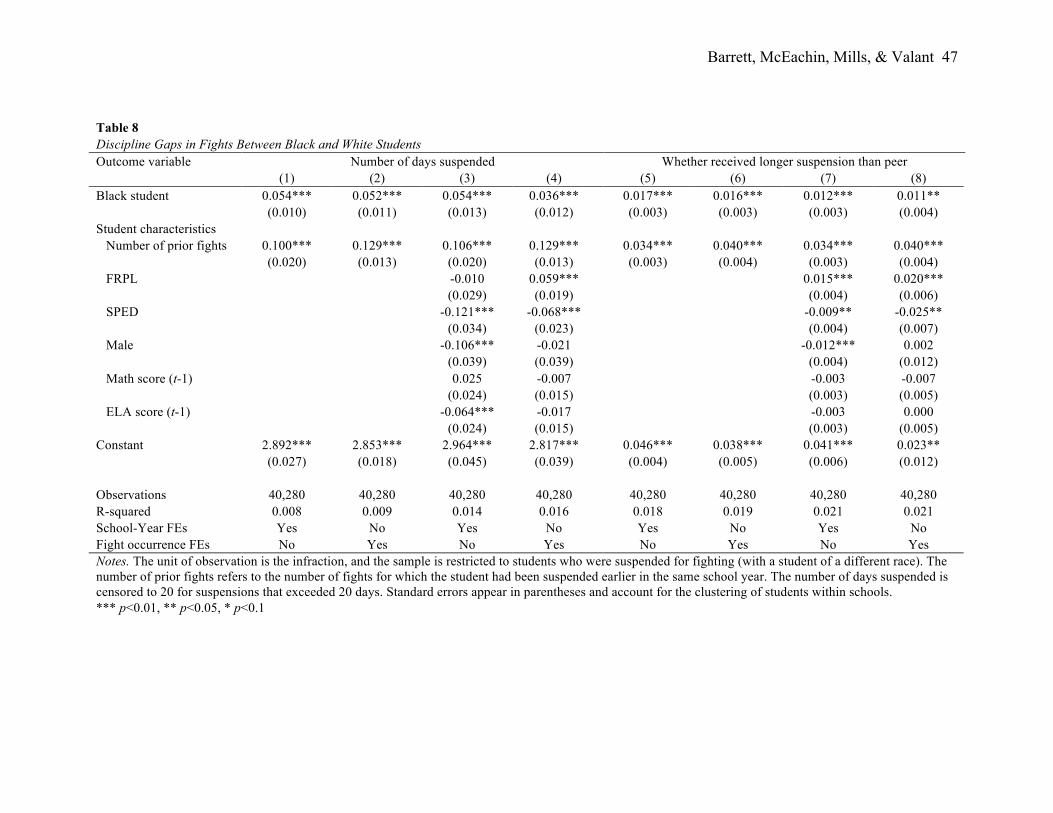
Barrett, McEachin, Mills, & Valant 47
Table 8 Discipline Gaps in Fights Between Black and White Students Outcome variable Number of days suspended Whether received longer suspension than peer (1) (2) (3) (4) (5) (6) (7) (8) Black student 0.054*** 0.052*** 0.054*** 0.036*** 0.017*** 0.016*** 0.012*** 0.011** (0.010) (0.011) (0.013) (0.012) (0.003) (0.003) (0.003) (0.004) Student characteristics Number of prior fights 0.100*** 0.129*** 0.106*** 0.129*** 0.034*** 0.040*** 0.034*** 0.040*** (0.020) (0.013) (0.020) (0.013) (0.003) (0.004) (0.003) (0.004) FRPL -0.010 0.059*** 0.015*** 0.020*** (0.029) (0.019) (0.004) (0.006) SPED -0.121*** -0.068*** -0.009** -0.025** (0.034) (0.023) (0.004) (0.007) Male -0.106*** -0.021 -0.012*** 0.002 (0.039) (0.039) (0.004) (0.012) Math score (t-1) 0.025 -0.007 -0.003 -0.007 (0.024) (0.015) (0.003) (0.005) ELA score (t-1) -0.064*** -0.017 -0.003 0.000 (0.024) (0.015) (0.003) (0.005) Constant 2.892*** 2.853*** 2.964*** 2.817*** 0.046*** 0.038*** 0.041*** 0.023** (0.027) (0.018) (0.045) (0.039) (0.004) (0.005) (0.006) (0.012) Observations 40,280 40,280 40,280 40,280 40,280 40,280 40,280 40,280 R-squared 0.008 0.009 0.014 0.016 0.018 0.019 0.021 0.021 School-Year FEs Yes No Yes No Yes No Yes No Fight occurrence FEs No Yes No Yes No Yes No Yes Notes. The unit of observation is the infraction, and the sample is restricted to students who were suspended for fighting (with a student of a different race). The number of prior fights refers to the number of fights for which the student had been suspended earlier in the same school year. The number of days suspended is censored to 20 for suspensions that exceeded 20 days. Standard errors appear in parentheses and account for the clustering of students within schools. *** p<0.01, ** p<0.05, * p<0.1
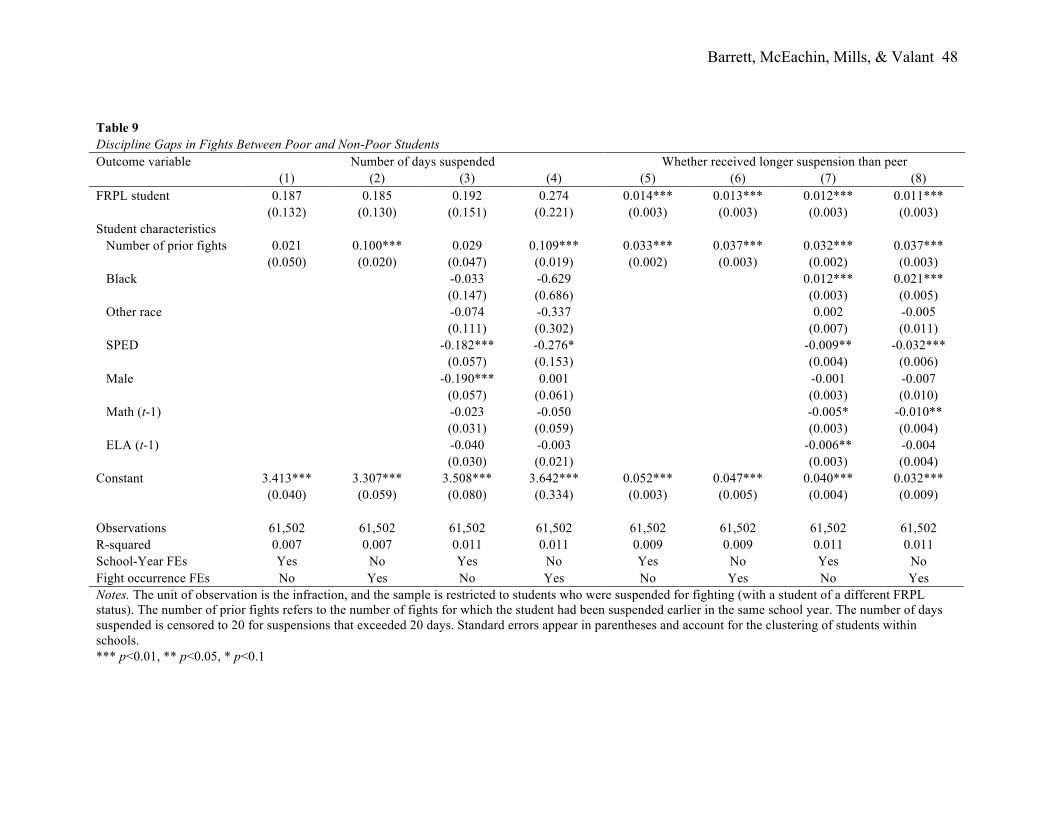
Barrett, McEachin, Mills, & Valant 48
Table 9 Discipline Gaps in Fights Between Poor and Non-Poor Students Outcome variable Number of days suspended Whether received longer suspension than peer (1) (2) (3) (4) (5) (6) (7) (8) FRPL student 0.187 0.185 0.192 0.274 0.014*** 0.013*** 0.012*** 0.011*** (0.132) (0.130) (0.151) (0.221) (0.003) (0.003) (0.003) (0.003) Student characteristics Number of prior fights 0.021 0.100*** 0.029 0.109*** 0.033*** 0.037*** 0.032*** 0.037*** (0.050) (0.020) (0.047) (0.019) (0.002) (0.003) (0.002) (0.003) Black -0.033 -0.629 0.012*** 0.021*** (0.147) (0.686) (0.003) (0.005) Other race -0.074 -0.337 0.002 -0.005 (0.111) (0.302) (0.007) (0.011) SPED -0.182*** -0.276* -0.009** -0.032*** (0.057) (0.153) (0.004) (0.006) Male -0.190*** 0.001 -0.001 -0.007 (0.057) (0.061) (0.003) (0.010) Math (t-1) -0.023 -0.050 -0.005* -0.010** (0.031) (0.059) (0.003) (0.004) ELA (t-1) -0.040 -0.003 -0.006** -0.004 (0.030) (0.021) (0.003) (0.004) Constant 3.413*** 3.307*** 3.508*** 3.642*** 0.052*** 0.047*** 0.040*** 0.032*** (0.040) (0.059) (0.080) (0.334) (0.003) (0.005) (0.004) (0.009) Observations 61,502 61,502 61,502 61,502 61,502 61,502 61,502 61,502 R-squared 0.007 0.007 0.011 0.011 0.009 0.009 0.011 0.011 School-Year FEs Yes No Yes No Yes No Yes No Fight occurrence FEs No Yes No Yes No Yes No Yes Notes. The unit of observation is the infraction, and the sample is restricted to students who were suspended for fighting (with a student of a different FRPL status). The number of prior fights refers to the number of fights for which the student had been suspended earlier in the same school year. The number of days suspended is censored to 20 for suspensions that exceeded 20 days. Standard errors appear in parentheses and account for the clustering of students within schools. *** p<0.01, ** p<0.05, * p<0.1
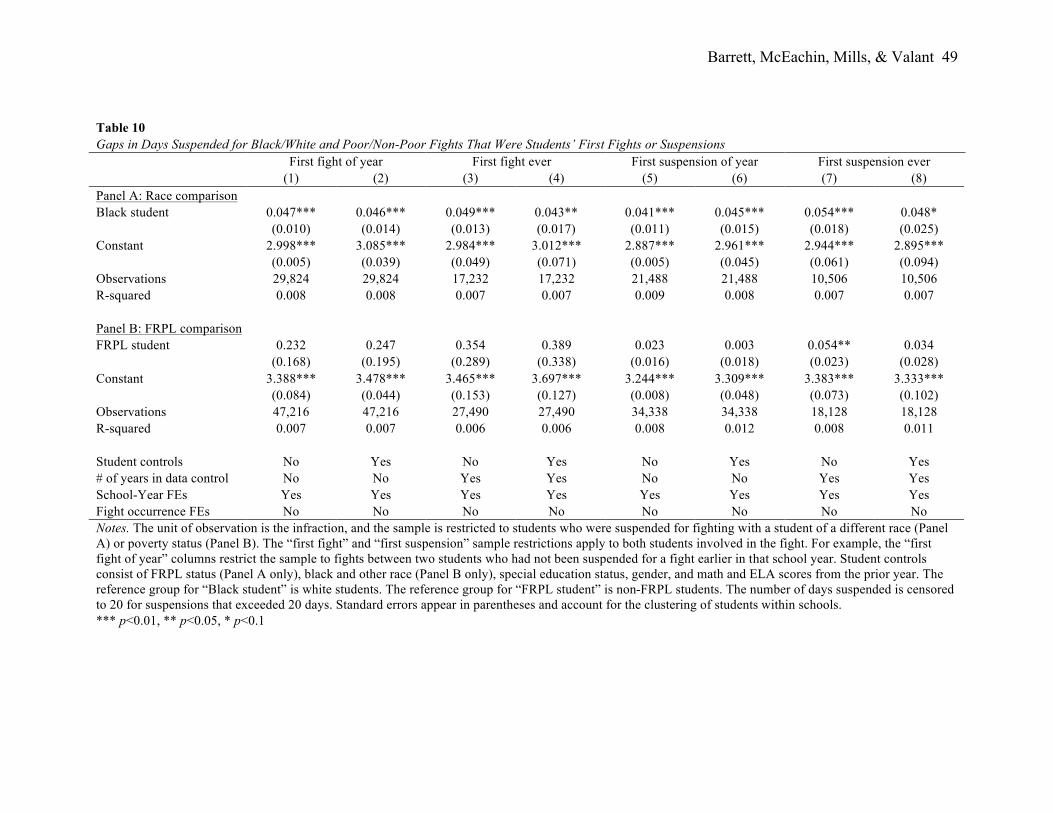
Barrett, McEachin, Mills, & Valant 49
Table 10 Gaps in Days Suspended for Black/White and Poor/Non-Poor Fights That Were Students’ First Fights or Suspensions First fight of year First fight ever First suspension of year First suspension ever (1) (2) (3) (4) (5) (6) (7) (8) Panel A: Race comparison Black student 0.047*** 0.046*** 0.049*** 0.043** 0.041*** 0.045*** 0.054*** 0.048* (0.010) (0.014) (0.013) (0.017) (0.011) (0.015) (0.018) (0.025) Constant 2.998*** 3.085*** 2.984*** 3.012*** 2.887*** 2.961*** 2.944*** 2.895*** (0.005) (0.039) (0.049) (0.071) (0.005) (0.045) (0.061) (0.094) Observations 29,824 29,824 17,232 17,232 21,488 21,488 10,506 10,506 R-squared 0.008 0.008 0.007 0.007 0.009 0.008 0.007 0.007 Panel B: FRPL comparison FRPL student 0.232 0.247 0.354 0.389 0.023 0.003 0.054** 0.034 (0.168) (0.195) (0.289) (0.338) (0.016) (0.018) (0.023) (0.028) Constant 3.388*** 3.478*** 3.465*** 3.697*** 3.244*** 3.309*** 3.383*** 3.333*** (0.084) (0.044) (0.153) (0.127) (0.008) (0.048) (0.073) (0.102) Observations 47,216 47,216 27,490 27,490 34,338 34,338 18,128 18,128 R-squared 0.007 0.007 0.006 0.006 0.008 0.012 0.008 0.011 Student controls No Yes No Yes No Yes No Yes # of years in data control No No Yes Yes No No Yes Yes School-Year FEs Yes Yes Yes Yes Yes Yes Yes Yes Fight occurrence FEs No No No No No No No No Notes. The unit of observation is the infraction, and the sample is restricted to students who were suspended for fighting with a student of a different race (Panel A) or poverty status (Panel B). The “first fight” and “first suspension” sample restrictions apply to both students involved in the fight. For example, the “first fight of year” columns restrict the sample to fights between two students who had not been suspended for a fight earlier in that school year. Student controls consist of FRPL status (Panel A only), black and other race (Panel B only), special education status, gender, and math and ELA scores from the prior year. The reference group for “Black student” is white students. The reference group for “FRPL student” is non-FRPL students. The number of days suspended is censored to 20 for suspensions that exceeded 20 days. Standard errors appear in parentheses and account for the clustering of students within schools. *** p<0.01, ** p<0.05, * p<0.1
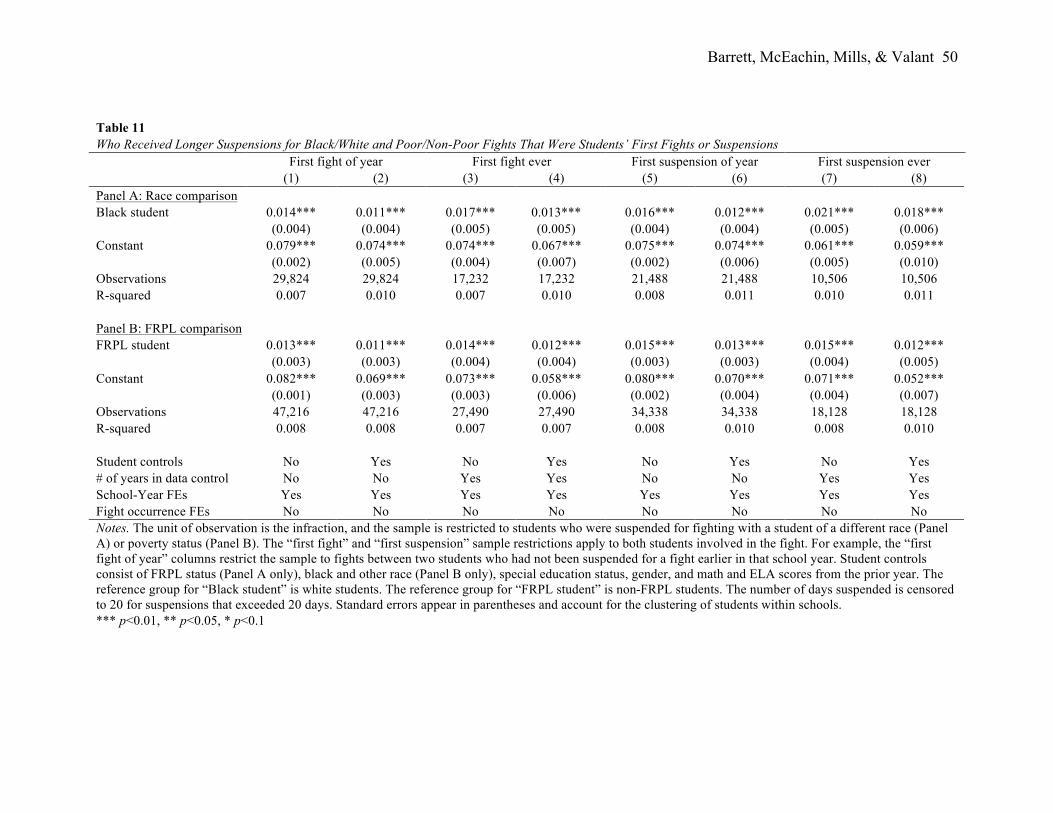
Barrett, McEachin, Mills, & Valant 50
Table 11 Who Received Longer Suspensions for Black/White and Poor/Non-Poor Fights That Were Students’ First Fights or Suspensions First fight of year First fight ever First suspension of year First suspension ever (1) (2) (3) (4) (5) (6) (7) (8) Panel A: Race comparison Black student 0.014*** 0.011*** 0.017*** 0.013*** 0.016*** 0.012*** 0.021*** 0.018*** (0.004) (0.004) (0.005) (0.005) (0.004) (0.004) (0.005) (0.006) Constant 0.079*** 0.074*** 0.074*** 0.067*** 0.075*** 0.074*** 0.061*** 0.059*** (0.002) (0.005) (0.004) (0.007) (0.002) (0.006) (0.005) (0.010) Observations 29,824 29,824 17,232 17,232 21,488 21,488 10,506 10,506 R-squared 0.007 0.010 0.007 0.010 0.008 0.011 0.010 0.011 Panel B: FRPL comparison FRPL student 0.013*** 0.011*** 0.014*** 0.012*** 0.015*** 0.013*** 0.015*** 0.012*** (0.003) (0.003) (0.004) (0.004) (0.003) (0.003) (0.004) (0.005) Constant 0.082*** 0.069*** 0.073*** 0.058*** 0.080*** 0.070*** 0.071*** 0.052*** (0.001) (0.003) (0.003) (0.006) (0.002) (0.004) (0.004) (0.007) Observations 47,216 47,216 27,490 27,490 34,338 34,338 18,128 18,128 R-squared 0.008 0.008 0.007 0.007 0.008 0.010 0.008 0.010 Student controls No Yes No Yes No Yes No Yes # of years in data control No No Yes Yes No No Yes Yes School-Year FEs Yes Yes Yes Yes Yes Yes Yes Yes Fight occurrence FEs No No No No No No No No Notes. The unit of observation is the infraction, and the sample is restricted to students who were suspended for fighting with a student of a different race (Panel A) or poverty status (Panel B). The “first fight” and “first suspension” sample restrictions apply to both students involved in the fight. For example, the “first fight of year” columns restrict the sample to fights between two students who had not been suspended for a fight earlier in that school year. Student controls consist of FRPL status (Panel A only), black and other race (Panel B only), special education status, gender, and math and ELA scores from the prior year. The reference group for “Black student” is white students. The reference group for “FRPL student” is non-FRPL students. The number of days suspended is censored to 20 for suspensions that exceeded 20 days. Standard errors appear in parentheses and account for the clustering of students within schools. *** p<0.01, ** p<0.05, * p<0.1
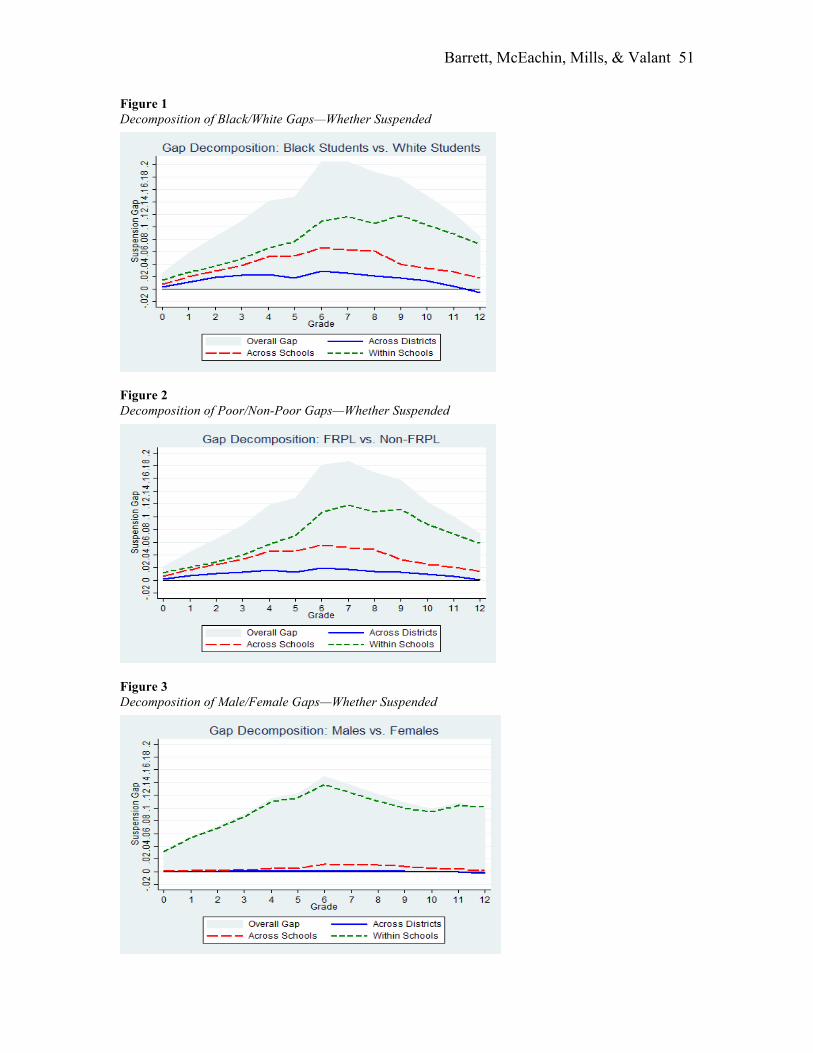
Barrett, McEachin, Mills, & Valant 51
Figure 1 Decomposition of Black/White Gaps—Whether Suspended
Figure 2 Decomposition of Poor/Non-Poor Gaps—Whether Suspended
Figure 3 Decomposition of Male/Female Gaps—Whether Suspended

Barrett, McEachin, Mills, & Valant 52
Figure 4 Decomposition of Black/White Gaps—Number of Days Suspended
Note: Sample is restricted to students with at least one suspension in given school year. Figure 5 Decomposition of Poor/Non-Poor Gaps—Number of Days Suspended
Note: Sample is restricted to students with at least one suspension in given school year. Figure 6 Decomposition of Male/Female Gaps—Number of Days Suspended
Note: Sample is restricted to students with at least one suspension in given school year.
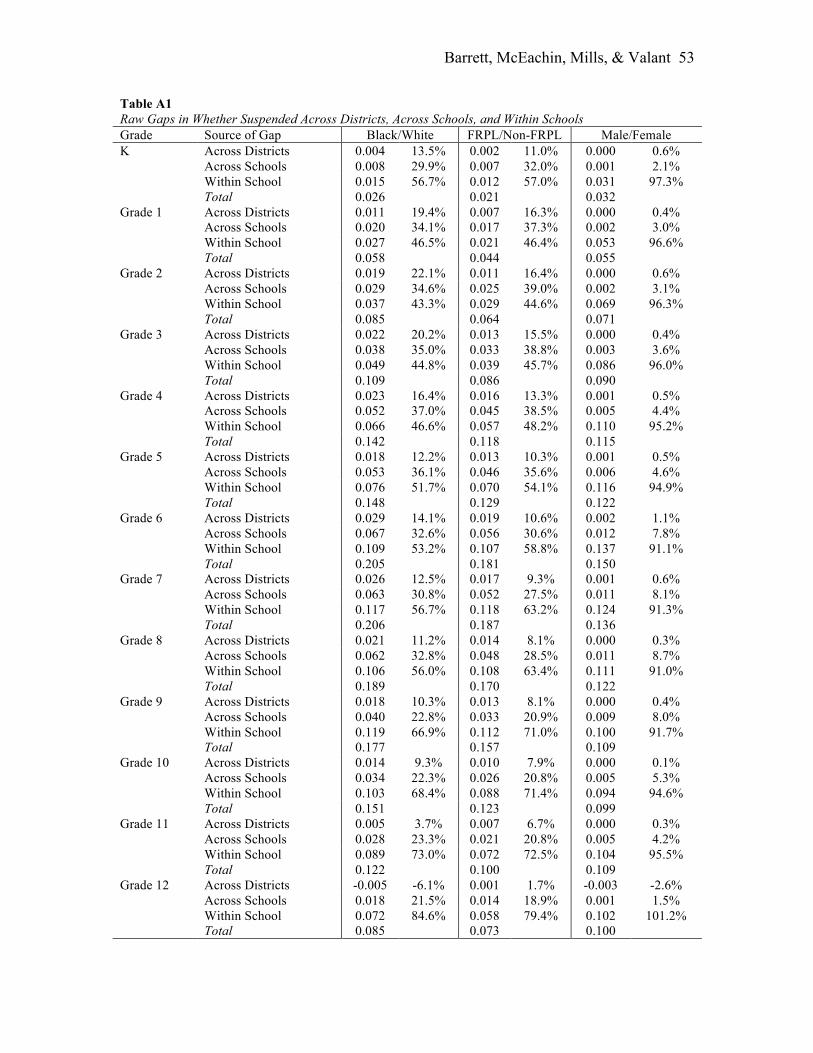
Barrett, McEachin, Mills, & Valant 53
Table A1 Raw Gaps in Whether Suspended Across Districts, Across Schools, and Within Schools Grade Source of Gap Black/White FRPL/Non-FRPL Male/Female K Across Districts 0.004 13.5% 0.002 11.0% 0.000 0.6%
Across Schools 0.008 29.9% 0.007 32.0% 0.001 2.1%
Within School 0.015 56.7% 0.012 57.0% 0.031 97.3%
Total 0.026 0.021 0.032 Grade 1 Across Districts 0.011 19.4% 0.007 16.3% 0.000 0.4%
Across Schools 0.020 34.1% 0.017 37.3% 0.002 3.0%
Within School 0.027 46.5% 0.021 46.4% 0.053 96.6%
Total 0.058 0.044 0.055 Grade 2 Across Districts 0.019 22.1% 0.011 16.4% 0.000 0.6%
Across Schools 0.029 34.6% 0.025 39.0% 0.002 3.1%
Within School 0.037 43.3% 0.029 44.6% 0.069 96.3%
Total 0.085 0.064 0.071 Grade 3 Across Districts 0.022 20.2% 0.013 15.5% 0.000 0.4%
Across Schools 0.038 35.0% 0.033 38.8% 0.003 3.6%
Within School 0.049 44.8% 0.039 45.7% 0.086 96.0%
Total 0.109 0.086 0.090 Grade 4 Across Districts 0.023 16.4% 0.016 13.3% 0.001 0.5%
Across Schools 0.052 37.0% 0.045 38.5% 0.005 4.4%
Within School 0.066 46.6% 0.057 48.2% 0.110 95.2%
Total 0.142 0.118 0.115 Grade 5 Across Districts 0.018 12.2% 0.013 10.3% 0.001 0.5%
Across Schools 0.053 36.1% 0.046 35.6% 0.006 4.6%
Within School 0.076 51.7% 0.070 54.1% 0.116 94.9%
Total 0.148 0.129 0.122 Grade 6 Across Districts 0.029 14.1% 0.019 10.6% 0.002 1.1%
Across Schools 0.067 32.6% 0.056 30.6% 0.012 7.8%
Within School 0.109 53.2% 0.107 58.8% 0.137 91.1%
Total 0.205 0.181 0.150 Grade 7 Across Districts 0.026 12.5% 0.017 9.3% 0.001 0.6%
Across Schools 0.063 30.8% 0.052 27.5% 0.011 8.1%
Within School 0.117 56.7% 0.118 63.2% 0.124 91.3%
Total 0.206 0.187 0.136 Grade 8 Across Districts 0.021 11.2% 0.014 8.1% 0.000 0.3%
Across Schools 0.062 32.8% 0.048 28.5% 0.011 8.7%
Within School 0.106 56.0% 0.108 63.4% 0.111 91.0%
Total 0.189 0.170 0.122 Grade 9 Across Districts 0.018 10.3% 0.013 8.1% 0.000 0.4%
Across Schools 0.040 22.8% 0.033 20.9% 0.009 8.0%
Within School 0.119 66.9% 0.112 71.0% 0.100 91.7%
Total 0.177 0.157 0.109 Grade 10 Across Districts 0.014 9.3% 0.010 7.9% 0.000 0.1%
Across Schools 0.034 22.3% 0.026 20.8% 0.005 5.3%
Within School 0.103 68.4% 0.088 71.4% 0.094 94.6%
Total 0.151 0.123 0.099 Grade 11 Across Districts 0.005 3.7% 0.007 6.7% 0.000 0.3%
Across Schools 0.028 23.3% 0.021 20.8% 0.005 4.2%
Within School 0.089 73.0% 0.072 72.5% 0.104 95.5%
Total 0.122 0.100 0.109 Grade 12 Across Districts -0.005 -6.1% 0.001 1.7% -0.003 -2.6%
Across Schools 0.018 21.5% 0.014 18.9% 0.001 1.5%
Within School 0.072 84.6% 0.058 79.4% 0.102 101.2%
Total 0.085 0.073 0.100
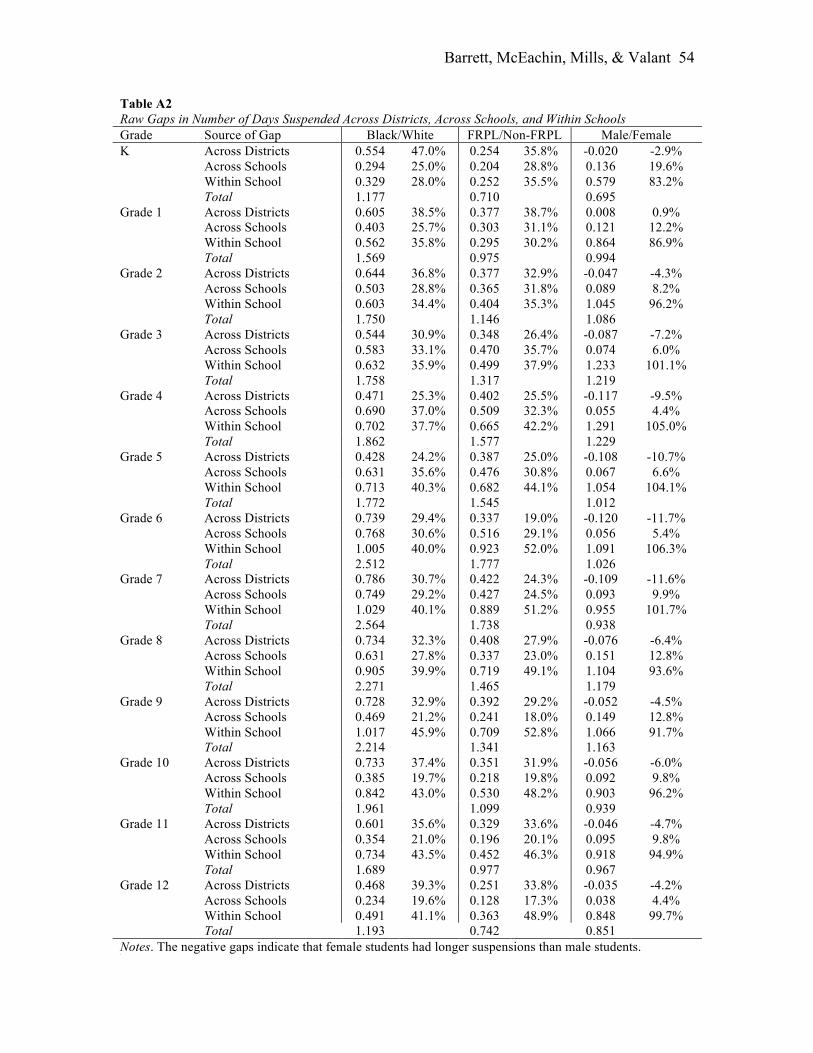
Barrett, McEachin, Mills, & Valant 54
Table A2 Raw Gaps in Number of Days Suspended Across Districts, Across Schools, and Within Schools Grade Source of Gap Black/White FRPL/Non-FRPL Male/Female K Across Districts 0.554 47.0% 0.254 35.8% -0.020 -2.9%
Across Schools 0.294 25.0% 0.204 28.8% 0.136 19.6%
Within School 0.329 28.0% 0.252 35.5% 0.579 83.2%
Total 1.177 0.710 0.695 Grade 1 Across Districts 0.605 38.5% 0.377 38.7% 0.008 0.9%
Across Schools 0.403 25.7% 0.303 31.1% 0.121 12.2%
Within School 0.562 35.8% 0.295 30.2% 0.864 86.9%
Total 1.569 0.975 0.994 Grade 2 Across Districts 0.644 36.8% 0.377 32.9% -0.047 -4.3%
Across Schools 0.503 28.8% 0.365 31.8% 0.089 8.2%
Within School 0.603 34.4% 0.404 35.3% 1.045 96.2%
Total 1.750 1.146 1.086 Grade 3 Across Districts 0.544 30.9% 0.348 26.4% -0.087 -7.2%
Across Schools 0.583 33.1% 0.470 35.7% 0.074 6.0%
Within School 0.632 35.9% 0.499 37.9% 1.233 101.1%
Total 1.758 1.317 1.219 Grade 4 Across Districts 0.471 25.3% 0.402 25.5% -0.117 -9.5%
Across Schools 0.690 37.0% 0.509 32.3% 0.055 4.4%
Within School 0.702 37.7% 0.665 42.2% 1.291 105.0%
Total 1.862 1.577 1.229 Grade 5 Across Districts 0.428 24.2% 0.387 25.0% -0.108 -10.7%
Across Schools 0.631 35.6% 0.476 30.8% 0.067 6.6%
Within School 0.713 40.3% 0.682 44.1% 1.054 104.1%
Total 1.772 1.545 1.012 Grade 6 Across Districts 0.739 29.4% 0.337 19.0% -0.120 -11.7%
Across Schools 0.768 30.6% 0.516 29.1% 0.056 5.4%
Within School 1.005 40.0% 0.923 52.0% 1.091 106.3%
Total 2.512 1.777 1.026 Grade 7 Across Districts 0.786 30.7% 0.422 24.3% -0.109 -11.6%
Across Schools 0.749 29.2% 0.427 24.5% 0.093 9.9%
Within School 1.029 40.1% 0.889 51.2% 0.955 101.7%
Total 2.564 1.738 0.938 Grade 8 Across Districts 0.734 32.3% 0.408 27.9% -0.076 -6.4%
Across Schools 0.631 27.8% 0.337 23.0% 0.151 12.8%
Within School 0.905 39.9% 0.719 49.1% 1.104 93.6%
Total 2.271 1.465 1.179 Grade 9 Across Districts 0.728 32.9% 0.392 29.2% -0.052 -4.5%
Across Schools 0.469 21.2% 0.241 18.0% 0.149 12.8%
Within School 1.017 45.9% 0.709 52.8% 1.066 91.7%
Total 2.214 1.341 1.163 Grade 10 Across Districts 0.733 37.4% 0.351 31.9% -0.056 -6.0%
Across Schools 0.385 19.7% 0.218 19.8% 0.092 9.8%
Within School 0.842 43.0% 0.530 48.2% 0.903 96.2%
Total 1.961 1.099 0.939 Grade 11 Across Districts 0.601 35.6% 0.329 33.6% -0.046 -4.7%
Across Schools 0.354 21.0% 0.196 20.1% 0.095 9.8%
Within School 0.734 43.5% 0.452 46.3% 0.918 94.9%
Total 1.689 0.977 0.967 Grade 12 Across Districts 0.468 39.3% 0.251 33.8% -0.035 -4.2%
Across Schools 0.234 19.6% 0.128 17.3% 0.038 4.4%
Within School 0.491 41.1% 0.363 48.9% 0.848 99.7%
Total 1.193 0.742 0.851 Notes. The negative gaps indicate that female students had longer suspensions than male students. S

Barrett, McEachin, Mills, & Valant 55
Table A3 Predictors of Whether Students were Suspended, Weighted Models (1) (2) (3) (4) (5) (6) (7) (8) (9) Black 0.128*** 0.125*** 0.115*** 0.128*** 0.126*** 0.125***
(0.001) (0.001) (0.001) (0.001) (0.001) (0.001) Other race -0.017*** -0.014*** -0.011***
(0.001) (0.001) (0.003) FRPL 0.091*** 0.088*** 0.085***
(0.001) (0.000) (0.000) Constant 0.122*** 0.123*** 0.129*** 0.122*** 0.123*** 0.149*** 0.124*** 0.126*** 0.119***
(0.001) (0.000) (0.000) (0.001) (0.000) (0.001) (0.001) (0.000) (0.000)
Observations 9,432,233 9,432,233 8,464,345 9,981,117 9,981,117 7,674,447 9,989,263 9,989,263 9,829,624 R-squared 0.027 0.192 0.198 0.029 0.190 0.192 0.013 0.184 0.192 SGY FEs No Yes Yes No Yes Yes No Yes Yes Weights No No Yes No No Yes No No Yes Notes. The unit of observation is the student-year. Standard errors appear in parentheses and account for the clustering of students within school-grade-year. “SGY FEs” refers to school-grade-year fixed effects. Weighted regressions account for the extent to which race and income proportions vary across SGY cells. The regression in Column 3 is weighted by 1/p(Black)p(White) for each SGY cell. The regression in Column 6 is weighted by 1/p(Black)p(White)p(Other race) in each SGY cell. The regression in Column 9 is weighted by 1/p(FRPL)p(not FRPL) in each SGY cell. *** p<0.01, ** p<0.05, * p<0.1

Barrett, McEachin, Mills, & Valant 56
Table A4 Predictors of Whether Students were Suspended Multiple Times in Same Year, Weighted Models (1) (2) (3) (4) (5) (6) (7) (8) (9) Black 0.082*** 0.083*** 0.075*** 0.082*** 0.083*** 0.082***
(0.001) (0.001) (0.001) (0.001) (0.000) (0.001) Other race -0.008*** -0.006*** 0.000
(0.001) (0.000) (0.002) FRPL 0.059*** 0.055*** 0.052***
(0.000) (0.000) (0.000) Constant 0.055*** 0.055*** 0.055*** 0.055*** 0.055*** 0.065*** 0.056*** 0.059*** 0.055***
(0.000) (0.000) (0.000) (0.000) (0.000) (0.001) (0.000) (0.000) (0.000)
Observations 9,432,233 9,432,233 8,464,345 9,981,117 9,981,117 7,674,447 9,989,263 9,989,263 9,829,624 R-squared 0.020 0.162 0.163 0.020 0.160 0.161 0.010 0.154 0.164 SGY FEs No Yes Yes No Yes Yes No Yes Yes Weights No No Yes No No Yes No No Yes Notes. The unit of observation is the student-year. Standard errors appear in parentheses and account for the clustering of students within school-grade-year. “SGY FEs” refers to school-grade-year fixed effects. Weighted regressions account for the extent to which race and income proportions vary across SGY cells. The regression in Column 3 is weighted by 1/p(Black)p(White) for each SGY cell. The regression in Column 6 is weighted by 1/p(Black)p(White)p(other Race) in each SGY cell. The regression in Column 9 is weighted by 1/p(FRPL)p(not FRPL) in each SGY cell. *** p<0.01, ** p<0.05, * p<0.1 asdfaa