Embed Size (px)
Citation preview

RESEARCH Open Access
Disome-seq reveals widespread ribosomecollisions that promote cotranslationalprotein foldingTaolan Zhao1,2*†, Yan-Ming Chen1,2,3†, Yu Li4,5†, Jia Wang1,2,3, Siyu Chen1,2,3, Ning Gao5* and Wenfeng Qian1,2,3*
* Correspondence: [email protected]; [email protected]; [email protected]†Taolan Zhao, Yan-Ming Chen andYu Li contributed equally to thiswork.1State Key Laboratory of PlantGenomics, Institute of Genetics andDevelopmental Biology, InnovationAcademy for Seed Design, ChineseAcademy of Sciences, Beijing100101, China5State Key Laboratory of MembraneBiology, Peking-Tsinghua Center forLife Sciences, School of LifeSciences, Peking University, Beijing100871, ChinaFull list of author information isavailable at the end of the article
Abstract
Background: The folding of proteins is challenging in the highly crowded and stickyenvironment of a cell. Regulation of translation elongation may play a crucial role inensuring the correct folding of proteins. Much of our knowledge regarding translationelongation comes from the sequencing of mRNA fragments protected by singleribosomes by ribo-seq. However, larger protected mRNA fragments have beenobserved, suggesting the existence of an alternative and previously hidden layer ofregulation.
Results: In this study, we performed disome-seq to sequence mRNA fragmentsprotected by two stacked ribosomes, a product of translational pauses during whichthe 5′-elongating ribosome collides with the 3′-paused one. We detected widespreadribosome collisions that are related to slow ribosome release when stop codons are atthe A-site, slow peptide bond formation from proline, glycine, asparagine, and cysteinewhen they are at the P-site, and slow leaving of polylysine from the exit tunnel ofribosomes. The structure of disomes obtained by cryo-electron microscopy suggests adifferent conformation from the substrate of the ribosome-associated protein qualitycontrol pathway. Collisions occurred more frequently in the gap regions between α-helices, where a translational pause can prevent the folding interference from thedownstream peptides. Paused or collided ribosomes are associated with specificchaperones, which can aid in the cotranslational folding of the nascent peptides.
Conclusions: Therefore, cells use regulated ribosome collisions to ensure proteinhomeostasis.
Keywords: Translation elongation, Disome-seq, Ribosome collision, Translational pause,Ribosome release, Ribosome-associated chaperones, Cotranslational protein folding,Protein homeostasis, Disome structure
BackgroundTranslation elongation is a crucial process through which the genetic information in a
transcript is sequentially decoded into a peptide chain by ribosomes. Yet, the mRNA
sequence of coding regions can harbor more information than the amino-acid se-
quence [1]; the local rate of translation elongation is non-uniform and fine-tuned [2,
© The Author(s). 2021 Open Access This article is licensed under a Creative Commons Attribution 4.0 International License, whichpermits use, sharing, adaptation, distribution and reproduction in any medium or format, as long as you give appropriate credit tothe original author(s) and the source, provide a link to the Creative Commons licence, and indicate if changes were made. Theimages or other third party material in this article are included in the article's Creative Commons licence, unless indicated otherwisein a credit line to the material. If material is not included in the article's Creative Commons licence and your intended use is notpermitted by statutory regulation or exceeds the permitted use, you will need to obtain permission directly from the copyrightholder. To view a copy of this licence, visit http://creativecommons.org/licenses/by/4.0/. The Creative Commons Public DomainDedication waiver (http://creativecommons.org/publicdomain/zero/1.0/) applies to the data made available in this article, unlessotherwise stated in a credit line to the data.
Zhao et al. Genome Biology (2021) 22:16 https://doi.org/10.1186/s13059-020-02256-0

3]. Programmed variation in elongation rate may participate in the regulation of protein
folding [2, 4, 5], which is challenging within the crowded and sticky cellular environ-
ments [6, 7]. A change in the rate of translation elongation can result in protein mis-
folding [2, 5], which further leads to developmental abnormalities, neurologic diseases,
and cancers [8].
Despite the importance of translation elongation, it has been mainly studied with
heterologous reporter genes [9–11]. A strong ribosomal stalling signal was often placed
in these reporter genes; the 5′-elongating ribosome collides with the stalled ribosome,
leading to a di-ribosome (we hereafter refer such stacked ribosomes induced by a
strong ribosomal stalling signal in heterologous reporters as to di-ribosomes) or even
tri-ribosome. Structure analyses indicated that di-ribosomes and tri-ribosomes were
often unable to resume translation and can trigger the ribosome-associated protein
quality control (RQC) pathway [9, 12–16].
The knowledge of the causes for endogenous translational pausing remains highly
limited, mainly because the detection of translational pauses is technically challen-
ging in endogenous genes. The development of ribo-seq, an approach that se-
quences ribosome-protected mRNA fragments at codon resolution, significantly
increased our knowledge on translation elongation [17, 18]. Accumulation of ribo-
some footprints at a site indicates slow translation elongation (i.e., a translational
pause); based on this idea, sequence determinants of translation elongation have
been discovered, such as synonymous codon usage [19–21], positively charged nas-
cent peptides [22], and mRNA secondary structures [23]. However, traditional ribo-
seq misses the information of ribosome collisions [24, 25]. Instead, ribosome colli-
sions can be studied by sequencing the mRNA fragments protected by disomes,
which refer to endogenous stacked ribosomes in this study. Disomes were detect-
able by sucrose gradient centrifugation [26] and were observed in faulty mRNAs or
3′-untranslated regions [24]. However, the genomic landscape and the sequence
determinants of endogenous ribosome collisions remain largely unknown in the
coding sequences of faithfully transcribed mRNAs.
The consequence of endogenous translational pausing also remains unclear. It has been
suggested that translation elongation can regulate cotranslational protein folding [2, 4, 5,
27, 28]. For example, accumulating evidence supported that the CAG expansion in Hun-
tington’s disease led to incorrect translational pausing and thereby improper folding of
the signal peptide for the subcellular localization of the Htt protein [29]. Non-optimal co-
dons formed clusters during evolution [30, 31]; they may create slow-translation regions
and participate in protein folding [32]. However, the mechanisms by which translational
pauses regulate cotranslational protein folding remain understudied.
In this study, we captured the mRNA footprints protected by two stacked
ribosomes in fast proliferating yeast cells. Such data provide a chance to reveal the
translational dynamics that are undetectable by the traditional ribo-seq (i.e.,
monosome-seq). We identify the sequence features that are associated with ribo-
some collisions and validate some features with reporter genes. Cryo-electron mi-
croscopy (cryo-EM) analyses indicate that the majority of endogenous ribosome
collisions form a different structure from the RQC-inducing di-ribosomes. With
bioinformatics analyses, we show that ribosome pauses or collisions tend to take
place in the gap regions between α-helices. In fact, paused or collided ribosomes
Zhao et al. Genome Biology (2021) 22:16 Page 2 of 35

are often associated with specific chaperones that can assist protein folding, as in-
dicated by mass spectrometry analyses. As a consequence, a nascent peptide is
ready to be correctly folded during translation.
ResultsTranslational pauses generate disomes from collisions of ribosomes
Most mRNAs are associated with multiple ribosomes [33], and the speed of transla-
tional elongation varies, with some events such as tRNA depletion, known to cause ri-
bosomes to slow down and even to pause translation [8]. We therefore hypothesized
that a slowdown or pause of one leading ribosome might generate a collision between
the paused ribosome and the 5′-elongating ribosome. These collisions would result in a
single RNase I resistant fragment with approximately twice the footprint length of a
single ribosome (Fig. 1a).
To test this idea, we extracted ribosome-bound mRNA from exponentially divid-
ing yeast cells, digested the unprotected mRNA using RNase I, and performed su-
crose gradient ultracentrifugation to separate particles of different densities. In
addition to the abundant monosome particles, we observed a significant amount of
particles whose density was the same as that of pre-digestion transcripts bound by
two ribosomes, suggesting that the particle contains two ribosomes (Fig. 1b). These
disomes persisted with increased RNase I concentration, indicating that they are
not the result of incomplete digestion (Additional file 1: Fig. S1). We estimated the
relative abundance of monosomes and disomes from the area ratio of the mono-
some and disome fractions in the profile. The ratio was approximately 16.3:1
(Fig. 1b, right panel), suggesting that the population ratio of monosomes and dis-
omes is 32.6:1. In other words, (1/(16.3 + 1) =) 5.8% ribosomes are trapped in dis-
omes in fast-proliferating yeast cells.
To determine if disomes were caused by paused ribosomes, we induced translational
pauses at histidine codons by growing yeast in a low dose of 3-amino-1,2,4-triazole (3-
AT), an inhibitor of histidine biosynthesis [34]. We performed high-throughput se-
quencing on monosome (monosome-seq) and disome (disome-seq) fragments (Fig. 1c,
Additional file 1: Fig. S2a and Table S1–3) developed in previous studies [17, 24]. Con-
sistent with previous observations [17], in-frame 28-nucleotide (nt) footprints were
most abundant in the monosome library (Additional file 1: Fig. S3a). In contrast, the
most abundant footprints in disome-seq were 58 and 59-nt when cells were treated
with 3-AT, with the 58-nt footprints being in-frame (Fig. 1d). As a negative control,
randomly fragmented ~ 28-nt mRNA-seq reads did not display any 3-nt periodicity
(Additional file 1: Fig. S3b).
During histidine starvation, ribosomes should be paused when the histidine
codon CAC or CAT is at the A-site, where decoding takes place. Consistently, the
main peak in the 28-nt monosome footprints (the 5′-end) was 15-nt upstream of
the histidine codons (Fig. 1e). The main peak of the 58-nt disome footprints was
45-nt upstream of the histidine codons, 30-nt upstream of the 15-nt peak from the
monosome footprints (Fig. 1e). This 30-nt spacing between the two peaks perfectly
fits one in-frame ribosome, suggesting that the 58-nt disome footprints were com-
posed of two collided ribosomes of which the 3′-leading one was paused. The
Zhao et al. Genome Biology (2021) 22:16 Page 3 of 35
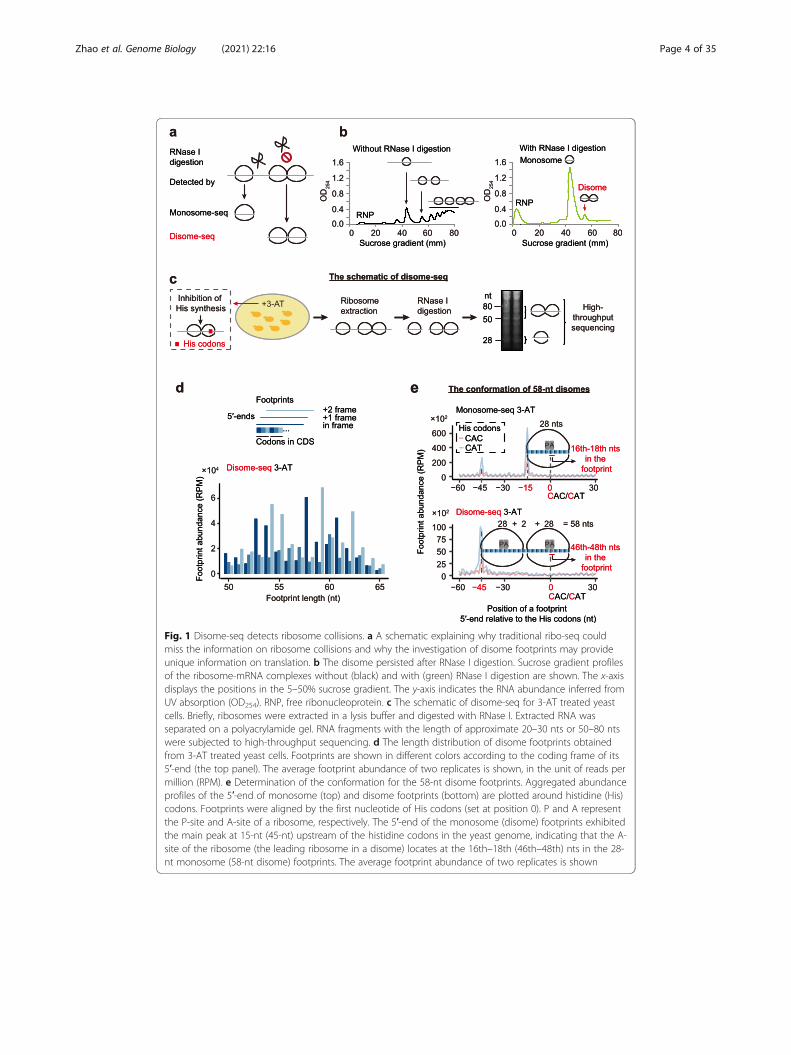
Fig. 1 Disome-seq detects ribosome collisions. a A schematic explaining why traditional ribo-seq couldmiss the information on ribosome collisions and why the investigation of disome footprints may provideunique information on translation. b The disome persisted after RNase I digestion. Sucrose gradient profilesof the ribosome-mRNA complexes without (black) and with (green) RNase I digestion are shown. The x-axisdisplays the positions in the 5–50% sucrose gradient. The y-axis indicates the RNA abundance inferred fromUV absorption (OD254). RNP, free ribonucleoprotein. c The schematic of disome-seq for 3-AT treated yeastcells. Briefly, ribosomes were extracted in a lysis buffer and digested with RNase I. Extracted RNA wasseparated on a polyacrylamide gel. RNA fragments with the length of approximate 20–30 nts or 50–80 ntswere subjected to high-throughput sequencing. d The length distribution of disome footprints obtainedfrom 3-AT treated yeast cells. Footprints are shown in different colors according to the coding frame of its5′-end (the top panel). The average footprint abundance of two replicates is shown, in the unit of reads permillion (RPM). e Determination of the conformation for the 58-nt disome footprints. Aggregated abundanceprofiles of the 5′-end of monosome (top) and disome footprints (bottom) are plotted around histidine (His)codons. Footprints were aligned by the first nucleotide of His codons (set at position 0). P and A representthe P-site and A-site of a ribosome, respectively. The 5′-end of the monosome (disome) footprints exhibitedthe main peak at 15-nt (45-nt) upstream of the histidine codons in the yeast genome, indicating that the A-site of the ribosome (the leading ribosome in a disome) locates at the 16th–18th (46th–48th) nts in the 28-nt monosome (58-nt disome) footprints. The average footprint abundance of two replicates is shown
Zhao et al. Genome Biology (2021) 22:16 Page 4 of 35

Fig. 2 (See legend on next page.)
Zhao et al. Genome Biology (2021) 22:16 Page 5 of 35

sharp peak in Fig. 1e also indicates that disome-seq detects ribosome collisions at
codon resolution.
Disome-seq enables detection of widespread translational pauses which cannot be
identified via monosome sequencing
To determine the genomic locations of ribosome collisions in fast-proliferating cells,
we performed disome-seq, monosome-seq, and mRNA-seq for yeast cells growing in
the mid-log phase in the rich medium (Fig. 2a, b, Additional file 1: Fig. S2b, S3c–f, and
Table S1-S3). Ribosome collisions were observed in 2361 out of the 5124 translated
genes (46%, Fig. 2c). This proportion remained substantial (24%, 1156/4742) when we
applied a more stringent criterion—a gene with collision was called when it was sup-
ported by at least three unique molecular identifiers (UMIs, used to exclude PCR dupli-
cates) in each biological replicate of disome-seq. In general, genes harboring more
ribosomes per mRNA per unit length (i.e., ribosome density, inferred from monosome-
seq) tended to exhibit higher frequency of ribosome collisions (per mRNA per unit
length, ρ = 0.39, P < 2.2 × 10⁻¹⁶, N = 4143, Spearman’s correlation, Fig. 2d). These obser-
vations indicate widespread ribosome collisions in unstressed cells.
There are two possibilities regarding ribosome collisions inside open reading frames
and the relation between translational pauses identified in monosome-seq vs. disome-
seq. The first is that sites with high monosome footprint abundance identify all paused
ribosomes in the cell and that the collisions identified in disome-seq are simply a subset
of them. In this case, it is likely that the upstream ribosome is far 5′ of the paused ribo-
some, and by the time the upstream ribosome approaches, most paused ribosome has
resumed elongation. In this model, all translational pauses identified by disome-seq will
also be identified by monosome-seq. The second possibility is that disome-seq captures
translational pauses that occur at locations not identified by monosome sequencing,
possibly because the collision often occurs not long after the pause of the leading
ribosome.
To differentiate these two possibilities, we measured the intersection of the transla-
tional pausing events from the two methods. Disome-seq often identified translational
(See figure on previous page.)Fig. 2 Disome-seq detects the translational pauses missed in monosome-seq. a The schematic of disome-seqfor yeast cells cultivated in the rich medium. b The length distribution of disome footprints obtained from yeastcells cultivated in the rich medium. Similar to Fig. 1d. c Widespread ribosome collisions were detected in theyeast genome. Numbers of translated genes (genes with at least one monosome footprint) with and withoutdisome footprints are shown in orange and gray, respectively. Footprints in two biological replicates werecombined. 589,461 monosome footprints were used to define translated genes, and the disome-seq footprintswere down-sampled to 18,082 footprints in order to match the population ratio between monosomes anddisomes (32.6:1). d More frequent ribosome collision was observed in the gene with higher monosome density.e The translational pauses detected from monosome footprints (blue) and disome footprints (orange) rarelyoverlapped. Only the codon site with the footprint abundance greater than the mean of the correspondinggene was considered as a translational pause. If the A-site of a monosome footprint overlaps the A-site of theleading ribosome of a disome footprint, the translational pause is considered as “shared.” The disome-seq readswere down-sampled as in Fig. 2c. f Two genes exemplify the unique information of translational pausesobtained by disome-seq. The A-site of a monosome footprint (blue) or that of the leading ribosome of adisome footprint (orange) is shown along the coding sequence (CDS) of CYC8 and TEF4. g The schematic ofestimating the distance (d) to the closest human pause for a yeast pause. h The distribution of d between yeastand humans. The P value was given by the permutation test
Zhao et al. Genome Biology (2021) 22:16 Page 6 of 35

pauses that are undetectable in monosome-seq (Fig. 2e, f). For example, CYC8 is a gene
encoding a general transcriptional co-repressor that can fold as the prion [OCT+] [35];
a translational pause downstream of polyglutamine (polyQ) was detected by disome-
seq instead of monosome-seq (Fig. 2f). Similarly, TEF4p, the γ subunit of the elongation
factor eEF1B, contains a lysine-rich region that is often ubiquitinylated or succinylated
[36, 37]; the downstream translational pause was uniquely detected by disome-seq
(Fig. 2f). The inability of monosome-seq to fully characterize the dynamics of the ribo-
some along the mRNA is likely due to the omission of the disome protected mRNA
fragments (Fig. 1a). Consistently, while the monosome or disome density correlated
well among genes between biological replicates, the correlation between the monosome
and disome densities was much weaker (Additional file 1: Fig. S2).
To determine if ribosome collisions are likely functional and thereby are con-
served over evolution, we retrieved the disome-seq data generated for human
cells in a recent study [38]. We projected disome footprints detected in human
cells to the orthologous positions of the yeast genome based on the amino acid
at the A-site of the paused ribosome. For each ribosome collision in yeast, we es-
timated its distance (d) to the closest counterpart in human cells (Fig. 2g). d was
equal to zero in 19.4% of yeast ribosome collision sites (Fig. 2h), indicating that
these yeast ribosome collisions occur at the same site in the human genome. To
assess the statistical significance, we assigned ribosome collisions to random posi-
tions in human cells 10,000 times, keeping the number of ribosome collisions in
each gene unchanged. The fraction of conserved ribosome collisions (d = 0) in
every randomized sample was smaller than what we observed in the genomes
(P < 0.0001, the permutation test, Fig. 2h), indicating that the positions of ribo-
some collisions are evolutionarily conserved over the 1300-million-year evolution
between yeast and humans [39].
Ribosomes tend to collide at stop codons
Visually, we noticed that many highly expressed genes exhibited large numbers of
disome-seq reads at the stop codon, but also at internal codons, suggesting that ribo-
some collisions occur both internally and at the ends of open reading frames (Fig. 3a).
To identify the causes of these collisions, we searched for the sequence features at the
A-site, P-site, and exit tunnel of the 3′-paused ribosome of a disome, respectively. We
defined the propensity of a codon to induce ribosome collisions at the A-site (i.e., the
A-site pausing score) for each of the 64 codons as its enrichment in the disome foot-
prints (Fig. 3b). Taking the codon GAA as an example (Fig. 3b), all disome fragments
from one gene were classified into two categories based on the codon identity at the A-
site, GAA or the others. The odds ratio was estimated for each gene with the corre-
sponding codon frequency in the appendant mRNA-seq as the background; the A-site
pausing score was defined as the common odds ratio across all genes calculated by
Mantel-Haenszel tests (Fig. 3b). A significantly > 1 A-site pausing score implies slow
decoding of the codon.
To test if the A-site pausing score defined here can effectively detect the slow decod-
ing of the histidine codons in cells treated with 3-AT, we estimated the A-site pausing
score for each codon in yeast cells treated with 3-AT or growing in the rich medium.
Zhao et al. Genome Biology (2021) 22:16 Page 7 of 35

Two histidine codons deviated from the diagonal line (Fig. 3c), indicating that the paus-
ing score defined in this study is useful to detect translational pauses.
In comparing the disome-seq and the monosome-seq data for cells growing in the
rich medium, all three stop codons exhibited extremely high A-site pausing scores in
disome-seq, while their A-site pausing scores in monosome-seq were only a bit higher
than the amino-acid coding codons’ (Fig. 3d). The results were consistent between two
biological replicates of disome-seq (Additional file 1: Fig. S4a). To avoid artifacts gener-
ated by PCR amplification bias during the preparation of the high-throughput sequen-
cing library, we used UMI to exclude PCR duplicates. Three stop codons still exhibited
Fig. 3 Ribosome collisions occur at stop codons. a Two genes (RPS14A and RPL15A) exemplify ribosomecollisions at stop codons. b The schematic of the calculation of the A-site pausing score. We counted thenumbers of disome (or monosome) footprints with the concerning codon (GAA as an example here) or theother codons (all 63 non-GAA codons) at their A-sites, respectively. The mRNA-seq reads were used tocontrol for the codon frequency in the transcript. The A-site pausing score was defined as the commonodds ratio among genes, and the P value was given by the Mantel-Haenszel test. c The scatter plot showsthe A-site pausing scores estimated from cells treated with 3-AT or growing in the rich medium, for the 61codons that encode amino acids. The dashed line shows y = x. d The scatter plot shows the A-site pausingscores estimated from disome-seq or monosome-seq, for cells growing in the rich medium. The dashedline shows y = x. e Aggregated profiles of footprint densities over 3527 (58, 59, 61, and 62-nt footprints indisome-seq, in orange) and 5230 (28 and 29-nt footprints in monosome-seq, in blue) genes, normalizedagainst the CDS length, are shown
Zhao et al. Genome Biology (2021) 22:16 Page 8 of 35
Fig. 4 (See legend on next page.)
Zhao et al. Genome Biology (2021) 22:16 Page 9 of 35

extremely high A-site pausing scores (Additional file 1: Fig. S4b). Consistently, disome
reads accumulated at stop codons at the genomic scale (Fig. 3e). Collectively, these ob-
servations suggest that ribosome release is slow.
Ribosome collisions occur preferentially at the amino acids that terminate α-helices
To determine if peptide-bond formation causes ribosome collisions, we similarly calcu-
lated the P-site pausing score for each of the 20 amino acids; amino-acid identity, but
not codon identity, is likely to matter at the P-site. Five amino acids (proline, glycine,
asparagine, cysteine, and lysine) showed significantly > 1 P-site pausing scores in
disome-seq (Fig. 4a, b). Among them, proline and glycine are known poor substrates
for the formation of a peptide bond [40] and therefore slow down translation elong-
ation and lead to ribosome collisions. It remains unclear how other amino acids induce
ribosome collisions. Nevertheless, these amino acids share the same property that they
weaken the stability of the α-helix [41]. Proline and glycine are conformationally either
too inflexible or too flexible, respectively, to form an α-helix. The bulk and shape of as-
paragine and cysteine also destabilize α-helices. Positively charged residues (e.g., polyly-
sine) likely repel each other and prevent the formation of an α-helix [41].
We estimated the number of occurrences of each amino acid in gaps or α-helices in
the yeast genome; the ratio between them indicates the propensity of an amino acid to
appear in the gap. We found that this ratio could be predicted from the P-site pausing
score of the amino acid in disome-seq (P = 7.8 × 10⁻⁴, N = 20, linear regression, Fig. 4c)
but not in monosome-seq (P = 0.29, N = 20, Fig. 4c). Furthermore, the propensity to
terminate an α-helical conformation of an amino acid (measured by ΔΔG) [42, 43] was
also predictable from the P-site pausing score in disome-seq (P = 0.01, N = 20, linear re-
gression, Fig. 4d) but not in monosome-seq (P = 0.38, Fig. 4d), suggesting a sequence-
mediated coupling between ribosome collisions and the intrinsically disordered region.
Ribosome collisions tend to occur when the nascent polylysine chain is in the exit tunnel
Positively charged nascent peptides can hinder translation elongation by interacting
with the negatively charged exit tunnel [22]. To test this hypothesis with disome-seq
data, we calculated the exit-tunnel pausing score from the enrichment of each of the
(203 =) 8000 amino-acid 3-mers in the 20-amino-acid region upstream of the P-site of
the leading ribosome. Taking triple-lysine as an example (Fig. 5a), a window of three
amino acids slid one amino acid per step in this 21-amino-acid region, counting the
(See figure on previous page.)Fig. 4 Ribosome collisions occur at the amino acids that can terminate α-helices. a Volcano plots show the P-sitepausing score (based on disome and monosome footprints, respectively) of each amino acid and the correspondingQ value (false discovery rate). Six amino acids with > 1 P-site pausing scores in disome-seq are labeled. P, proline; G,glycine; N, asparagine; K, lysine; C, cysteine; R, arginine. b The scatter plot shows the P-site pausing scores estimatedfrom disome-seq or monosome-seq. The dashed line shows y= x. c The scatter plots show the P-site pausing score ofan amino acid and the ratio of the whole-genome occurrence of the amino acid in gaps vs. in α-helices. The P valuewas given by linear regression. The dashed line represents the linear regression line (if statistically significant). Theresiduals of both linear models followed the normal distribution (P=0.63 and P=0.80, the Kolmogorov-Smirnov tests).d The scatter plots show the P-site pausing score of an amino acid and the propensity to terminate an α-helix by theamino acid (ΔG relative to alanine, in the unit of kJ/mol). The P value was given by linear regression. The dashed linerepresents the linear regression line (if statistically significant). The residuals of both linear models followed the normaldistribution (P=0.25 and P=0.89, the Kolmogorov-Smirnov tests)
Zhao et al. Genome Biology (2021) 22:16 Page 10 of 35

Fig. 5 Ribosome collisions are enriched at polylysine in the exit tunnel. a The schematic of calculating the exit-tunnel pausing score. For each gene, we counted the numbers of the concerning amino-acid 3-mer (KKK as anexample here) or the other 3-mers (non-KKK) in the 20 amino-acid region upstream of the P-site of the pausedribosome. mRNA-seq data were used as the background. The exit-tunnel pausing score was defined as thecommon odds ratio among genes, and the P value was given by the Mantel-Haenszel test. b The volcano plotsshow the exit-tunnel pausing score (based on disome or monosome footprints) of each of the 8000 amino-acid3-mers and the corresponding Q value. Some 3-mers of consecutive positively charged amino acids are labeledin orange. c Determination of elongation rate with the dual-luciferase assay, in which the variants of differentcodon combinations for triple-lysine were inserted between Renilla and firefly-luciferase. Data are shown as themean ± standard error (N = 11 biological replicates for each variant). ANOVA stands for the analysis of variance.d Similar to Fig. 5b, the volcano plot shows the exit-tunnel pausing score for disome footprints of each of the613 codon 3-mers and the corresponding Q value. The eight codon combinations for triple-lysine arehighlighted. The pie chart shows the relative abundance of the eight codon combinations for triple-lysine in theyeast transcriptome. e A putative pausing signal inducing ribosome collisions (KKRKKK) was conserved in thelinker region between two domains of Rps31p, across the eukaryotic kingdom (top). The ribosome collision withthe putative pausing signal located within the exit tunnel was also conserved between yeast and human(bottom). The footprint abundance at a site was normalized by the total footprints of RPS31 in thecorresponding species
Zhao et al. Genome Biology (2021) 22:16 Page 11 of 35
number of triple-lysine or the total number of all other 3-mers for each pausing site;
these numbers were added together for all pausing sites of a gene. The odds ratio was
estimated for each gene with the corresponding numbers in the appendant mRNA-seq
data as the background. The exit-tunnel pausing score was defined as the common
odds ratio across the genome aggregated by the Mantel-Haenszel test.
Ribosome collisions were strongly associated with positively charged 3-mers (e.g.,
RKR) when in exit tunnels; by contrast, such pausing signals were obscured in
monosome-seq (Fig. 5b). Triple-lysine had the strongest collision signal among all the
3-mers (Fig. 5b), much stronger than other positively charged 3-mers (e.g., RKR, RKK,
KRR, and RRR). It has been suggested that the reading-through of stop codons could
result in the translation of poly(A) tails into polylysine, which activates the RQC path-
way [44]. As a result, A-tracts are often used to induce RQC in heterologous reporter
systems [10]. Since that AAA is the non-optimal codon of lysine [45], it is unclear if its
poor codon optimality also participates in promoting translational pausing in these
experiments.
To experimentally determine if combinations of synonymous codons for triple-lysine
have different efficacies to induce translational pauses, we constructed a dual-luciferase
reporter system by inserting individual synonymous variants of triple-lysine between
the Renilla and firefly-luciferases (Fig. 5c). A reduction in the firefly/Renilla luciferase-
activity ratio can report translational pausing induced by the inserted sequence—trans-
lation elongation replaces initiation as the rate-limiting step in protein synthesis of the
downstream luciferase. We did not detect significant differences in the firefly/Renilla
ratio among the eight synonymous codon combinations of triple-lysine (P = 0.57, ana-
lysis of variance, Fig. 5c). In contrast, the firefly/Renilla ratio was significantly reduced
when triple-lysine was inserted (P = 8 × 10⁻⁴, the two-tailed t test, Fig. 5c), suggesting
that lysine residues, instead of the non-optimal AAA codons, are accountable for the
ribosome collisions in A-tracts.
This observation is not unexpected because it is the identity of amino acids rather than
the identity of synonymous codons that should matter once the nascent peptide is in the
exit tunnel. Consistently, when we separately estimated the pausing scores for the eight
synonymous codon combinations encoding triple-lysine (Fig. 5d), endogenous ribosome
collisions induced by triple-lysine were mainly contributed by triple-AAG (Fig. 5d), the
most abundant codon combination for triple-lysine in the yeast transcriptome (Fig. 5d).
Polylysines often appear in the gap regions because the repellence among the posi-
tively charged residues prevents the formation of an α-helix [41]. For example,
polylysine-induced ribosome collision occurs in the linker between the two domains of
RPS31p, the fusion protein of ubiquitin and ribosomal protein (Fig. 5e), raising the pos-
sibility that a translational pause benefits the cell by providing sufficient time for the
cotranslational folding of the upstream domain. Consistently, despite being in an intrin-
sically disordered region, these positively charged amino acids (KKRKKK) are con-
served across eukaryotes (Fig. 5e). To test if the ribosome collision is also conserved,
we retrieved the disome-seq data for human cells reported in a recent study [38]. The
ribosome collision, with these positively charged nascent peptides in the exit tunnel,
was detected in both human and yeast cells (Fig. 5e), albeit these two species have di-
verged since 1300 million years ago [39], suggesting a function of this inter-domain
ribosome collision.
Zhao et al. Genome Biology (2021) 22:16 Page 12 of 35

Disomes exhibit a different structure from the RQC-inducing di-ribosomes
The pervasiveness of ribosome collisions detected in fast-proliferating cells (Fig. 2) and
the ubiquitous sequence signals of disomes (e.g., proline and polylysine, Figs. 4 and 5) in
endogenous genes are astonishing since the stacked ribosomes observed previously in re-
porter genes (di-ribosomes) could lead to the decay of both mRNA and nascent peptides
through the no-go decay and the RQC pathways [46]. Alternatively, some disome foot-
prints detected in fast proliferating cells may simply reflect the inevitable nature of sto-
chastic and temporary ribosome collisions since an mRNA is often translated
simultaneously by multiple ribosomes. For example, in the top 2% of highly translated
mRNAs, on average ~ 3 ribosomes were located in a 100-nt region (Additional file 1: Fig.
S5), a highly crowded situation for ribosomes.
Consistent with this idea, collision propensity of a transcript was positively correlated
with ribosome density (Fig. 2d)—the 3′-paused ribosomes are easier to be caught up by
a 5′-elongating ribosome on mRNAs with high ribosomal flux. We speculate that these
ribosome collisions were neither induced by faulty mRNA nor by aberrant nascent pep-
tides, and it would be very costly for cells to activate the no-go decay or the RQC path-
way for these ribosome collisions. Their translation is likely transiently interrupted and
to be resumed. If true, we predict that these disomes should be structurally different
from the RQC-inducing di-ribosomes reported in previous studies.
To test if the disomes collected from endogenous genes in fast-proliferating cells are
structurally identical to the RQC-inducing di-ribosomes, we performed cryo-EM ana-
lyses of disomes collected after RNase I digestion. Following the previous protocols for
the structural determination of di-ribosomes or tri-ribosomes [9, 15, 16], we omitted
the elongation inhibitor cycloheximide in the lysis buffer. Disomes showed a structure
of two ribosomes linked by a bent mRNA, with two 40S subunits facing toward each
other (Fig. 6a). Furthermore, the 5′-trailing ribosomes were detected in the rotated
state that harbors hybrid A/P and P/E tRNAs (Fig. 6a), indicating that they cannot fur-
ther translocate, likely due to the road-blocking 3′-leading ribosomes. These observa-
tions are in general consistent with the structure of di-ribosomes induced by hard stalls
in cell-free systems [9, 15, 16].
However, two distinct features indicate the essential difference between disomes and
di-ribosomes. First, the relative orientation between the two ribosomes in the disome
was different from that in the RQC-triggering di-ribosome (Fig. 6b). It was reported
that the two ribosomes in the di-ribosome form a large interface with highly specific
contacts between two 40S subunits (Additional file 1: Fig. S6a), which was considered
to be a feature recognizable by the RQC initiation factors such as Hel2p [9, 11, 16, 47].
However, in the disome, the interface between the two ribosomes was relatively flexible;
the contacts between the two ribosomes were much weaker or nearly absent in our
structure of the disome (Fig. 6c, Additional file 1: Fig. S6b-h). For instance, a tight
interaction was reported between the two RACK1 (Asc1p)—the protein involved in the
initiation of RQC—from the two ribosomes in the di-ribosome [9]. However, the inter-
action was completely lost in the disome (Fig. 6d, e), due to the different orientation of
the two 40S subunits (Fig. 6b). These observations suggest that the disome may lack
specific structural features required for recruiting RQC factors, such as Hel2p.
Second, the leading ribosome of the majority (31,010/35,918 = 86.3%) of disomes was
detected in the rotated state (Fig. 6a), in sharp contrast to the non-rotated state (with
Zhao et al. Genome Biology (2021) 22:16 Page 13 of 35

Fig. 6 The cryo-EM structure of disomes. a A composite map of the cryo-EM structure of disomes. The disomeswere collected without cycloheximide in the lysis buffer. Both the leading and the trailing ribosomes are in therotated state harboring hybrid A/P (blue) and P/E tRNAs (green). Small subunits are labeled by orange andyellow, and large subunits are labeled by cyan and gray. A model of mRNA is highlighted in red. b The topviews on disomes (top) and di-ribosomes (middle). The structure of di-ribosomes was from Ikeuchi et al. [9]. Anoverlay is shown (bottom) by docking di-ribosomes to disomes, aligned according to the trailing ribosomes;the conformational difference in the leading ribosomes is highlighted by the arrow. c–e The zoomed-in detailof the contact interface between the 40S subunits of the leading and the trailing ribosomes, in particular, the40S head-to-head contact site of disomes (d) and that of di-ribosomes (e). The blue star indicates a stronginteraction between the two ribosomes in di-ribosomes, and the red crosses indicate the missing interactionsin disomes
Zhao et al. Genome Biology (2021) 22:16 Page 14 of 35

P/P and E/E tRNAs) reported for the leading ribosome in di-ribosomes. The non-
rotated state has been previously reported as a feature of stalled 80S ribosomes before
collisions [9], and therefore, the rotated state of the leading ribosome indicates that
these disomes are likely induced by transient pauses. Collectively, the results of
cryo-EM analyses indicate that the widespread disomes observed in vivo (Fig. 2c)
are structurally different from di-ribosomes that are recognized and resolved by the
RQC pathway.
Ribosomes are associated with specific chaperones
To understand the function of endogenous ribosome collisions, we attempted to iden-
tify disome-specific ribosome components. We labeled ribosome proteins with stable
isotopes, digested the mRNA with RNase I, and separated disomes from monosomes
with sucrose density gradient centrifugation. We mixed an equal amount of protein ex-
tracted from the heavy-labeled disome fraction with light-labeled monosome fraction
(or light-labeled disome fraction with heavy-labeled monosome fraction in a label-swap
replicate) and performed tandem mass spectrometry (MS/MS, Fig. 7a).
In addition to ribosomal proteins, some highly expressed metabolic enzymes were
also identified (Additional file 1: Fig. S7, and Table S4, S5); for two reasons, we specu-
late that they are nascent peptides of incomplete protein translation attached to the ri-
bosomes. First, the peptides of these enzymes captured by MS/MS tended to be in the
first half of the coding sequences (the common odds ratio = 1.9, P = 0.001, the Mantel-
Haenszel test). For example, all detected peptides of FAS2p, a fatty acid synthetase,
were in the first half (Additional file 1: Fig. S7b). By contrast, the peptides of ribosomal
proteins captured by MS/MS were evenly distributed in the first and second half of the
coding sequences (the common odds ratio = 1.0, P = 0.7). Second, among the 26 meta-
bolic enzymes, the protein abundance of a metabolic enzyme in the disome fraction
was positively correlated with the abundance of disome footprints on its encoding gene
(ρ = 0.57, P = 2.5 × 10⁻³, N = 26, Spearman’s correlation, Additional file 1: Fig. S7c). By
contrast, we did not detect such correlation for ribosomal proteins (ρ = 0.16, P = 0.08,
N = 129, Spearman’s correlation, Additional file 1: Fig. S7c); this is not unexpected since
most ribosomal proteins were likely captured by MS/MS as ribosome components in-
stead of as nascent peptides.
Most proteins have similar abundance per ribosome in disomes and in monosomes
(e.g., two copies in a disome and one copy in a monosome) and therefore were on the
diagonal in the scatter plot showing protein intensities in disomes vs. in monosomes;
many were constitutive ribosome components (Fig. 7b and Additional file 1: Fig. S7a).
Proteins above the diagonal line were the disome-enriched proteins (Fig. 7b, Add-
itional file 1: Fig. S7a, and Table S4, S5). Proteins involved in the RQC pathway such as
Hel2p, Slh1p, Cue3p, and Rqt4p [9, 16, 48] were not observed significantly enriched in
disomes (Additional file 1: Table S4, S5).
In contrast, all 11 chaperones identified by our MS/MS analysis had > 1.5-fold per-
ribosome abundance in disomes than in monosomes (P = 1 × 10⁻⁶, Fisher’s exact test,
Fig. 7b; P = 1 × 10⁻⁴, Additional file 1: Fig. S7a). For example, although SSB1p was re-
ported as a ribosome-associated chaperone [49], how SSB1p is distributed among ribo-
somes remained unclear. The MS/MS analyses indicate that SSB1p is associated
Zhao et al. Genome Biology (2021) 22:16 Page 15 of 35

Fig. 7 Collided ribosomes are associated with specific chaperones. a The schematic of detecting the disome-enriched proteins through SILAC. Two biological replicates were performed with reciprocal labeling (the leftpanel). Because equal amount of total protein extracted from the monosome fraction and disome fractionwere mixed, proteins having the same abundance per ribosome between monosomes and disomes should belocated on the diagonal (the right panel). Proteins locating above or below the diagonal should be thoseenriched in the disomes or the monosomes, respectively. b The protein intensities per ribosome in disomeswere plotted against those in monosomes. Chaperones (green) are enriched in the disome, whereas mostconstitutive ribosomal proteins (pink) show the same abundance per ribosome between monosomes anddisomes. c The m/z (mass divided by charge number) spectrum of Ssb1p and its fragments detected in MS/MS.d The enrichment of chaperones in disomes. Immunoblotting was performed using anti-FLAG antibody, withPonceau S stained total protein as the loading control. Mono and Di represent proteins extracted from themonosome and disome fractions, respectively. e A schematic of the fates of ribosome collisions with variousdurations. The double-rotated disome conformation is used to show the initial status for ribosome collisions(left). The signal peptide is highlighted in orange. SRP, signal recognition particle; ER, endoplasmic reticulum;Ub, ubiquitin
Zhao et al. Genome Biology (2021) 22:16 Page 16 of 35
primarily with disomes (Fig. 7b, c). To validate this result, we randomly chose five out
of these 11 chaperones and fused 4×FLAG to the C-terminus for each of them. The en-
richment in disomes was confirmed with the immunoblotting assay for all five chaper-
ones (Fig. 7d). These observations suggest that some chaperones are associated with
ribosome collisions, capable of participating in the folding of nascent peptides.
DiscussionCaveats
There are at least four caveats in this study since we assumed that the abundance
of disome footprints faithfully reflects the intensity of ribosome collisions at a gen-
omic location. First, if there is any relation between disome footprints and the
transcripts binding to two ribosomes due to incomplete RNase I digestion, disome
footprints may not always indicate ribosome collisions. To test this possibility ex-
perimentally, we collected the transcripts binding to two ribosomes, performed
RNase I digestion, and sequenced ribosome-protected mRNA fragments (Add-
itional file 1: Fig. S8a). The footprints repeatedly observed in disome-seq did not
show up in such experiments (Additional file 1: Fig. S8b as an example), indicating
that disome footprints are fundamentally different from the transcripts binding to
two ribosomes, in which the two ribosomes are likely sparsely distributed, and the
mRNA fragment between them is sensitive to RNase I.
The second confounding factor is ligation bias. RNA fragments with various 5′-nu-
cleotide compositions may have variable ligation efficiency with a fixed 5′-adaptor se-
quence during the preparation of the high-throughput sequencing libraries [50, 51]. To
reduce such ligation bias, we had added three random nucleotides to the 3′-end of the
5′-adaptor during library preparation. To assess how much ligation bias is remained,
we calculated the frequency for each of the sixty-four 3-mers in the −15th to −13th nt
region upstream of the A-site of monosome footprints, as well as in the −45th to −43th
nt region upstream of the A-sites of the leading ribosomes of disome footprints. Both
were positively correlated with the genome-wide tri-nucleotide composition in the cod-
ing sequences (Additional file 1: Fig. S9a-c), indicating that ligation bias has been
largely eliminated from our monosome-seq and disome-seq libraries.
Nevertheless, we realized that any ligation bias not entirely eliminated could have led
to discrepancies in the translational pauses detected by disome-seq and monosome-seq.
It is because a translational pause generates different 5′-end for monosome and disome
footprints (Additional file 1: Fig. S9a). To assess such possibility, we estimated the 3-
mer frequencies in the −15th to −13th nt region upstream of the A-sites (for disomes,
the A-site of the leading ribosome) for translational pauses detected in disome-seq or
monosome-seq, respectively. Such 3-mers are the 5′-end of the 28-nt monosome foot-
prints but are the internal sequences of disome footprints. Although monosome-seq
and disome-seq identify largely non-overlapping pausing sites (Fig. 2e), the 3-mer fre-
quency in the −15th to −13th nt region upstream of the A-sites were positively corre-
lated between the two experiments (ρ = 0.95, P < 2.2 × 10⁻¹⁶, N = 64, Spearman’s
correlation, Additional file 1: Fig. S9d). This observation indicates that ligation bias can-
not be a major explanation for the discrepancy in the locations of translational pauses
identified by disome-seq or monosome-seq.
Zhao et al. Genome Biology (2021) 22:16 Page 17 of 35

A third caveat is related to the background used in the Mantel-Haenszel test for cal-
culating the pausing scores. We performed appendant mRNA-seq experiments that
mRNA was sheared into < 50-nt fragments using a high-salt buffer, instead of the
RNase I digestion as in the monosome-seq and disome-seq experiments. The purpose
of using such mRNA-seq data as the background in our analyses (Fig. 3, 4, 5) was to
control for any potential ligation bias, amplification bias, or sequencing bias in the
high-throughput sequencing. Nevertheless, we realized that another approach was to
use codon or amino-acid frequencies in each gene as the background (Additional file 1:
Fig. S10a). We recalculated the A-site and P-site pausing scores using this approach
and found them virtually unchanged (Additional file 1: Fig. S10b, c), indicating that the
reported pausing scores in this study are computationally robust.
Last, it is worth noting that the ribo-seq protocol has been “evolving” since its debut in
2009 [17]. In the initial protocol, yeast cells were co-cultured with cycloheximide, a step
that was later shown distorting the location of ribosome footprints within genes [19, 20,
52]. Furthermore, the addition of cycloheximide, as well as other antibiotics, in the lysis
buffer will stabilize ribosomes at various conformations that protect mRNA fragments of
different sizes [51, 53]. The size selection for ribosome footprints has also been shown to
have unexpected effects on the identification of translational pausing sites [54]. We
avoided co-culturing yeast cells with cycloheximide but added cycloheximide in the lysis
buffer to stabilize ribosomes, following recently updated ribo-seq protocols [19, 20, 53,
55]. Nevertheless, it is reasonable to assume that although disome-seq represents some
advance in understanding ribosome collisions, it inevitably reflects only part of the whole
story, due to technical limitations of the experimental procedures.
Similarly, it remains unclear how the chemicals in the lysis buffer could have affected
the structural determination of disomes by cryo-EM. In addition to the disomes collected
with cycloheximide omitted from the lysate (Fig. 6, Additional file 1: Fig. S6), we also de-
termined the structure of the disomes extracted with cycloheximide added to the lysis
buffer (as in the disome-seq experiment). These disomes held the two structural features
we reported in Fig. 6: a markedly different interface from the di-ribosome and a rotated
state for the leading ribosome (Additional file 1: Fig. S11a-c). Nevertheless, the structural
determinations of disomes under various experimental conditions are recommended in
the future for a more comprehensive understanding of ribosome collisions.
The 61-nt disome footprints
Although not highlighted in our results, note that we did conduct additional analyses
to examine the length distribution of disome footprints. In addition to the 58-nt disome
footprints whose conformation was determined in Fig. 1e as two 28-nt monosome foot-
prints spaced by two nts, the 5′-end of the 61-nt fragments also exhibited an apparent
3-nt periodicity (Fig. 1d, 2b), suggesting the presence of a second disome conformation.
The disomes accumulated at the stop codons (Additional file 1: Fig. S12a) indicate that
the 61-nt disome footprints were composed of two 28-nt monosome footprints spaced
by five nts. The fate of such 61-nt disomes is likely determined by which of the two
events occurs first. If the leading ribosome resumes translation first, the ribosome colli-
sion is resolved; alternatively, if the trailing ribosome moves first, probably because the
leading ribosome has paused for a long time, a 58-nt disome is formed.
Zhao et al. Genome Biology (2021) 22:16 Page 18 of 35

The 61-nt disome footprints were more abundant than the 58-nt disome footprints
in cells growing in the rich medium (Fig. 2b, Additional file 1: Fig. S13a). The abun-
dance of the 61-nt disome footprints was reduced when cells were treated with 3-AT
(Fig. 1d, Additional file 1: Fig. S13a), a phenomenon that was also observed in a recent
study [56]. We speculate that the translational pauses at the histidine codons induced
by the 3-AT treatment last longer than the time frame of an average translational pause
for yeast cells growing in the rich medium, thereby providing additional time for one
more move of the trailing ribosome toward the leading ribosome.
To determine if the distinction between the 58-nt and the 61-nt disome footprints
can provide additional information for the strength of a ribosome collision, we separ-
ately estimated the pausing scores from the 58-nt or the 61-nt disome footprints. They
were highly correlated (for the A-site, ρ = 0.92, P < 2.2 × 10⁻¹⁶, N = 64; for the P-site,
ρ = 0.88, P = 3.2 × 10⁻⁷, N = 20, Spearman’s correlations, Additional file 1: Fig. S12b), in-
dicating the absence of length-specific collision signals between the 58-nt and the 61-nt
disome footprints. To improve the statistical power, we combined the 58 and 61-nt
footprints for the analyses in Fig. 3, 4, 5. A recent investigation on mouse liver also re-
ported two lengths of disome footprints, 59–60 nts and 62–63 nts; similar to our obser-
vations, nearly identical pausing sequences were reported for the disome footprints of
these two lengths [57].
The 53-nt disome footprints
In addition to the 58-nt and the 61-nt disome footprints, we observed the 53-nt
disome footprints, which showed an apparent 3-nt periodicity (Fig. 1d, 2b) and
accounted for 10.9% of disome footprints for yeast cells growing in the rich
medium (Additional file 1: Fig. S13a). This indicates the existence of a third dis-
ome conformation. When treated with 3-AT, the 5′-end of most 53-nt disome
footprints was 45-nt upstream of the histidine codons (Additional file 1: Fig. S13b),
the same position as in the 58-nt disome footprints (Fig. 1e). It indicates that the
positions of the A-site of the leading ribosome relative to the 5′-end are identical
between the 53-nt and the 58-nt footprints. This observation echoes the two
lengths of monosome footprints reported in previous studies, ~ 21 nts and ~ 28 nts
[51, 53]; these two footprints share the same 5′-end but show different 3′-end.
The 28-nt footprints represent the ribosomes whose A-sites are occupied (in the
rotated state with hybrid A/P and P/E tRNAs or the non-rotated state with A/A
and P/P tRNAs); the length of footprints reduces to ~ 21 nts when the A-site of a
ribosome is open (in the non-rotated state with P/P and E/E tRNAs) [53].
In alignment with the two lengths of monosome footprints, we speculate that the
(28 + 2 + 23 =) 53-nt disome footprints represent a disome conformation that the A-site
of the leading ribosome is open, whereas the (28 + 2 + 28 =) 58-nt disome footprints
represent a conformation that the A-site of the leading ribosome is occupied. If true,
we predict that the abundance of the 53-nt disome footprints will increase when cells
are treated with 3-AT; it is because 3-AT induces ribosome collisions mainly through a
prolonged time frame for decoding histidine codons, the very state that the A-site of
the leading ribosome is open. The proportions of the 53-nt footprints indeed increased
from 10.9% for cells growing in the rich medium to 17.9% for cells treated with 3-AT
Zhao et al. Genome Biology (2021) 22:16 Page 19 of 35

(Fig. 1d, 2b, Additional file 1: Fig. S13a), in support of our interpretation of the 53-nt
disome footprints.
If the 53-nt disome footprints represent a disome conformation that the A-site of the
leading ribosome is open, we further predict the existence of disome structure that the
leading ribosome is in the non-rotated state with P/P and E/E tRNAs (presumably pro-
tecting 23-nt mRNA fragment) and the trailing ribosome is in the rotated state with hy-
brid A/P and P/E tRNAs (protecting 28-nt mRNA fragment). Indeed, we observed that
such conformation in (4908/35,918 =) 13.7% of the disomes collected from yeast cells
growing in the rich medium (Additional file 1: Fig. S11d). Nevertheless, the specific
contacts between the two 40S subunits observed in di-ribosomes [9, 16] remained ab-
sent in these disomes (Additional file 1: Fig. S11e).
For cells growing in the rich medium, the stop codons were less representative in the
A-site of leading ribosomes in the 53-nt disome footprints (Additional file 1: Fig. S13c,
d), echoing the 52-nt and 54-nt disome footprints recently reported in human cells
[38]. In the study, the 52-nt and 54-nt footprints were protected by the disomes that
the A-site of the leading ribosome was open and tended to locate in coding sequences
compared to the stop codon. On the other hand, the 58 and 61-nt disome footprints
detected in our study are similar to the ~ 61-nt footprints reported in human cells; they
showed a stronger tendency to locate at stop codons (Fig. 3e, Additional file 1: Fig.
S13c) [38]. The reduced enrichment of the 53-nt disome footprints at stop codons
(Fig. 3e, Additional file 1: Fig. S13c, d) suggests that stop codons are rapidly occupied
by release factors in the A-site of ribosomes; the translation is slow at stop codons
probably because of the prolonged subsequent steps disassembling the post-
termination ribosomal complexes [58].
If the 53-nt and the 58-nt/61-nt footprints are protected by disomes that the A-
site of the leading ribosome is open and occupied, respectively, we reasoned that
the 58-nt/61-nt disome footprints should be more informative than the 53-nt ones
in detecting the translational pauses associated with peptide bond formation and
translocation. It is because these processes slow down translation elongation only if
the A-site of a ribosome is occupied. Indeed, when calculated from the 53-nt dis-
ome footprints, the P-site pausing score of proline, the amino acid that is well
known as a poor acceptor for peptide bond formation [40, 46], was no longer sig-
nificantly > 1; such pausing signal was observed for the 58-nt disome footprints
(Fig. 4a, Additional file 1: Fig. S13e).
We further reasoned that the 53-nt disome footprints should be more informative
than the 58-nt ones in detecting the effect of codon optimality, because codon optimal-
ity causes translational pauses only if the A-site of a ribosome is open [53]. However,
we did not observe more ribosome collisions associated with non-optimal codons than
optimal codons using either the 53-nt disome footprints (y-axis in Additional file 1: Fig.
S13c, P = 0.47, N = 61, Mann-Whitney U test) or the 58-nt/61-nt disome footprints (x-
axis in Additional file 1: Fig. S13c, P = 0.85, N = 61, Mann-Whitney U test). In fact, the
A-site pausing score for the 61 amino-acid codons was highly correlated between the
53-nt and the 58-nt/61-nt disome footprints (Additional file 1: Fig. S13c, ρ = 0.56, P =
3.5 × 10⁻⁶, N = 61, Spearman’s correlation). Our observation is consistent with Han
et al., who reported in human cells that synonymous codon usage/tRNA supply was
poorly associated with the propensity for ribosome collisions [38].
Zhao et al. Genome Biology (2021) 22:16 Page 20 of 35

Synonymous codons are known to be recognized at variable rates [19, 20, 53], which
further regulate mRNA stability [31, 59]; however, the impact of codon optimality on
ribosome collisions was not detected in disome-seq. One explanation is that decoding is a
relatively rapid step in the work cycle of translation elongation [60]. Therefore, its poten-
tial in inducing variable ribosome collisions is masked by variation in the duration of
other steps such as peptide bond formation. Consistently, when the decoding time be-
came a dominant factor in the work cycle of translation elongation as the yeast cells were
treated with 3-AT, the non-optimal codon of histidine, CAT, did induce more ribosome
collisions than the optimal codon, CAC (Fig. 1e, Additional file 1: Fig. S13b, f).
The evidence for the existence of trisomes
In addition to disomes, translational pauses may further lead to longer queues of col-
lided ribosomes, for example the collision of three ribosomes—trisomes [15, 56, 61]. In-
deed, after RNase I digestion, a small number of particles were observed at the ~ 62
mm position after sucrose gradient centrifugation in Fig. 1b; the density of these parti-
cles was higher than disomes and was similar to transcripts binding to the three ribo-
somes, suggesting that they were trisomes. Although the abundance of these trisomes
was insufficient for a trisome-seq experiment, the presence of trisomes upstream of
stop codons was evident by the disome footprints with the 5′-end ~ 75-nt upstream of
the stop codon (Additional file 1: Fig. S12c).
The absence of translational “ramp”
Yeast genes often use more non-optimal codons in the 5′ region of the coding se-
quences, which has been speculated to serve as a translational “ramp” to reduce down-
stream ribosome collisions [62]. However, we did not find the signals that non-optimal
codons induced more ribosome collision (Fig. 3d, Additional file 1: Fig. S13c) nor did
we detect any accumulation of ribosomes downstream of the start codon in either
monosome-seq or disome-seq (Fig. 3e). It is likely that the previously observed accu-
mulation of ribosomes around the start codon [17] is a byproduct of the co-culturing
with cycloheximide [19, 20, 61] that partially inhibits translation elongation but does
not block initiation [63].
Instead, we observed more ribosome collisions downstream of a transcript (Fig. 3e),
an “inverse ramp” that in our view can be partly explained by two mutually non-
exclusive mechanisms. First, ribosomes tend not to collide in the upstream region of an
mRNA due to a steric effect. The small subunit occupies ~ 37 nts of mRNA during
subunit joining, with 22 nts downstream of the start codon [64]. This conformation re-
quires the 5′-end of the leading ribosome at least 24-nt downstream of the start codon;
when translation elongation starts, the start codon is at the P-site of the ribosome, indi-
cating that such ribosomes occupy 13 nts downstream of start codons (Additional file 1:
Fig. S14a). Therefore, such a steric effect sets a minimum 11-nt distance between two
ribosomes at translation initiation, reducing the possibility of ribosome collisions in the
5′-region of coding sequences. For example, even if the leading ribosome stays still, it
requires three moves of the trailing ribosome to collide (Additional file 1: Fig. S14a).
Consistent with this model, disomes were missing entirely in the first nine nts of the
open reading frame of any gene (Additional file 1: Fig. S14b). The collisions propensity
Zhao et al. Genome Biology (2021) 22:16 Page 21 of 35
increases gradually along the coding sequence, reaching a plateau ~ 50 nts after transla-
tion starts, as indicated by the meta-gene analysis of the disome-seq data (Add-
itional file 1: Fig. S14b).
A second explanation is that translation termination is relatively slow compared to
elongation, resulting in ribosomal “traffic jam” upstream of stop codons; abundant dis-
omes (Fig. 3e) and even some trisomes were formed close to stop codons (Add-
itional file 1: Fig. S12c). It can be reasonably generalized that the elevated ribosome
density due to slow termination can result in more frequent ribosome collisions in a re-
gion longer than the ~ 90 nts that are occupied by trisomes.
Note that both steric effects aforementioned, ribosomes lining up equidistantly down-
stream of start codons and queueing upstream of stop codons for translation termin-
ation and recycling, should have greater impacts on shorter genes, for two reasons.
First, ribosomal flux is generally higher in shorter genes [33], amplifying both steric ef-
fects. Second, the same affected genomic region (e.g., a 90-nt region occupied by tri-
somes) will take up a larger fraction of the coding sequence in shorter genes.
Consistently, the inverse ramp appears to be steeper among genes with shorter coding
sequences (Additional file 1: Fig. S14c).
Additional causes of ribosome collisions
In addition to the sequence features identified at the A-site, the P-site, and the exit tun-
nel (Fig. 3, 4, 5), sequences outside of the ribosome may also render heterogeneity in
the elongation rate. For example, mRNA secondary structure has been shown to cause
translational pausing [23]. mRNA downstream of disome footprints exhibited a stron-
ger secondary structure (Additional file 1: Fig. S15), indicating its role in inducing ribo-
some collisions. Relatedly, RNA helicases TIF1p and TIF2p were associated with
disomes (Additional file 1: Table S4, S5), potentially removing mRNA secondary struc-
tures to relieve translational pauses. There are also sequence features that lead to ribo-
some collisions with unknown mechanisms. For example, two collision-inducing 3-
mers, QQQ and GGG, were identified in the exit tunnel (Fig. 5b); they are not posi-
tively charged. Nevertheless, both are related to protein folding to some extent. The
former is a well-known signal for protein misfolding [65], and the latter is a prominent
signal for intrinsic protein disorder [66].
The benefit from ribosome-collision mediated cotranslational protein folding
It is apparently costly when ribosomes are sequestered upstream of the stop codon,
waiting for release, since they are not used for active protein synthesis. Nevertheless,
slow ribosome release may benefit the cell by providing the newly synthesized peptide
sufficient time to fold within the exit tunnel of ribosomes [67], rather than in the com-
plex cytoplasmic environment. Some amino-acid sequences (e.g., proline and glycine at
the P-site as well as polylysine in the exit tunnel) induce translational pauses as well
(Figs. 4 and 5); they are also signals for the translation completion of α-helices (Fig. 4c,
d). These amino-acid sequences may provide the time and subcellular environment for
the folding of newly synthesized peptides inside the exit tunnel, especially α-helices.
The narrowest region of the exit tunnel, the constriction site, is ~ 10 Å in width [68],
sufficient for cotranslational folded α-helices (~ 5 Å in width) [69] to pass by. It would
Zhao et al. Genome Biology (2021) 22:16 Page 22 of 35

be important in the future to test if the manipulation of the translational pausing sig-
nals can affect protein folding.
Such a dual role of amino acids can catalyze the evolution of protein structure be-
cause it does not take additional time for placing a translational pausing signal after an
evolutionary change in protein structure—the amino-acid substitution that results in
innovation in protein structure at the same time confers a translational pause, making
the emergent protein structure ready to be folded. Together with the cotranslational
chaperones associated with collided ribosomes, the proper folding of a novel protein
structure is warranted during evolution.
The fates of ribosome collisions
The key to studying ribosome collision-mediated translational regulation is to unveil
the dynamics of ribosomes during translation. Traditional ribo-seq provides the loca-
tion information of monosomes but misses collided ribosomes, which are present in
46% of genes in yeast cells growing in the rich medium and provide unique information
about translational pausing. Three similar studies in humans and zebrafish [38], yeast
[56], and mice [57] were recently published during the preparation of our manuscript.
All four studies, including our own, performed disome-seq and showed that ribosome
collisions were widespread, despite the use of various model organisms.
We performed structural analyses on yeast disomes; 86.3% disomes were composed
of two ribosomes that both were at the rotated state (Fig. 6a). This structure is consist-
ent with the (28 + 2 + 28 =) 58-nt or the (28 + 5 + 28 =) 61-nt disome footprints that the
same length of mRNA (28 nts) was protected by the two ribosomes. By contrast, when
the leading ribosomes switch to the non-rotated state with P/P and E/E tRNAs, the two
ribosomes will protect different lengths of mRNA (28 and 23 nts for the trailing and
leading ribosomes, respectively). In mouse liver, Arpat et al. reported that the majority
of disomes protected (29 + 1 + 29 =) 59 nts or (29 + 4 + 29 =) 62 nts [57]. Since the same
length of mRNA (29 nts) was also protected by the two ribosomes, the lengths of these
disome footprints can be explained by the double-rotated disome conformation deter-
mined in this study.
The data collected in the four studies led us to propose an integrated model for the
ribosome-collision mediated translational regulation. Since an mRNA is translated sim-
ultaneously by multiple ribosomes, ribosome collisions are likely inevitable. The high
ribosomal flux on an mRNA will increase the chance of collisions in general (Fig. 2d)
due to the inherent stochasticity of biochemical reactions, on the basis of which
sequence-associated heterogeneity in the elongation rate further promotes the propen-
sity of collisions at specific locations. Besides, some ribosome collisions may be induced
by aberrant transcripts or arrested nascent peptides.
There are at least three possible fates for these ribosome collisions observed in this
study. Firstly, some ribosome collisions are likely transient, and the translation of both
ribosomes can be resumed (Fig. 7e, top path); this could be the mechanism that keeps
the ribosome density largely constant over a transcript (Fig. 3e, bottom panel, Add-
itional file 1: Fig. S14c) in spite of widespread collided ribosomes (~ 5.8% at the mo-
ment that the disome “snapshot” was taken, Fig. 1b; or ~ 10% estimated in mouse liver
[57]). Second, some ribosome collisions may last for a more extended period; these
Zhao et al. Genome Biology (2021) 22:16 Page 23 of 35

collisions may promote cotranslational protein folding or aid in targeting to correct
subcellular locations [57, 70] (Fig. 7e, middle path). Third, if ribosome collisions last for
a sufficiently long time, the leading ribosomes will shift to the non-rotated stalling state,
and a more rigid interface between the collided ribosomes will trigger the recognition
by the RQC pathway, leading to the degradation of mRNA and nascent peptides [9, 15,
16, 38, 56] (Fig. 7e, bottom path).
It is not yet clear the determinants of the collision duration, the mechanisms by
which cells can sense how long a ribosome collision has persisted, and the fraction of
ribosome collisions destined for each of the three fates. It is also unclear the mecha-
nisms by which cells distinguish programmed (for protein folding or subcellular
localization) and sporadic collisions (due to aberrant transcripts and defective nascent
peptides). Considering the central role of ribosome collisions in protein homeostasis,
these are key issues that need to be studied in the future.
ConclusionsRibosome collisions are widespread in fast proliferating yeast cells, especially on mRNA
with high ribosomal flux. Ribosome collisions tend to occur at stop codons and are
often related to the translation completion of α-helices. A large number of collided ri-
bosomes are structurally incompetent to trigger the RQC pathway; instead, they are
often associated with chaperones, which likely aid in cotranslational protein folding.
Taken together, we offer a mechanism that chaperones sense translation elongation
rate through ribosome collisions to determine which proteins/peptide regions require
cotranslational folding.
MethodsPolysome profiling and disome-seq
Sample preparation
The laboratory strain BY4742 (MATα his3Δ1 leu2Δ0 lys2Δ0 ura3Δ0) was cultivated at
30 °C in the rich medium YPD (1% yeast extract, 2% peptone, and 2% dextrose). For ex-
periments of the 3-AT treatment, strain S288C was cultivated at 30 °C in the SC−His+
3-AT medium (synthetic complete medium with histidine dropped-out and 100 mM 3-
AT added). We harvested cells following previous studies [24]. Briefly, cells were cul-
tured for over two doubling cycles in the absence of cycloheximide, were collected at
OD660 ~ 0.6 by vacuum filtration, and were immediately frozen in liquid nitrogen. Ribo-
somes were extracted with the polysome lysis buffer (PLB), which contained 200 mM
Tris-HCl (pH 8.0), 200 mM KCl, 35 mM MgCl2, 1% (v/v) Triton X-100, 5 mM DTT,
and 50 μg/mL cycloheximide.
Polysome profiling
The extracted ribosomes were pelleted through a 30 mL sucrose cushion containing
400 mM Tris-HCl (pH 8.0), 200 mM KCl, 30 mM MgCl2, 1.75M sucrose, 5 mM DTT,
and 50 μg/mL cycloheximide, by ultracentrifugation at 4 °C overnight (33,500 rpm,
Beckman, 70Ti rotor). The ribosome pellet was dissolved in 300 μL RNase I buffer (20
mM Tris-HCl pH 8.0, 140 mM KCl, 5 mM MgCl2, 50 μg/mL cycloheximide, and 50 μg/
mL chloramphenicol) and separated by ultracentrifugation at 4 °C for 3 h (35,300 rpm,
Zhao et al. Genome Biology (2021) 22:16 Page 24 of 35

Beckman, SW41 rotor) through a 5–50% sucrose gradient (40 mM Tris-HCl pH 8.4, 20
mM KCl, 10 mM MgCl2, and 50 μg/mL cycloheximide) prepared by Gradient Master
(Biocomp). The profiling signals were recorded by Piston Gradient Fractionator
(Biocomp).
Monosome-seq, disome-seq, and mRNA-seq
Libraries were prepared as described previously [17, 24, 55], with modifications. Fifty
thousand units (A260) of ribosome dissolved in the PLB buffer were treated with 750 U
RNase I (Ambion, AM2294) at 25 °C for 2 h. Our pilot experiments, as well as previous
studies, have shown that sucrose gradient centrifugation is not necessary [55, 71–73] as
long as the digestion with RNase I is complete (Additional file 1: Fig. S1); rather, this step
consumes a large amount of ribosome (especially disome) samples. The following-up
computational analyses can help to tell if the RNA fragments being collected are largely
protected by ribosomes: whether the fragments are restricted to the coding sequences,
whether the fragments are enriched in certain lengths, and whether a 3-nt periodicity ex-
ists (Additional file 1: Fig. S3c-f). Therefore, RNA was directly extracted from the solution
for RNase I digestion with hot phenol and was separated on a 17% (w/v) 7M urea de-
naturing polyacrylamide gel in a 0.5× Tris-borate-EDTA (TBE) electrophoresis buffer.
RNA fragments with the length of approximate 20–30 nts or 50–80 nts were extracted by
gel crushing and further incubated with an RNA gel extraction buffer (300mM NaOAc
pH 5.2, 10mM Tris-HCl pH 8.0, 1 mM EDTA pH 8.0) overnight.
To control for technical bias during library preparation, appendant mRNA-seq was
performed [17]. Specifically, total RNA was extracted using hot phenol, and 75 μg ex-
tracted RNA was applied to mRNA purification using the Dynabeads™ mRNA purifica-
tion kit (Life Technologies, 61006). For fragmentation, 11.1 μL 10× fragmentation
reagent (Thermo Fisher Scientific, AM8740) and 100 μL ddH2O were added to the
purified mRNA. Fragmentation proceeded for 30 min at 70 °C and was aborted when
11.1 μL 10× stop solution was added. Fragmented RNA was precipitated by isopropanol
overnight and was separated on a 17% (w/v) 7M urea denaturing polyacrylamide gel.
RNA fragments with the length ~ 28 nts were extracted from gel.
The extracted RNA fragments for monosome-seq, disomes-seq, or mRNA-seq were
subjected to small RNA library construction for Illumina sequencing (Gnomegen,
k02420). The 5′-RNA adaptor contained a 3-nt random sequence at the 3′-end to avoid
potential ligation bias. Monosome-seq/RNA-seq and disome-seq libraries were sequenced
with single-end 50 and paired-end 100 modes on BGISEQ-500 (BGI Group), respectively.
Mapping reads to the yeast genome
The 3-nt random sequence at the 5′-end of each sequencing read was removed. The
removed 3-nt sequence was added to the head of each read in the fastq format as the
UMI, which can serve to remove PCR duplications generated during Illumina library
preparation. The sequence identical to the 3′-sequencing adaptor was also trimmed in
each read using cutadapt V1.16 (http://gensoft.pasteur.fr/docs/cutadapt/1.6/index.html)
[74]. Reads without the 3′-adaptor sequence were removed since they (> 46 nts for
monosome-seq or > 96 nts for disome-seq) were much longer than the expectation
Zhao et al. Genome Biology (2021) 22:16 Page 25 of 35

(20–30 nts for monosome-seq and 50–80 nts for disome-seq). Trimmed reads shorter
than 20 nts were also excluded from further analysis.
The Saccharomyces cerevisiae genome (SGD R64-1-1) (https://www.yeastgenome.org/
) was used as the reference [75]. The trimmed reads were mapped against rRNA with
bowtie V1.2.2 [76] (http://bowtie-bio.sourceforge.net/manual.shtml); the mapped reads
were filtered to avoid rRNA contamination. The rest reads were aligned against coding
sequences with the --no-novel-juncs parameter using Tophat V2.1.1 [77] (https://ccb.
jhu.edu/software/tophat/manual.shtml). Reads with multiple alignments or with map-
ping quality < 30 were discarded. Biological replicates were highly correlated (Add-
itional file 1: Fig. S2) and were combined in the majority of our analyses. To remove
PCR duplicates generated during Illumina library preparation, sequencing reads of the
same length, sequence, and UMI were counted only once. The number of disome reads
obtained in this study (Additional file 1: Table S2) are comparable to those in previous
studies [24].
The definition of the A-site
The definition of A-site in the disome footprints with various length is overviewed in
Additional file 1: Fig. S16. Specifically, for the 58-nt disome footprints, if the 5′-end of
a read was mapped to the first nucleotide of a codon (in frame), the 46th–48th nts was
defined as the A-site of the leading ribosome; if mapped to + 1 (or + 2) frame, the
45th–47th (or 47th–49th) nts was defined as the A-site since the footprint likely shifted
by + 1 and − 1 nt during RNase I digestion. The A-site of the leading ribosome was also
defined for the 59-nt disome footprints: if the 5′-end was in frame, meaning that one
more nt was kept at the 3′-end during RNase I digestion, the 46th–48th nts was the A-
site. If mapped to + 2 frame, meaning that one more nt was kept at the 5′-end during
RNase I digestion, the 47th–49th nts was the A-site. For the 61 and 62-nt disome foot-
prints, the A-site was defined assuming that an extra codon was included in the space
between two ribosomes. The A-site of the 53 and 54-nt disome footprints was defined
as that of the 58 and 59-nt disome footprints since the footprints were trimmed from
the 3′-end. For the 28 and 29-nt monosome footprints, the definition of the A-site was
the same as the 58 and 59-nt disome footprints except for a 30-nt offset.
The calculation of the pausing scores
The A-site pausing score of each of the 64 codons was defined as the common odds ra-
tio among genes calculated by the Mantel-Haenszel test. A 2 × 2 contingency table was
generated for each gene. Disome footprints were divided into two categories, the con-
cerning codon and other codons at the A-site of the leading ribosome. mRNA reads
were used as the background to control for codon frequency in the gene; the “A-site”
of a 28–29 nt mRNA-seq read was defined as if it was a 28–29 nt monosome footprint.
The P-site pausing score was estimated similarly with the amino acid at the P-site
under consideration. The exit-tunnel pausing score was estimated for each of the
amino-acid 3-mers in the 20-amino-acid region upstream of the P-site; this length was
conservative since peptides with 33 to 67 amino acids can be folded within the exit tun-
nel [78]. Flanking 3-mers may hitchhike on the causal 3-mer, and therefore, we
Zhao et al. Genome Biology (2021) 22:16 Page 26 of 35

combined multiple disome reads mapped to the same genomic position into one to re-
duce such a hitchhiking effect.
Statistical analyses were performed with R (https://www.r-project.org/), and plots
were generated with an R package, ggplot2 (https://ggplot2.tidyverse.org/). The Q
values were calculated using an R package, qvalue (http://github.com/jdstorey/qvalue).
All statistical tests were two-sided unless otherwise specified.
Dual-luciferase assays
The Renilla and firefly-luciferase sequences were obtained from the pTH727-CEN-RLuc/staC-
FLuc plasmid (http://www.addgene.org) and were concatenated with a linker sequence
GGTCGACGGATCCCCGGG between them, for the purpose of keeping correct protein
folding. This Renilla-linker-firefly fragment was further inserted into the p426 plasmid and
was expressed under TDH3 promoter. The sequences of AAGAAGAAG, AAGAAGAAA,
AAGAAAAAG, AAAAAGAAG, AAGAAAAAA, AAAAAGAAA, AAAAAAAAG, and
AAAAAAAAA were individually inserted upstream of the coding sequence of firefly lucifer-
ase. Individual plasmids were transformed into BY4742. The plasmid-containing yeast clones
were selected on SC–uracil plates.
The activity of luciferase was detected as described in a previous study [79]. Briefly,
transgenic yeast strains were individually cultivated in the SC–uracil medium (150 μL)
at 30 °C overnight. Ten microliters of each yeast culture was transferred into a fresh
SC–uracil medium (140 μL) and was cultivated for another 4 h in a 96-well plate. Pas-
sive lysis buffer (40 μL, Promega, E1910) was added per well for cell lysis. Twenty-five
microliters of the suspension was mixed with 25 μL firefly luciferase substrate (Pro-
mega, E1910) and was incubated for 20 min at 25 °C. Firefly luciferase activity was mea-
sured by the Synergy multi-mode reader (BioTek). Twenty-five microliters of Stop-and-
Glo reagent (Promega, E1910) was added and mixed, which was incubated for another
20 min before the measurement of Renilla-luciferase activity.
Cryo-EM
Disome purification
Ten thousand units (A260) of ribosome pellet were purified from cell lysates (cyclohexi-
mide omitted) and were subjected to digestion in 300 μL RNase I buffer with 200 U
RNase I (Ambion, AM2294) at 25 °C for 2 h. The disome fraction was collected with
sucrose gradient centrifugation and was concentrated through a 50-kDa centrifugal fil-
ter (Millipore, UFC905096). The concentration was adjusted to A260 = 11.0.
Data acquisition
Vitrified specimens were prepared by adding 4 μL disome samples at the concentration
of ~ 150 nM to a glow-discharged holey carbon grid (Quantifoil R1.2/1.3), which was
covered with a freshly made thin carbon film. Grids were blotted for 1 s and plunge-
frozen into liquid ethane using an FEI Vitrobot Mark IV (4 °C and 100% humidity).
The cryo-grids were initially screened at a nominal magnification of × 92,000 in an FEI
Talos Arctica microscope (200 kV), equipped with an FEI CETA camera. High-quality
grids were transferred to an FEI Titan Krios electron microscope operating at 300 kV,
and images were collected using a K2 Summit direct electron detector (Gatan) in
Zhao et al. Genome Biology (2021) 22:16 Page 27 of 35

counting mode at a nominal magnification of × 105,000, which corresponds to a pixel
size of 1.356 Å at the object scale (with defocus varying from − 1.0 to − 2.0 μm). Movie
stacks were collected semi-automatically using SerialEM [80]. Each micrograph was
dose-fractionated to 32 frames with a dose rate of ~ 10.0 counts per physical pixel per
second for a total exposure time of 6.4 s.
Data processing
Original image stacks were summed and corrected for drift and beam-induced motion
at the micrograph level using MotionCor2 [81]. SPIDER [82] was used for micrograph
screening. The contrast transfer function parameters of each micrograph were esti-
mated by Gctf [83]. All 2D and 3D classification and refinement were performed with
RELION-3.0 [84].
The disome data were initially processed using 80S monosome as a template for par-
ticle picking. A total of 1683 micrographs were collected, and 355,439 particles were
picked for a cascade 2D and 3D classification with a binning factor of two. 281,953 par-
ticles with a box size of 400 pixels were split into 10 classes during the first round 3D
classification (Additional file 1: Fig. S17).
Particles contained densities for two 80S ribosomes were re-centered and re-
extracted with an enlarged box size of 440 pixels. After removing duplicated particles,
45,119 disome particles were subjected to another round of 3D classification. Two clas-
ses (a total of 35,918 particles) were pooled, and a soft mask on the leading ribosome
was applied during the following mask-based 3D classification. Two groups were ob-
tained: 86.3% of the particles contained A/P and P/E tRNA in the leading ribosome
(group 1), the rest (13.7%) containing P/P and E/E tRNA in the leading ribosome
(group 2). The 4908 particles in group 2 were subjected to 3D auto-refine with a soft
mask on the trailing or leading ribosome, resulting in 7.96 Å or 8.06 Å maps, respect-
ively. The 31,010 particles in group 1 were split into ten classes during the final round
of 3D classification with a soft mask on the trailing ribosome. A total of 27,599 particles
were subjected to 3D auto-refine with a soft mask on the trailing or leading ribosome,
resulting in 4.85 Å or 4.59 Å maps (gold-standard FSC 0.143 criteria), respectively
(Additional file 1: Fig. S17, S18).
The structural determination of disomes collected in the cycloheximide-containing lysis
buffer
Disomes were also collected in the lysis buffer containing 50 μg/mL cycloheximide. The
experimental and computational procedures were otherwise similarly performed. In
brief, a total of 1439 micrographs were collected, and 269,962 particles were picked for
a cascade 2D and 3D classification. A total of 4194 particles were applied for 3D auto-
refine with a soft mask on the trailing or leading ribosome, resulting in 7.11 Å or 8.39
Å map, respectively.
Mass spectrometry
Stable isotope labeling with amino acids in cell culture (SILAC) was performed as de-
scribed previously [85]. Briefly, a strain modified from BY4742 (MATα his3Δ1 leu2Δ0
lys2Δ0 ura3Δ0 arg4Δ0::kanMX4 car1Δ0::LEU2) was cultured at 30 °C in the regular SC
Zhao et al. Genome Biology (2021) 22:16 Page 28 of 35

medium or in the SC medium substituted with heavy isotopes (37.25 mg/L Lys8 and
20.94 mg/L Arg10). Lys8 and Arg10 represent 15N213C6-lysine and 15N4
13C6-arginine,
respectively.
Cells were harvested at the mid-log phase (OD660 ~ 0.6), and polysomes were ex-
tracted. Polysome profiling was performed after RNase I digestion, and proteins
were precipitated from the monosome or disome fraction with a double volume of
95% ethanol, respectively. The protein precipitants were dissolved with the urea
buffer (8 M urea, 1 mM sodium orthovanadate, 1 mM sodium fluoride, 2.5 mM so-
dium pyrophosphate, 1 mM B-glycerophosphate, 0.2% tablet of protease inhibitors,
and 1 mM PMSF). One hundred fifty micrograms of light-labeled monosome pro-
tein was mixed with 150 μg heavy-labeled disome protein; 150 μg heavy-labeled
monosome protein was mixed with 150 μg light-labeled disome protein as a repli-
cate. The protein mixtures were subject to the MS/MS analysis on Orbitrap Elite
(Thermo Fisher Scientific).
The raw data were processed with MaxQuant V1.5.8.3 [86] (https://www.biochem.
mpg.de/5111795/maxquant) using default parameters. All raw data were searched
against the yeast proteome with the addition of potential contaminants. The protease
was set as trypsin/P and trypsin. Two missed cuts were allowed. The protein intensities
were retrieved from the output file (proteinGroups.txt) of MaxQuant. The proteins as-
sociated with ribosome collision can be identified by comparing the abundance per
ribosome between disomes and monosomes. In principle, if a significant proportion of
monosomes collected in the experiments were vacant, this comparison will identify
proteins associated with translating ribosomes instead of those associated with disomes.
However, this is an unlikely case since all 197,367 monosomes detected in our cryo-EM
analyses accommodated tRNAs, indicating they are mostly translating ribosomes.
If the peptides of metabolic enzymes were detected in the ribosome particles because
they were nascent peptides of incomplete protein translation, they should be enriched
in the first half (N-terminus) of a protein. To determine if it is true, we divided the pep-
tides detected into two categories, according to whether the N-terminus of the peptide
belonged to the first half of the protein or not. With the theoretical digested peptides
(arginine or lysine at the C-terminus) as a background, a 2 × 2 contingency table was
generated for each gene. The common odds ratio among genes was calculated by the
Mantel-Haenszel test.
Immunoblotting
We did not have specific antibodies for the yeast chaperones enriched in disomes;
therefore, we decided to perform immunoblotting for 4×FLAG tagged chaperones with
the antibody against the FLAG tag. To this end, we constructed transgenic yeast lines
where 4×FLAG tag was inserted to the C-terminus of five chaperones. Specifically, a
DNA fragment composing the terminator of ADH1 and the kanMX cassette was ob-
tained from the pBS7 plasmid. 4×FLAG sequence was fused to the 5′-terminus of this
fragment, which was further cloned into the pUC57 plasmid to generate the pUC57-
4×FLAG-ADH1 terminator-kanMX plasmid (TSINGKE Biological Technology).
Primers were designed to amplify this fragment and for recombination-based knock-in,
right before the stop codon of each chaperone gene (Additional file 1: Table S6).
Zhao et al. Genome Biology (2021) 22:16 Page 29 of 35

Proteins were isolated from the monosome or disome fraction as described in the
“Mass spectrometry” section. An equal amount of monosome and disome proteins
were separated by 10% SDS-polyacrylamide gel and were transferred on to a Hybond
ECL (GE Healthcare, RPN303D) membrane. The membrane was probed with anti-
DDDDK tag (binding to FLAG® tag sequence, horseradish peroxidase-conjugated;
Abcam, ab49763). Chemiluminescent horseradish peroxidase substrate (Millipore,
WBKLS0100) was added to detect the antibody. The signal was captured with e-BLOT
TOUCH IMAGER (Beijing Poliness Trade Co., Limited).
Computational analyses of the disome-seq data for human cells
The human genome (Ensembl Genes 101) was downloaded from Ensembl [87]. The most
reliable principal isoform was used as the reference cDNA for each gene. The disome-seq
data for human cells were retrieved from the Gene Expression Omnibus (GEO) at the Na-
tional Center for Biotechnology Information (NCBI) under the accession number of
GSE145723. The sequencing reads were mapped against human rRNAs with bowtie
V1.2.2, and the unmapped reads were used in the following analyses. These reads were
aligned against human protein-coding transcripts using STAR V2.7.3a [88] with the fol-
lowing parameters, --alignEndsType EndToEnd, --outFilterType BySJout, --outFilterMis-
matchNmax 2, --outFilterMultimapNmax 5, --outFilterMatchNmin 16. We followed the
previous definition for the A-site of the leading ribosome in a disome footprint [38].
Specifically, offsets were 45 nts for the 51-nt and 59-nt footprints, 46 nts for the 52-nt and
60-nt footprints, 48 nts for the 54-nt and 62-nt footprints, and 49 nts for the 55-nt and
63-nt footprints.
The annotation of α-helices
The protein secondary structure annotation of yeast protein was retrieved from UniProt
[89] (https://www.uniprot.org/). Adjacent α-helices without a gap were concatenated.
Short α-helices composed of 4 amino acids or less were filtered. The secondary structure
of Rps31p was predicted with the online secondary structure prediction method, GOR IV
[90], at https://npsa-prabi.ibcp.fr/.
Alignment of proteins from fungi, animals, and plants
Homologous genes were identified by BLAST (https://blast.ncbi.nlm.nih.gov/Blast.cgi).
Orthologous gene pairs between yeast and human were retrieved from Ensembl Bio-
Mart [91] and NCBI HomoloGene [92]. Protein sequences were aligned by Clustal X
[93]. Species trees were constructed with TimeTree [94] at http://www.timetree.org.
Prediction of the minimum free energy of an mRNA fragment
The minimum free energy of the 30-nt mRNA downstream of a disome footprint was
calculated with the RNAfold V2.4.13 of the Vienna RNA package [95] (http://rna.tbi.
univie.ac.at/).
Supplementary InformationThe online version contains supplementary material available at https://doi.org/10.1186/s13059-020-02256-0.
Additional file 1: Fig. S1. Disomes persisted after RNase I digestion. Fig. S2. Correlations between libraries ofdisome-seq, monosome-seq, and mRNA-seq. Fig. S3. The distribution of monosome and disome footprints. Fig.
Zhao et al. Genome Biology (2021) 22:16 Page 30 of 35
S4. The A-site pausing scores between replicates or between data processing approaches. Fig. S5. Highly trans-lated mRNAs are crowded with ribosomes. Fig. S6. The contact interfaces of disomes (cycloheximide omitted inthe lysate) and di-ribosomes. Fig. S7. The identification of disome-associated proteins. Fig. S8. Ribosome foot-prints in the two-ribosome-containing transcripts. Fig. S9. The detection of the 5′-ligation bias during the librarypreparation for monosome-seq and disome-seq. Fig. S10. The pausing scores estimated using the codon/amino-acid frequency in the genome as the background. Fig. S11. Additional cryo-EM structures of disomes. Fig. S12.On the 61-nt disome footprints. Fig. S13. On the 53-nt disome footprints. Fig. S14. The “inverse ramp” of disomefootprints on the CDS. Fig. S15. The mRNA secondary structure downstream of disome footprints. Fig. S16. Thepresumed conformation and the putative A-site for disome footprints of various lengths Fig. S17. Cryo-EM dataprocessing for disome particles that were collected with cycloheximide omitted in the lysis buffer. Fig. S18. Fouriershell correlation (FSC) curves for the final 3D density maps after RELION-based post-processing. Table S1. Sum-mary of the monosome-seq libraries. Table S2. Summary of the disome-seq libraries. Table S3. Summary of themRNA-seq libraries. Table S4. Disome-associated proteins (replicate 1: heavy isotope labeled disome proteins, dis-ome/monosome intensity ratio > 1.5). Table S5. Disome-associated proteins (replicate 2: light isotope labeled dis-ome proteins, disome/monosome intensity ratio > 1.5). Table S6. Primers used for tagging 4×FLAG to the C-terminus of each chaperone.
Additional file 2. Review history.
AcknowledgementsWe thank Lucas Carey (Peking University) for commenting on and editing the manuscript. We thank Xiahe Huang andYingchun Wang (IGDB, CAS) for technical support in proteomics, Ting Li (IGDB, CAS) in ribosome profiling, RongxinYang (IGDB, CAS) in molecular biological experiments, and Shaohuan Wu (IGDB, CAS), Yuliang Zhang (IGDB, CAS), andHaotian Guo (Huazhong University of Science and Technology) in computational biology. We thank Jinzhong Lin(Fudan University) and Xiaofeng Cao (IGDB, CAS) for discussion. We thank the Core Facilities at the School of LifeSciences, Peking University for help with negative staining EM, the Electron Microscopy Laboratory and the Cryo-EMPlatform of Peking University for help with data collection, the High Performance Computing Platform of Peking Uni-versity for help with computation, and the National Centre for Protein Sciences at Peking University for assistance withsample preparation. We also thank Addgene (http://www.addgene.org/) for providing plasmids.
Review historyThe review history is available as Additional file 2.
Peer review informationBarbara Cheifet and Yixin Yao were the primary editors on this article and managed its editorial process and peerreview in collaboration with the rest of the editorial team.
Authors’ contributionsT.Z., N.G., and W.Q. designed the experiments. T.Z. performed disome-seq, mRNA-seq, and molecular biological experi-ments. T.Z. and J.W. performed monosome-seq. T.Z. and S.C. prepared the samples for MS/MS. Y.-M.C. performed dataanalyses for the above-mentioned experiments. Y.L., T.Z., and N.G. performed cryo-EM and the corresponding data ana-lysis. T.Z., Y.-M.C., N.G., and W.Q. wrote the manuscript. The authors read and approved the final manuscript.
FundingThis work was supported by grants from the National Key R&D Program of China (2019YFA0508700), the NationalNatural Science Foundation of China (31900455 to T.Z., 31725007 and 31630087 to N.G., and 31922014 to W.Q.), andthe Youth Innovation Promotion Association of CAS (2020099).
Availability of data and materialsThe S. cerevisiae genome (SGD R64-1-1) was downloaded from https://www.yeastgenome.org/ [75]. The protein sec-ondary structure annotation of yeast protein was retrieved from UniProt (https://www.uniprot.org/) [89]. The humangenome (Ensembl Genes 101) was retrieved from Ensembl [87]. Orthologous gene pairs between yeast and humanwere retrieved from Ensembl BioMarts [91] and NCBI HomoloGene [92].The high-throughput sequencing data of disome-seq, monosome-seq, and mRNA-seq discussed in this publicationhave been deposited in NCBI GEO [96] and are accessible through GEO Series accession number GSE158572 [97]. Themass spectrometry proteomics data have been deposited to the ProteomeXchange Consortium (http://proteomecentral.proteomexchange.org) via the PRIDE partner repository [98] with the dataset identifier PXD015271[99]. The cryo-EM density maps have been deposited in the Electron Microscopy Data Bank (EMDB) (http://www.emdataresource.org/) [100] under accession numbers of EMD-30553 [101] and EMD-30554 [102] (the leading and trail-ing ribosomes of disome collected without cycloheximide in the lysis buffer) and EMD-30580 [103] and EMD-30581[104] (the leading and trailing ribosomes of disome collected with cycloheximide in the lysis buffer). Codes to analyzethe data are available at GitHub, under the terms of the MIT license [105], and at Zenodo [106].
Ethics approval and consent to participateNot applicable.
Consent for publicationNot applicable.
Competing interestsThe authors declare no competing interests.
Zhao et al. Genome Biology (2021) 22:16 Page 31 of 35

Author details1State Key Laboratory of Plant Genomics, Institute of Genetics and Developmental Biology, Innovation Academy forSeed Design, Chinese Academy of Sciences, Beijing 100101, China. 2Key Laboratory of Genetic Network Biology,Institute of Genetics and Developmental Biology, Innovation Academy for Seed Design, Chinese Academy of Sciences,Beijing 100101, China. 3University of Chinese Academy of Sciences, Beijing 100049, China. 4Peking University-TsinghuaUniversity-National Institute of Biological Sciences Joint Graduate Program, School of Life Science, Tsinghua University,Beijing 100084, China. 5State Key Laboratory of Membrane Biology, Peking-Tsinghua Center for Life Sciences, School ofLife Sciences, Peking University, Beijing 100871, China.
Received: 23 April 2020 Accepted: 20 December 2020
References1. Chu D, Kazana E, Bellanger N, Singh T, Tuite MF, von der Haar T. Translation elongation can control translation initiation
on eukaryotic mRNAs. EMBO J. 2014;33:21–34.2. Stein KC, Frydman J. The stop-and-go traffic regulating protein biogenesis: how translation kinetics controls proteostasis.
J Biol Chem. 2019;294:2076–84.3. Zhao TL, Zhang S, Qian WF. Cis-regulatory mechanisms and biological effects of translation elongation. Yi Chuan. 2020;
42:613–31.4. Agashe D, Martinez-Gomez NC, Drummond DA, Marx CJ. Good codons, bad transcript: large reductions in gene
expression and fitness arising from synonymous mutations in a key enzyme. Mol Biol Evol. 2013;30:549–60.5. Sharma AK, O'Brien EP. Non-equilibrium coupling of protein structure and function to translation-elongation kinetics.
Curr Opin Struct Biol. 2018;49:94–103.6. Gershenson A, Gierasch LM. Protein folding in the cell: challenges and progress. Curr Opin Struct Biol. 2011;21:32–41.7. Drummond DA, Wilke CO. Mistranslation-induced protein misfolding as a dominant constraint on coding-sequence
evolution. Cell. 2008;134:341–52.8. Richter JD, Coller J. Pausing on polyribosomes: make way for elongation in translational control. Cell. 2015;163:292–300.9. Ikeuchi K, Tesina P, Matsuo Y, Sugiyama T, Cheng J, Saeki Y, Tanaka K, Becker T, Beckmann R, Inada T. Collided
ribosomes form a unique structural interface to induce Hel2-driven quality control pathways. EMBO J. 2019;38:e100276.10. Juszkiewicz S, Hegde RS. Initiation of quality control during poly(A) translation requires site-specific ribosome
ubiquitination. Mol Cell. 2017;65:743–50 e744.11. Sundaramoorthy E, Leonard M, Mak R, Liao J, Fulzele A, Bennett EJ. ZNF598 and RACK1 regulate mammalian ribosome-
associated quality control function by mediating regulatory 40S ribosomal ubiquitylation. Mol Cell. 2017;65:751–60 e754.12. Park H, Subramaniam AR. Inverted translational control of eukaryotic gene expression by ribosome collisions. PLoS Biol.
2019;17:e3000396.13. Brandman O, Hegde RS. Ribosome-associated protein quality control. Nat Struct Mol Biol. 2016;23:7–15.14. Joazeiro CAP. Mechanisms and functions of ribosome-associated protein quality control. Nat Rev Mol Cell Biol. 2019;20:
368–83.15. Matsuo Y, Tesina P, Nakajima S, Mizuno M, Endo A, Buschauer R, Cheng J, Shounai O, Ikeuchi K, Saeki Y, et al. RQT
complex dissociates ribosomes collided on endogenous RQC substrate SDD1. Nat Struct Mol Biol. 2020;27:323–32.16. Juszkiewicz S, Chandrasekaran V, Lin Z, Kraatz S, Ramakrishnan V, Hegde RS. ZNF598 is a quality control sensor of
collided ribosomes. Mol Cell. 2018;72:469–81 e467.17. Ingolia NT, Ghaemmaghami S, Newman JR, Weissman JS. Genome-wide analysis in vivo of translation with nucleotide
resolution using ribosome profiling. Science. 2009;324:218–23.18. Ingolia NT. Ribosome profiling: new views of translation, from single codons to genome scale. Nat Rev Genet. 2014;15:
205–13.19. Hussmann JA, Patchett S, Johnson A, Sawyer S, Press WH. Understanding biases in ribosome profiling experiments
reveals signatures of translation dynamics in yeast. PLoS Genet. 2015;11:e1005732.20. Weinberg DE, Shah P, Eichhorn SW, Hussmann JA, Plotkin JB, Bartel DP. Improved ribosome-footprint and mRNA
measurements provide insights into dynamics and regulation of yeast translation. Cell Rep. 2016;14:1787–99.21. Qian W, Yang JR, Pearson NM, Maclean C, Zhang J. Balanced codon usage optimizes eukaryotic translational efficiency.
Plos Genet. 2012;8:e1002603.22. Charneski CA, Hurst LD. Positively charged residues are the major determinants of ribosomal velocity. Plos Biol. 2013;11:
e1001508.23. Yang JR, Chen X, Zhang J. Codon-by-codon modulation of translational speed and accuracy via mRNA folding. Plos Biol.
2014;12:e1001910.24. Guydosh NR, Green R. Dom34 rescues ribosomes in 3′ untranslated regions. Cell. 2014;156:950–62.25. Ivanov IP, Shin BS, Loughran G, Tzani I, Young-Baird SK, Cao C, Atkins JF, Dever TE. Polyamine control of translation
elongation regulates start site selection on antizyme inhibitor mRNA via ribosome queuing. Mol Cell. 2018;70:254–64 e256.26. Diament A, Feldman A, Schochet E, Kupiec M, Arava Y, Tuller T. The extent of ribosome queuing in budding yeast. Plos
Comput Biol. 2018;14:e1005951.27. Wruck F, Katranidis A, Nierhaus KH, Buldt G, Hegner M. Translation and folding of single proteins in real time. Proc Natl
Acad Sci U S A. 2017;114:E4399–407.28. Hershberg R, Petrov DA. Selection on codon bias. Annu Rev Genet. 2008;42:287–99.29. Nissley DA, O'Brien EP. Altered co-translational processing plays a role in Huntington’s pathogenesis-a hypothesis. Front
Mol Neurosci. 2016;9:54.30. Clarke TF, Clark PL. Rare codons cluster. Plos One. 2008;3:e3412.31. Chen S, Li K, Cao W, Wang J, Zhao T, Huan Q, Yang YF, Wu S, Qian W. Codon-resolution analysis reveals a direct and
context-dependent impact of individual synonymous mutations on mRNA level. Mol Biol Evol. 2017;34:2944–58.32. Yu CH, Dang Y, Zhou Z, Wu C, Zhao F, Sachs MS, Liu Y. Codon usage influences the local rate of translation elongation
to regulate co-translational protein folding. Mol Cell. 2015;59:744–54.
Zhao et al. Genome Biology (2021) 22:16 Page 32 of 35

33. Arava Y, Wang Y, Storey JD, Liu CL, Brown PO, Herschlag D. Genome-wide analysis of mRNA translation profiles inSaccharomyces cerevisiae. Proc Natl Acad Sci U S A. 2003;100:3889–94.
34. Klopotowski T, Wiater A. Synergism of aminotriazole and phosphate on the inhibition of yeast imidazole glycerolphosphate dehydratase. Arch Biochem Biophys. 1965;112:562–6.
35. Patel BK, Gavin-Smyth J, Liebman SW. The yeast global transcriptional co-repressor protein Cyc8 can propagate as aprion. Nat Cell Biol. 2009;11:344–9.
36. Fang NN, Chan GT, Zhu M, Comyn SA, Persaud A, Deshaies RJ, Rotin D, Gsponer J, Mayor T. Rsp5/Nedd4 is the mainubiquitin ligase that targets cytosolic misfolded proteins following heat stress. Nat Cell Biol. 2014;16:1227–37.
37. Weinert BT, Scholz C, Wagner SA, Iesmantavicius V, Su D, Daniel JA, Choudhary C. Lysine succinylation is a frequentlyoccurring modification in prokaryotes and eukaryotes and extensively overlaps with acetylation. Cell Rep. 2013;4:842–51.
38. Han P, Shichino Y, Schneider-Poetsch T, Mito M, Hashimoto S, Udagawa T, Kohno K, Yoshida M, Mishima Y, Inada T,Iwasaki S. Genome-wide survey of ribosome collision. Cell Rep. 2020;31:107610.
39. Hedges SB, Dudley J, Kumar S. TimeTree: a public knowledge-base of divergence times among organisms.Bioinformatics. 2006;22:2971–2.
40. Rodnina MV. The ribosome in action: tuning of translational efficiency and protein folding. Protein Sci. 2016;25:1390–406.41. Nelson DL, Lehninger AL, Cox MM. Lehninger principles of biochemistry. 5th ed. New York: W. H. Freeman; 2008.42. Bryson JW, Betz SF, Lu HS, Suich DJ, Zhou HX, O'Neil KT, DeGrado WF. Protein design: a hierarchic approach. Science.
1995;270:935–41.43. Myers JK, Pace CN, Scholtz JM. Helix propensities are identical in proteins and peptides. Biochemistry. 1997;36:10923–9.44. Chandrasekaran V, Juszkiewicz S, Choi J, Puglisi JD, Brown A, Shao S, Ramakrishnan V, Hegde RS. Mechanism of
ribosome stalling during translation of a poly(A) tail. Nat Struct Mol Biol. 2019;26:1132–40.45. Sharp PM, Li WH. The codon adaptation index--a measure of directional synonymous codon usage bias, and its
potential applications. Nucleic Acids Res. 1987;15:1281–95.46. Joazeiro CAP. Ribosomal stalling during translation: providing substrates for ribosome-associated protein quality control.
Annu Rev Cell Dev Biol. 2017;33:343–68.47. Matsuo Y, Ikeuchi K, Saeki Y, Iwasaki S, Schmidt C, Udagawa T, Sato F, Tsuchiya H, Becker T, Tanaka K, et al.
Ubiquitination of stalled ribosome triggers ribosome-associated quality control. Nat Commun. 2017;8:159.48. Ikeuchi K, Izawa T, Inada T. Recent progress on the molecular mechanism of quality controls induced by ribosome
stalling. Front Genet. 2018;9:743.49. Doring K, Ahmed N, Riemer T, Suresh HG, Vainshtein Y, Habich M, Riemer J, Mayer MP, O'Brien EP, Kramer G, Bukau B.
Profiling Ssb-nascent chain interactions reveals principles of Hsp70-assisted folding. Cell. 2017;170:298–311 e220.50. Fuchs RT, Sun Z, Zhuang F, Robb GB. Bias in ligation-based small RNA sequencing library construction is determined by
adaptor and RNA structure. Plos One. 2015;10:e0126049.51. Lareau LF, Hite DH, Hogan GJ, Brown PO. Distinct stages of the translation elongation cycle revealed by sequencing
ribosome-protected mRNA fragments. Elife. 2014;3:e01257.52. Mohammad F, Green R, Buskirk AR. A systematically-revised ribosome profiling method for bacteria reveals pauses at
single-codon resolution. Elife. 2019;8:e42591.53. Wu CC, Zinshteyn B, Wehner KA, Green R. High-resolution ribosome profiling defines discrete ribosome elongation
states and translational regulation during cellular stress. Mol Cell. 2019;73:959–70 e955.54. Mohammad F, Woolstenhulme CJ, Green R, Buskirk AR. Clarifying the translational pausing landscape in bacteria by
ribosome profiling. Cell Rep. 2016;14:686–94.55. McGlincy NJ, Ingolia NT. Transcriptome-wide measurement of translation by ribosome profiling. Methods. 2017;126:112–29.56. Meydan S, Guydosh NR. Disome and trisome profiling reveal genome-wide targets of ribosome quality control. Mol Cell.
2020;79:588–602 e586.57. Arpat AB, Liechti A, De Matos M, Dreos R, Janich P, Gatfield D. Transcriptome-wide sites of collided ribosomes reveal
principles of translational pausing. Genome Res. 2020;30:985–99.58. Prabhakar A, Capece MC, Petrov A, Choi J, Puglisi JD. Post-termination ribosome intermediate acts as the gateway to
ribosome recycling. Cell Rep. 2017;20:161–72.59. Presnyak V, Alhusaini N, Chen YH, Martin S, Morris N, Kline N, Olson S, Weinberg D, Baker KE, Graveley BR, Coller J.
Codon optimality is a major determinant of mRNA stability. Cell. 2015;160:1111–24.60. Aitken CE, Puglisi JD. Following the intersubunit conformation of the ribosome during translation in real time. Nat
Struct Mol Biol. 2010;17:793–800.61. Pelechano V, Wei W, Steinmetz LM. Widespread co-translational RNA decay reveals ribosome dynamics. Cell. 2015;161:
1400–12.62. Tuller T, Carmi A, Vestsigian K, Navon S, Dorfan Y, Zaborske J, Pan T, Dahan O, Furman I, Pilpel Y. An evolutionarily
conserved mechanism for controlling the efficiency of protein translation. Cell. 2010;141:344–54.63. Schneider-Poetsch T, Ju J, Eyler DE, Dang Y, Bhat S, Merrick WC, Green R, Shen B, Liu JO. Inhibition of eukaryotic
translation elongation by cycloheximide and lactimidomycin. Nat Chem Biol. 2010;6:209–17.64. Archer SK, Shirokikh NE, Beilharz TH, Preiss T. Dynamics of ribosome scanning and recycling revealed by translation
complex profiling. Nature. 2016;535:570–4.65. Williams AJ, Paulson HL. Polyglutamine neurodegeneration: protein misfolding revisited. Trends Neurosci. 2008;31:521–8.66. Rauscher S, Baud S, Miao M, Keeley FW, Pomes R. Proline and glycine control protein self-organization into elastomeric
or amyloid fibrils. Structure. 2006;14:1667–76.67. Nilsson OB, Hedman R, Marino J, Wickles S, Bischoff L, Johansson M, Muller-Lucks A, Trovato F, Puglisi JD, O'Brien EP,
et al. Cotranslational protein folding inside the ribosome exit tunnel. Cell Rep. 2015;12:1533–40.68. Fedyukina DV, Cavagnero S. Protein folding at the exit tunnel. Annu Rev Biophys. 2011;40:337–59.69. Voss NR, Gerstein M, Steitz TA, Moore PB. The geometry of the ribosomal polypeptide exit tunnel. J Mol Biol. 2006;360:
893–906.70. Stein KC, Kriel A, Frydman J. Nascent polypeptide domain topology and elongation rate direct the cotranslational
hierarchy of Hsp70 and TRiC/CCT. Mol Cell. 2019;75:1117–30 e1115.
Zhao et al. Genome Biology (2021) 22:16 Page 33 of 35

71. Chotewutmontri P, Barkan A. Dynamics of chloroplast translation during chloroplast differentiation in maize. Plos Genet.2016;12:e1006106.
72. Bazzini AA, Lee MT, Giraldez AJ. Ribosome profiling shows that miR-430 reduces translation before causing mRNA decayin zebrafish. Science. 2012;336:233–7.
73. Chen J, Brunner AD, Cogan JZ, Nunez JK, Fields AP, Adamson B, Itzhak DN, Li JY, Mann M, Leonetti MD, Weissman JS.Pervasive functional translation of noncanonical human open reading frames. Science. 2020;367:1140–6.
74. Martin M. Cutadapt removes adapter sequences from high-throughput sequencing reads. EMBnet J. 2011;17:10–2.75. Cherry JM, Hong EL, Amundsen C, Balakrishnan R, Binkley G, Chan ET, Christie KR, Costanzo MC, Dwight SS, Engel SR,
et al. Saccharomyces Genome Database: the genomics resource of budding yeast. Nucleic Acids Res. 2012;40:D700–5.76. Langmead B, Trapnell C, Pop M, Salzberg SL. Ultrafast and memory-efficient alignment of short DNA sequences to the
human genome. Genome Biol. 2009;10:R25.77. Kim D, Pertea G, Trapnell C, Pimentel H, Kelley R, Salzberg SL. TopHat2: accurate alignment of transcriptomes in the
presence of insertions, deletions and gene fusions. Genome Biol. 2013;14:R36.78. Lu J, Deutsch C. Folding zones inside the ribosomal exit tunnel. Nat Struct Mol Biol. 2005;12:1123–9.79. Merritt GH, Naemi WR, Mugnier P, Webb HM, Tuite MF, von der Haar T. Decoding accuracy in eRF1 mutants and its
correlation with pleiotropic quantitative traits in yeast. Nucleic Acids Res. 2010;38:5479–92.80. Mastronarde DN. Automated electron microscope tomography using robust prediction of specimen movements. J
Struct Biol. 2005;152:36–51.81. Zheng SQ, Palovcak E, Armache JP, Verba KA, Cheng Y, Agard DA. MotionCor2: anisotropic correction of beam-induced
motion for improved cryo-electron microscopy. Nat Methods. 2017;14:331–2.82. Shaikh TR, Gao H, Baxter WT, Asturias FJ, Boisset N, Leith A, Frank J. SPIDER image processing for single-particle
reconstruction of biological macromolecules from electron micrographs. Nat Protoc. 2008;3:1941–74.83. Zhang K. Gctf: real-time CTF determination and correction. J Struct Biol. 2016;193:1–12.84. Zivanov J, Nakane T, Forsberg BO, Kimanius D, Hagen WJ, Lindahl E, Scheres SH. New tools for automated high-
resolution cryo-EM structure determination in RELION-3. eLife. 2018;7:e42166.85. Chen Y, Chen S, Li K, Zhang Y, Huang X, Li T, Wu S, Wang Y, Carey LB, Qian W. Overdosage of balanced protein
complexes reduces proliferation rate in aneuploid cells. Cell Syst. 2019;9:129–42 e125.86. Cox J, Mann M. MaxQuant enables high peptide identification rates, individualized p.p.b.-range mass accuracies and
proteome-wide protein quantification. Nat Biotechnol. 2008;26:1367–72.87. Yates AD, Achuthan P, Akanni W, Allen J, Allen J, Alvarez-Jarreta J, Amode MR, Armean IM, Azov AG, Bennett R, et al.
Ensembl 2020. Nucleic Acids Res. 2020;48:D682–8.88. Dobin A, Davis CA, Schlesinger F, Drenkow J, Zaleski C, Jha S, Batut P, Chaisson M, Gingeras TR. STAR: ultrafast universal
RNA-seq aligner. Bioinformatics. 2013;29:15–21.89. UniProt Consortium. UniProt: a worldwide hub of protein knowledge. Nucleic Acids Res. 2019;47:D506–15.90. Garnier J, Gibrat JF, Robson B. GOR method for predicting protein secondary structure from amino acid sequence.
Methods Enzymol. 1996;266:540–53.91. Kinsella RJ, Kahari A, Haider S, Zamora J, Proctor G, Spudich G, Almeida-King J, Staines D, Derwent P, Kerhornou A, et al.
Ensembl BioMarts: a hub for data retrieval across taxonomic space. Database (Oxford). 2011;2011:bar030.92. Resource Coordinators NCBI. Database resources of the National Center for Biotechnology Information. Nucleic Acids
Res. 2018;46:D8–D13.93. Larkin MA, Blackshields G, Brown NP, Chenna R, McGettigan PA, McWilliam H, Valentin F, Wallace IM, Wilm A, Lopez R,
et al. Clustal W and Clustal X version 2.0. Bioinformatics. 2007;23:2947–8.94. Kumar S, Stecher G, Suleski M, Hedges SB. TimeTree: a resource for timelines, timetrees, and divergence times. Mol Biol
Evol. 2017;34:1812–9.95. Lorenz R, Bernhart SH, Honer Zu Siederdissen C, Tafer H, Flamm C, Stadler PF, Hofacker IL. ViennaRNA Package 2.0.
Algorithms Mol Biol. 2011;6:26.96. Barrett T, Wilhite SE, Ledoux P, Evangelista C, Kim IF, Tomashevsky M, Marshall KA, Phillippy KH, Sherman PM, Holko M,
et al. NCBI GEO: archive for functional genomics data sets--update. Nucleic Acids Res. 2013;41:D991–5.97. Zhao T, Chen Y-M, Li Y, Wang J, Chen S, Gao N, Qian W. Disome-seq data in yeast cells. Gene Expression Omnibus.
2020. https://www.ncbi.nlm.nih.gov/geo/query/acc.cgi?acc=GSE158572. Accessed 10 Dec 2020.98. Perez-Riverol Y, Csordas A, Bai J, Bernal-Llinares M, Hewapathirana S, Kundu DJ, Inuganti A, Griss J, Mayer G, Eisenacher
M, et al. The PRIDE database and related tools and resources in 2019: improving support for quantification data. NucleicAcids Res. 2019;47:D442–50.
99. Zhao T, Chen Y-M, Li Y, Wang J, Chen S, Gao N, Qian W. Disome-seq reveals sequence-mediated coupling oftranslational pauses and protein structures. ProteomeXchange Consortium. 2020. https://www.ebi.ac.uk/pride/archive/projects/PXD015271. Accessed 10 Dec 2020.
100. Lawson CL, Baker ML, Best C, Bi C, Dougherty M, Feng P, van Ginkel G, Devkota B, Lagerstedt I, Ludtke SJ, et al.EMDataBank.org: unified data resource for CryoEM. Nucleic Acids Res. 2011;39:D456–64.
101. Zhao T, Chen Y-M, Li Y, Wang J, Chen S, Gao N, Qian W. Cryo-EM structure of disome from saccharomyces cerevisiae,the leading ribosome in the rotated state with A/P and P/E tRNAs. Electron Microscopy Data Bank. 2020. https://www.ebi.ac.uk/pdbe/entry/emdb/EMD-30553. Accessed 23 Dec 2020.
102. Zhao T, Chen Y-M, Li Y, Wang J, Chen S, Gao N, Qian W. Cryo-EM structure of disome from saccharomyces cerevisiae,the trailing ribosome in the rotated state with A/P and P/E tRNAs. Electron Microscopy Data Bank. 2020. https://www.ebi.ac.uk/pdbe/entry/emdb/EMD-30554. Accessed 23 Dec 2020.
103. Zhao T, Chen Y-M, Li Y, Wang J, Chen S, Gao N, Qian W. Cryo-EM structure of disome from saccharomyces cerevisiae,the leading ribosome in the rotated state with A/P and P/E tRNAs (cycloheximide treatment). Electron Microscopy DataBank. 2020. https://www.ebi.ac.uk/pdbe/entry/emdb/EMD-30580. Accessed 23 Dec 2020.
104. Zhao T, Chen Y-M, Li Y, Wang J, Chen S, Gao N, Qian W. Cryo-EM structure of disome from saccharomyces cerevisiae,the trailing ribosome in the rotated state with A/P and P/E tRNAs (cycloheximide treatment). Electron Microscopy DataBank. 2020. https://www.ebi.ac.uk/pdbe/entry/emdb/EMD-30581. Accessed 23 Dec 2020.
Zhao et al. Genome Biology (2021) 22:16 Page 34 of 35

105. Zhao T, Chen Y-M, Li Y, Wang J, Chen S, Gao N, Qian W. Disome-seq. Github. 2020. https://github.com/mingming-cgz/Disome-seq. Accessed 10 Dec 2020.
106. Zhao T, Chen Y-M, Li Y, Wang J, Chen S, Gao N, Qian W. Disome-seq. Zenodo. 2020. https://doi.org/10.5281/zenodo.4312535. Accessed 10 Dec 2020.
Publisher’s NoteSpringer Nature remains neutral with regard to jurisdictional claims in published maps and institutional affiliations.
Zhao et al. Genome Biology (2021) 22:16 Page 35 of 35

![Ribosome Stoichiometry: From Form to Function · Ribosome abundance: A major model, also termed the ribosome concentration hypothesis [3], that explains how ribosomes could exert](https://img.dokumen.tips/doc/110x75/60de31e56d30fc4fb30719b8/ribosome-stoichiometry-from-form-to-function-ribosome-abundance-a-major-model.jpg)