Embed Size (px)
Citation preview
Page 1/12
Analysis of Cell-free Circulating DNA Fragment Sizeand Level in Patients With Lumbar DegenerativeDiseaseAkihiko Hiyama ( [email protected] )
Tokai University School of MedicineDaisuke Sakai
Tokai University School of MedicineSatoshi Nomura
Tokai University School of MedicineHiroyuki Katoh
Tokai University School of MedicineMasahiko Watanabe
Tokai University School of Medicine
Research Article
Keywords: Cell-free circulating DNA, low back pain, lumbar degenerative disease, numeric rating scale,lateral lumbar interbody fusion
Posted Date: May 12th, 2021
DOI: https://doi.org/10.21203/rs.3.rs-497374/v1
License: This work is licensed under a Creative Commons Attribution 4.0 International License. Read Full License
Page 2/12
AbstractBackground: Cell-free circulating DNA (cfDNA), which can be extracted by liquid biopsy, has been studiedas a noninvasive biomarker for various diseases. The potential of cfDNA fragment size and level as amarker for low back pain (LBP) has never been studied. We investigated whether cfDNA is a biomarker ofLBP severity in patients with a lumbar degenerative disease (LDD).
Methods: Blood samples were obtained from patients with LDD (n = 21) before and immediately afterspinal surgery. Plasma DNA was isolated and examined for cfDNA fragment size and concentration. Acohort of healthy volunteers (n = 5) constituted the control group.
Results: The cfDNA fragment size tended to be shorter in patients than in healthy controls, but thisdifference was not signi�cant (P = .224). cfDNA level was signi�cantly higher in LDD patients (mean0.642±0.199 ng/mL, range 0.302–1.150 ng/mL) than in healthy controls (mean 0.429±0.064 ng/mL,range 0.366–0.506 ng/mL) (P = .029). cfDNA level correlated positively with present pain (r = .421, P =.036), maximum pain (r = .419, P = .037), average pain (r = .566, P = .003), low back pain (r = .403, P =.041), leg pain (r = .480, P = .013), and leg numbness (r = .455, P = .020). cfDNA fragment size did notdiffer from before to after surgery, but cfDNA level increased postoperatively in patients with LDD.
Conclusions: This was the �rst study investigating whether cfDNA fragment size and level are associatedwith pain, including LBP, in patients with LDD. Our �ndings suggest that cfDNA level may be an objectiveindicator of pain and surgical invasiveness in patients with LDD.
BackgroundLow back pain (LBP) is among the ten most frequent reasons for visiting a primary care practitioneracross all adult age groups [1]. In industrialized countries, the lifetime prevalence of LBP is 70–90%, andthe 1-year prevalence is 15–45% [2]. Clinically, LBP is caused by multiple triggers, but the most commonetiologies of LBP include intervertebral disc herniation, lumbar spinal stenosis, and lumbar degenerativedisease (LDD). LBP management comprises various intervention strategies, including surgery andnonmedical interventions such as exercise, behavioral therapy, and alternative therapies.Pharmacological intervention is the most frequently recommended intervention for LBP [3]. In addition tononsteroidal anti-in�ammatory drugs and muscle relaxants, opioids, tramadol, benzodiazepines, andgabapentin (for radiculopathy) have now been added possible pharmacological interventions. Spinesurgeons are prescribing drugs that are likely to be useful for symptomatic treatment while consideringthe disease's pathophysiology that causes LBP.
The severity of LBP is evaluated according to the therapeutic effects of treatment, whose effectiveness isbased on subjective evaluation and, at present, there are no biomarkers for evaluating LBP objectively.Various evaluation scales, such as the visual analog scale and numeric rating scale (NRS), are used toevaluate LBP. Basic research using animal models is limited by the inability to identify pain in theanimals. Objective evaluation with a measuring device or biomarker that can measure pain is required;

Page 3/12
however, the lack of a biomarker to quantify pain is a barrier to LBP research. Cell-free circulating DNA(cfDNA) is generally found in small amounts in the blood of healthy people. Elevated cfDNA levels havebeen reported in patients with malignant or autoimmune diseases, myocardial infarction, and trauma [4–6] and suggested that the release of cfDNA into the circulation may be useful, although nonspeci�c, amarker of tissue injury. The use of cfDNA level as a potential marker of the severity of LBP has not beenstudied. Therefore, the purpose of this study was to investigate whether cfDNA level is a biomarker ofLBP severity in patients with LDD.
Material And Methods
ParticipantsThe inclusion criteria included patients 20 years of age or older and the need for surgery in the lumbarspine (L1–L2 to L5–S1) to treat LDD. All patients were diagnosed based on a detailed history,neurological and radiographic examinations, myelogram results, computed tomography (CT) scans aftermyelography, and/or magnetic resonance imaging (MRI).
In brief, participants were eligible if they had undergone spinal surgery, been diagnosed with adegenerative spinal disease based on physical and imaging �ndings, had received su�cient explanationabout participating in this study, and had voluntarily provided written consent.
The exclusion criteria included severe mental illness, di�culty standing or moving because of severeimpairment of paralysis, prior (within �ve years) or current cancer diagnosis, suspect a current infection,or the presence of a condition considered by the principal investigator to be a contraindication forinclusion in this study.
The authors provided information to the patients about the use of samples obtained during surgery, andpatients were asked to read and sign the consent forms before surgery. Demographic data and clinicaldata were obtained after inclusion in the study.
Between October 2020 and February 2021, blood was collected from 21 patients (13 males, 8 females;age, 72.2 ± 8.2 years) diagnosed with LDD accompanied by LBP, leg pain (LP), and/or leg numbness (LN)and hospitalized for surgical purposes. Blood samples were collected from 5 healthy volunteers (4 males,1 female; age, 38.0 ± 7.8 years) who had never experienced LBP and were selected as the control group.Table 1 summarizes surgical records for LDD patients and the CRP data on the �rst day after surgery.
ProceduresA 10 mL blood sample was collected in Streck Cell-Free DNA BCT® (Streck, La Vista, NE, USA). In the LDDpatients, blood samples were collected immediately after induction of general anesthesia (baseline) andimmediately after surgery.

Page 4/12
Whole blood was separated from Streck Cell-Free DNA BCT® by centrifugation at 1,700 g for 10 min at25°C. The upper plasma layer was removed, transferred to a new conical tube, and centrifuged at 5000 gfor 10 min. Plasma samples were stored at − 80°C until use. C-reactive protein (CRP) concentration wasmeasured in postoperative blood samples as an indicator of the invasiveness of the surgery.
Determination of cfDNA fragment size and levelThe method uses only 1µl of DNA from plasma for one test, is very sensitive, with a dynamic range of 0–400 ng/µl human genomic DNA, and yields highly reproducible results. Qubit 3.0, with a dsDNA assay kit,was used to measure the total amount of genomic DNA.
cfDNA fragment size was determined for each sample with an Agilent 2100 Bioanalyzer and the AgilentHigh Sensitivity DNA chip, according to the manufacturer’s instructions. The fragment size of cfDNA wasdetermined with the Agilent 2100 Bioanalyzer software and de�ned as the main peak mode(corresponding to one nucleosome plus linker, derived from apoptotic cells) electropherogram. cfDNAlevel was performed using the Qubit �uorometer 3.0 (Invitrogen, Life Technologies) combined with theQubit dsDNA HS Assay Kit (Invitrogen, Life technologies; cat #Q32851, lot #1724782). As per themanufacturer’s instructions, a standard curve was prepared using the 0 and 10 ng/µL Qubit standardsprovided in the kit. For all cfDNA extractions, 1µL of the sample was diluted in 199 µL Qubit workingsolution before measurement.
Pain intensityThe intensity of pain was assessed using a 3-level NRS [7]. Each patient was asked to grade the actualpain level experienced at present (present pain; NRSPresent), maximum pain level experienced in the pastfour weeks (maximum pain; NRSMax), and average pain level experienced in the past four weeks (averagepain; NRSAve) on a scale of 0 to 10 (where 0 is no pain and 10 is the worst pain imaginable). NRS scoreswere obtained for LBP (NRSLBP), LP (NRSLP), and LN (NRSLN). Spearman's correlational analysisassessed the relationships between the patients' cfDNA levels and their respective NRS scores.
Statistical analysisStatistical analyses were performed using IBM SPSS Statistics (version 23.0; IBM Corp., Armonk, NY,USA). All values are expressed as mean ± standard deviation. The Shapiro–Wilk test was used to con�rmthe normality of the data distribution. For the primary analysis, Student's t-test or the Mann–Whitney Utest was used to compare the two groups. The Student's t-test was used to analyze normally distributeddata and the Mann–Whitney U test for nonnormally distributed data. The Mann–Whitney U test was usedto compare cfDNA fragment size, and Student's t-test was used to compare cfDNA levels between controland patient samples. Pearson's product-moment correlation analysis or Spearman's product-momentcorrelational analysis was used to identifying signi�cant associations.
We used the G-Power Analysis software program to determine the power for sample size validity(G*Power 3.1). Post-hoc analysis using G*Power 3.1 was performed to detect the correlation of subjects
Page 5/12
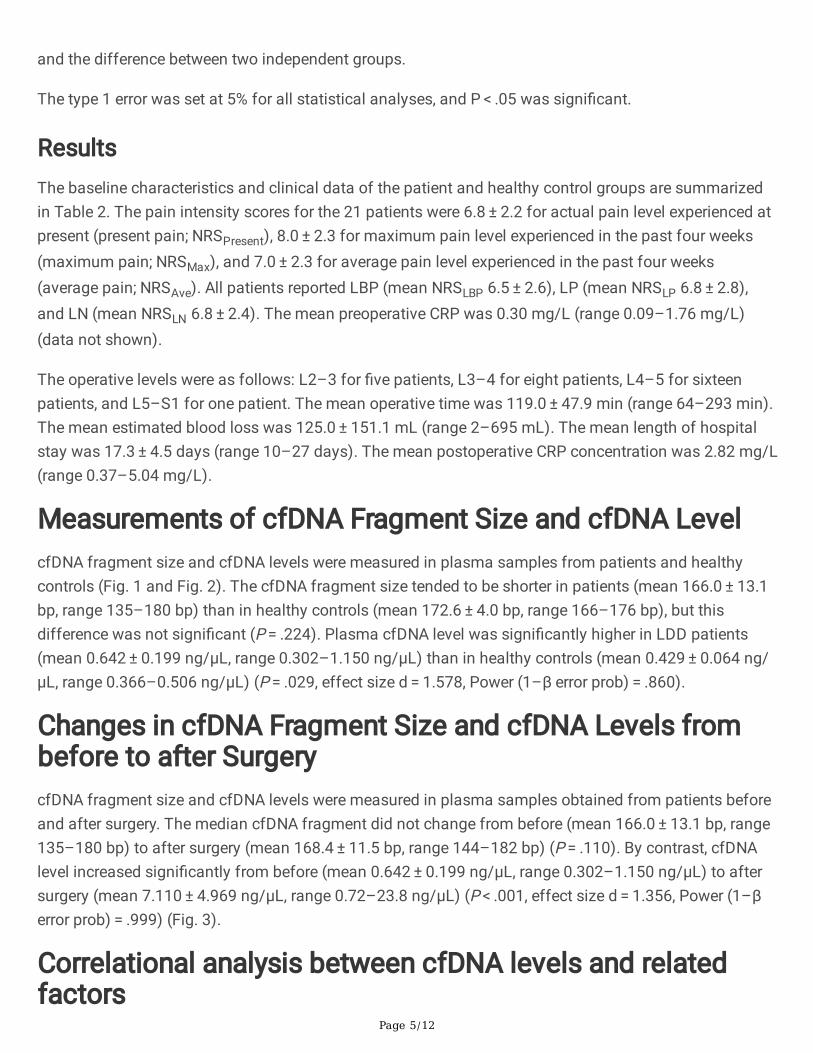
and the difference between two independent groups.
The type 1 error was set at 5% for all statistical analyses, and P < .05 was signi�cant.
ResultsThe baseline characteristics and clinical data of the patient and healthy control groups are summarizedin Table 2. The pain intensity scores for the 21 patients were 6.8 ± 2.2 for actual pain level experienced atpresent (present pain; NRSPresent), 8.0 ± 2.3 for maximum pain level experienced in the past four weeks(maximum pain; NRSMax), and 7.0 ± 2.3 for average pain level experienced in the past four weeks(average pain; NRSAve). All patients reported LBP (mean NRSLBP 6.5 ± 2.6), LP (mean NRSLP 6.8 ± 2.8),and LN (mean NRSLN 6.8 ± 2.4). The mean preoperative CRP was 0.30 mg/L (range 0.09–1.76 mg/L)(data not shown).
The operative levels were as follows: L2–3 for �ve patients, L3–4 for eight patients, L4–5 for sixteenpatients, and L5–S1 for one patient. The mean operative time was 119.0 ± 47.9 min (range 64–293 min).The mean estimated blood loss was 125.0 ± 151.1 mL (range 2–695 mL). The mean length of hospitalstay was 17.3 ± 4.5 days (range 10–27 days). The mean postoperative CRP concentration was 2.82 mg/L(range 0.37–5.04 mg/L).
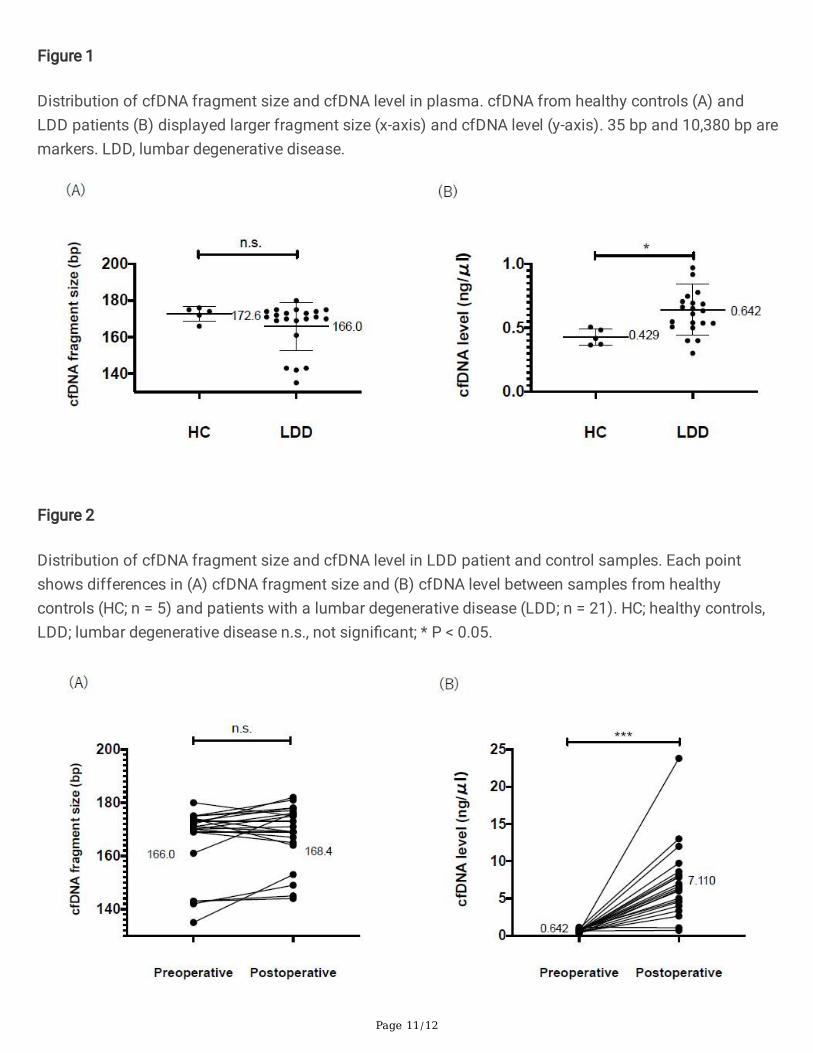
Measurements of cfDNA Fragment Size and cfDNA LevelcfDNA fragment size and cfDNA levels were measured in plasma samples from patients and healthycontrols (Fig. 1 and Fig. 2). The cfDNA fragment size tended to be shorter in patients (mean 166.0 ± 13.1bp, range 135–180 bp) than in healthy controls (mean 172.6 ± 4.0 bp, range 166–176 bp), but thisdifference was not signi�cant (P = .224). Plasma cfDNA level was signi�cantly higher in LDD patients(mean 0.642 ± 0.199 ng/µL, range 0.302–1.150 ng/µL) than in healthy controls (mean 0.429 ± 0.064 ng/µL, range 0.366–0.506 ng/µL) (P = .029, effect size d = 1.578, Power (1–β error prob) = .860).
Changes in cfDNA Fragment Size and cfDNA Levels frombefore to after SurgerycfDNA fragment size and cfDNA levels were measured in plasma samples obtained from patients beforeand after surgery. The median cfDNA fragment did not change from before (mean 166.0 ± 13.1 bp, range135–180 bp) to after surgery (mean 168.4 ± 11.5 bp, range 144–182 bp) (P = .110). By contrast, cfDNAlevel increased signi�cantly from before (mean 0.642 ± 0.199 ng/µL, range 0.302–1.150 ng/µL) to aftersurgery (mean 7.110 ± 4.969 ng/µL, range 0.72–23.8 ng/µL) (P < .001, effect size d = 1.356, Power (1–βerror prob) = .999) (Fig. 3).
Correlational analysis between cfDNA levels and relatedfactors

Page 6/12
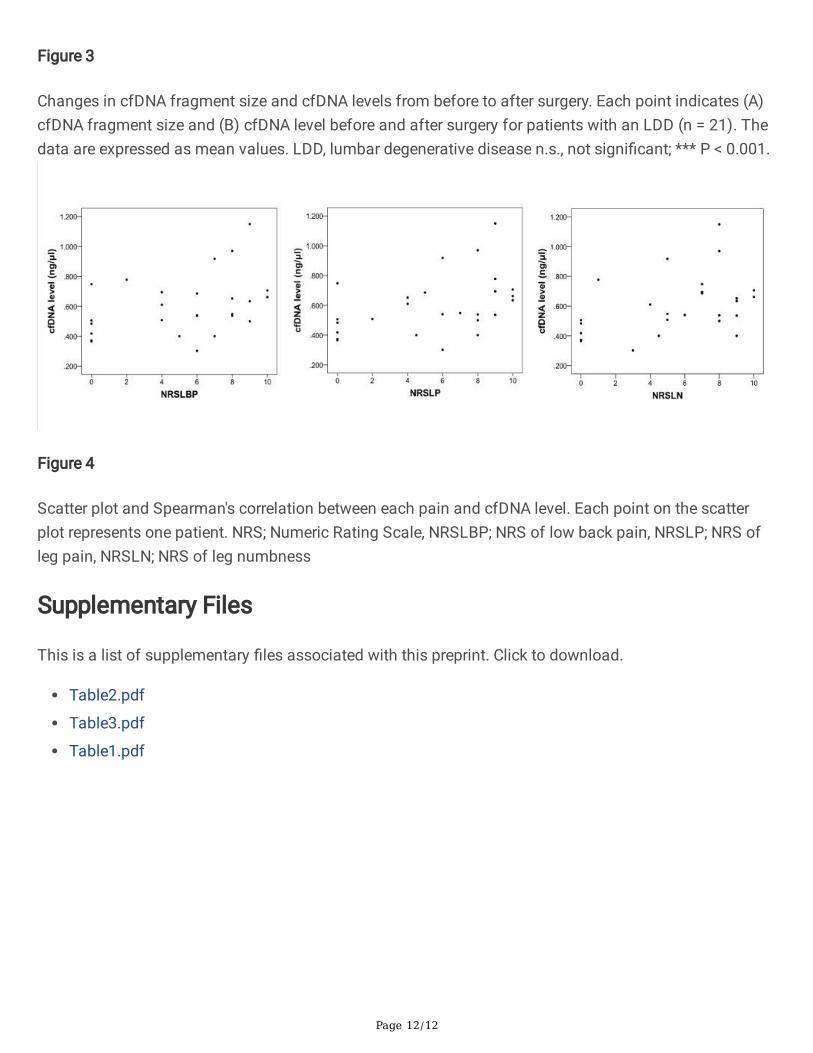
A power analysis performed to detect the correlation (effect size d = 0.5, alpha = 0.05, total sample size = 26, two-tailed) showed 0.806. We �rstly performed correlational analysis between age and cfDNA levelsbut found no signi�cant correlation between age and cfDNA levels (r = .325, P = .106, data not shown).Table 3 shows the correlations between cfDNA level or cfDNA fragment size and various indictors of painand between postoperative cfDNA level and related factors. cfDNA level (n = 26) correlated signi�cantlywith NRSPresent (r = .421, P = .036), NRSMax (r = .419, P = .037), NRSAve (r = .566, P = .003), NRSLBP (r = .403,P = .041), NRSLP (r = .480, P = .013), and NRSLN (r = .455, P = .020). Figure 4 demonstrate the distributionof each NRS and cfDNA level. cfDNA fragment size did not correlate signi�cantly with any of theseindicators of pain.
Postoperative cfDNA level did not correlate signi�cantly with other factors such as operative time (r = .312, P = .168), blood loss (r = .364, P = .105), length of hospital stay (r = .203, P = .405), postoperativeCRP concentration (r = .371, P = .097), age (r = − .113, P = .625), and gender (r = .0016, P = .944).
DiscussionThis is the �rst study investigating whether cfDNA fragment size and level in LDD patients are associatedwith various aspects of pain, such as LBP. Elevated cfDNA levels have been reported to be associatedwith a variety of pathological processes [8–10]. For example, an association between cfDNA and painhas been reported in patients with sickle-cell disease [11]. That study reported that cfDNA levels inpatients' plasma were higher during acute painful episodes with steady-state levels.
Against this background, we speculated that the cfDNA fragment size and levels in LDD patients mightalso vary depending on the degree of pain. We �rst compared cfDNA fragment size and levels in LDDpatients and healthy controls. cfDNA fragment size tended to be shorter in patients than in controls, butthis difference was not signi�cant. Previous reports on cfDNA in cancer patients showed that cfDNA sizeis shorter in fragments originating in tumor cells than in those from nonmalignant cells [12–14]. Anincreased number of short cfDNA fragments may re�ect an increase in tumor DNA level relative tonontumor DNA in the blood of cancer patients. It is thought that DNA methylation may affect cfDNA size[15, 16]. However, the mechanism responsible for the shorter cfDNA fragment size is not well understood.
We also found that cfDNA level was higher in patients with LDD than in healthy controls. Interestingly, thecfDNA level correlated positively with some NRS scores. It is di�cult to treat LN in patients with LDD, andpostoperative symptoms may remain, and the lack of an index exacerbates this problem to evaluate painobjectively. Our results suggest that the cfDNA level may help in quantifying LBP and LP, and LN.
Subsequently, we investigated whether spinal surgery's invasiveness affects cfDNA fragment size andlevel by measuring these before and after surgery in LDD patients. We found no signi�cant change incfDNA fragment size from before to after surgery, although cfDNA level increased postoperatively in allpatients. A previous study reported that lactate dehydrogenase (LDH), an enzyme found in various livingcells, functions as a biomarker of injury and disease [17]. That study found that elevated cfDNA levels

Page 7/12
and elevated LDH levels were associated with tissue damage, directly associated with pain [18]. Patientswere receiving chemotherapy exhibit signi�cant increases in cfDNA levels 24 h and eight days afterchemotherapy [19] and several cycles after chemotherapy [20]. These data led us to investigate whetherthe invasiveness of spinal surgery would be related to an increase in cfDNA level. In recent years,minimally invasive spinal surgery has attracted much attention. However, surgical time, bleeding loss,length of hospital stay, and postoperative CRP levels are often used to evaluate surgical invasiveness[21]. Surgical procedures induce a complex stress response proportional to the magnitude of the injury,operating time, and intraoperative blood loss. The adverse metabolic and hemodynamic effects of thisstress response can cause many problems during the perioperative period. Thus, decreasing the stressresponse to surgery is a key factor for improving clinical outcomes.
Circulating cfDNA in the blood may be helpful for objectively assessing the body's response to aninvasive procedure such as surgery, and its measurement may have potential value for diagnosis andprognosis. Our results suggest that cfDNA level may be a new biomarker for assessing the invasivenessin spinal surgery. A previous report noted that the extent to which postoperative CRP level is elevatedseems to depend upon the severity of the procedure [22]. However, there was no correlation betweencfDNA level and postoperative CRP level. Further research is needed to clarify whether cfDNA level isrelated to CRP level and postoperative pain.
A limitation of this study is the small sample size in both the patient and control groups. However, thepost hoc power analysis at the cfDNA level was 0.8 or higher between LDD patients and the healthycontrols. In addition, the ages of the two groups differed signi�cantly. However, it is di�cult to obtainsamples from patients with an average age of 70 who do not experience pain because many older peoplehave some form of locomotor disorder. Another limitation is that we did not compare cfDNA fragmentsize and levels for different surgical procedures. To evaluate surgical invasiveness more concretely, wethink it is necessary to compare cfDNA size and level between decompression surgery and fusion surgeryor traditional open surgery and minimally invasive spinal surgery. Additionally, comorbidities can affectthe cfDNA fragment size and level; to reduce the possible bias. It would help control for comorbidities infuture studies. Finally, we have not investigated the role of cfDNA in predicting symptom response totreatment and sustainability in the long term.
ConclusionsIn summary, cfDNA level was higher in patients with LDD exhibit than in healthy controls. cfDNA levelsincreased signi�cantly after spinal surgery and correlated positively with various pains, including leg painor numbness. However, the clinical relevance of an elevated cfDNA level after spinal surgery is unknown,and the utility of cfDNA as a marker of mechanical tissue injury remains unproven. Further studiesinvolving serial measurements in more signi�cant, independent patient populations are needed todetermine whether cfDNA quanti�cation is appropriate for clinical use.
Abbreviations

Page 8/12
cfDNA, Cell-free circulating DNA; LBP, low back pain; LDD, lumbar degenerative disc disease; CT,computed tomography; MRI, magnetic resonance imaging; LP, leg pain; LN, leg numbness; CRP, C-reactiveprotein
DeclarationsEthics approval and consent to participate
The Committee approved the study on Ethics and the Institutional Review Board of Tokai UniversitySchool of Medicine, the House Clinical Study Committee, and the Pro�t Reciprocity Committee (20R-263).The study was conducted following the principles outlined in the Helsinki declaration [23].
All the participants provided informed written consent for the provision of blood sampling and clinicaldata.
Consent for publication
Not applicable.
Availability of data and materials
Data were available upon request from the corresponding author.
Competing interests
The authors AH, DS, SN, HK, and MW declare that they have no competing interests.
Funding
This study was supported in part by the Research and Study Program of the Tokai University EducationalSystem General Research Organization and by a Grant-in-Aid for Scienti�c Research (KAKENHI).
Authors’ contributions
All authors have read and approved the manuscript. AH conceived and designed the study and interpretedthe results; DS acquired the data and interpreted the results; SN analyzed the data and interpreted theresults; HK acquired the data and interpreted the results; MW conceived and designed the study andinterpreted the results.
Acknowledgments
We much appreciate the helpful advice of Dr. Masayuki Tanaka and the technical assistance of Dr. KanaeKitatani and Dr. Tadayuki Sato.
References
Page 9/12
1. Blount BW, Hart G, Ehreth JL: A description of the content of army family practice. J Am Board FamPract 1993, 6(2):143-152.
2. Papageorgiou AC, Croft PR, Ferry S, Jayson MI, Silman AJ: Estimating the prevalence of low backpain in the general population. Evidence from the South Manchester Back Pain Survey. Spine (PhilaPa 1976) 1995, 20(17):1889-1894.
3. Vogt MT, Kwoh CK, Cope DK, Osial TA, Culyba M, Starz TW: Analgesic usage for low back pain:impact on health care costs and service use. Spine (Phila Pa 1976) 2005, 30(9):1075-1081.
4. Fu X, Wan S, Hann HW, Myers RE, Hann RS, Au J, Chen B, Xing J, Yang H: Relative telomere length: anovel non-invasive biomarker for the risk of non-cirrhotic hepatocellular carcinoma in patients withchronic hepatitis B infection. Eur J Cancer 2012, 48(7):1014-1022.
5. Jylhävä J, Lyytikäinen LP, Kähönen M, Hutri-Kähönen N, Kettunen J, Viikari J, Raitakari OT, LehtimäkiT, Hurme M: A genome-wide association study identi�es UGT1A1 as a regulator of serum cell-freeDNA in young adults: The Cardiovascular Risk in Young Finns Study. PLoS One 2012, 7(4):e35426.
�. Lögters T, Paunel-Görgülü A, Zilkens C, Altrichter J, Scholz M, Thelen S, Krauspe R, Margraf S, Jeri T,Windolf J et al: Diagnostic accuracy of neutrophil-derived circulating free DNA (cf-DNA/NETs) forseptic arthritis. J Orthop Res 2009, 27(11):1401-1407.
7. Dworkin RH, Turk DC, Farrar JT, Haythornthwaite JA, Jensen MP, Katz NP, Kerns RD, Stucki G, AllenRR, Bellamy N et al: Core outcome measures for chronic pain clinical trials: IMMPACTrecommendations. Pain 2005, 113(1-2):9-19.
�. Clementi A, Virzì GM, Brocca A, Pastori S, de Cal M, Marcante S, Granata A, Ronco C: The Role of Cell-Free Plasma DNA in Critically Ill Patients with Sepsis. Blood Purif 2016, 41(1-3):34-40.
9. Gögenur M, Burcharth J, Gögenur I: The role of total cell-free DNA in predicting outcomes amongtrauma patients in the intensive care unit: a systematic review. Crit Care 2017, 21(1):14.
10. Schwarzenbach H, Hoon DS, Pantel K: Cell-free nucleic acids as biomarkers in cancer patients. NatRev Cancer 2011, 11(6):426-437.
11. Al-Humood S, Zueriq R, Al-Faris L, Marouf R, Al-Mulla F: Circulating cell-free DNA in sickle celldisease: is it a potentially useful biomarker?Arch Pathol Lab Med 2014, 138(5):678-683.
12. Diehl F, Li M, Dressman D, He Y, Shen D, Szabo S, Diaz LA, Jr., Goodman SN, David KA, Juhl H et al:Detection and quanti�cation of mutations in the plasma of patients with colorectal tumors. Proc NatlAcad Sci U S A 2005, 102(45):16368-16373.
13. Jiang P, Chan CW, Chan KC, Cheng SH, Wong J, Wong VW, Wong GL, Chan SL, Mok TS, Chan HL et al:Lengthening and shortening of plasma DNA in hepatocellular carcinoma patients. Proc Natl Acad SciU S A 2015, 112(11):E1317-1325.
14. Mouliere F, Robert B, Arnau Peyrotte E, Del Rio M, Ychou M, Molina F, Gongora C, Thierry AR: Highfragmentation characterizes tumour-derived circulating DNA. PLoS One 2011, 6(9):e23418.
15. Lapin M, Oltedal S, Tjensvoll K, Buhl T, Smaaland R, Garresori H, Javle M, Glenjen NI, Abelseth BK,Gilje B et al: Fragment size and level of cell-free DNA provide prognostic information in patients withadvanced pancreatic cancer. J Transl Med 2018, 16(1):300.

Page 10/12
1�. Sun K, Jiang P, Wong AIC, Cheng YKY, Cheng SH, Zhang H, Chan KCA, Leung TY, Chiu RWK, Lo YMD:Size-tagged preferred ends in maternal plasma DNA shed light on the production mechanism andshow utility in noninvasive prenatal testing. Proc Natl Acad Sci U S A 2018, 115(22):E5106-e5114.
17. Lahoud RM, O'Shea A, El-Mouhayyar C, Atre ID, Eurboonyanun K, Harisinghani M: Tumour markersand their utility in imaging of abdominal and pelvic malignancies. Clin Radiol 2021, 76(2):99-107.
1�. de Souza Barbosa Ê, Santos Ibiapina HN, Rocha da Silva S, Costa AG, Val FF, Mendonça-da-Silva I,Carlos de Lima Ferreira L, Sartim MA, Monteiro WM, Cardoso de Melo G et al: Association of cfDNAlevels and bothrops envenomation. Toxicon 2021, 192:66-73.
19. Swystun LL, Mukherjee S, Liaw PC: Breast cancer chemotherapy induces the release of cell-free DNA,a novel procoagulant stimulus. J Thromb Haemost 2011, 9(11):2313-2321.
20. Kwee S, Song MA, Cheng I, Loo L, Tiirikainen M: Measurement of circulating cell-free DNA in relationto 18F-�uorocholine PET/CT imaging in chemotherapy-treated advanced prostate cancer. Clin TranslSci 2012, 5(1):65-70.
21. Houten JK, Tandon A: Comparison of postoperative values for C-reactive protein in minimallyinvasive and open lumbar spinal fusion surgery. Surg Neurol Int 2011, 2:94.
22. Al-Jabi Y, El-Shawarby A: Value of C-reactive protein after neurosurgery: a prospective study. Br JNeurosurg 2010, 24(6):653-659.
23. World Medical Association Declaration of Helsinki: ethical principles for medical research involvinghuman subjects. Jama 2013, 310(20):2191-2194.
TablesDue to technical limitations, table 1-3 is only available as a download in the Supplemental Files section.
Figures
Page 11/12
Figure 1
Distribution of cfDNA fragment size and cfDNA level in plasma. cfDNA from healthy controls (A) andLDD patients (B) displayed larger fragment size (x-axis) and cfDNA level (y-axis). 35 bp and 10,380 bp aremarkers. LDD, lumbar degenerative disease.
Figure 2
Distribution of cfDNA fragment size and cfDNA level in LDD patient and control samples. Each pointshows differences in (A) cfDNA fragment size and (B) cfDNA level between samples from healthycontrols (HC; n = 5) and patients with a lumbar degenerative disease (LDD; n = 21). HC; healthy controls,LDD; lumbar degenerative disease n.s., not signi�cant; * P < 0.05.
Page 12/12
Figure 3
Changes in cfDNA fragment size and cfDNA levels from before to after surgery. Each point indicates (A)cfDNA fragment size and (B) cfDNA level before and after surgery for patients with an LDD (n = 21). Thedata are expressed as mean values. LDD, lumbar degenerative disease n.s., not signi�cant; *** P < 0.001.
Figure 4
Scatter plot and Spearman's correlation between each pain and cfDNA level. Each point on the scatterplot represents one patient. NRS; Numeric Rating Scale, NRSLBP; NRS of low back pain, NRSLP; NRS ofleg pain, NRSLN; NRS of leg numbness
Supplementary Files
This is a list of supplementary �les associated with this preprint. Click to download.
Table2.pdf
Table3.pdf
Table1.pdf