Embed Size (px)
Citation preview

Discussion Points
• Update on Assessment Phase (J2 & DLR)
• Enrollment Model (RSP)– Sophisticated Forecast Model– Catchments (Planning Areas)– Components in Model
• The Projections (RSP)

About RSP – Visualizing Success
Founded in 2003
Over 20 years of GIS experience
Clients in Arkansas, Iowa, Illinois, Kansas, Missouri, and North Dakota
Projection accuracy of 97% or greater
Robert Schwarz, CEO,AICP, REFP
Justin Hawley
Andy Henry, KGISD

VISUALIZING
SUCCESS

Who is Involved / How it Begin
School District- Administration
County/City/Others- City of Bismarck- Burleigh County- Realtors- Developers- Assessor
Collaboration

District Map• District Boundary (purple)• City Limits (Bismarck and Lincoln)• Major Streets• Major water features• City Boundaries

Elementary Attendance Area Map• District Boundary (purple)• Major Streets• Major Parks• Elementary Attendance Areas

Middle School Attendance Area Map• District Boundary (purple)• Major Streets• Major Parks• Middle School Attendance Areas

High School Attendance Area Map• District Boundary (purple)• Major Streets• Major Parks• High School Attendance Areas
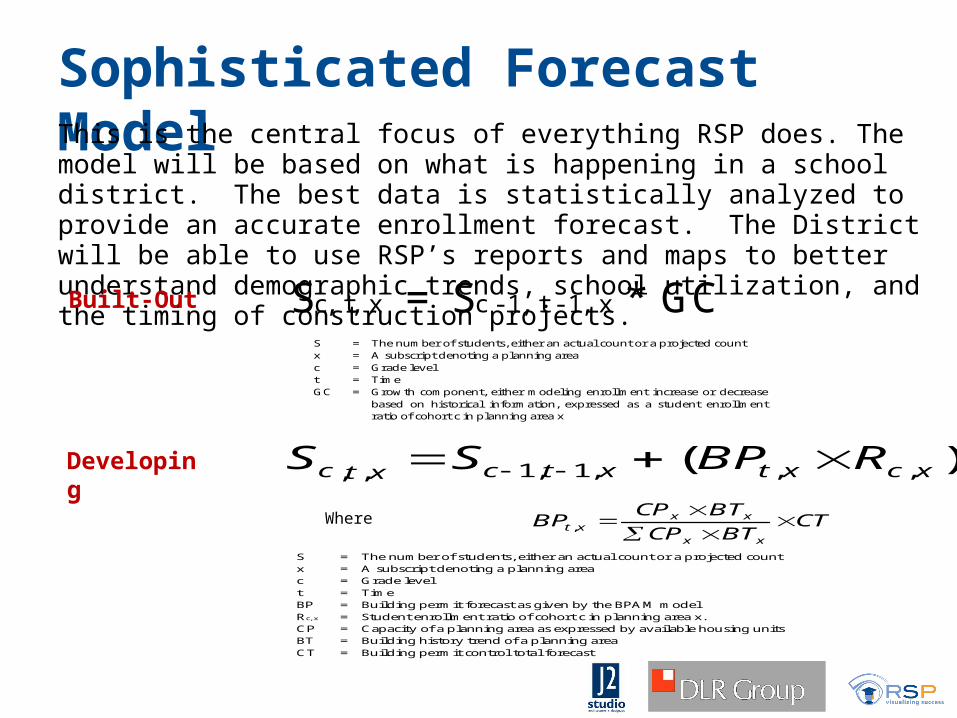
Sophisticated Forecast ModelThis is the central focus of everything RSP does. The model will be based on what is happening in a school district. The best data is statistically analyzed to provide an accurate enrollment forecast. The District will be able to use RSP’s reports and maps to better understand demographic trends, school utilization, and the timing of construction projects.
S = S * GCc, t, x c - 1, t - 1, x
S = The number of students, either an actual count or a projected count x = A subscript denoting a planning area in Blue Valley c = Grade level t = Time GC = Growth component, either modeling enrollment increase or decrease
based on historical information, expressed as a student enrollment ratio of cohort c in planning area x
)( ,,,1,1,, xcxtxtcxtc RBPSS
Where CTBTCP
BTCPBP
xx
xxxt
,
Built-Out
Developing
S = The number of students, either an actual count or a projected count x = A subscript denoting a planning area in Blue Valley c = Grade level t = Time BP = Building permit forecast as given by the BPAM model Rc, x = Student enrollment ratio of cohort c in planning area x. CP = Capacity of a planning area as expressed by available housing units BT = Building history trend of a planning area CT = Building permit control total forecast

Model Components
Cohort Growth
External Growth
Kindergarten Growth
Economic Scenarios COUNTY
CITY
ATTENDANCE AREAS
STREETS
DEVELOPMENT
STUDENTS/PEOPLE

Issues Addressed in Model
• Housing market changes• Economic conditions• Infrastructure Enhancements• Future residential growth patterns• Demographic trends• Enrollment trends

Assumptions For Future• The recession will likely last through 2011 and into 2012 and potentially longer• Mortgage interest should likely remain below 6%• Subprime loans will be kept in check• The rate of foreclosures should decline over the next five years• Recirculation of existing homes will remain stable• Final Platted developments in existing developments will be nearly built-out• Unemployment rates will remain below 12%• Nonresidential developments continue to be built to meet employment demand and need• Fuel prices will remain below $4.00• Private and Parochial school enrollment remains stable
If more of these variables track toward being positive for the district – likely will start moving toward the high projections – the converse can also occur – midpoint projection is what the district should use for planning purposes.

Planning Area Map• Natural and Manmade Features• Follows Attendance Areas• Type of Development (SF,MF,Dup, TH)• Green lines represent the Catchment areas RSP created

Planning Area Map• Natural and Manmade Features• Follows Attendance Areas• Type of Development (SF,MF,Dup, TH)• Green lines represent the Catchment areas RSP
created

An area of land defined by one of the following:• By Land Use (Residential, Commercial, Industrial)
• By Residential Density (Single-Family, Mobile Home, Duplex, Apartment)
• By Natural Features (Rivers and Creeks)
• By Manmade Features (Railroad and Roads)
Planning Area Definition

Planning Area Detail Map• Show the power of GIS information• See where students are located in relation to
streets, subdivisions, parcels

Past School Enrollment
Enrollment provided by the district
Largest class in 2011/12 – Kindergarten (936)Smallest class in 2011/12 – 6th grade (767)Graduating senior class smaller than the next year incoming Kindergarten class
Year K 1st 2nd 3rd 4th 5th 6th 7th 8th 9th 10th 11th 12th Total2005/06 672 703 760 731 771 732 747 845 791 874 915 885 895 10,3212006/07 809 722 751 797 775 826 775 798 865 809 861 854 800 10,4422007/08 769 830 735 773 809 805 841 828 804 888 800 827 816 10,5252008/09 841 773 834 758 800 815 824 856 835 840 868 779 791 10,6142009/10 821 820 766 836 750 807 815 837 872 842 805 825 768 10,5642010/11 850 823 827 780 839 756 806 855 839 902 850 803 842 10,7722011/12 936 848 850 833 787 851 767 819 837 849 902 824 798 10,901
Source: Bismarck Public Schools

Past School Enrollment Change
Enrollment provided by the district
Largest average class increase – Kindergarten to 1st grade (31.7)Largest average class decrease – 10th to 11th grade (-23.7)Propensity to have cohort increase students from year to year in nearly all grades
K 1st 2nd 3rd 4th 5th 6th 7th 8th 9th 10th 11thFrom To K 1st 2nd 3rd 4th 5th 6th 7th 8th 9th 10th 11th 12th
2004/05 2005/06 672 703 760 731 771 732 747 845 791 874 915 885 8952005/06 2006/07 137 50 48 37 44 55 43 51 20 18 -13 -61 -852006/07 2007/08 -40 21 13 22 12 30 15 53 6 23 -9 -34 -382007/08 2008/09 72 4 4 23 27 6 19 15 7 36 -20 -21 -362008/09 2009/10 -20 -21 -7 2 -8 7 0 13 16 7 -35 -43 -112009/10 2010/11 29 2 7 14 3 6 -1 40 2 30 8 -2 172010/11 2011/12 86 -2 27 6 7 12 11 13 -18 10 0 -26 -53-Yr Avg 31.7 -7.0 9.0 7.3 0.7 8.3 3.3 22.0 0.0 15.7 -9.0 -23.7 0.33-Yr Wavg 49.3 -3.8 14.7 8.0 3.2 9.2 5.2 22.0 -5.7 16.2 -3.2 -20.8 1.3Source: Bismarck Public Schools

Student Density 2005/06 Map• Students are geocoded (address matched to a
location)• Planning Areas populated by student location• Patterns should somewhat follow residential
inventory
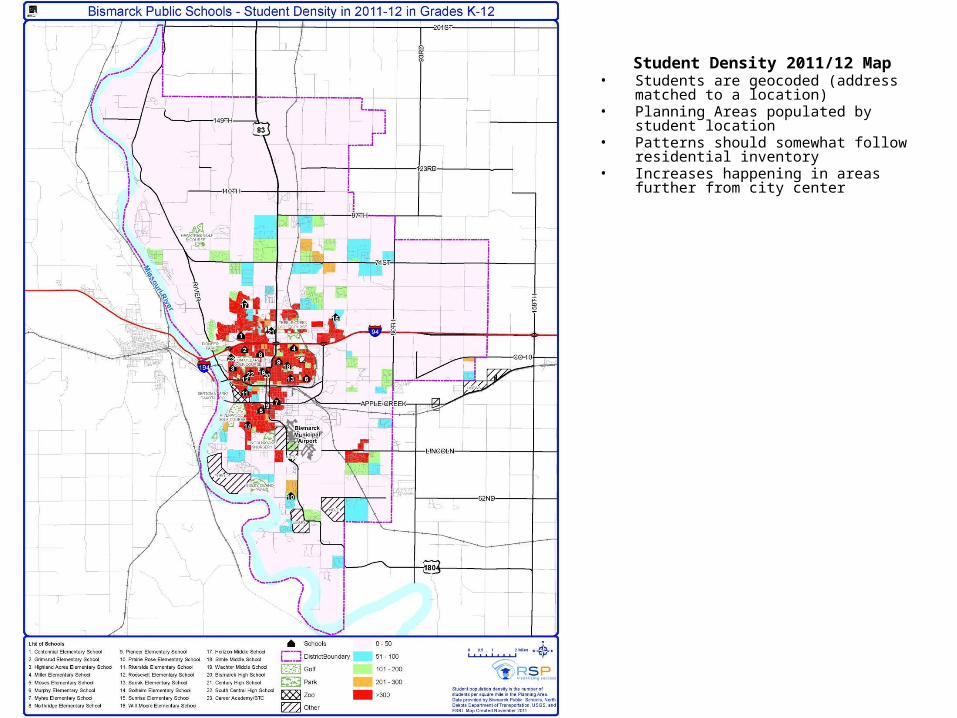
Student Density 2011/12 Map• Students are geocoded (address matched to a
location)• Planning Areas populated by student location• Patterns should somewhat follow residential
inventory• Increases happening in areas further from city
center

Past, Current & Future Enrollment
Source: Bismarck Public School District and RSP SFM & Demographic Models
The above numbers are not the Certified Enrollment CountDoes not include Home School, Private School, or Parochial School
5,116 5,455 5,562 5,645 5,615 5,681 5,872
2,510 2,472 2,520 2,531 2,551 2,596 2,505
2,695 2,515 2,443 2,438 2,398 2,495 2,524
6,087 6,246 6,487 6,728 6,977
2,466 2,523 2,528 2,636 2,681
2,570 2,581 2,5112,474 2,52910,321 10,442 10,525 10,614 10,564 10,772 10,901 11,123 11,349 11,526
11,838 12,188
0
2,000
4,000
6,000
8,000
10,000
12,000
14,000
2005/06
2006/07
2007/08
2008/09
2009/10
2010/11
2011/12
2012/13
2013/14
2014/15
2015/16
2016/17
ES MS HS Mid Proj ES Mid Proj MS Mid Proj HS District

District Level
Utilize Midpoint Projections for Planning Purposes
School StudentLocation 2007/08 2008/09 2009/10 2010/11 2011/12 2012/13 2013/14 2014/15 2015/16 2016/17 2012/13 2013/14 2014/15 2015/16 2016/17
ELEMENTARY TOTALReside 5,562 5,645 5,615 5,681 5,872 6,087 6,246 6,487 6,728 6,977 6,087 6,246 6,487 6,728 6,977
Grades K-6 Attend 5,562 5,645 5,615 5,681 5,872MIDDLE TOTAL
Reside 2,520 2,531 2,551 2,596 2,505 2,466 2,523 2,528 2,636 2,681 2,466 2,523 2,528 2,636 2,681Grades 7-9 Attend 2,520 2,531 2,551 2,596 2,505
HIGH TOTALReside 2,443 2,438 2,398 2,495 2,524 2,570 2,581 2,511 2,474 2,529 2,570 2,581 2,511 2,474 2,529
Grades 10-12 Attend 2,443 2,438 2,398 2,495 2,524DISTRICT K -12 TOTALS
Reside 10,525 10,614 10,564 10,772 10,901 11,123 11,349 11,526 11,838 12,188 11,123 11,349 11,526 11,838 12,188Grades K-12 Attend 10,525 10,614 10,564 10,772 10,901
Note 7: Res/Att (Reside/Attend) is the student who resides in the attendance area that they attend
Past School Enrollment Future Enrollment By Student Attendance Future Enrollment By Student Residence
Source: RSP & Associates, LLC - December 2011
Note 1: Student Projections are based on the residence of the student
Note 2: School Choice Options between Facilities are depicted in the Projections
Note 3: PreKindergarten students not in the enrollment projections Note 4: Capacity of each facility provided by DLR GroupNote 5: Reside is based on the student address
Note 6: Attend is based on which facility the student attends
MIDPOINT PROJECTION SHOWN IN TABLE

Elementary Level
Utilize Midpoint Projections for Planning Purposes
School StudentLocation 2007/08 2008/09 2009/10 2010/11 2011/12 2012/13 2013/14 2014/15 2015/16 2016/17 2012/13 2013/14 2014/15 2015/16 2016/17
Centennial Elementary Res/Att 418 423 435 451 466Reside 506 479 494 489 495 551 560 575 581 615 503 513 528 534 567
Grades K-6 Attend 508 504 524 528 547Grimsrud Elementary Res/Att 212 217 204 208 208
Reside 267 264 259 257 252 304 313 330 345 356 260 270 287 301 312Grades K-6 Attend 318 327 313 299 296
Highland Acres Elementary Res/Att 67 66 72 69 77Reside 90 87 86 81 97 149 152 151 158 156 95 99 97 104 102
Grades K-6 Attend 143 140 147 142 147Miller Elementary Res/Att 451 450 448 465 477
Reside 575 548 546 549 572 604 619 645 674 688 595 610 636 665 679Grades K-6 Attend 519 521 536 560 580
Moses Elementary Res/Att 226 247 216 227 233Reside 320 322 311 300 292 418 415 415 426 430 298 294 295 306 309
Grades K-6 Attend 423 437 413 430 408Murphy Elementary Res/Att 387 402 419 421 473
Reside 488 516 525 517 576 562 576 598 604 622 588 602 625 630 649Grades K-6 Attend 692 705 728 498 546
Myhre Elementary Res/Att 227 227 204 208 231Reside 322 323 319 318 345 310 319 324 338 349 361 370 375 389 400
Grades K-6 Attend 335 323 293 279 288Northridge Elementary Res/Att 420 435 431 476 532
Reside 554 569 586 632 675 658 712 765 843 948 719 773 826 903 1,009Grades K-6 Attend 693 698 709 579 611
Note 7: Res/Att (Reside/Attend) is the student who resides in the attendance area that they attend
Past School Enrollment Future Enrollment By Student Attendance Future Enrollment By Student Residence
Source: RSP & Associates, LLC - December 2011
Note 1: Student Projections are based on the residence of the student
Note 2: School Choice Options between Facilities are depicted in the Projections
Note 3: PreKindergarten students not in the enrollment projections Note 4: Capacity of each facility provided by DLR GroupNote 5: Reside is based on the student address
Note 6: Attend is based on which facility the student attends
MIDPOINT PROJECTION SHOWN IN TABLE

Elementary Level (cont)
Utilize Midpoint Projections for Planning Purposes
School StudentLocation 2007/08 2008/09 2009/10 2010/11 2011/12 2012/13 2013/14 2014/15 2015/16 2016/17 2012/13 2013/14 2014/15 2015/16 2016/17
Pioneer Elementary Res/Att 150 159 155 159 163Reside 214 219 222 211 221 285 301 317 325 323 223 239 255 263 261
Grades K-6 Attend 299 302 300 287 276Prairie Rose Elementary Res/Att 162 168 158 163 163
Reside 229 248 230 252 243 209 212 222 221 230 245 248 258 257 266Grades K-6 Attend 203 205 209 206 212
Riverside Elementary Res/Att 109 117 83 74 86Reside 167 161 127 132 132 114 99 96 105 107 133 119 116 125 126
Grades K-6 Attend 163 153 128 109 114Roosevelt Elementary Res/Att 104 117 120 112 122
Reside 187 196 196 185 193 162 162 166 170 173 201 201 204 208 211Grades K-6 Attend 150 155 157 143 156
Saxvik Elementary Res/Att 174 206 187 193 178Reside 277 309 298 296 278 258 264 265 273 272 289 295 295 304 302
Grades K-6 Attend 268 281 263 257 252Solheim Elementary Res/Att 365 385 363 362 378
Reside 468 490 462 454 465 540 543 541 537 548 472 475 473 468 479Grades K-6 Attend 511 534 516 526 532
Sunrise Elementary Res/Att 0 0 0 450 493Reside 494 499 499 534 548 540 554 601 632 678 587 601 648 679 725
Grades K-6 Attend 0 0 0 463 513Will Moore Elementary Res/Att 243 269 276 283 298
Reside 404 415 455 474 488 422 442 474 497 483 517 538 570 593 579Grades K-6 Attend 337 360 379 375 394
Note 7: Res/Att (Reside/Attend) is the student who resides in the attendance area that they attend
Past School Enrollment Future Enrollment By Student Attendance Future Enrollment By Student Residence
Source: RSP & Associates, LLC - December 2011
Note 1: Student Projections are based on the residence of the student
Note 2: School Choice Options between Facilities are depicted in the Projections
Note 3: PreKindergarten students not in the enrollment projections Note 4: Capacity of each facility provided by DLR GroupNote 5: Reside is based on the student address
Note 6: Attend is based on which facility the student attends
MIDPOINT PROJECTION SHOWN IN TABLE

Secondary Level
Utilize Midpoint Projections for Planning Purposes
School StudentLocation 2007/08 2008/09 2009/10 2010/11 2011/12 2012/13 2013/14 2014/15 2015/16 2016/17 2012/13 2013/14 2014/15 2015/16 2016/17
Horizon Middle Res/Att 674 699 665 709 679Reside 770 786 770 814 792 889 874 877 907 901 815 800 803 833 827
Grades 7-9 Attend 837 880 864 908 856Simle Middle Res/Att 725 697 711 737 697
Reside 932 925 942 967 922 815 851 850 902 954 899 934 933 985 1,037Grades 7-9 Attend 856 823 846 867 847
Wachter Middle Res/Att 720 727 732 710 689Reside 818 820 839 815 791 761 798 801 827 826 752 788 792 818 817
Grades 7-9 Attend 827 828 841 821 802Bismarck High Res/Att 1,106 1,063 1,048 1,086 1,071
Reside 1,338 1,298 1,253 1,291 1,282 1,338 1,315 1,289 1,245 1,296 1,299 1,276 1,249 1,205 1,256Grades 10-12 Attend 1,397 1,357 1,326 1,344 1,315
Century High Res/Att 825 877 885 946 994Reside 1,105 1,140 1,145 1,204 1,242 1,232 1,266 1,223 1,229 1,233 1,271 1,305 1,262 1,268 1,273
Grades 10-12 Attend 1,046 1,081 1,072 1,151 1,209
Note 7: Res/Att (Reside/Attend) is the student who resides in the attendance area that they attend
Past School Enrollment Future Enrollment By Student Attendance Future Enrollment By Student Residence
Source: RSP & Associates, LLC - December 2011
Note 1: Student Projections are based on the residence of the student
Note 2: School Choice Options between Facilities are depicted in the Projections
Note 3: PreKindergarten students not in the enrollment projections Note 4: Capacity of each facility provided by DLR GroupNote 5: Reside is based on the student address
Note 6: Attend is based on which facility the student attends
MIDPOINT PROJECTION SHOWN IN TABLE

Enrollment Conclusions• District midpoint projected enrollment will increase through the next five school years• The majority of enrollment increase will happen at the Elementary level• The modeling used accounts for out of district and open enrolled students• The greatest number of students in a grade are in the elementary• Enrollment tends to increase from grade to grade• Enrollment increases the most from Kindergarten classes• Educational programming changes may result in a different annual cohort change
between grades• Enrollment increases have occurred in some of the older developed areas of the
community• Several schools will likely exceed building capacity at either the Attend or Reside
midpoint projections• An Enrollment Study will assist with balancing enrollment at facilities• It is important that the district should continue to annually monitor enrollment trends