Embed Size (px)
Citation preview

C H A P T E R
3Discretionary Spending Options
D iscretionary spending—the part of federal spending that lawmakers control through annual appropriation acts—amounted to about $1.2 trillion, or 30 percent of total
federal outlays, in 2017. Just under half of that spending paid for defense programs. Spending on the Department of Defense’s (DoD’s) operation and maintenance accounted for more than 40 percent of discretionary spending on defense programs, and spending on military personnel accounted for nearly a quarter of that spend-ing (see Figure 3-1). Discretionary spending on nonde-fense activities was less concentrated. For instance, the largest categories of that spending were transportation; education, training, employment, and social services; and veterans’ benefits and services. Each category accounted for 10 percent to 15 percent of that spending.
The discretionary budget authority (that is, the authority to incur financial obligations) provided in appropriation acts results in outlays when the money is spent. Some appropriations (such as those for federal employees’ salaries) are spent quickly, but others (such as those for major construction projects) are disbursed over several years. Thus, in any given year, discretionary outlays include spending from new budget authority as well as spending from budget authority provided in earlier appropriations.1 Some fees and other charges that are triggered by appropriation action are categorized in the budget as offsetting collections or offsetting receipts and credited against discretionary spending.
1. For some major transportation programs, budget authority is considered mandatory, but the outlays resulting from that authority are discretionary. Budget authority for those programs is provided in authorizing legislation rather than appropriation acts, but the amount of that budget authority that the Department of Transportation can obligate each year is limited by appropriation acts. Those obligation limitations are treated as a measure of discretionary budgetary resources. For more information, see Congressional Budget Office, The Highway Trust Fund and the Treatment of Surface Transportation Programs in the Federal Budget (June 2014), www.cbo.gov/publication/45416.
Trends in Discretionary Spending Measured as a percentage of gross domestic product (GDP), discretionary outlays declined from 13.1 percent in 1968 to 6.0 percent in 1999 before rising and then falling again, to 6.2 percent in 2017 (see Figure 3-2). From 2012 through 2017, discretionary outlays mea-sured as a percentage of GDP dropped largely because of constraints imposed by the Budget Control Act of 2011 (Public Law 112-25) and lower spending for military operations in Afghanistan and Iraq.
In the Congressional Budget Office’s baseline projec-tions, discretionary outlays decline further relative to the size of the economy, falling from 6.3 percent of GDP in 2018—already below their 50-year average of 8.5 percent—to 5.4 percent in 2028. The recently enacted Bipartisan Budget Act of 2018 (P.L. 115-123) raised the limits on discretionary funding that other-wise would have been in place for 2018 and 2019. In 2020 and 2021, funding is scheduled to revert to the lower levels set by the Budget Control Act. In CBO’s baseline, discretionary appropriations for 2022 through 2028 grow from the 2021 amount at the rate of infla-tion, which is slower than projected growth in GDP, leading to an estimated decline in that spending relative to GDP. By 2028, discretionary spending for nondefense activities would equal 2.8 percent of GDP; for defense, it would equal 2.6 percent of GDP.2 Those would be the smallest shares of the economy that those categories have accounted for since the early 1960s.
Most of the long-term decline in total discretionary out-lays relative to GDP stems from a decrease in spending for national defense measured as a share of GDP. Starting from 9.2 percent of GDP in 1968, discretionary outlays for defense fell over the next several decades, reaching 2.9 percent at the turn of the century. Such spending began climbing again shortly thereafter and averaged 4.6 percent of GDP from 2009 through 2011. (The growth in defense spending over the 2001–2011 period
2. Most defense spending is funded through discretionary appropriations.

120 OPTIONS FOR REDUCING THE DEFICIT: 2019 TO 2028 DECEMBER 2018
was driven by military operations in Iraq and Afghanistan, which cost about 1 percent of GDP in 2011, for example.) Since then, discretionary outlays for defense have declined relative to the size of the economy, falling to 3.1 percent of GDP in 2017.
Discretionary spending for nondefense activities includes spending in areas such as education, transportation, veterans’ benefits and services, community and regional development, and administration of justice (which includes most of the spending of the Department of Homeland Security). That category also includes spend-ing on many health programs, such as public health activities, health and health care research initiatives, and certain other health-related activities. Spending on those health programs and activities totaled about $66 billion
in 2017, or about 11 percent of total discretionary spending on nondefense activities. (The federal govern-ment also helps pay for health insurance premiums for its civilian workers, but that funding is part of agencies’ budgets so most of it is excluded from that calculation.)
Over the past five decades, discretionary spending for nondefense activities has generally hovered between 3 percent and 4 percent of GDP. One exception was the period from 1976 to 1981, when such spending rose to almost 5 percent of GDP, on average. Another exception occurred from 2009 through 2011, when funding from the American Recovery and Reinvestment Act of 2009 (P.L. 111-5) boosted discretionary outlays for nondefense activities to between 4 percent and 4.4 percent of GDP. Those outlays have generally declined relative to the size
Figure 3-1 .
Composition of Discretionary Spending, 2017
0 10 20 30 40 50 60 70 80 90 100
0 10 20 30 40 50 60 70 80 90 100
Defense and nondefense spending each constituted approximately half of all discretionary spending in 2017.
Operation and Maintenance(41)
Military Personnel(23)
Procurement(18)
Other(18)
Transportation(15)
Education, Training, Employment, and Social Services(15)
Veterans’ Benefits and Services(12)
Health(10)
Income Security(11)
Administration of Justice (9)Percentage of Discretionary Spending for Nondefense Activities
Percentage of Discretionary Spending for Defense Activities
InternationalA�airs (8)
Other(20)
Source: Congressional Budget Office, using data from the Office of Management and Budget.
Other discretionary spending for defense includes outlays for research, development, test, and evaluation; military construction; family housing; and some defense-related activities of government entities other than the Department of Defense, such as the atomic energy activities of the Department of Energy.
Discretionary spending for health in the nondefense category excludes care provided by the Veterans Health Administration. Outlays for that care are included under veterans’ benefits and services.
Other nondefense discretionary spending includes outlays for general science, space, and technology; energy; natural resources and the environment; agriculture; commerce and housing credit; community and regional development; Medicare and Social Security (for administrative activities); and general government.

121CHAPTER THREE: DISCRETIONARY SPENDING OPTIONS OPTIONS FOR REDUCING THE DEFICIT: 2019 TO 2028
of the economy since then, dropping to 3.2 percent of GDP in 2017.
Method Underlying Discretionary Spending EstimatesExcept for some exceptions noted below, the budgetary effects described in this chapter were calculated relative to CBO’s adjusted April 2018 baseline projections of discretionary spending over the next 10 years and do not include changes as a result of 2019 appropriations.3 (CBO expects that the effects of those changes would be relatively small in most instances.) In accordance with section 257 of the Balanced Budget and Emergency Deficit Control Act of 1985 (P.L. 99-177), CBO’s projections reflect the assumption that current appropri-ations will continue in future years, with adjustments to keep pace with inflation. (Although CBO follows that law in constructing its baseline projections for individ-ual components of discretionary spending, its baseline projections of overall discretionary spending incorporate the caps and automatic spending reductions put in place by the Budget Control Act of 2011, as amended.)4 As
3. Those projections underlie the analysis in Congressional Budget Office, An Analysis of the President’s 2019 Budget (May 2018, revised August 2018), www.cbo.gov/publication/53884.
4. Those adjustments to discretionary funding are applied in the aggregate, rather than in each account, because CBO cannot predict how lawmakers will comply with the caps.
specified in law, CBO uses the following measures of inflation when constructing its baseline: the employment cost index for wages and salaries (applied to spending for federal personnel) and the GDP price index (applied to other spending). For each option in this section, CBO assumes that federal appropriations would be reduced accordingly to achieve the estimated budgetary savings.
Some options involving DoD’s operation and mainte-nance budget (Options 1, 2, 12, and 13) or acquisition budget (Options 5 through 10) were calculated on a different basis. Because CBO’s baseline projections do not reflect programmatic details for force structure, acquisition, and maintenance of specific weapon systems, the effects of those options were calculated relative to DoD’s planned spending as laid out in its 2019 Future Years Defense Program (FYDP). The FYDP provides details about DoD’s intended funding requests for the 2019–2023 period—including the Administration’s plans for the number of military and civilian personnel, the procurement and maintenance of weapon systems, and the amount that equipment is operated. Comparing estimates of DoD’s spending under a given option against that planned defense spending better captures the effects the option would have than comparing estimated spending under the option against CBO’s baseline pro-jections. Through 2023, the budgetary effects estimated for those 10 options are based on DoD’s estimates of the
Figure 3-2 .
Discretionary SpendingPercentage of Gross Domestic Product
0
2
4
6
8
10
12
14
1968 1973 1978 1983 1988 1993 1998 2003 2008 2013 2018 2023 2028
Actual Projected
Total Discretionary
Nondefense
Defense
Average Discretionary Spending, 1968 to 2017
(8.5 percent)
If current statutory limits on discretionary spending remained in place through 2021 and funding grew with inflation thereafter, discretionary spending would decline as a share of GDP over the next decade.
Source: Congressional Budget Office.
The projected values shown underlie the projections in Congressional Budget Office, An Analysis of the President’s 2019 Budget (May 2018, revised August 2018), www.cbo.gov/publication/53884.
122 OPTIONS FOR REDUCING THE DEFICIT: 2019 TO 2028 DECEMBER 2018
costs of its plans. From 2024 through 2028, the effects are based on DoD’s estimates when available (such as those in the Navy’s annual 30-year shipbuilding plan or those for the costs of selected individual aircraft) and on CBO’s projections of price and compensation trends for the overall economy when they are not. For an option that would cancel the planned acquisition of a weapon system, for example, the savings reported in this volume reflect DoD’s estimates of the costs of that system; CBO often adjusts those savings downward to account for the costs of purchasing and operating existing systems in place of the system that would be canceled. In addi-tion to showing the budgetary costs, each acquisition option includes a discussion of the effects of the option on DoD’s ability to perform its missions.
Because the costs of implementing the FYDP would exceed CBO’s baseline projections for defense spend-ing—in some cases, by significant amounts—the options involving military force structure, operation and main-tenance, and acquisition would not necessarily reduce deficits below those projected in CBO’s baseline. Rather, they are, at least in part, options for bringing DoD’s planned funding closer to the amounts projected in the baseline, which accord with the limits on such spending.
In many instances, CBO would have estimated higher costs for DoD’s planned programs than the amounts budgeted either in DoD’s FYDP or in CBO’s exten-sion of the FYDP, which relies primarily on DoD’s cost estimates.5 However, the savings from implementing an option relative to DoD’s budget request are better represented by the program’s costs in the FYDP and the extended FYDP than by CBO’s independent cost estimates. If lawmakers enacted legislation to cancel a planned weapon system or retire an existing system, for instance, DoD could eliminate the amounts budgeted for that system from its FYDP and increase the amounts for operating other systems to come closer to the funding limits currently in place.
The estimates included in the chapter are uncertain for at least several reasons. For instance, CBO’s baseline projections and DoD’s planned spending are uncertain, because actual appropriations could differ considerably from projected amounts. Furthermore, legislation would
5. For CBO’s estimates of the costs of DoD’s plans, see Congressional Budget Office, Long-Term Implications of the 2019 Future Years Defense Program (forthcoming).
be required to implement the options in this chapter, and the details of such legislation could differ from the assumptions that CBO made in developing its estimates.
Options in This ChapterThe 34 options in this chapter cover a broad array of discretionary programs, including some health care programs. Fifteen options in this chapter would affect defense programs, two options would affect health care spending, and the rest would affect nondefense programs. Some options include broad cuts—such as Option 1, which would reduce overall funding for DoD, or Option 32, which would decrease federal civilian employment. Others focus on specific programs: For instance, Option 20 concerns the Department of Energy’s programs for research and development in energy technologies. Some options would change the rules of eligibility for certain federal programs; Option 27, for example, would tighten eligibility criteria for Pell grants, and Option 30 would end the ability of certain veterans to obtain medical care from the Department of Veterans Affairs.
Some options that have been included in previous vol-umes have not been included in this edition. However, several of those options, such as changing the Home Equity Conversion Mortgage Program from a guarantee program to a direct loan program and eliminating certain forest service programs, are included in an abbreviated format in this edition’s appendix.
To reduce deficits through changes in discretionary spending, lawmakers would need to lower the statutory funding caps below the levels already established under current law or enact appropriations that were below those caps. The options in this chapter could be used to help accomplish either of those objectives. Alternatively, some of the options could be implemented to help com-ply with the existing caps on discretionary funding.
Under the constraints imposed by the Budget Control Act and the Bipartisan Budget Act of 2018, total discre-tionary spending over the 2019–2028 period is projected to be lower by $1.7 trillion (or about 12 percent) than it would be if the funding provided for 2018 was contin-ued in future years with increases for inflation.

123CHAPTER THREE: DISCRETIONARY SPENDING OPTIONS OPTIONS FOR REDUCING THE DEFICIT: 2019 TO 2028
BackgroundThe Department of Defense (DoD) received $616 bil-lion in appropriations for its base budget in 2019, the highest amount since 2010 (after adjusting for inflation). The Department’s Future Years Defense Plan (FYDP) for 2019 anticipates that base-budget levels will average about $650 billion per year (in 2019 dollars) through 2023. (DoD’s base budget is intended to fund endur-ing activities, such as day-to-day military and civilian operations and development and procurement of weapon systems. It does not include additional funding appropri-ated for nonpermanent activities, such as overseas con-tingency operations or other emergencies.) Before 2019, the amount appropriated in 2010 had been the highest for DoD’s base budget, which had grown by 50 per-cent since 2000, and surpassed even the 1985 budget, DoD’s largest peacetime budget during the Cold War. After 2012, DoD’s base budgets decreased under the constraints of the Budget Control Act of 2011 (BCA), averaging about $550 billion for 2013 through 2018.
OptionThis option encompasses two alternative decreases in DoD’s budget. The first would reduce DoD’s budget over three years so that funding in 2022 would be 10 percent less than the funding planned for that year
in the Administration’s 2019 FYDP. The second would reduce DoD’s budget by 5 percent over that same period. Both alternatives would allow for real (inflation-adjusted) growth of 1 percent annually after 2022.
Effects on the BudgetUnder the first alternative, funding for DoD in 2022 would be $637 billion, excluding funding for overseas contingency operations. That amount would still be large by historical standards; adjusted for inflation, it would be roughly in line with DoD’s base budget in 2012, the last budget prepared before the BCA’s caps were applied, and more than Cold War spending at its height. Through 2028, cumulative funding for DoD would be reduced by $591 billion under the first alternative. That estimate of savings is based on the costs of plans outlined in the 2019 FYDP (which defines plans and costs through 2023) and the Congressional Budget Office’s projections of costs over the following five years. Under the second alternative, savings would total $284 billion through 2028.
Savings would be smaller if DoD needed more than three years to implement the reductions under this option or if the costs of current plans were overstated. Conversely, savings could be larger if costs to implement
Discretionary Spending—Option 1 Function 050
Reduce the Department of Defense’s Budget
Total
Billions of Dollars 2019 2020 2021 2022 2023 2024 2025 2026 2027 20282019–
20232019–
2028
Reduce DoD’s Budget by 10 Percent Relative to the Amount Planned for 2022
Change in Planned Defense Spending
Budget authority 0 -23 -46 -71 -65 -68 -73 -75 -84 -87 -204 -591
Outlays 0 -13 -32 -53 -58 -63 -68 -71 -77 -82 -156 -517
Reduce DoD’s Budget by 5 Percent Relative to the Amount Planned for 2022
Change in Planned Defense Spending
Budget authority 0 -11 -23 -35 -28 -31 -35 -35 -43 -44 -98 -284
Outlays 0 -6 -16 -26 -27 -28 -32 -33 -38 -41 -76 -248
This option would take effect in October 2019.
Estimates of savings displayed in the table are based on the 2019 Future Years Defense Program and the Congressional Budget Office’s extension of that plan.
DoD = Department of Defense.

124 OPTIONS FOR REDUCING THE DEFICIT: 2019 TO 2028 DECEMBER 2018
current plans were underestimated. For example, DoD has frequently underestimated its costs to develop and purchase weapon systems.
Other EffectsAccommodating the smaller amount of funding under this option would require DoD to decrease the size of its forces, slow the rate at which it modernizes weapon systems, or do both. Force cuts could be made pro-portionally across the services or could be tailored to the specific needs of parts of the military. Similarly, to achieve a desired pace of modernization, DoD would need to balance the goal of maintaining a particular force size against the goal of procuring new weapons. (CBO’s estimate of savings in outlays is based on proportional reductions to each part of DoD’s budget.)
With a somewhat smaller force, DoD’s ability to execute all the elements in the current national security strategy would be lessened. The current strategy envisions prevail-ing at both the low end of the spectrum of conflict (for example, counterinsurgency operations) and at the high end (conflicts with Russia or China). Simultaneously pursuing those goals is expensive. For example, at the same time that the Army has soldiers in more than 140 countries, all four military services are buying highly sophisticated military weaponry to fight against Russia or China, and DoD is modernizing all elements of its nuclear forces. Under this option, DoD would need to focus its efforts on the most important elements of national security, cut back in some other areas, and rely more on both conventional and nuclear deterrence to dissuade Russia and China from attacks on the United States, its interests, or its allies. For instance, DoD might need to scale back or eliminate the Army’s presence in some countries and replace that military effort with other
instruments of national power. Such a shift from military to nonmilitary engagement would not be inconsistent with the Summary of the 2018 National Defense Strategy of the United States of America, which calls for “the seamless integration of multiple elements of national power—diplomacy, information, economics, finance, intelligence, law enforcement, and military.” The reduced size of the military and concurrent shift to a more integrated approach would require greater patience in addressing crises around the world, however: Diplomacy rarely offers the dramatic action (or speed) of military intervention.
One argument against this option is that the size and number of military operations that could be conducted simultaneously and the duration for which they could be sustained would be diminished. Under Army policy, for example, three active brigade combat teams (BCTs) are required to support the rotation of a single BCT in and out of a combat zone. Consequently, the number of BCTs that the Army could continuously deploy would decrease by one for every three active BCTs that were cut from the force structure. Similar considerations would apply to the deployment of naval and air forces. If the need for a large, sustained military presence overseas arose, DoD could increase the size of its forces at that time (as it has done often in the past), but it could take a few years.
Despite the reduced military capacity under this option, the United States would remain the world’s preeminent military power. Even in 2022, when funding would be lowest under this option in both nominal and inflation-adjusted terms, it would be nearly double the combined military spending of China and Russia in 2017.
RELATED OPTIONS: Discretionary Spending, “Reduce DoD’s Operation and Maintenance Appropriation (Excluding Funding for the Defense Health Program)” (page 125), “Reduce the Size of the Federal Workforce Through Attrition” (page 190)
RELATED CBO PUBLICATIONS: Long-Term Implications of the 2019 Future Years Defense Program (forthcoming); The U.S. Military’s Force Structure: A Primer (July 2016), www.cbo.gov/publication/51535; Approaches for Scaling Back the Defense Department’s Budget Plans (March 2013), www.cbo.gov/publication/43997
125CHAPTER THREE: DISCRETIONARY SPENDING OPTIONS OPTIONS FOR REDUCING THE DEFICIT: 2019 TO 2028
BackgroundThe Department of Defense (DoD) uses funds from its operation and maintenance (O&M) account to pay the salaries and benefits of most of its civilian employees, to train its military personnel, and to purchase goods (such as paper clips and jet fuel) and services (including, for example, health care, equipment maintenance and repair, and information technology support). O&M accounted for nearly 40 percent of DoD’s request for base-budget funding in 2019, making it the largest single appropriation title in DoD’s budget. (That funding does not include the additional amount that DoD requested for overseas contingency operations.) In real terms (that is, after the amounts have been adjusted to remove the effects of inflation as measured by growth in the price index for gross domestic product), DoD’s base-budget costs for O&M grew by about 45 percent from 2000 to 2018, despite a 4 percent decrease in the size of the military. (A previous Congressional Budget Office study found that spending for departmental management functions, which are largely funded through the O&M account, grew at a faster pace than spending for other support functions.)
Under DoD’s plans, as laid out in its Future Years Defense Program (FYDP), O&M funding—measured in real dollars—would grow by 2 percent from 2019 through 2023, the last year in the most recent FYDP, (That amount does not include the additional increase from the planned transition of contingency funding into the base budget.) CBO projects O&M funding beyond 2023 by applying the employment cost index for growth in civilian pay and the historical average rate for O&M per service member for growth in other costs. (Military health care costs are projected separately and not included in this option.) Under that projection, O&M continues to grow faster than inflation through 2028.
Option This option has two alternatives. Both would reduce the growth in DoD’s O&M appropriation without affecting the portion of O&M funding slated for the Defense Health Program (DHP). CBO excluded funding for the DHP from this option because the causes of growth in that program are well-known and distinct from the factors that underlie growth in the rest of the O&M account; DHP funding is addressed by another option in this volume, which is listed below.
Discretionary Spending—Option 2 Function 050
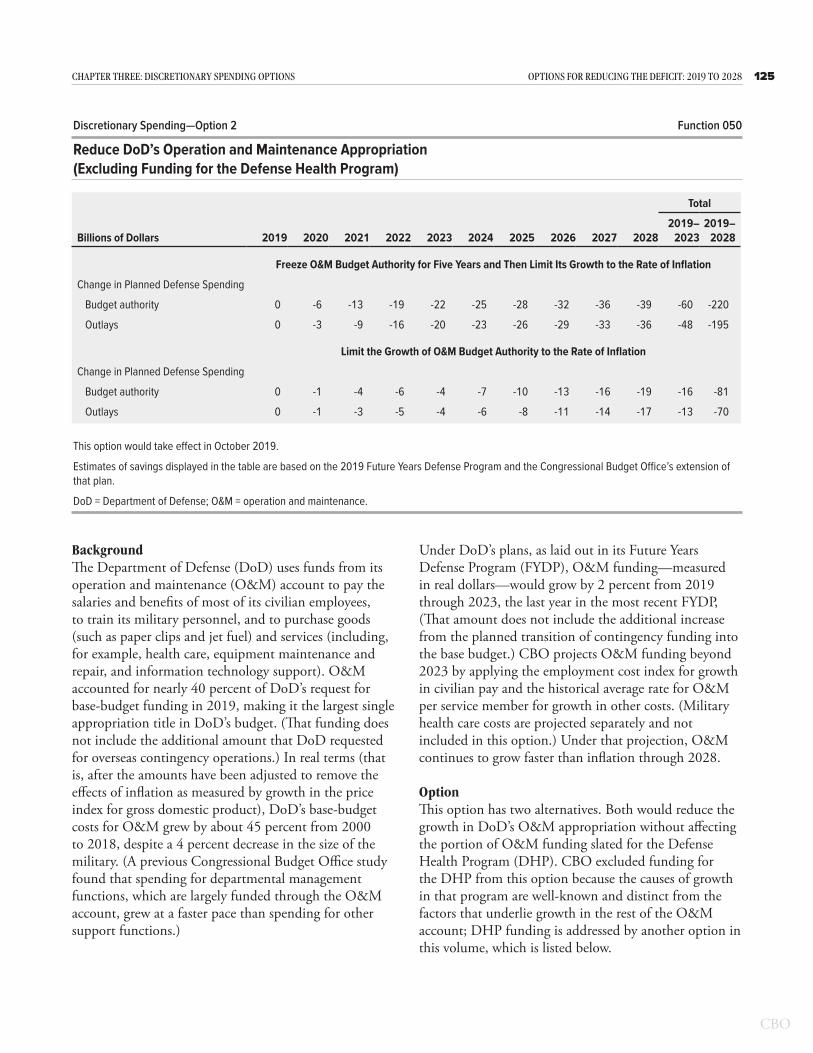
Reduce DoD’s Operation and Maintenance Appropriation (Excluding Funding for the Defense Health Program)
Total
Billions of Dollars 2019 2020 2021 2022 2023 2024 2025 2026 2027 20282019–
20232019–
2028
Freeze O&M Budget Authority for Five Years and Then Limit Its Growth to the Rate of Inflation
Change in Planned Defense Spending
Budget authority 0 -6 -13 -19 -22 -25 -28 -32 -36 -39 -60 -220
Outlays 0 -3 -9 -16 -20 -23 -26 -29 -33 -36 -48 -195
Limit the Growth of O&M Budget Authority to the Rate of Inflation
Change in Planned Defense Spending
Budget authority 0 -1 -4 -6 -4 -7 -10 -13 -16 -19 -16 -81
Outlays 0 -1 -3 -5 -4 -6 -8 -11 -14 -17 -13 -70
This option would take effect in October 2019.
Estimates of savings displayed in the table are based on the 2019 Future Years Defense Program and the Congressional Budget Office’s extension of that plan.
DoD = Department of Defense; O&M = operation and maintenance.

126 OPTIONS FOR REDUCING THE DEFICIT: 2019 TO 2028 DECEMBER 2018
Under the first alternative, DoD’s O&M appropriation in the base budget (excluding funding for the DHP) for 2020 through 2023 would equal the amount that the department requested in its budget for 2019. That por-tion of the budget would grow with inflation from 2024 through 2028. Under the second alternative, DoD’s O&M appropriation in the base budget (excluding funding for the DHP) would grow with inflation from the 2019 amount throughout the entire 10-year period.
Effects on the Budget The first alternative would reduce the discretionary bud-get authority provided for O&M by $220 billion over 10 years relative to the amount that would be needed under CBO’s estimates of the costs of DoD’s plans over the next decade. As a result, outlays would decrease by $195 billion over that period. The first alternative would lessen the amount appropriated for O&M (excluding funding for the DHP) in 2024 by 11 percent. The second alternative would reduce discretionary budget authority over 10 years by $81 billion and outlays by $70 billion. DoD’s total appropriations for O&M under the second alternative would be 3 percent less than they would be under the department’s current plan.
This option does not specify how the changes to DoD’s plans for O&M funding would be allocated among the four military services and the defensewide agencies or how they would be implemented within each service or agency. Rather than stipulating slower growth across the board, for example, the option would allow DoD to redistribute O&M funding in its future budget requests among the services and agencies as it sees fit and would permit the services and agencies to reallocate their fund-ing in a manner that minimized any loss of capability or readiness.
DoD could use many methods to achieve the lower O&M targets. Although those methods could be imple-mented individually, they might be more effective if they were applied as part of a DoD-wide effort to streamline functions and business processes. One approach would be to gradually but significantly reduce the number of civilian personnel and, thus, decrease amounts paid from the O&M account. If DoD used that approach alone to meet the funding targets under this option, by 2024 the department would employ roughly 240,000 (or 37 per-cent) fewer civilian personnel under the first alternative than it would under its current plan; under the second
alternative, DoD would employ 60,000 (or 9 percent) fewer civilians.
However, such changes would decrease costs only if the functions performed by the civilian personnel who were cut were not fulfilled by contractors (who would also be paid through the O&M account). The military services and DoD could continue to provide those functions if they found ways to operate more efficiently, or they could forgo the functions altogether. Using military per-sonnel to replace civilians, contractors, or contracted ser-vices would not be an effective solution: That approach would simply transfer costs from the O&M account to the military personnel account. Furthermore, CBO has found that in many cases, substituting military personnel for civilians would increase total costs, on net.
Another approach that could be used to achieve the lower O&M targets would be to reduce the use of con-tractors and contracted services. DoD relies on contrac-tors to perform a wide range of functions—from mow-ing lawns to maintaining complex weapon systems—that in the past were performed almost exclusively by military personnel and civilian employees. As with reducing the civilian workforce, cutting down on the use of contrac-tors could save billions of dollars each year, but only if DoD forgoes the functions that contractors fulfill or finds less costly ways of performing them.
One source of uncertainty about savings under this option is changes in the prices of the goods and ser-vices that the department purchases. If the price of fuel falls—as a result of decreases in the price of oil, for example—then the costs of DoD’s plans would be less than they were estimated to be in the 2019 FYDP and CBO’s extension of that plan. Thus, the savings under this option compared with those estimates would be correspondingly smaller. Increases in other costs, such as for civilian pay (which is determined by the Congress) and maintenance (perhaps from aging equipment) would have the opposite effect.
Other EffectsAn advantage of this option is that some parts of DoD would have incentives to become more efficient. DoD’s business functions, such as financial management and logistics, may be less efficient than analogous functions in the private sector. The operations of many of DoD’s support programs have been placed on the Government Accountability Office’s (GAO’s) High Risk List, which
127CHAPTER THREE: DISCRETIONARY SPENDING OPTIONS OPTIONS FOR REDUCING THE DEFICIT: 2019 TO 2028
identifies federal programs that GAO believes are at risk for waste, inefficiency, or ineffective spending. DoD’s business-reform initiatives suggest that spending on those support programs could be reduced without significantly decreasing the quality of services provided.
A disadvantage of this option is that it could negatively affect the capability of the military to fight and win wars if care is not taken to ensure that personnel remain as well trained and equipment stays as well maintained as under DoD’s current plan. If DoD was unable to afford that level of readiness under this option, it would have to reduce force structure to preserve readiness. Another disadvantage of the option is that it could discourage
DoD from making changes that would allow it to pro-vide essential functions more efficiently. For example, in 2012 DoD identified about 14,000 military positions in commercial activities that could be converted to positions filled by federal civilian employees or contrac-tors (see Discretionary Spending, Option 4, “Replace Some Military Personnel With Civilian Employees”). By reducing spending on military personnel, such conver-sions would probably reduce DoD’s overall costs, but they would nevertheless increase the department’s O&M spending. Policymakers and DoD would need to take precautions to prevent this option from forestalling such conversions.
RELATED OPTIONS: Discretionary Spending, “Reduce the Department of Defense’s Budget” (page 123), “Replace Some Military Personnel With Civilian Employees” (page 130), “Modify TRICARE Enrollment Fees and Cost Sharing for Working-Age Military Retirees” (page 145)
RELATED CBO PUBLICATIONS: Analysis of the Long-Term Costs of the Administration’s Goals for the Military (December 2017), www.cbo.gov/publication/53350; Trends in the Department of Defense’s Support Costs (October 2017), www.cbo.gov/publication/53168; Trends in Spending by the Department of Defense for Operation and Maintenance (January 2017), www.cbo.gov/publication/52156; Replacing Military Personnel in Support Positions With Civilian Employees (December 2015), www.cbo.gov/publication/51012; Growth in DoD’s Budget From 2000 to 2014 (November 2014), www.cbo.gov/publication/49764

128 OPTIONS FOR REDUCING THE DEFICIT: 2019 TO 2028 DECEMBER 2018
BackgroundBasic pay is the largest component of military service members’ cash compensation, accounting for about 60 percent of the total. (Allowances for housing and food, along with the tax advantage that arises because those allowances are not subject to federal taxes, make up most of the remainder of that compensation.) Between 2008 and 2017, inflation-adjusted spending per person on basic pay rose by 10 percent. To set annual increases in basic pay, lawmakers typically use the percentage increase in the employment cost index (ECI) for pri-vate-sector workers’ wages and salaries (for all occupa-tions and industries) as a benchmark. Under current law, the pay raise for service members is, by default, set to equal the percentage change in the ECI. (In contrast, the default pay raise for federal civilian employees is the rate of increase in the ECI minus 0.5 percentage points, and lawmakers authorize a separate annual adjustment to account for regional differences in the cost of liv-ing.) Lawmakers have often overridden the formula for service members by temporarily changing the law to specify a different pay raise for a single year through the annual defense authorization and appropriations acts while reverting to current law for future years. Although lawmakers enacted pay raises equal to or higher than the increase in the ECI for each year from 2000 to 2013 and for 2017 and 2018, they granted pay raises that were smaller than the increase in the ECI in 2014, 2015, and 2016.
OptionThis option would cap basic pay raises for military ser-vice members at 0.5 percentage points below the increase in the ECI for five years starting in 2020 and then return them to the ECI benchmark in 2025.
Effects on the BudgetThe Congressional Budget Office estimates that this option would reduce discretionary budget authority by nearly $18 billion from 2020 through 2028 compared with personnel costs if raises equaled the annual per-centage increase in the ECI. About 1.3 million active-duty service members would be affected by that change annually. Over the next 10 years, on average, they would receive an increase of about $1,400 in basic pay each year, which is roughly $200 less per year than the amount they would receive if basic pay rose with the ECI over the first five years.
A source of uncertainty in the estimated savings over the next decade is CBO’s expectation that the smaller pay raise would have little effect on recruiting and retention. CBO anticipates that the military services would not need to offer additional incentives to encourage people to join or stay in the military. Although the Department of Defense (DoD) has begun increasing the number of service members, those increases are small relative to the increases earlier in the 2000s and will be phased in over several years. DoD plans to boost the total number of military personnel by 51,500 (or 4 percent) by 2023.
A smaller reduction in basic pay than the amount speci-fied in this option would probably result in proportion-ally smaller savings. Conversely, larger reductions in basic pay could result in larger savings, but if the reductions were large enough, they could adversely affect recruit-ing and retention and prompt DoD to offer additional bonuses or other incentives to maintain the number of people serving in the military. The point at which the military would incur additional costs to recruit or retain
Discretionary Spending—Option 3 Function 050
Cap Increases in Basic Pay for Military Service Members
Total
Billions of Dollars 2019 2020 2021 2022 2023 2024 2025 2026 2027 20282019–
20232019–
2028
Change in Spending
Budget authority 0 -0.3 -0.8 -1.3 -1.8 -2.4 -2.6 -2.7 -2.8 -2.9 -4.2 -17.6
Outlays 0 -0.3 -0.8 -1.3 -1.8 -2.4 -2.6 -2.7 -2.8 -2.9 -4.2 -17.6
This option would take effect in January 2020.
About 25 percent of the savings displayed in the table reflect intragovernmental transfers and thus would not reduce the deficit.

129CHAPTER THREE: DISCRETIONARY SPENDING OPTIONS OPTIONS FOR REDUCING THE DEFICIT: 2019 TO 2028
personnel depends on many factors, including labor mar-ket conditions in the broader economy at the time.
Other EffectsOne argument for this option is that DoD has consis-tently exceeded its goal of ensuring that the average cash compensation for military personnel exceeds the wages and salaries received by 70 percent of civilians with comparable education and work experience. According to one recent study, the average cash compensation for enlisted personnel in 2016 exceeded the wages and salaries of 84 percent of their civilian counterparts; the corresponding value for officers was 77 percent. Furthermore, the annual increase in the ECI might not be the most appropriate benchmark for setting military pay raises over the long run. The comparison group for
the ECI includes a broad sample of civilian workers who are, on average, older than military personnel and more likely to have a postsecondary degree. Historically, pay raises for those workers have been larger than for younger or less educated workers, who more closely match the demographic profile of military personnel.
An argument against this option is that, over the next decade, military recruiting and retention could be compromised if basic pay raises did not keep pace with increases in the ECI. Capping raises also would constrain the amount service members receive in other benefits, such as the retirement annuities that are tied to a mem-ber’s 36 highest months of basic pay over the course of a military career.
RELATED OPTION: Discretionary Spending, “Reduce the Annual Across-the-Board Adjustment for Federal Civilian Employees’ Pay” (page 188)
RELATED CBO PUBLICATIONS: Long-Term Implications of the 2019 Future Years Defense Program (forthcoming); Analysis of the Long-Term Costs of the Administration’s Goals for the Military (December 2017), www.cbo.gov/publication/53350; Costs of Military Pay and Benefits in the Defense Budget (November 2012), www.cbo.gov/publication/43574; testimony of Carla Tighe Murray, Senior Analyst for Military Compensation and Health Care, before the Subcommittee on Personnel, Senate Committee on Armed Services, Evaluating Military Compensation (April 28, 2010), www.cbo.gov/publication/21430

130 OPTIONS FOR REDUCING THE DEFICIT: 2019 TO 2028 DECEMBER 2018
BackgroundThe workforce of the Department of Defense (DoD) consists of members of the active-duty and reserve mili-tary, federal civilian employees, and private contractors. According to data from DoD, thousands of members of the military work in support, or “commercial,” jobs that could be performed by civilian employees or contractors at a lower overall cost. Many of those jobs do not involve functions that could raise concerns about personal safety or national security and are performed in military units that do not deploy overseas for combat.
OptionUnder this option, DoD would replace over four years 80,000 of the roughly 340,000 active-duty military per-sonnel in commercial jobs with 64,000 civilian employ-ees. As a result, active-duty end strength (the number of military personnel on the rolls on the final day of the fiscal year) would decrease by 80,000.
Although DoD has replaced military personnel with civilian employees before (converting about 48,000 mil-itary positions to 32,000 civilian jobs between 2004 and 2010), only a small percentage of all military positions have been reviewed for that purpose. Moreover, the mix of military and civilian employees used to perform vari-ous commercial functions differs across the services. The Army fills 27 percent of its finance and accounting jobs with military personnel, for example, whereas the Marine Corps staffs 64 percent of those jobs with military per-sonnel. The Navy employs military personnel for 8 per-cent of its jobs in motor vehicle transportation services; the Air Force, 67 percent. If each service adopted the personnel mix with the lowest percentage of military per-sonnel in commercial occupations, up to 100,000 jobs
currently held by military personnel could be opened to civilians, the Congressional Budget Office estimates.
Effects on the BudgetBy CBO’s estimate, replacing 80,000 military personnel with 64,000 civilian employees would reduce discre-tionary outlays by about $14 billion between 2019 and 2028 if appropriations were reduced accordingly. Most of the savings would come from replacing military personnel with fewer civilians. (CBO estimates that the cost of each civilian employee in the occupations exam-ined in this option is only a few percentage points lower than the cost of a military service member, on average.) The long-term savings from this option would exceed the amounts shown here because some of the budgetary effects would not be fully realized for a few decades, when new employees began to retire and collect benefits. For example, most of the costs of deferred benefits, such as health care that DoD provides to military retirees under age 65 and that the Department of Veterans Affairs offers to veterans of all ages, occur beyond the 10-year budget period. In addition, the higher tax reve-nues that would flow to the federal government because a smaller proportion of civilian pay than military pay is exempt from federal taxation are not shown here.
The savings under this option would reach about $2 bil-lion a year, but not until around 2024, when the replace-ment of the military personnel with the smaller number of civilians was complete. Fewer civilians could perform the work done by the military personnel they replace because those civilians receive less on-the-job training, do not have to devote part of the work year to general military training, and typically do not rotate among positions as rapidly as military personnel do. Savings
Discretionary Spending—Option 4 Function 050
Replace Some Military Personnel With Civilian Employees
Total
Billions of Dollars 2019 2020 2021 2022 2023 2024 2025 2026 2027 20282019–
20232019–
2028
Change in Spending
Budget authority 0 -0.2 -0.7 -1.3 -1.8 -2.3 -2.4 -2.5 -2.7 -2.8 -4.0 -16.7
Outlays 0 -0.1 -0.5 -1.0 -1.5 -1.9 -2.1 -2.2 -2.4 -2.5 -3.1 -14.2
This option would take effect in October 2019.
About 40 percent of the savings displayed in the table reflect intragovernmental transfers and thus would not reduce the deficit.

131CHAPTER THREE: DISCRETIONARY SPENDING OPTIONS OPTIONS FOR REDUCING THE DEFICIT: 2019 TO 2028
would be proportionally smaller if fewer military person-nel were replaced with civilians, but at the same ratio of 1:1.25. If, instead, a given number of military person-nel were replaced with even fewer civilians, the savings would be larger, although using replacement ratios above 1:1.25 would boost the risk that capabilities would be lessened. (It would probably be increasingly difficult for fewer and fewer civilians to perform the same quantity of services—at the same quality—that a given number of military personnel could perform.)
The savings in this option are somewhat uncertain, for at least two reasons. First, the number of military posi-tions in support jobs could be smaller in the future. For instance, DoD could respond to changes in the national security environment or new missions by restructuring its military forces and converting military positions in support jobs to combat positions. Such actions would result in fewer military positions being available for transfer to civilians. Second, the average cost of civilian employees in comparison with the cost of military per-sonnel could change. Compensation for the occupations examined in this option, many of which are profes-sional, could grow at a slower rate than military pay in the future. In that event, the average pay of the added civilians relative to the average pay of the eliminated
military positions would fall, increasing the potential savings.
Other EffectsOne argument for converting military to civilian posi-tions is that civilians require, on average, less job-specific training over their careers. Unlike military personnel, civilian employees are not subject to frequent transfers, so the military services can employ, on average, fewer civil-ians to provide the same quantity and quality of services.
An argument against this option is that even though many service members might spend part of their career in jobs that could be performed by civilians, most are trained fighters who could be deployed if needed. Replacing such military personnel with civilians could reduce DoD’s ability to surge quickly if called upon to do so. Moreover, despite the potential cost savings, the military services try to avoid converting certain types of positions because doing so could lead to reductions in effectiveness or morale and hinder their workforce management objectives. For example, the Navy provides shore positions for sailors so that they do not spend their entire career at sea—even though some of those positions could be filled at a lower cost by civilians.
RELATED CBO PUBLICATION: Replacing Military Personnel in Support Positions With Civilian Employees (December 2015), www.cbo.gov/publication/51012

132 OPTIONS FOR REDUCING THE DEFICIT: 2019 TO 2028 DECEMBER 2018
BackgroundThe F-35 Joint Strike Fighter program is the military’s largest aircraft development program. As a stealthy aircraft, the F-35 is difficult for adversaries to detect by radar and other air defense sensors. The program is producing three versions of that aircraft: the conven-tional takeoff F-35A for the Air Force, the short takeoff and vertical landing (STOVL) F-35B for the Marine Corps, and the carrier-based F-35C for the Navy. The Department of Defense (DoD) has received appro-priations for 542 F-35s through 2019: 338 F-35As, 135 F-35Bs, and 69 F-35Cs. Current plans call for pur-chasing 1,914 more F-35s through 2044. According to DoD, the remaining costs to complete the program will amount to $253 billion (in nominal dollars). The Marine Corps’ and the Air Force’s versions of the F-35 entered operational service in 2015 and 2016, respectively. The Navy expects to declare its version operational in 2019.
OptionUnder this option, DoD would halt further production of the F-35 and instead purchase the most advanced versions of older, nonstealthy fighter aircraft that are still in production. Through 2028, the Air Force would purchase 510 F-16 Fighting Falcons, and the Navy and Marine Corps would purchase 394 F/A-18 Super Hornets. Those purchases would occur on the same schedule as that currently in place for the F-35s. The ser-vices would continue to operate the 429 F-35s that have already been purchased.
Effects on the BudgetBy the Congressional Budget Office’s estimates, this option would reduce budget authority by about
$16 billion from 2020 through 2028, provided that appropriations were reduced accordingly. The savings are based on procurement cost estimates DoD published in its December 2017 Selected Acquisition Report for the F-35 program and CBO’s estimate of current prices for F-16s and F/A-18s. In terms of outlays, savings would be about $13 billion from 2020 through 2028. The remain-ing $3 billion reduction in outlays corresponding to the reduction in budget authority through 2028 would occur in later years. Reductions in outlays lag reductions in budget authority because DoD pays for aircraft as expenses are incurred. For example, CBO projects that most of the outlays to procure new military aircraft would occur over four years to account for the time required to negotiate contracts, manufacture and deliver the aircraft, and process the final payments.
CBO did not include possible changes in operation and maintenance costs under this option because the cost to operate an established fleet of F-35s remains uncertain. On the one hand, F-35s are now expected to be more expensive to operate than new F-16s or F/A-18s on a per-aircraft basis. On the other hand, any decrease in operation costs that might accrue from reducing the types of fighters in service would be delayed under this option. For example, F-16s would remain in the Air Force’s inventory longer than currently planned, and the Marine Corps would need to operate new F/A-18s along with its F-35Bs. The savings under this option could be higher or lower depending on the relative magnitude of such factors.
Additional procurement savings would accrue from 2029 through 2044 if DoD purchased F-16s and F/A-18s
Discretionary Spending—Option 5 Function 050
Cancel Plans to Purchase Additional F-35 Joint Strike Fighters and Instead Purchase F-16s and F/A-18s
Total
Billions of Dollars 2019 2020 2021 2022 2023 2024 2025 2026 2027 20282019–
20232019–
2028
Change in Planned Defense Spending
Budget authority 0 -2.4 -2.3 -2.0 -2.2 -2.6 -1.0 -0.5 -1.1 -2.1 -8.9 -16.2
Outlays 0 -0.3 -0.8 -1.5 -1.8 -2.0 -2.1 -1.8 -1.3 -1.2 -4.4 -12.8
This option would take effect in October 2019.
Estimates of savings displayed in the table are based on the 2019 Future Years Defense Program and the Congressional Budget Office’s extension of that plan.

133CHAPTER THREE: DISCRETIONARY SPENDING OPTIONS OPTIONS FOR REDUCING THE DEFICIT: 2019 TO 2028
instead of the F-35s that are scheduled to be purchased in those later years. However, the Navy and Air Force are both considering the development of entirely new aircraft with fighter-like capabilities to be fielded in the 2030s, making it unlikely that F-16 and F/A-18 pur-chases would continue much beyond 2028. It is unclear how the costs to develop and purchase entirely new air-craft would compare with the costs of current plans for the F-35 or continued purchases of F-16s and F/A-18s under this option. It might also be possible to scale back this option by purchasing a mix of F-35s, F-16s, and F/A-18s over the next 10 years instead of replacing all F-35 purchases with F-16s and F/A-18s. That middle course of action would probably yield little or no savings, however; the unit costs of all three types of aircraft would be higher because each of their production rates would be lower.
Other EffectsAn advantage of this option is that it would reduce the cost of replacing DoD’s older fighter aircraft while still providing new F-16s and F/A-18s with improved capabilities—including modern radar, precision
weapons, and digital communications—that would be able to defeat most of the threats that the United States is likely to face in the coming years. The F-35s that have already been purchased would augment the stealthy B-2 bombers and F-22 fighters that are currently in the force, improving the services’ ability to operate against adversaries equipped with advanced air defense systems. The military has successfully operated a mix of stealthy and nonstealthy aircraft since the advent of the F-117 stealth fighter in the 1980s.
A disadvantage of this option is that a force composed of a mix of stealthy and nonstealthy aircraft would be less flexible against advanced enemy air defense systems. If the United States was unable to neutralize such defenses early in a conflict, then the use of F-16s and F/A-18s might be limited, effectively reducing the number of fighters that the United States would have at its disposal. Although the Marine Corps would end up with fewer STOVL fighters capable of operating from amphibious assault ships under this option, enough F-35Bs have already been purchased to fully replace the STOVL AV-8B Harriers that perform that function today.
RELATED OPTION: Discretionary Spending, “Reduce the Size of the Fighter Force by Retiring the F-22” (page 150)
RELATED CBO PUBLICATIONS: Long-Term Implications of the 2019 Future Years Defense Program (forthcoming); The Cost of Replacing Today’s Air Force Fleet (December 2018), www.cbo.gov/publication/54657; The Depot-Level Maintenance of DoD’s Combat Aircraft: Insights for the F-35 (February 2018), www.cbo.gov/publication/53543; Strategies for Maintaining the Navy’s and Marine Corps’ Inventories of Fighter Aircraft (May 2010), www.cbo.gov/publication/21251; Alternatives for Modernizing U.S. Fighter Forces (May 2009), www.cbo.gov/publication/41181
134 OPTIONS FOR REDUCING THE DEFICIT: 2019 TO 2028 DECEMBER 2018
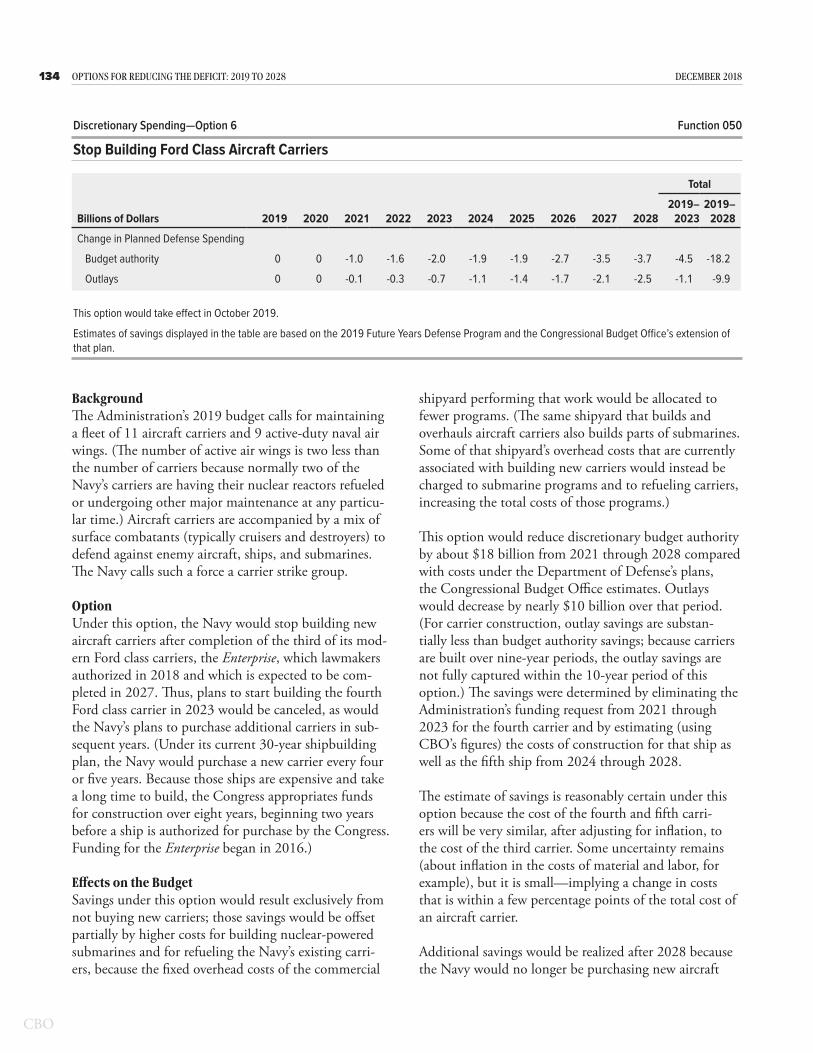
BackgroundThe Administration’s 2019 budget calls for maintaining a fleet of 11 aircraft carriers and 9 active-duty naval air wings. (The number of active air wings is two less than the number of carriers because normally two of the Navy’s carriers are having their nuclear reactors refueled or undergoing other major maintenance at any particu-lar time.) Aircraft carriers are accompanied by a mix of surface combatants (typically cruisers and destroyers) to defend against enemy aircraft, ships, and submarines. The Navy calls such a force a carrier strike group.
OptionUnder this option, the Navy would stop building new aircraft carriers after completion of the third of its mod-ern Ford class carriers, the Enterprise, which lawmakers authorized in 2018 and which is expected to be com-pleted in 2027. Thus, plans to start building the fourth Ford class carrier in 2023 would be canceled, as would the Navy’s plans to purchase additional carriers in sub-sequent years. (Under its current 30-year shipbuilding plan, the Navy would purchase a new carrier every four or five years. Because those ships are expensive and take a long time to build, the Congress appropriates funds for construction over eight years, beginning two years before a ship is authorized for purchase by the Congress. Funding for the Enterprise began in 2016.)
Effects on the BudgetSavings under this option would result exclusively from not buying new carriers; those savings would be offset partially by higher costs for building nuclear-powered submarines and for refueling the Navy’s existing carri-ers, because the fixed overhead costs of the commercial
shipyard performing that work would be allocated to fewer programs. (The same shipyard that builds and overhauls aircraft carriers also builds parts of submarines. Some of that shipyard’s overhead costs that are currently associated with building new carriers would instead be charged to submarine programs and to refueling carriers, increasing the total costs of those programs.)
This option would reduce discretionary budget authority by about $18 billion from 2021 through 2028 compared with costs under the Department of Defense’s plans, the Congressional Budget Office estimates. Outlays would decrease by nearly $10 billion over that period. (For carrier construction, outlay savings are substan-tially less than budget authority savings; because carriers are built over nine-year periods, the outlay savings are not fully captured within the 10-year period of this option.) The savings were determined by eliminating the Administration’s funding request from 2021 through 2023 for the fourth carrier and by estimating (using CBO’s figures) the costs of construction for that ship as well as the fifth ship from 2024 through 2028.
The estimate of savings is reasonably certain under this option because the cost of the fourth and fifth carri-ers will be very similar, after adjusting for inflation, to the cost of the third carrier. Some uncertainty remains (about inflation in the costs of material and labor, for example), but it is small—implying a change in costs that is within a few percentage points of the total cost of an aircraft carrier.
Additional savings would be realized after 2028 because the Navy would no longer be purchasing new aircraft
Discretionary Spending—Option 6 Function 050
Stop Building Ford Class Aircraft Carriers
Total
Billions of Dollars 2019 2020 2021 2022 2023 2024 2025 2026 2027 20282019–
20232019–
2028
Change in Planned Defense Spending
Budget authority 0 0 -1.0 -1.6 -2.0 -1.9 -1.9 -2.7 -3.5 -3.7 -4.5 -18.2
Outlays 0 0 -0.1 -0.3 -0.7 -1.1 -1.4 -1.7 -2.1 -2.5 -1.1 -9.9
This option would take effect in October 2019.
Estimates of savings displayed in the table are based on the 2019 Future Years Defense Program and the Congressional Budget Office’s extension of that plan.

135CHAPTER THREE: DISCRETIONARY SPENDING OPTIONS OPTIONS FOR REDUCING THE DEFICIT: 2019 TO 2028
carriers and because it would need to buy fewer aircraft to put on its carrier fleet, which would slowly shrink as old ships were retired from the fleet. The savings under this option would accrue only if the Navy did not buy other weapon systems to replace the capability and capacity that it lost by not purchasing additional carriers.
Other EffectsOne argument in favor of this option is that the existing fleet and the carriers under construction would main-tain the current size of the carrier force for a long time because the ships are designed to operate for 50 years. Three Ford class carriers, including the Enterprise, have been delivered or are under construction. They will replace the first three Nimitz class carriers when they are retired in the 2020s and early 2030s; so as late as 2036, the Navy would still field 11 carriers under this option. The size of the carrier force would decline thereafter, however, falling to 6 ships by 2048. If national secu-rity interests made additional carriers necessary in the future, the Navy could restart production. But doing so would be more expensive and complex than building new carriers is today, and it takes years to construct such large ships. Building new designs of small warships is a challenge; relearning how to build the largest warship ever produced would pose much greater challenges for the shipyard tasked with the job.
Another argument in favor of this option is that, as new technologies designed to threaten and destroy surface ships are developed and are acquired by more countries, the large aircraft carrier may cease to be an effective weapon system for defending the United States’ interests overseas. Among the technologies that might threaten the carrier in the future are long-range super-sonic antiship cruise missiles, antiship ballistic missiles, very quiet submarines, and satellite and other tracking systems. If the United States’ defensive capabilities failed to keep pace with advances in antiship technologies, the Navy’s large surface warships may face much greater risks
in the future. If over the next 20 years the technologies to detect, track, and attack the Navy’s aircraft carriers advanced to such an extent that it could not effectively defend against those new weapons, then any large invest-ment in new carriers that the Navy made today would ultimately not be cost-effective.
An argument against this option is that ceasing produc-tion of aircraft carriers could hamper the Navy’s fighting ability. Since World War II, the aircraft carrier has been the centerpiece of the U.S. Navy. According to the Navy, each of its 10 older Nimitz class carriers can sustain 95 strike sorties per day and, with each aircraft carrying four 2,000-pound bombs, deliver three-quarters of a million pounds of bombs each day. That firepower far exceeds what any other surface ship can deliver. The new Ford class aircraft carriers will be able to sustain even more sorties each day.
Another argument against this option is that carriers may prove adaptable to a future environment that includes more sophisticated threats to surface ships—perhaps through the development of new weapon systems on the carriers. Since World War II, carriers have transported many different types and generations of aircraft. The Navy is now developing long-range unmanned aircraft that would be capable of striking an enemy’s shores while allowing the carrier to operate outside the range of most air and missile threats. Equipping long-range unmanned aircraft with long-range, precision, stealthy munitions could extend the life of the aircraft carrier as an effective weapon system for decades to come. Furthermore, the Navy is developing new technologies that may make the defense of large surface ships economically and tactically effective. Energy-based weapons designed to shoot down incoming missiles could be more cost-effective than today’s ship defenses, which rely primarily on missiles. In short, if either of those technological developments occurred, then the large aircraft carrier could remain a potent weapon system into the distant future.
RELATED OPTION: Discretionary Spending, “Reduce Funding for Naval Ship Construction to Historical Levels” (page 136)
RELATED CBO PUBLICATIONS: Long-Term Implications of the 2019 Future Years Defense Program (forthcoming); An Analysis of the Navy’s Fiscal Year 2019 Shipbuilding Plan (October 2018), www.cbo.gov/publication/54564; How CBO Estimates the Costs of New Ships (April 2018), www.cbo.gov/publication/53785; Comparing a 355-Ship Fleet With Smaller Naval Forces (March 2018), www.cbo.gov/publication/53637; Costs of Building a 355-Ship Navy (April 2017), www.cbo.gov/publication/52632

136 OPTIONS FOR REDUCING THE DEFICIT: 2019 TO 2028 DECEMBER 2018
BackgroundThe Navy’s fiscal year 2019 shipbuilding plan proposes buying 301 new ships over the next 30 years at an aver-age cost of about $27 billion per year (in 2018 dollars), the Congressional Budget Office estimates. Including the costs of all activities funded by the Navy’s shipbuild-ing account, such as refueling nuclear-powered aircraft carriers and outfitting new ships, the average annual cost of implementing the plan is about $29 billion. That amount is 80 percent more than the average of $16 bil-lion per year (in 2018 dollars) that the Navy has spent on shipbuilding over the past 30 years.
OptionThis option would decrease budget authority for naval ship construction to the 30-year average in real (inflation-adjusted) terms.
Effects on the BudgetIf funding for ship construction was reduced to its 30-year average, discretionary budget authority would decline by about $75 billion through 2028 compared with amounts under the Department of Defense’s (DoD’s) plans. Outlays would fall by a total of about $50 billion over that period, CBO estimates. (For naval ship construction, outlay savings are usually substantially less than budget authority savings. Because most ships are built over many years, outlay savings are not fully captured within the 10-year period.)
The savings were determined by calculating the differ-ence between historical average funding and amounts in DoD’s 2019 Future Years Defense Program (FYDP) and
CBO’s extension of that plan. To determine the histori-cal average for shipbuilding, CBO adjusted the amount of appropriated dollars over the past 30 years using an index for naval shipbuilding provided by the Navy. Because CBO’s estimates are in nominal dollars, the future savings in nominal dollars are calculated against the historical average, which then grows at the rate of the shipbuilding index. For the extension of DoD’s FYDP, CBO’s method relies on historical experience, with adjustments for four factors: rate (the production efficiencies that are made possible when several ships of the same type are built simultaneously or in close succes-sion at a given shipyard), learning (the gains in efficiency that accrue over the duration of a ship’s production as shipyard workers gain familiarity with a particular ship model), acquisition strategy (such as whether ship contracts are granted directly to a company or awarded as the result of a competitive process), and economic factors.
Specifically, this option would reduce the number of ships that the Navy plans to purchase over the next 30 years from 301 to 177, decreasing the number to be purchased over the 2019–2028 period from 110 to 71. The cuts would affect several types of ships in the Navy’s fleet: surface combatants, attack submarines, amphibi-ous ships, and combat logistics and support ships. The number of aircraft carriers, would remain unchanged, however, to comply with a statutory requirement that the Navy maintain a force of at least 11 such ships. The number of ballistic missile submarines also would not be affected by the cuts, because Navy officials consider those ships their highest acquisition priority.
Discretionary Spending—Option 7 Function 050
Reduce Funding for Naval Ship Construction to Historical Levels
Total
Billions of Dollars 2019 2020 2021 2022 2023 2024 2025 2026 2027 20282019–
20232019–
2028
Change in Planned Defense Spending
Budget authority 0 -4.6 -7.6 -9.3 -8.5 -8.6 -8.8 -9.0 -9.2 -9.4 -29.8 -74.7
Outlays 0 -0.3 -1.6 -3.4 -5.2 -6.5 -7.5 -8.0 -8.4 -8.7 -10.5 -49.7
This option would take effect in October 2019.
Estimates of savings displayed in the table are based on the 2019 Future Years Defense Program and the Congressional Budget Office’s extension of that plan.

137CHAPTER THREE: DISCRETIONARY SPENDING OPTIONS OPTIONS FOR REDUCING THE DEFICIT: 2019 TO 2028
The savings in this option are somewhat uncertain because the final costs of some types of ships the Navy plans to buy over the next 10 years are uncertain. For example, the Navy plans to buy 16 new frigates by 2028, but the design, size, capabilities, and cost of those ships have not yet been determined. (Five companies with designs for ships that vary between 3,000 tons and 6,500 tons are competing for the program.) In the case of other ships, such as the new Columbia class ballistic missile submarine, CBO’s estimates of their costs are higher than the Navy’s, and even those higher estimates could be too low based on historical cost growth of new ship construction programs.
Savings under this option could be adjusted by buying more or fewer ships. A higher level of funding, albeit less than that under the Navy’s 2019 plan, could main-tain today’s fleet at or around its current 284 ships, for example. Conversely, a level of funding lower than the 30-year historical average, such as the level of funding in the 1990s, would result in an even smaller Navy by 2048 than the one envisioned under this option.
Other EffectsAn argument in favor of reducing funding for ship construction is that the Navy would still have a pow-erful fleet in 2028 and beyond. Because ships take a long time to build and then serve in the fleet for 25 to 50 years, even with the cuts the size of the fleet would grow by nearly the same amount through 2028 under this option as it would under the 2019 plan. Under the Navy’s 30-year plan, the fleet would grow to 313 ships by 2028 and to 335 ships by 2048. Under this option, the fleet would grow to 308 ships by 2028, at which point it would steadily decline to 228 ships by 2048. As the fleet grew to 308 ships over the next 10 years, it would require more sailors to crew the additional ships and more personnel, both military and civilian, to support those ships and sailors. More money also would be needed to operate and maintain those ships. As the fleet declined in size thereafter, fewer personnel would be required. Operating and support costs would continue to
rise, though, because of real growth in those costs above general inflation in the economy. As a result, even the smaller fleet in 2048 would cost more to operate and maintain than today’s fleet.
An argument against this option is that it would further decrease the size of the fleet over the next 30 years. The fleet has already shrunk over the past 30 years: Since 1987, the number of ships has fallen by more than 50 percent—from 568 to 285. With a smaller fleet, the Navy may not have the forces that it needs to imple-ment its war plans if a conflict was to erupt. The Navy’s shipbuilding plan is based on the 2016 force structure assessment, which concluded that the Navy needs a minimum of 355 ships in its fleet to deploy an adequate number overseas in the event of a major conflict. At any given time, some ships are undergoing long-term main-tenance or are in the early stages of training and thus are unavailable to be immediately deployed, so the Navy must maintain more ships in the fleet than it would need to fight. Some observers, pointing to the increas-ing assertiveness with which Russia and China conduct foreign relations, have noted that the world appears to be entering an era of renewed competition between major powers. Decreasing funding for shipbuilding and substantially reducing the size of the fleet would, over the long run, result in the Navy having fewer ships than it says it needs to protect the United States’ interests over-seas in the event of a conflict with another major power.
Another argument against this option is that it could lead the Navy to reduce its overseas presence. Today the Navy operates more than a third of its fleet—or about 100 ships—overseas. If the fleet was smaller, it is likely that fewer ships would be based overseas in peacetime. The Navy could, however, maintain the same level of presence with a smaller fleet by stationing more ships overseas, increasing the practice of rotating crews to forward-deployed ships to keep them on station longer, or extending the length of deployments. But those measures would cost money and, in the case of longer deployments, place greater stress on the crews that operate the ships.
RELATED OPTION: Discretionary Spending, “Stop Building Ford Class Aircraft Carriers” (page 134)
RELATED CBO PUBLICATIONS: Long-Term Implications of the 2019 Future Years Defense Program (forthcoming); An Analysis of the Navy’s Fiscal Year 2019 Shipbuilding Plan (October 2018), www.cbo.gov/publication/54564; How CBO Estimates the Costs of New Ships (April 2018), www.cbo.gov/publication/53785; Comparing a 355-Ship Fleet With Smaller Naval Forces (March 2018), www.cbo.gov/publication/53637; Costs of Building a 355-Ship Navy (April 2017), www.cbo.gov/publication/52632; Preserving the Navy’s Forward Presence With a Smaller Fleet (March 2015), www.cbo.gov/publication/49989

138 OPTIONS FOR REDUCING THE DEFICIT: 2019 TO 2028 DECEMBER 2018
BackgroundThe United States’ nuclear deterrence strategy, devel-oped during the Cold War, is built around the strategic nuclear triad, which comprises long-range bombers, intercontinental ballistic missiles (ICBMs), and subma-rines that launch ballistic missiles (SSBNs). Each com-ponent of the triad plays a particular role that comple-ments the other two. Bombers provide flexibility, and by changing the pace or location of their operations, the United States can signal intent to an adversary. ICBMs provide the most rapid response, and their dispersed underground silos present several hundred targets that an adversary would need to destroy to disable the United States’ nuclear forces. The ability of SSBNs to remain on alert while submerged and undetectable for long periods makes them the most difficult of the three components to destroy and ensures that the United States can retali-ate against a nuclear attack. That ability to retaliate and assure the destruction of an adversary who launched a nuclear attack helps provide stability during a crisis by deterring adversaries from using nuclear weapons.
The most recent arms control treaty between the United States and Russia, New START, limits strategic forces to 700 deployed delivery systems and 1,550 deployed warheads. (The treaty also limits forces to 800 total deployed and nondeployed delivery systems.) To comply
with those limits, which took effect in 2018, the United States maintains a nuclear force consisting of the fol-lowing components: 12 deployed (14 total) Ohio class SSBNs that together carry up to 1,090 warheads on 240 missiles; 400 deployed (454 total) Minuteman III ICBMs, each carrying a single warhead; and 60 deployed (66 total) B-52H and B-2A bombers, each of which counts as a single warhead under the treaty’s rules.
Almost all components of the United States’ nuclear forces are scheduled to be modernized (refurbished or replaced by new systems) over the next 20 years. Current plans call for developing and purchasing 12 new SSBNs, 642 new ICBMs (of which up to 450 would be fielded in existing silos after the silos were refurbished, and the remainder would be spares and test stock), and 80 to 100 B-21 bombers, the next-generation long-range strategic bombers now under development. Through the mid-2030s, modernization is expected to nearly double the amount spent annually on nuclear forces (currently about $30 billion).
OptionThis option would reduce the costs of modernization by retiring some existing delivery systems early and by pur-chasing fewer of the new systems. It would still allow the United States to retain the strategic benefits provided by
Discretionary Spending—Option 8 Function 050
Reduce the Size of the Nuclear Triad
Total
Billions of Dollars 2019 2020 2021 2022 2023 2024 2025 2026 2027 20282019–
20232019–
2028
Retain a Nuclear Triad With 10 Submarines, 300 ICBMs, and 1,550 Warheads
Change in Planned Defense Spending
Budget authority 0 0.1 -1.0 -0.3 -0.9 -1.7 -1.9 -1.2 -4.0 -0.4 -2.1 -11.2
Outlays 0 * * -0.3 -0.5 -0.8 -1.1 -1.3 -1.5 -2.0 -0.8 -7.5
Retain a Nuclear Triad With 8 Submarines, 150 ICBMs, and 1,000 Warheads
Change in Planned Defense Spending
Budget authority 0 -0.1 -1.1 -0.4 -0.9 -1.6 -2.0 -1.7 -4.5 -0.8 -2.5 -13.1
Outlays 0 * -0.1 -0.4 -0.5 -0.8 -1.2 -1.5 -1.9 -2.4 -1.0 -8.9
This option would take effect in October 2019.
Estimates of savings displayed in the table are based on the 2019 Future Years Defense Program and the Congressional Budget Office’s extension of that plan.
ICBM = intercontinental ballistic missile; * = between −$50 million and $50 million.
139CHAPTER THREE: DISCRETIONARY SPENDING OPTIONS OPTIONS FOR REDUCING THE DEFICIT: 2019 TO 2028
the complementary roles of the triad’s three components. The Congressional Budget Office examined two alter-native approaches to reducing the size of the triad: The first would keep U.S. forces at the New START limit of 1,550 warheads, and the second would make deeper cuts and reduce the number of deployed warheads to 1,000. Neither alternative would change the size or composi-tion of the planned bomber fleet because the number of bombers is determined largely by their conventional (that is, nonnuclear) mission.
The first alternative would reduce forces to 10 SSBNs and 300 ICBMs and would load more warheads on SSBNs or ICBMs. Under that alternative, the Navy would retire 4 Ohio class SSBNs at a rate of one per year starting in 2020; delay by one year the purchase of new SSBNs included in its current shipbuilding plan, starting with the second submarine, which is slated to be procured in 2024; and cancel orders for the last 2 SSBNs scheduled to be purchased under the current plan. In addition, the Department of Defense (DoD) would retire 150 ICBMs—50 each year for three years starting in 2020—and procure 482 new ICBMs instead of the 642 that are in the current plan.
The second alternative under this option would make deeper cuts to forces but still retain a triad structure. Under that alternative, the Navy would field 8 SSBNs, and the Air Force would deploy 150 ICBMs. That force level would be reached by retiring existing systems early, starting in 2020, and by purchasing fewer replacement systems.
Effects on the Budget Over the next decade, the first alternative would reduce discretionary budget authority by about $11 billion compared with amounts under DoD’s plan, CBO esti-mates. Outlays would decrease by a smaller amount—nearly $8 billion over that period—because the budget authority provided would not be spent right away since developing new systems requires extensive research and planning. The majority of savings from this alternative would occur after 2028, when DoD would purchase fewer new systems and operate fewer systems overall than it would under its current plan.
The second alternative would reduce discretionary bud-get authority through 2028 by about $13 billion com-pared with amounts under DoD’s plan. Outlays would decrease by about $9 billion. As with the first alternative,
the majority of savings would occur after 10 years, when DoD would purchase and operate fewer modernized systems.
Even though the second alternative would cut roughly twice as many systems as the first alternative, the savings under the second alternative would be considerably less than twice as much as under the first alternative. (For the new systems, 4 fewer submarines and 320 fewer ICBMs would be purchased in the second alternative, compared with 2 fewer submarines and 160 fewer ICBMs in the first alternative; for the existing generation of systems, 6 submarines and 300 ICBMs would be retired early in the second alternative, compared with 4 submarines and 150 ICBMs in the first alternative.) That nonlinear scal-ing results from two primary causes. In both alternatives, even though fewer new systems would eventually be pur-chased, CBO assumed those canceled purchases would come at the end of the production run, which would occur after 2028. Also, the early retirement of existing systems would occur gradually under this option. Thus, the retirements of the additional systems in the second alternative would occur later in the 10-year period, so DoD would have fewer years in which to accrue savings from forgoing operations.
CBO’s estimate of the costs of this option involves some uncertainty. Historically, programs that develop new systems have often experienced costs that exceed initial estimates. Development of the new submarines and ICBMs may cost more than estimated—particularly for the ICBM, which is in the very early design stages for its new missile. Another source of uncertainty concerns the savings that would accrue from the early retirement of existing systems. CBO’s estimate is based on a model in which half of the operating costs for a system are fixed, and half vary linearly with the number of systems deployed (for example, retiring 50 percent of the ICBMs would result in a savings of 25 percent in operating costs). However, actual savings from early retirements may not follow that model.
Other Effects An argument in favor of the first alternative is that it would reduce the cost of nuclear modernization without sacrificing the complementary roles of the triad or reduc-ing the size of nuclear forces significantly below those permitted under New START. In addition, scaling back plans now might lessen the chances of troubled programs

140 OPTIONS FOR REDUCING THE DEFICIT: 2019 TO 2028 DECEMBER 2018
being canceled later and thus might prevent development funding for such programs from being wasted.
An argument against the first alternative is that it would decrease the capabilities of nuclear forces. In particu-lar, with fewer submarines the Navy might not be able to meet its current goals for the number of SSBNs on patrol, even though the number of warheads deployed with the submarine fleet could remain the same as under the current plan. In addition, cutting the number of ICBMs that were deployed by one-third would present fewer targets to an adversary, thereby increasing the like-lihood that the adversary could disable that component of the United States’ nuclear triad.
The arguments for and against the first alternative also apply to the second alternative. Another argument in favor of the second alternative is that a force with 1,000 warheads would continue the trend started by earlier arms control treaties, which have made the United States’ current nuclear arsenal about 85 percent smaller than it was at its peak during the Cold War. Some analysts argue that further reduction would strengthen efforts at preventing nuclear proliferation by continuing the United States’ compliance with the Nuclear Non-Proliferation Treaty, in which countries with nuclear weapons agreed to work toward reducing and eventually eliminating such weapons and, in exchange, coun-tries without nuclear weapons agreed to not develop or acquire them. Moreover, proponents would argue, a smaller force would still be sufficient for deterrence: The official Nuclear Weapons Employment Strategy of the United States, released in 2013, states that the United
States could maintain a “strong and credible” strategic nuclear deterrent with about one-third fewer weapons deployed than the number allowed under New START.
An argument against the second alternative is that reducing U.S. nuclear forces in the current geopolitical environment could spark new arms races and might increase the chances that an adversary would launch a nuclear attack on the United States. For example, the most recent Nuclear Posture Review, released in 2018, concludes that the geopolitical environment has deteri-orated markedly since the last Nuclear Posture Review in 2010 and that the world has returned to a state of “Great Power” competition. In that international atmosphere, a new arms control agreement would have little chance of being reached, so a decision by the United States to reduce its stockpile to 1,000 warheads would be unilat-eral, which some analysts argue could reduce strategic stability. Internationally, allies that do not have their own nuclear weapons and thus rely on U.S. nuclear forces to deter attacks would probably oppose such cuts. If they determined that a reduction to 1,000 warheads signaled that the United States was less committed to protecting them than it has been in the past, they might choose to pursue their own nuclear weapons programs, which could provoke regional arms races. Furthermore, this alternative would diminish the capabilities of U.S. nuclear forces even more than the first alternative. The possibility of the Navy’s encountering difficulties in meeting its goals for the number of SSBN patrols under this alternative would therefore be greater than under the first alternative, and the smaller ICBM force would present even fewer targets to an adversary.
RELATED OPTIONS: Discretionary Spending, “Cancel the Long-Range Standoff Weapon” (page 141), “Cancel Development and Production of the New Missile in the Ground-Based Strategic Deterrent Program” (page 157)
RELATED CBO PUBLICATIONS: Approaches for Managing the Costs of U.S. Nuclear Forces, 2017 to 2046 (October 2017), www.cbo.gov/publication/53211; Projected Costs of U.S. Nuclear Forces, 2015 to 2024 (January 2015), www.cbo.gov/publication/49870
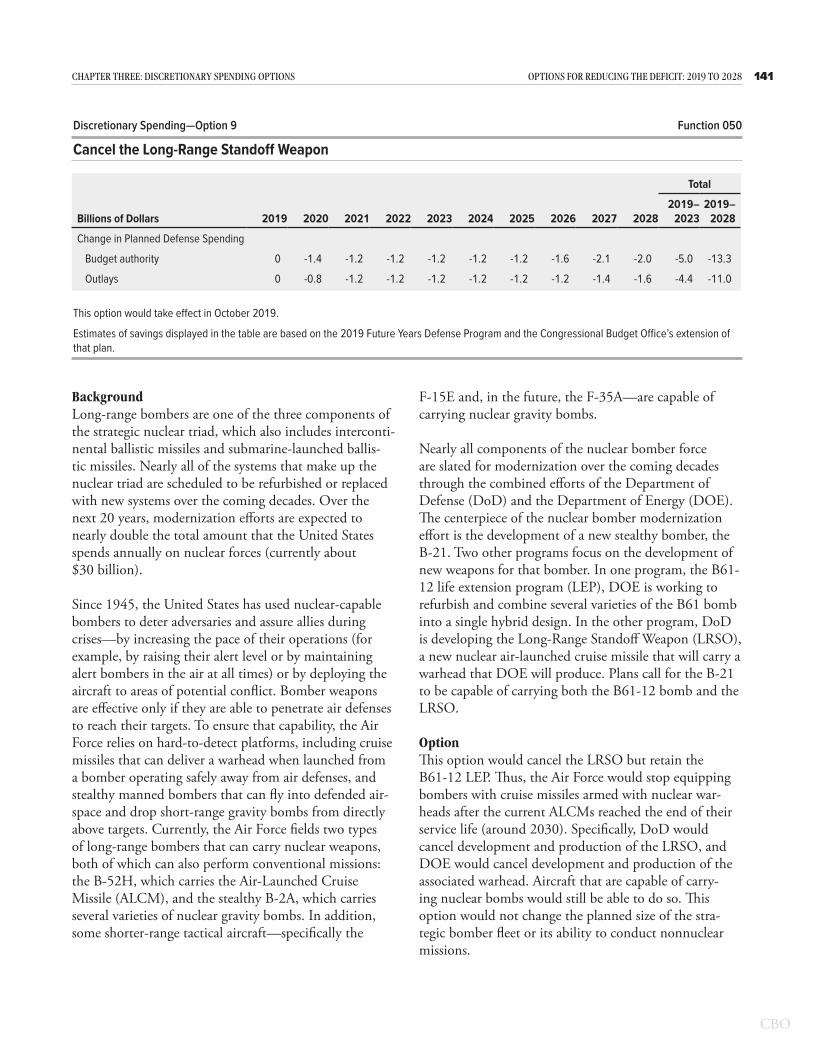
141CHAPTER THREE: DISCRETIONARY SPENDING OPTIONS OPTIONS FOR REDUCING THE DEFICIT: 2019 TO 2028
BackgroundLong-range bombers are one of the three components of the strategic nuclear triad, which also includes interconti-nental ballistic missiles and submarine-launched ballis-tic missiles. Nearly all of the systems that make up the nuclear triad are scheduled to be refurbished or replaced with new systems over the coming decades. Over the next 20 years, modernization efforts are expected to nearly double the total amount that the United States spends annually on nuclear forces (currently about $30 billion).
Since 1945, the United States has used nuclear-capable bombers to deter adversaries and assure allies during crises—by increasing the pace of their operations (for example, by raising their alert level or by maintaining alert bombers in the air at all times) or by deploying the aircraft to areas of potential conflict. Bomber weapons are effective only if they are able to penetrate air defenses to reach their targets. To ensure that capability, the Air Force relies on hard-to-detect platforms, including cruise missiles that can deliver a warhead when launched from a bomber operating safely away from air defenses, and stealthy manned bombers that can fly into defended air-space and drop short-range gravity bombs from directly above targets. Currently, the Air Force fields two types of long-range bombers that can carry nuclear weapons, both of which can also perform conventional missions: the B-52H, which carries the Air-Launched Cruise Missile (ALCM), and the stealthy B-2A, which carries several varieties of nuclear gravity bombs. In addition, some shorter-range tactical aircraft—specifically the
F-15E and, in the future, the F-35A—are capable of carrying nuclear gravity bombs.
Nearly all components of the nuclear bomber force are slated for modernization over the coming decades through the combined efforts of the Department of Defense (DoD) and the Department of Energy (DOE). The centerpiece of the nuclear bomber modernization effort is the development of a new stealthy bomber, the B-21. Two other programs focus on the development of new weapons for that bomber. In one program, the B61-12 life extension program (LEP), DOE is working to refurbish and combine several varieties of the B61 bomb into a single hybrid design. In the other program, DoD is developing the Long-Range Standoff Weapon (LRSO), a new nuclear air-launched cruise missile that will carry a warhead that DOE will produce. Plans call for the B-21 to be capable of carrying both the B61-12 bomb and the LRSO.
OptionThis option would cancel the LRSO but retain the B61-12 LEP. Thus, the Air Force would stop equipping bombers with cruise missiles armed with nuclear war-heads after the current ALCMs reached the end of their service life (around 2030). Specifically, DoD would cancel development and production of the LRSO, and DOE would cancel development and production of the associated warhead. Aircraft that are capable of carry-ing nuclear bombs would still be able to do so. This option would not change the planned size of the stra-tegic bomber fleet or its ability to conduct nonnuclear missions.
Discretionary Spending—Option 9 Function 050
Cancel the Long-Range Standoff Weapon
Total
Billions of Dollars 2019 2020 2021 2022 2023 2024 2025 2026 2027 20282019–
20232019–
2028
Change in Planned Defense Spending
Budget authority 0 -1.4 -1.2 -1.2 -1.2 -1.2 -1.2 -1.6 -2.1 -2.0 -5.0 -13.3
Outlays 0 -0.8 -1.2 -1.2 -1.2 -1.2 -1.2 -1.2 -1.4 -1.6 -4.4 -11.0
This option would take effect in October 2019.
Estimates of savings displayed in the table are based on the 2019 Future Years Defense Program and the Congressional Budget Office’s extension of that plan.
142 OPTIONS FOR REDUCING THE DEFICIT: 2019 TO 2028 DECEMBER 2018
Effects on the BudgetThis option would reduce discretionary budget author-ity by about $13 billion over the next decade, the Congressional Budget Office estimates, if appropriations were reduced accordingly. Outlays would decrease by $11 billion. Savings would continue to accrue after 2028 as both the cost of the additional LRSO missiles and warheads that would be purchased and the expense of operating the new systems would be eliminated.
CBO’s estimate of the costs of the LRSO is based on the actual development costs of the Advanced Cruise Missile, the most recent air-launched nuclear cruise missile built by the United States. Those costs were increased by 40 percent to account for cost growth between gener-ations of missiles. CBO’s cost estimates for both the LRSO and the associated warhead are very uncertain. Programs that develop new weapon systems historically have experienced cost growth relative to early estimates, and the LRSO and the warhead programs are both in the early planning stages.
CBO’s estimate of savings is based on the full cancel-lation of the LRSO and its warhead, forgoing both development and subsequent production. If DoD chose instead to continue those programs but to reduce the quantity purchased, savings would be substantially lower. The development efforts, which constitute roughly half of the costs within the 10-year period, would still continue. Reduced production is also likely to result in 10-year savings that are less than proportional to the reduction in the number of missiles purchased, for several reasons. The current generation ALCMs are well past their original service life, so any reductions in LRSO quantities are likely to be taken at the end of the pro-duction run. Most savings would thus occur after 2028. In addition, reducing the quantity purchased would
probably boost the average unit cost of both missiles and warheads.
Other EffectsBy equipping bombers with a single type of nuclear weapon, the United States could reduce costs while still retaining the ability to deploy nuclear weapons on bombers. That is one argument for this option. Another argument for canceling the LRSO program is that the need for nuclear cruise missiles has been lessened sig-nificantly by the development of modern conventional cruise missiles, which can perform many of the same missions. Modern cruise missiles, both conventional and nuclear, are substantially more accurate than the ALCM, according to unclassified estimates. Because damage from a missile warhead can depend more strongly on accu-racy than explosive yield, a modern conventional cruise missile could potentially perform some (but not all) of the missions that were assigned to the less-accurate, nuclear-tipped ALCM. In addition, to maintain the abil-ity to conduct missions requiring nuclear weapons, some analysts argue, the LRSO program could be postponed until adversaries’ air defenses advanced to the point at which the B-21 could no longer penetrate them.
An argument against canceling development of new air-launched cruise missiles is that doing so would somewhat diminish the capabilities of U.S. nuclear forces, partic-ularly the forces’ capacity to carry out limited nuclear strikes. Cruise missiles offer operational planners flexi-bility because they can travel for extended distances (the unclassified range for the current ALCM is more than 1,500 miles) along complicated flight paths, potentially allowing bombers to avoid dangerous or sensitive areas. Thus, removing air-launched cruise missiles would be more detrimental to the Air Force’s strategic nuclear capabilities than eliminating nuclear bombs, which must be dropped close to a target.
RELATED OPTION: Discretionary Spending, “Reduce the Size of the Nuclear Triad” (page 138)
RELATED CBO PUBLICATIONS: Approaches for Managing the Costs of U.S. Nuclear Forces, 2017 to 2046 (October 2017), www.cbo.gov/publication/53211; Projected Costs of U.S. Nuclear Forces, 2015 to 2024 (January 2015), www.cbo.gov/publication/49870

143CHAPTER THREE: DISCRETIONARY SPENDING OPTIONS OPTIONS FOR REDUCING THE DEFICIT: 2019 TO 2028
BackgroundThe Air Force operates a fleet of 157 long-range bomb-ers: 76 B-52Hs, 61 B-1Bs, and 20 B-2A stealth bombers that entered service in the 1960s, 1980s, and 1990s, respectively. Although those aircraft should be able to continue flying through at least 2040, the Air Force is developing a new bomber—designated the B-21—which it plans to field in the mid- to late 2020s. The goal of that program is to produce at least 100 aircraft that could augment and eventually replace the B-1B and B-2A bombers. (The Air Force is developing plans for new engines and subsystems to extend the service life of the B-52H.) The Air Force has estimated that developing and procuring the first 100 aircraft will cost $80 billion (in 2016 dollars). The Congressional Budget Office has not assessed the validity of that estimate because many details about the program—including the B-21’s speed, payload, and stealthy characteristics, as well as its pro-duction schedule—are classified.
OptionThis option would defer development of the B-21 bomber until after 2028.
Effects on the BudgetIf implemented, this option would reduce budget authority by about $45 billion (in nominal dollars) through 2028, provided that appropriations were reduced accordingly. Those savings include $12 billion in research and development funding that the Air Force has budgeted for 2020 through 2023 (in its 2019 bud-get request), plus $33 billion through 2028 to complete development and begin procurement. To calculate those savings, CBO spread the Air Force’s estimate of total
costs for the program over a notional development and procurement schedule that would support initial fielding of B-21s by the mid- to late 2020s. Savings would differ if the Air Force’s cost estimates proved to be inaccurate or if the fielding schedule changed, as often happens with programs that are developing new aircraft.
In terms of outlays, savings would be about $32 billion from 2020 through 2028. The remaining $13 billion reduction in outlays corresponding to the reduction in budget authority through 2028 would occur in later years. Reductions in outlays lag reductions in budget authority because the Department of Defense (DoD) pays for aircraft as expenses are incurred. For example, CBO projects that most of the outlays to procure new military aircraft would occur over four years to account for the time required to negotiate contracts, manufacture and deliver the aircraft, and process the final payments.
Shortening or lengthening the time over which the B-21 program was deferred would alter the projected savings. Additional savings might accrue after 2028 if DoD decided that it could accommodate a longer delay. Alternatively, a shorter deferment in developing and fielding the B-21 would yield lower savings.
Other EffectsAn advantage of this option is that it would reduce acquisition costs at a time when the Air Force plans to modernize other parts of its fleet. Funding would not have to be provided for bomber production while the Air Force carried out its plan to purchase KC-46A tankers and F-35A fighters and to develop other aircraft, including helicopters, an aircraft for training new pilots,
Discretionary Spending—Option 10 Function 050
Defer Development of the B-21 Bomber
Total
Billions of Dollars 2019 2020 2021 2022 2023 2024 2025 2026 2027 20282019–
20232019–
2028
Change in Planned Defense Spending
Budget authority 0 -3.0 -3.1 -3.3 -4.1 -5.7 -7.7 -6.7 -5.9 -5.5 -13.5 -44.9
Outlays 0 -1.5 -2.6 -2.7 -2.8 -3.4 -3.8 -4.5 -5.2 -5.4 -9.6 -31.8
This option would take effect in October 2019.
Estimates of savings displayed in the table are based on the 2019 Future Years Defense Program and the Congressional Budget Office’s extension of that plan.
144 OPTIONS FOR REDUCING THE DEFICIT: 2019 TO 2028 DECEMBER 2018
and a replacement for Air Force One. Another advantage of this option is that a bomber program that begins later might be able to take advantage of any general advances in aerospace technology that are made in the coming years. Such advances might make possible an even more capable bomber or might lead to other types of weapons that would make a new bomber unnecessary or reduce the number of bombers needed. Taking advantage of future technological developments could be particularly valuable for weapon systems that are expected to be in use for several decades. Even with a 10-year delay, a new bomber would still be available before today’s bombers reached the end of their service life.
A disadvantage of this option is that if some current bombers need to be retired sooner than expected, a replacement would not be available. By 2035, the Air Force’s B-52s will be about 75 years old, its B-1Bs will
be about 50 years old, and its B-2As about 40 years old. Expecting those aircraft to perform reliably after that much time may prove to be overly optimistic. Similarly, a gap in capability could arise if the new bomber was deferred and ended up taking significantly more time to field than expected (as has been the case for the F-35 fighter program). Another disadvantage is that the Air Force’s inventory of stealthy bombers that are able to fly in defended airspace would remain limited to the B-2A, which makes up only 13 percent of today’s bomber force. Larger numbers of stealthy bombers might be useful in operations against adversaries that employed advanced air defenses. A third disadvantage is that fewer bombers would be available for operations in places like the western Pacific Ocean, where long distances and lim-ited basing options would make long-range aircraft such as the B-21 particularly useful during a conflict.
RELATED OPTIONS: Discretionary Spending, “Cancel Plans to Purchase Additional F-35 Joint Strike Fighters and Instead Purchase F-16s and F/A-18s” (page 132), “Reduce the Size of the Bomber Force by Retiring the B-1B” (page 148)
RELATED CBO PUBLICATIONS: Long-Term Implications of the 2019 Future Years Defense Program (forthcoming); Approaches for Managing the Costs of U.S. Nuclear Forces, 2017 to 2046 (October 2017), www.cbo.gov/publication/53211

145CHAPTER THREE: DISCRETIONARY SPENDING OPTIONS OPTIONS FOR REDUCING THE DEFICIT: 2019 TO 2028
BackgroundMore than 9 million people are eligible to receive health care through TRICARE, a program run by the Department of Defense’s (DoD’s) Military Health System. Among its beneficiaries are 1.5 million mem-bers of the active military and the other uniformed services (such as the Coast Guard), certain reservists, retired military personnel, and their qualified family members. The costs of that health care have been among the fastest-growing portions of the defense budget over the past 17 years, more than doubling in real (inflation-adjusted) terms since 2001. In 2017, DoD spent about $50 billion for health care. Much of the cost increases are attributable to new and expanded health care benefits and to financial incentives to use those benefits.
In 2017, about 20 percent of military health care spend-ing was for working-age retirees (generally, beneficiaries who, although retired from military service, are under age 65 and thus not yet eligible for Medicare) and their family members—3.1 million beneficiaries in all. Some 1.6 million people (or about 50 percent of that group) were enrolled in TRICARE Prime, which operates like a health maintenance organization. Subscribers in
2018 pay an annual enrollment fee of $289 (for individ-ual coverage) or $578 (for family coverage). Working-age retirees who do not enroll in TRICARE Prime may participate in TRICARE Select (a preferred provider net-work). Under the Select plan, a beneficiary who chooses an in-network provider for a given medical service pays lower out-of-pocket costs than one who chooses an out-of-network provider.
The National Defense Authorization Act for Fiscal Year 2017 (Public Law 114-328) made several changes to the TRICARE program, including creating the Select plan by merging two other plans and increasing cost sharing for the households of military retirees. However, those higher out-of-pocket costs will apply only to those retirees whose initial enlistment or appointment to the armed forces occurred on or after January 1, 2018. With few exceptions, the higher cost-sharing amounts will not take effect until 2038 or later, when that cohort begins to retire.
OptionUnder this option, TRICARE’s enrollment fees, deductibles, and copayments for working-age military retirees would increase as described below starting in
Discretionary Spending—Option 11 Function 050
Modify TRICARE Enrollment Fees and Cost Sharing for Working-Age Military Retirees
Total
Billions of Dollars 2019 2020 2021 2022 2023 2024 2025 2026 2027 20282019–
20232019–
2028
Change in Discretionary Spending
Budget authority 0 0.1 -0.9 -1.2 -1.3 -1.4 -1.6 -1.7 -1.8 -2.0 -3.4 -11.8
Outlays 0 * -0.7 -1.1 -1.3 -1.4 -1.5 -1.7 -1.8 -1.9 -3.1 -11.4
Change in Mandatory Outlays 0 0 * * * * * * * * * -0.1
Change in Revenues a 0 0 -0.1 -0.2 -0.2 -0.2 -0.3 -0.3 -0.3 -0.3 -0.5 -1.9
Increase in the Deficit From Changes in Mandatory Outlays and Revenues b 0 0 0.1 0.2 0.2 0.2 0.2 0.3 0.3 0.3 0.5 1.8
Sources: Congressional Budget Office; staff of the Joint Committee on Taxation.
This option would take effect in January 2021, although some changes to outlays would occur earlier.
* = between -$50 million and $50 million.
a. Estimates include the effects on Social Security payroll tax receipts, which are classified as off-budget.
b. Changes in discretionary spending are not included in this total because they would be realized only if future appropriations were adjusted accordingly and because the Congress uses different procedures to enforce its budgetary goals related to discretionary spending.

146 OPTIONS FOR REDUCING THE DEFICIT: 2019 TO 2028 DECEMBER 2018
January 2021. Thereafter, such costs would be indexed to nationwide growth in health care spending per person. Specifically:
• Beneficiaries with individual coverage would pay $650 annually to enroll in TRICARE Prime. The annual cost of family enrollment would be $1,300. (That family enrollment fee is about equivalent to what would result if the $460 annual fee first instituted in 1995 had grown each year by the nationwide growth in health care spending per person.)
• All beneficiaries who enroll in TRICARE Select would pay an annual enrollment fee of $485 for individual coverage and $970 for a family, which is the Congressional Budget Office’s estimate of what the enrollment fees will be under current law for those retirees who joined the armed forces after January 1, 2018.
• The annual deductible for individual retirees (or surviving spouses) for TRICARE Select would rise to $300, and the annual family deductible would be $600.
• The schedule of copayments for medical treatments under TRICARE Prime and Select in 2021 would be the same for all retirees (regardless of when they joined the armed forces). In subsequent years, copayments would grow in line with nationwide growth in health care spending per person.
Those higher out-of-pocket costs would apply to most new and current retirees beginning in 2021. The only exception would be for those who retired because of dis-ability and certain survivors (whose cost sharing would remain unchanged). DoD would incur some added costs for implementation expenses.
Effects on the Budget CBO estimates that, combined, those changes would reduce discretionary outlays for DoD by $12.6 billion between 2020 and 2028, under the assumption that appropriations would be reduced accordingly. The increased out-of-pocket expenses for beneficiaries would reduce DoD’s discretionary costs for the TRICARE pro-gram, as enrollees used fewer services and as Prime mem-bers switched to civilian care provided by their current employers or some other source of health care. Under
this option, CBO estimates, about 120,000 retirees and their family members would leave TRICARE because of the higher out-of-pocket costs they would face.
Discretionary spending outside of DoD would increase slightly under the option. Some eligible retirees would obtain health care from other discretionary federal pro-grams—such as the Veterans Health Administration or the Federal Employees Health Benefits (FEHB) program, if the person or his or her spouse was employed as a civil-ian by the federal government—increasing the costs of those programs. About $1.2 billion in additional spend-ing would be needed for those programs by 2028, CBO projects, so the overall reduction in discretionary costs would be $11.4 billion between 2020 and 2028.
This option would have partially offsetting effects on mandatory spending. On the one hand, mandatory spending would increase when some retirees enrolled in other federal health care programs, such as Medicaid (for low-income retirees) or the FEHB program (for those who complete a career in the federal civil service after military retirement). On the other hand, man-datory spending would decrease as a result of the new cost sharing for retirees of the Coast Guard, the uni-formed corps of the National Oceanic and Atmospheric Administration, and the Public Health Service. (TRICARE’s costs for retirees from those three uni-formed services are paid from mandatory appropriations; DoD’s costs are paid from annual discretionary appro-priations.) Overall, in CBO’s estimation, mandatory spending under this option would decline by $100 mil-lion between 2021 and 2028 because spending for people in those three uniformed services would fall by a larger amount than spending for Medicaid and FEHB annuitants would rise.
CBO and the staff of the Joint Committee on Taxation estimate that, under this option, federal tax revenues would decline by $1.9 billion between 2021 and 2028 because some retirees would enroll in employment-based plans in the private sector and therefore experience a shift in compensation from taxable wages to nontaxable fringe benefits.
In general, relative to this option, increasing the share of health care costs paid by beneficiaries would further reduce federal spending, but the results would not be proportional; consequently, doubling fees or copayments would not necessarily double the savings. One reason

147CHAPTER THREE: DISCRETIONARY SPENDING OPTIONS OPTIONS FOR REDUCING THE DEFICIT: 2019 TO 2028
for that relationship is that changes in some fees (such as the Prime enrollment fee) would alter beneficiaries’ behavior differently than changes in other fees (such as the copayment for primary care). In addition, the num-ber of households that used TRICARE under different cost-sharing scenarios would not change proportionally: Relatively healthy people, who do not spend the entire deductible under the current system, for example, would be unaffected by having that deductible increase.
The largest source of uncertainty in the estimate of sav-ings over the next 10 years relates to CBO’s estimate of the number of people who would shift from TRICARE to other health care plans. Many military members retire while they are still young enough to start second careers. Studies show that over 75 percent of those working-age retirees have access to other health insurance through either an employer or a professional association (for example, Mariano and others 2007). Therefore, any significant increase in out-of-pocket costs for the military health benefit would cause some people to stop using those benefits and instead rely on other health care cover-age. Nevertheless, the behavior of military retirees might differ from that of the studied populations, and changes in the cost and availability of civilian health insurance would affect the estimated amount of savings.
Other EffectsOne argument in favor of this option is that the federal government established TRICARE coverage to supple-ment other health care for military retirees and their dependents. That was done to serve as a safety net rather than as a replacement for benefits offered by postservice civilian employers. Yet the cost sharing under the option would still be comparatively low. The Prime enrollment fee under this option, for example, would be about one-fifth that of the average premium paid by employees for employment-based health insurance in 2017. The migra-tion of retirees from civilian coverage into TRICARE is one factor in the rapid increase in TRICARE spending since 2000.
An argument against this option is that current retirees joined and remained in the military with the under-standing that they would receive free or very low-cost medical care in retirement. Imposing new cost sharing might cause some to drop their TRICARE coverage and become uninsured; it also could adversely affect mili-tary retention. Another potential disadvantage is that the health of users who remained in TRICARE might suffer if higher copayments led them to forgo some care. However, their health might not be affected significantly if the higher copayments fostered more disciplined use of medical resources and discouraged the use of health care that did little to improve health.
RELATED OPTIONS: Mandatory Spending, “Introduce Enrollment Fees Under TRICARE for Life” (page 57), “Introduce Minimum Out-of-Pocket Requirements Under TRICARE for Life” (page 59)
RELATED CBO PUBLICATIONS: Approaches to Changing Military Health Care (October 2017), www.cbo.gov/publication/53137; Approaches to Reducing Federal Spending on Military Health Care (January 2014), www.cbo.gov/publication/44993
WORK CITED: Louis T. Mariano and others, Civilian Health Insurance Options of Military Retirees: Findings From a Pilot Survey (RAND Corporation, 2007), www.rand.org/pubs/monographs/MG583.html
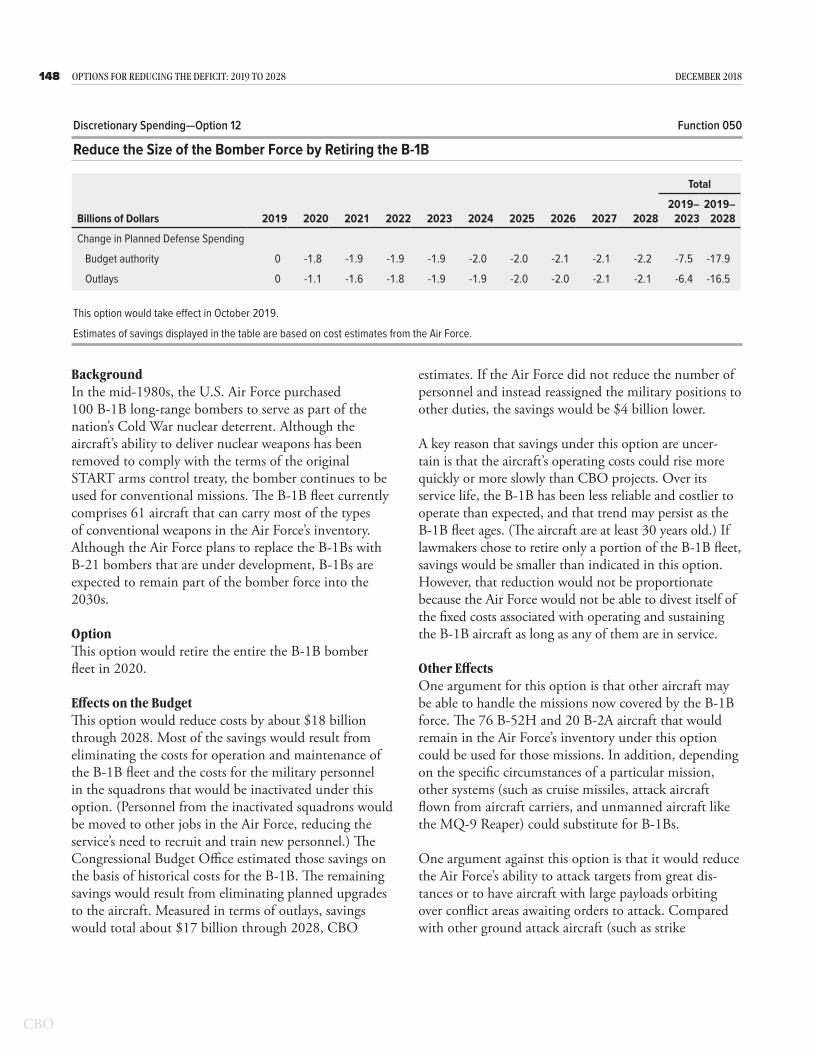
148 OPTIONS FOR REDUCING THE DEFICIT: 2019 TO 2028 DECEMBER 2018
BackgroundIn the mid-1980s, the U.S. Air Force purchased 100 B-1B long-range bombers to serve as part of the nation’s Cold War nuclear deterrent. Although the aircraft’s ability to deliver nuclear weapons has been removed to comply with the terms of the original START arms control treaty, the bomber continues to be used for conventional missions. The B-1B fleet currently comprises 61 aircraft that can carry most of the types of conventional weapons in the Air Force’s inventory. Although the Air Force plans to replace the B-1Bs with B-21 bombers that are under development, B-1Bs are expected to remain part of the bomber force into the 2030s.
OptionThis option would retire the entire the B-1B bomber fleet in 2020.
Effects on the BudgetThis option would reduce costs by about $18 billion through 2028. Most of the savings would result from eliminating the costs for operation and maintenance of the B-1B fleet and the costs for the military personnel in the squadrons that would be inactivated under this option. (Personnel from the inactivated squadrons would be moved to other jobs in the Air Force, reducing the service’s need to recruit and train new personnel.) The Congressional Budget Office estimated those savings on the basis of historical costs for the B-1B. The remaining savings would result from eliminating planned upgrades to the aircraft. Measured in terms of outlays, savings would total about $17 billion through 2028, CBO
estimates. If the Air Force did not reduce the number of personnel and instead reassigned the military positions to other duties, the savings would be $4 billion lower.
A key reason that savings under this option are uncer-tain is that the aircraft’s operating costs could rise more quickly or more slowly than CBO projects. Over its service life, the B-1B has been less reliable and costlier to operate than expected, and that trend may persist as the B-1B fleet ages. (The aircraft are at least 30 years old.) If lawmakers chose to retire only a portion of the B-1B fleet, savings would be smaller than indicated in this option. However, that reduction would not be proportionate because the Air Force would not be able to divest itself of the fixed costs associated with operating and sustaining the B-1B aircraft as long as any of them are in service.
Other EffectsOne argument for this option is that other aircraft may be able to handle the missions now covered by the B-1B force. The 76 B-52H and 20 B-2A aircraft that would remain in the Air Force’s inventory under this option could be used for those missions. In addition, depending on the specific circumstances of a particular mission, other systems (such as cruise missiles, attack aircraft flown from aircraft carriers, and unmanned aircraft like the MQ-9 Reaper) could substitute for B-1Bs.
One argument against this option is that it would reduce the Air Force’s ability to attack targets from great dis-tances or to have aircraft with large payloads orbiting over conflict areas awaiting orders to attack. Compared with other ground attack aircraft (such as strike
Discretionary Spending—Option 12 Function 050
Reduce the Size of the Bomber Force by Retiring the B-1B
Total
Billions of Dollars 2019 2020 2021 2022 2023 2024 2025 2026 2027 20282019–
20232019–
2028
Change in Planned Defense Spending
Budget authority 0 -1.8 -1.9 -1.9 -1.9 -2.0 -2.0 -2.1 -2.1 -2.2 -7.5 -17.9
Outlays 0 -1.1 -1.6 -1.8 -1.9 -1.9 -2.0 -2.0 -2.1 -2.1 -6.4 -16.5
This option would take effect in October 2019.
Estimates of savings displayed in the table are based on cost estimates from the Air Force.

149CHAPTER THREE: DISCRETIONARY SPENDING OPTIONS OPTIONS FOR REDUCING THE DEFICIT: 2019 TO 2028
fighters), bombers like the B-1B can carry substantially more weapons and can fly longer and farther without refueling. Retiring the B-1B fleet would reduce the size of the long-range bomber force by about 40 percent until the latter half of the 2020s (when B-21 bombers
are expected to begin entering the force). At that time, the Air Force could decide that the smaller bomber force is adequate, or it could begin increasing the size of the bomber force with new B-21s.
RELATED OPTION: Discretionary Spending, “Defer Development of the B-21 Bomber” (page 143)
RELATED CBO PUBLICATION: Long-Term Implications of the 2019 Future Years Defense Program (forthcoming)
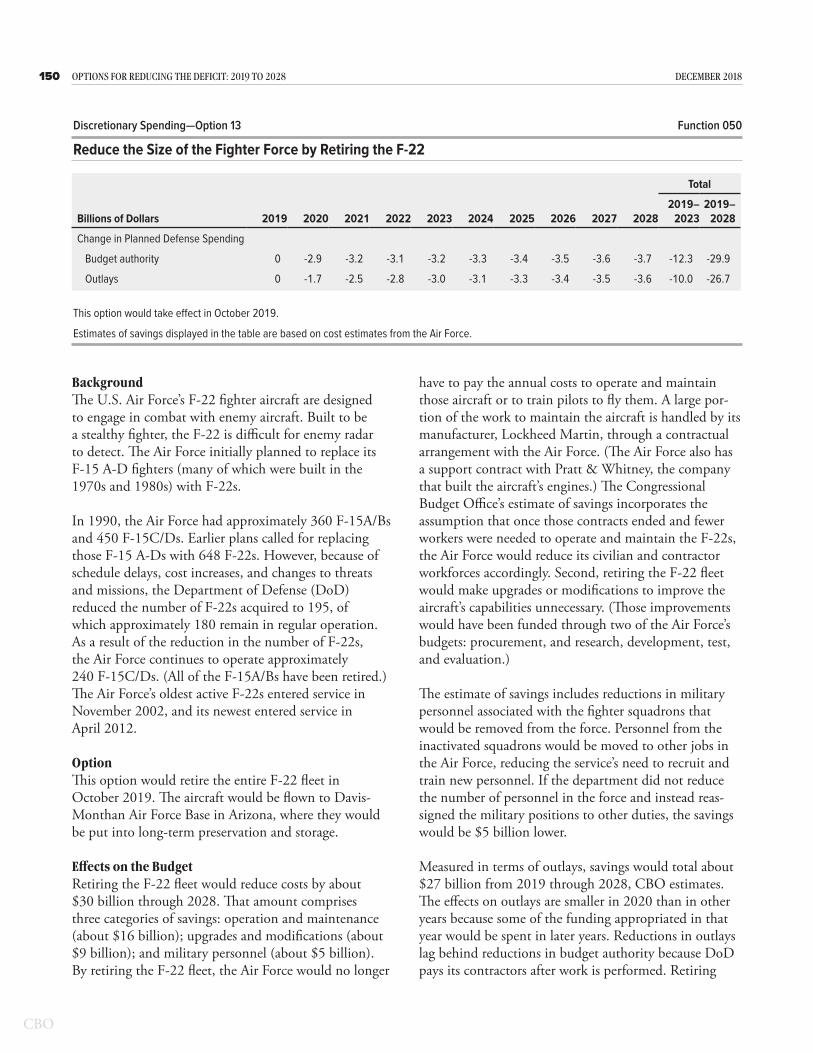
150 OPTIONS FOR REDUCING THE DEFICIT: 2019 TO 2028 DECEMBER 2018
BackgroundThe U.S. Air Force’s F-22 fighter aircraft are designed to engage in combat with enemy aircraft. Built to be a stealthy fighter, the F-22 is difficult for enemy radar to detect. The Air Force initially planned to replace its F-15 A-D fighters (many of which were built in the 1970s and 1980s) with F-22s.
In 1990, the Air Force had approximately 360 F-15A/Bs and 450 F-15C/Ds. Earlier plans called for replacing those F-15 A-Ds with 648 F-22s. However, because of schedule delays, cost increases, and changes to threats and missions, the Department of Defense (DoD) reduced the number of F-22s acquired to 195, of which approximately 180 remain in regular operation. As a result of the reduction in the number of F-22s, the Air Force continues to operate approximately 240 F-15C/Ds. (All of the F-15A/Bs have been retired.) The Air Force’s oldest active F-22s entered service in November 2002, and its newest entered service in April 2012.
OptionThis option would retire the entire F-22 fleet in October 2019. The aircraft would be flown to Davis-Monthan Air Force Base in Arizona, where they would be put into long-term preservation and storage.
Effects on the BudgetRetiring the F-22 fleet would reduce costs by about $30 billion through 2028. That amount comprises three categories of savings: operation and maintenance (about $16 billion); upgrades and modifications (about $9 billion); and military personnel (about $5 billion). By retiring the F-22 fleet, the Air Force would no longer
have to pay the annual costs to operate and maintain those aircraft or to train pilots to fly them. A large por-tion of the work to maintain the aircraft is handled by its manufacturer, Lockheed Martin, through a contractual arrangement with the Air Force. (The Air Force also has a support contract with Pratt & Whitney, the company that built the aircraft’s engines.) The Congressional Budget Office’s estimate of savings incorporates the assumption that once those contracts ended and fewer workers were needed to operate and maintain the F-22s, the Air Force would reduce its civilian and contractor workforces accordingly. Second, retiring the F-22 fleet would make upgrades or modifications to improve the aircraft’s capabilities unnecessary. (Those improvements would have been funded through two of the Air Force’s budgets: procurement, and research, development, test, and evaluation.)
The estimate of savings includes reductions in military personnel associated with the fighter squadrons that would be removed from the force. Personnel from the inactivated squadrons would be moved to other jobs in the Air Force, reducing the service’s need to recruit and train new personnel. If the department did not reduce the number of personnel in the force and instead reas-signed the military positions to other duties, the savings would be $5 billion lower.
Measured in terms of outlays, savings would total about $27 billion from 2019 through 2028, CBO estimates. The effects on outlays are smaller in 2020 than in other years because some of the funding appropriated in that year would be spent in later years. Reductions in outlays lag behind reductions in budget authority because DoD pays its contractors after work is performed. Retiring
Discretionary Spending—Option 13 Function 050
Reduce the Size of the Fighter Force by Retiring the F-22
Total
Billions of Dollars 2019 2020 2021 2022 2023 2024 2025 2026 2027 20282019–
20232019–
2028
Change in Planned Defense Spending
Budget authority 0 -2.9 -3.2 -3.1 -3.2 -3.3 -3.4 -3.5 -3.6 -3.7 -12.3 -29.9
Outlays 0 -1.7 -2.5 -2.8 -3.0 -3.1 -3.3 -3.4 -3.5 -3.6 -10.0 -26.7
This option would take effect in October 2019.
Estimates of savings displayed in the table are based on cost estimates from the Air Force.

151CHAPTER THREE: DISCRETIONARY SPENDING OPTIONS OPTIONS FOR REDUCING THE DEFICIT: 2019 TO 2028
only a portion of the fleet would not generate commen-surate savings because of the fixed costs associated with operating any F-22s. The fleet is already smaller than DoD intended, so the costs per aircraft are elevated; retiring only part of the fleet would increase costs per aircraft even further. A significant uncertainty surround-ing the estimated savings stems from averting future upgrades or modifications—the costs of which are hard to predict.
Other EffectsOne argument for this option is that retiring the F-22 would not eliminate the military’s stealthy aviation capability. DoD’s growing fleet of F-35 fighter aircraft has that capability. Although F-35s are not optimized for air-to-air combat in the way F-22s are, they could
partially replace the capabilities lost through retirement of the F-22s. In addition, the Air Force would retain its ability to attack ground targets with stealthy aircraft by using the B-2 bomber and the B-21 bomber (which is currently in development).
One argument against this option is that it would reduce the Air Force’s fighter force by about 10 percent (assuming that all else was unchanged). That decrease would have an adverse effect on the Air Force’s ability to fight adversaries such as Russia or China, which have advanced air-defense systems and which also fly sophisti-cated fighter aircraft. DoD expects that the F-22 would be particularly valuable in countering enemy aircraft in the initial days of a conflict, when an adversary’s aerial detection capabilities have not yet been degraded.
RELATED OPTION: Discretionary Spending, “Cancel Plans to Purchase Additional F-35 Joint Strike Fighters and Instead Purchase F-16s and F/A-18s” (page 132)
RELATED CBO PUBLICATIONS: The Cost of Replacing Today’s Air Force Fleet (December 2018), www.cbo.gov/publication/54657; Alternatives for Modernizing U.S. Fighter Forces (May 2009), www.cbo.gov/publication/41181

152 OPTIONS FOR REDUCING THE DEFICIT: 2019 TO 2028 DECEMBER 2018
BackgroundThe Ground-Based Midcourse Defense (GMD) system is designed to defend against intermediate and long-range missiles during the middle portion of their trajec-tory. It uses interceptor missiles to launch a kill vehicle, which uses onboard sensors to locate the threat and then maneuvers to hit and kill it. The system is part of a lay-ered defense that combines sensors, control systems, and several types of interceptors or other methods to destroy attacking missiles of various ranges and during different portions of their trajectories.
GMD comprises 44 interceptor missiles in silos at Fort Greely, Alaska, and Vandenberg Air Force Base, California; battle management command-and-con-trol software; and a communications system to relay information to and from the interceptors in flight. The Department of Defense (DoD) is planning to add 20 interceptors to the system and has several programs under way to support GMD testing and improve the GMD system.
OptionThis option would cancel the GMD system and its sup-port efforts, including the Improved Homeland Defense Interceptors, Common Kill Vehicle, and Multi-Object Kill Vehicle programs. The option would not affect the overarching command-and-control or sensor programs that support other missile defense systems.
Effects on the BudgetThis option would reduce budget authority by about $20 billion over the next decade, the Congressional Budget Office estimates. Outlays would decrease by a smaller amount—about $18 billion over that period—because the budget authority provided would not be
spent right away as development of new systems requires extensive research and planning. Those savings would result from ending efforts to improve the interceptors and kill vehicles, canceling procurement of additional interceptors, and avoiding the costs of operation and maintenance of the GMD system. The estimate of savings does not include reductions in the number of military personnel because the GMD site at Fort Greely is operated by Army National Guard units, which CBO assumes would be assigned to other activities.
CBO’s estimate of savings is based on plans as described in DoD’s budget documentation. Those estimates, which CBO has projected to 2028, are somewhat uncertain because technology development programs historically have experienced cost growth relative to DoD’s estimates. Some of the programs that this option would cancel are intended to fix problems with the existing interceptors or kill vehicles, and those problems could prove more difficult (and expensive) to overcome than DoD or CBO has anticipated.
CBO’s estimate of savings is based on the full cancella-tion of GMD and of the supporting programs designed to improve performance. If DoD chose instead to continue fielding the GMD system but to reduce the number of interceptors, savings would be substantially less and would not be proportional to the reduction in the number of interceptors fielded. That is because the development programs that are intended to improve per-formance, which constitute about half of the estimated costs over the next decade, would still continue. In addi-tion, fixed costs associated with maintaining each base and continuing to operate at least one interceptor there would result in savings in operations costs for GMD that
Discretionary Spending—Option 14 Function 050
Cancel the Ground-Based Midcourse Defense System
Total
Billions of Dollars 2019 2020 2021 2022 2023 2024 2025 2026 2027 20282019–
20232019–
2028
Change in Spending
Budget authority 0 -2.5 -2.2 -1.8 -1.8 -1.9 -2.3 -2.5 -2.5 -2.6 -8.4 -20.3
Outlays 0 -1.0 -1.9 -2.0 -1.9 -1.9 -2.0 -2.2 -2.4 -2.5 -6.8 -17.7
This option would take effect in October 2019.

153CHAPTER THREE: DISCRETIONARY SPENDING OPTIONS OPTIONS FOR REDUCING THE DEFICIT: 2019 TO 2028
would be less than proportional to the reduction in the number of interceptors.
Other Effects One argument for this option is the GMD program’s mixed track record. Critics argue that initial development of the system was rushed, resulting in quality control and design flaws. They contend that GMD has failed in six of 10 intercept tests since its deployment in 2004 (although interpretation of whether several of those tests succeeded or failed is controversial). Furthermore, critics argue that even if the system performed as designed, it could be defeated by decoys or other countermeasures. U.S. nuclear forces are sufficient to deter any attacks on the United States, in their view. A second argument is that the system has been a source of geopolitical tension. The United States withdrew from the Anti-Ballistic Missile Treaty, a bilateral agreement with Russia, before deploy-ment of GMD. Since that withdrawal, the Russians have repeatedly protested against U.S. missile defenses. Some analysts attribute recent Russian improvements to their nuclear forces to concerns about U.S. missile defenses. A final argument is that DoD could use other programs to
perform some of the missions designated for GMD. For example, the Aegis missile defense system now deployed on Navy ships and at one location ashore also intercepts missiles in the midcourse phase of their flight and is slated to be tested against long-range threats. In addition, DoD is devising defenses that would destroy missiles during their boost phase (while their rocket boosters are still firing), which could defend against some of the threats that GMD is intended to address. However, if DoD chose to increase funding for those programs to compensate for the loss of GMD, the net savings for this option would decline accordingly.
An argument against this option is the current threat posed by ballistic missile launches from hostile nations. Despite the deterrence against attack provided by the large U.S. nuclear arsenal, the threat has increased recently, in particular with the successful testing of long-range missiles by North Korea. Advocates of the GMD system contend that the continued operation, expansion, and improvement of GMD would provide urgently needed protection for the United States and its allies.
RELATED CBO PUBLICATIONS: Historical and Planned Future Budgets for the Missile Defense Agency’s Ground-Based Midcourse Defense Program (July 2014), www.cbo.gov/publication/45546; Options for Deploying Missile Defenses in Europe (February 2009), www.cbo.gov/publication/41165; Alternatives for Boost-Phase Missile Defense (July 2004), www.cbo.gov/publication/15852

154 OPTIONS FOR REDUCING THE DEFICIT: 2019 TO 2028 DECEMBER 2018
BackgroundHousing allowances are one component of military compensation. The amount provided varies by a service member’s rank, location, and whether he or she has dependents. The Department of Defense (DoD) provides those allowances to ensure that eligible personnel and their families have access to affordable quality housing.
Three types of housing are available to service members: government-owned housing (quarters or family housing), housing on military bases operated through long-term contracts with DoD (privatized housing), and housing in the local civilian market. Unmarried service mem-bers with fewer than four years of service are typically required to live in barracks, but more senior personnel and service members with dependents can choose among the three types of housing. About 60 percent of service members live in privatized or local housing.
If government-owned military housing is not available (which is typically the case, because it is very limited), service members are provided a Basic Allowance for Housing (BAH) to offset most of their costs for rent and utilities. Because those costs vary by location, the BAH rate varies by locality; the amount provided is based on rents in the local housing market. The housing allow-ance is not subject to federal (and, in many cases, state) income tax.
In the mid-1990s, to improve the quality of military housing, management of those facilities was transferred from DoD to private-sector developers through the Military Housing Privatization Initiative (MHPI). BAH is the primary source of income for that program. As of
2018, nearly all family housing on military bases in the United States was managed by private-sector developers.
In the early years of the MHPI program, BAH compen-sation was set to cover about 80 percent of service mem-bers’ rental and utility costs, on average. That share was consistent with DoD’s long-standing policy of compen-sating service members who live off-base. In 2001, BAH was increased so that it would cover, on average, 100 per-cent of a service member’s expenses for housing and utilities by 2005. (That change was part of the Secretary of Defense’s efforts to improve service members’ quality of life.) The Congress partially reversed that policy in the National Defense Authorization Act for 2016, authoriz-ing DoD to lessen BAH to 95 percent of average housing costs.
OptionThis option would reduce BAH by 1.7 percentage points in January of each year starting in 2020. BAH would not change for service members until they moved. As a result, by 2028, BAH would once again cover 80 percent of rental and utility costs. This option would affect dis-cretionary spending by DoD and would also affect man-datory spending by the Department of Veterans Affairs (VA), because the housing benefit that VA provides as part of the Post-9/11 GI Bill is tied to BAH rates.
Effects on the BudgetIn 2017, about 14 percent (or $20 billion) of DoD’s $139 billion military personnel appropriation was for BAH. If implemented, this option would save about $15 billion in discretionary spending and nearly
Discretionary Spending—Option 15 Function 050
Reduce the Basic Allowance for Housing to 80 Percent of Average Housing Costs
Total
Billions of Dollars 2019 2020 2021 2022 2023 2024 2025 2026 2027 20282019–
20232019–
2028
Change in Discretionary Spending
Budget authority 0 * -0.2 -0.6 -1.0 -1.5 -2.0 -2.5 -3.1 -3.7 -1.9 -14.7
Outlays 0 * -0.2 -0.6 -1.0 -1.5 -2.0 -2.5 -3.1 -3.6 -1.9 -14.6
Change in Mandatory Outlays 0 * -0.1 -0.2 -0.4 -0.5 -0.7 -0.8 -1.0 -1.2 -0.7 -4.9
This option would take effect in January 2020.
* = between −$50 million and zero.

155CHAPTER THREE: DISCRETIONARY SPENDING OPTIONS OPTIONS FOR REDUCING THE DEFICIT: 2019 TO 2028
$5 billion in mandatory spending from 2019 through 2028, the Congressional Budget Office estimates.
CBO’s estimate reflects the size and composition of DoD’s forces for fiscal year 2019 (as indicated in the President’s 2019 budget). CBO projects that service members would move every three years, on average, and that their moves would occur uniformly throughout the year. Because of those factors, in combination with the specifications of the option, the savings in both budget authority and outlays would lag behind reductions in the BAH rate. Because of that lag, savings would continue to increase until 2031—peaking at nearly $5 billion—and would grow with inflation thereafter.
Housing costs used to calculate the BAH rate are com-posed of the median rent plus average utility costs and are determined from market data for approximately 300 military housing areas in the United States, includ-ing Alaska and Hawaii. If housing costs deviated sig-nificantly from expectations, savings under this option would differ as well.
If the BAH was changed by more or less than 1.7 per-centage points per year, the savings under this option would grow or shrink proportionately. For example, increasing the annual rate of reduction to 3.0 percentage points per year would result in proportionately higher savings by 2028.
Other EffectsOne advantage of this option is that it would slow the growth of military pay, which would move cash compen-sation for military personnel closer to the 70th percentile of compensation for civilians with comparable education and years of experience (DoD’s goal). Currently, cash compensation for a majority of military personnel is at about the 90th percentile—that is, regular military compensation (RMC) is higher than the compensation of 90 percent of all comparable civilians. (DoD uses RMC as the measure of cash compensation for military personnel; that calculation adjusts for the fact that BAH and the basic allowance for subsistence are not taxed.) Gradually reducing BAH below local market costs would not reduce total compensation below current levels, however, because military pay raises and the costs of rental housing are expected to continue to rise.
A second advantage of this option is that reducing BAH might have only a small effect on the nominal
(not adjusted for inflation) value of a service member’s compensation. Because BAH is not taxed at the fed-eral level, under this option it would cover more than 80 percent of housing costs—and perhaps as much as 90 percent to more than 100 percent for many service members, depending on their marginal rate for federal income taxes. The value could be somewhat higher for military personnel who live in states that also do not tax the allowance.
One disadvantage of this option is that slowing the growth of military compensation by reducing the BAH rate might affect DoD’s ability to retain military per-sonnel. The extent of that effect would depend on the strength of the U.S. economy and other factors in future years.
A second disadvantage is that reducing BAH below local market costs would limit the housing choices available to service members. Those living in the local commu-nity would have to pay more out of pocket or find less expensive housing. But those living in privatized govern-ment housing would be shielded from the decreases in BAH because current policies allow developers to charge no more than the local BAH for rent and utilities. That disparity would probably boost demand for government housing, although it is already near capacity.
Under current policies, reducing the BAH rate would also decrease the income of the private-sector developers who provide housing on military installations. Lowering the BAH rate further, to 80 percent of market prices in the area, would reduce their income from current levels unless policies changed and those service members were required to pay a portion of their rent out of pocket (as is the case with service members who live off-base and are reimbursed at 95 percent of their estimated average housing costs).
Although this option would reduce income, providing housing on military installations may continue to be profitable for private-sector developers, who entered into contracts to build and manage their facilities when BAH rates were much closer to those that would be in effect under this option. In addition, private-sector devel-opers receive several other benefits—help in financing their investment, very high demand, and few marketing costs—all of which providers of off-base housing do not.

156 OPTIONS FOR REDUCING THE DEFICIT: 2019 TO 2028 DECEMBER 2018
The experience of private-sector developers under the reduction of the current BAH rate from 100 percent in 2015 to 95 percent by 2019 has yet to be fully studied. A 2018 analysis from the Government Accountability Office found that DoD needs to improve the consis-tency of the information it provides to better assess that experience.
Developers of private-sector housing have already asked the Congress to help preserve their income as BAH rates decline to 95 percent. The latest defense authorization bill (for 2019) requires DoD to provide 5 percent above the prescribed BAH rate for that purpose. This option incorporates the assumption that developers would not receive supplemental funding to offset further reductions in BAH rates.

157CHAPTER THREE: DISCRETIONARY SPENDING OPTIONS OPTIONS FOR REDUCING THE DEFICIT: 2019 TO 2028
BackgroundThe United States’ long-range nuclear forces consist of intercontinental ballistic missiles (ICBMs) carrying nuclear warheads, ballistic missile submarines carrying submarine-launched ballistic missiles (SLBMs), and long-range bombers carrying nuclear bombs and cruise missiles. That configuration is often referred to as the strategic nuclear triad. Each segment of the triad contrib-utes to nuclear deterrence in different ways that comple-ment the others. ICBMs provide the ability to respond promptly to an attack. Furthermore, because the silos that house ICBMs are hardened against nuclear attack and are well separated from other silos, each missile would have to be destroyed individually, which sets a high threshold for an adversary to deliver a debilitating attack on U.S. nuclear forces. Ballistic missile submarines operating at sea are very hard to detect and thus would be likely to survive any attack on U.S. nuclear forces and ensure that the United States could retaliate. Bombers provide flexibility and the ability to signal intent during a crisis (by increasing their pace of operations or being visibly deployed to crisis regions).
The United States currently fields 400 ICBMs distrib-uted among 450 active silos at three bases. That force includes Minuteman III missiles, the last of which entered service in the 1970s and which have been refur-bished several times. The Air Force plans to replace those missiles with new missiles when the current inventory reaches the end of its useful life, around 2030. As part of the Ground-Based Strategic Deterrent (GBSD) pro-gram, the Department of Defense (DoD) will design a new ICBM, build about 640 of those missiles, and refurbish the existing silos, ICBM support equipment,
and command-and-control systems. Minuteman III missiles currently carry W78 and W87 warheads, which are sustained by the Department of Energy (DOE). Over the coming years, DOE plans to design and build interoperable warheads (IWs), which would replace the existing warheads for SLBMs and ICBMs.
OptionUnder this option, the new missile portion of the GBSD program would be canceled, and the IW program would be replaced with less complex life-extension programs (LEPs) on the SLBM warheads (the W76 and the W88). The current Minuteman III missiles, along with their W78 and W87 warheads, would continue to operate until they reached the end of their operational lifetime. Refurbishment of the silos, command-and-control sys-tems, and other support equipment would continue as planned under the GBSD program.
Effects on the BudgetThis option would reduce budget authority by about $30 billion over the next 10 years relative to the costs of DoD’s 2019 plan, the Congressional Budget Office esti-mates. Outlays would decrease by about $24 billion over that period. Savings in outlays would be delayed relative to budget authority because developing new systems requires extensive research and planning and because DoD distributes funding as expenses are incurred. Most of the savings would come from forgoing development and initial production of the new ICBM as part of the GBSD program. Additional savings would result from cancellation of the IW programs, although some of those savings would be offset by the costs of replacing the IWs with LEPs on the current SLBM warheads.
Discretionary Spending—Option 16 Function 050
Cancel Development and Production of the New Missile in the Ground-Based Strategic Deterrent Program
Total
Billions of Dollars 2019 2020 2021 2022 2023 2024 2025 2026 2027 20282019–
20232019–
2028
Change in Spending
Budget authority 0 -0.4 -1.4 -2.4 -3.3 -4.1 -4.0 -4.8 -5.2 -4.8 -7.5 -30.4
Outlays 0 -0.4 -1.1 -1.9 -2.6 -3.3 -3.7 -3.9 -3.7 -3.6 -6.1 -24.3
This option would take effect in October 2019.
Estimates of savings displayed in the table are based on the 2019 Future Years Defense Program and the Congressional Budget Office’s extension of that plan.

158 OPTIONS FOR REDUCING THE DEFICIT: 2019 TO 2028 DECEMBER 2018
Most of the savings from this option would occur after the 10-year period. DoD plans to produce the new ICBM and its interoperable warheads into the 2030s. In addition, operation and support costs for ICBM forces and warheads would end after the Minuteman III mis-siles were retired.
CBO’s estimate of the costs to develop the new ICBM is based on the actual costs to develop the Minuteman III, inflated to current dollars and then increased by 50 per-cent to account for cost growth between generations of missiles. CBO estimated the cost of the first produc-tion unit of the ICBM by applying a parametric model based on engine thrust and other technical parameters (assuming the new missile would have parameters similar to those of the Minuteman III). CBO’s estimate of the costs of the IW programs is based on DOE’s plans. All of those estimates are very uncertain. Programs that have developed new weapon systems historically have experienced cost growth relative to early estimates, and both the missile and warhead programs are in the early planning stages.
CBO’s estimate of savings is based on full cancellation of the new ICBM and its warheads, forgoing both devel-opment and subsequent production. If DoD and DOE chose instead to continue those programs but to reduce the quantity purchased, savings would be substantially smaller. That is because the development efforts, which constitute most of the 10-year savings, would persist.
Other Effects One argument for this option is that the likelihood of a large-scale disabling nuclear strike—the threat most
subject to deterrence by ICBMs—is much lower now than during the Cold War, according to some ana-lysts. If a large-scale strike did occur, the United States would still have several hundred warheads available for a retaliatory strike as long as U.S. nuclear submarines at sea remain undetectable, so deterrence would still be effective. Furthermore, some analysts argue that ICBMs provide little value in the modern multipolar nuclear environment in which regional conflicts could escalate to war and limited nuclear strikes present the most press-ing risks. Advocates of this option would also argue that ballistic missile submarines are capable of carrying more nuclear warheads than they do currently, so the reduc-tion of 400 warheads coming from no longer fielding ICBMs in the 2030s could be offset by increasing the number of warheads carried on SLBMs. Thus, this option would not necessarily represent a reduction in the number of warheads fielded by the United States.
One argument against this option is that it would decrease strategic stability. Some analysts argue that reducing the ICBM force would increase the risk of an attack because the number of sites an adversary would have to destroy in a disabling strike on U.S. land-based nuclear forces would decline from almost 500 to around 20. Another argument against this option is that it could lead to nuclear proliferation if the retirement of the ICBM force in the 2030s was viewed by allies as being significant enough that they questioned U.S. secu-rity assurances (backed by U.S. nuclear weapons) and decided to pursue their own nuclear arsenals.
RELATED OPTIONS: Discretionary Spending, “Reduce the Size of the Nuclear Triad” (page 138), “Cancel the Long-Range Standoff Weapon” (page 141)
RELATED CBO PUBLICATIONS: Approaches for Managing the Costs of U.S. Nuclear Forces, 2017 to 2046 (October 2017), www.cbo.gov/publication/53211; Projected Costs of U.S. Nuclear Forces, 2014 to 2023 (December 2013), www.cbo.gov/publication/44968, and subsequent updates to that report

159CHAPTER THREE: DISCRETIONARY SPENDING OPTIONS OPTIONS FOR REDUCING THE DEFICIT: 2019 TO 2028
BackgroundThe budget for international affairs funds diplomatic and consular programs, global health initiatives, security assistance, and other programs. In 2017, those programs cost an estimated $51 billion, including $12 billion for international security assistance, $8 billion for dip-lomatic and consular programs, $8 billion for global health programs, and $3 billion for international disaster assistance. (Other activities that receive funding include migration and refugee assistance, development assistance, peacekeeping efforts, and narcotics control and law enforcement.) Most funding for international affairs is administered by the Department of State or the Agency for International Development. Several other agencies, such as the Departments of Defense, Agriculture, and the Treasury, also receive funding for overseas assis-tance programs. The costs of most programs are rel-atively small, but significant budgetary savings could be achieved with broad cuts to the entire international affairs budget.
OptionThis option would reduce the total international affairs budget by 25 percent beginning in 2020.
Effects on the BudgetIn total, the reduction in funding for international affairs programs would save $116 billion through 2028, the Congressional Budget Office estimates, provided that federal appropriations were reduced accordingly. The eliminated appropriations would not immedi-ately decrease outlays by the same amount because it typically takes about six years for most of the funds appropriated in one year to be spent. If funding was reduced by 25 percent in 2020, CBO expects that about one-third of the resulting savings would accrue in the same year, roughly one-fourth in the following year, and the remainder over the next four years. If funding
was reduced by more than 25 percent, savings would be proportionally larger. Uncertainty about the budgetary effects of reducing spending on international affairs pro-grams stems primarily from uncertainty about whether actual appropriations made by the Congress would match CBO’s baseline projections in any given year.
Other EffectsAn argument for this option is that reducing federal spending on international affairs could encourage the private sector to take a larger role in providing foreign assistance. Private organizations already provide signifi-cant resources for various international initiatives (such as HIV/AIDS research and financial development assistance), and further diversifying funding sources for international initiatives could increase their overall success. In addition, some of the U.S. government’s foreign assistance may be ineffective at promoting growth and reducing pov-erty. Although some projects and programs are generally considered successful, the Congressional Research Service has concluded that “in most cases, clear evidence of the success or failure of U.S. assistance programs is lacking, both at the program level and in the aggregate.”
The primary argument against this option is that reduc-ing funding for international affairs programs could have far-reaching effects that might ultimately impede both the international and domestic policy agendas of the United States. Such programs, which encompass many activities in addition to foreign aid, are central to estab-lishing and maintaining positive relations with other countries. Those relationships contribute to increased economic opportunities in the United States, better international cooperation, and enhanced national secu-rity. Significant reductions in federal funding for inter-national affairs programs would hinder humanitarian, environmental, public health, economic, and national security efforts.
Discretionary Spending—Option 17 Function 150
Reduce Funding for International Affairs Programs
Total
Billions of Dollars 2019 2020 2021 2022 2023 2024 2025 2026 2027 20282019–
20232019-2028
Change in Spending
Budget authority 0 -15 -15 -15 -16 -16 -16 -17 -17 -18 -61 -145
Outlays 0 -5 -8 -11 -13 -14 -15 -16 -16 -17 -37 -116
This option would take effect in October 2019.
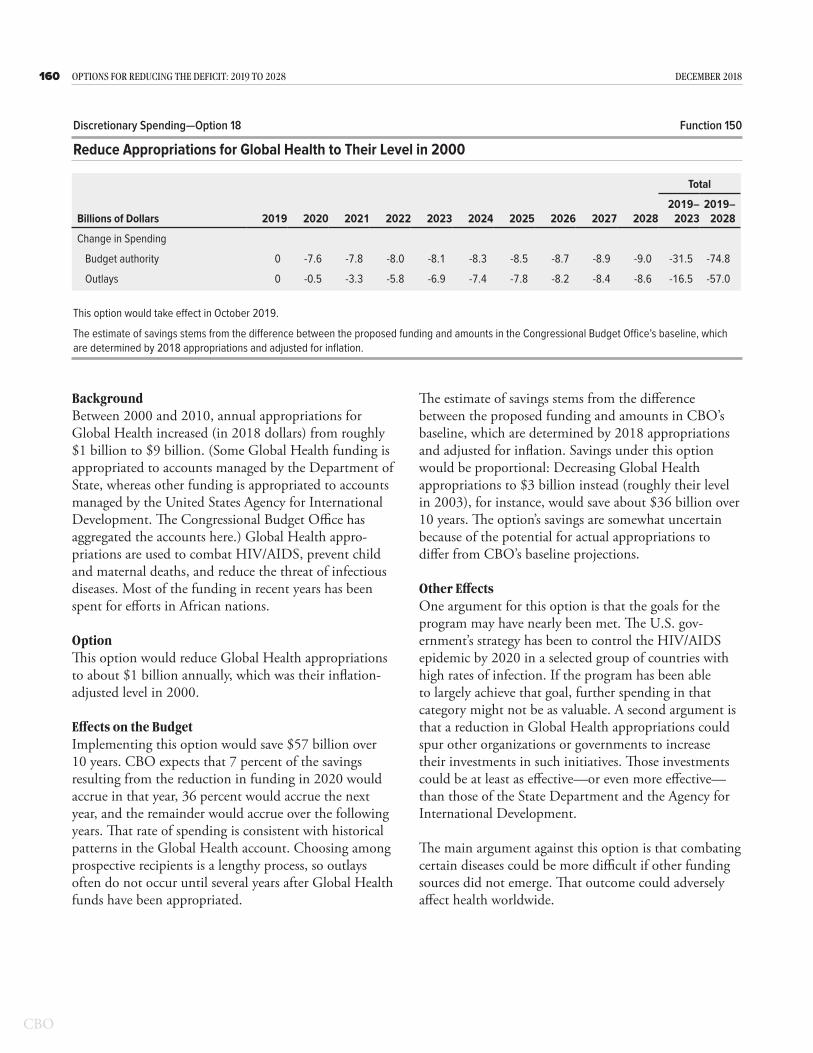
160 OPTIONS FOR REDUCING THE DEFICIT: 2019 TO 2028 DECEMBER 2018
BackgroundBetween 2000 and 2010, annual appropriations for Global Health increased (in 2018 dollars) from roughly $1 billion to $9 billion. (Some Global Health funding is appropriated to accounts managed by the Department of State, whereas other funding is appropriated to accounts managed by the United States Agency for International Development. The Congressional Budget Office has aggregated the accounts here.) Global Health appro-priations are used to combat HIV/AIDS, prevent child and maternal deaths, and reduce the threat of infectious diseases. Most of the funding in recent years has been spent for efforts in African nations.
OptionThis option would reduce Global Health appropriations to about $1 billion annually, which was their inflation-adjusted level in 2000.
Effects on the BudgetImplementing this option would save $57 billion over 10 years. CBO expects that 7 percent of the savings resulting from the reduction in funding in 2020 would accrue in that year, 36 percent would accrue the next year, and the remainder would accrue over the following years. That rate of spending is consistent with historical patterns in the Global Health account. Choosing among prospective recipients is a lengthy process, so outlays often do not occur until several years after Global Health funds have been appropriated.
The estimate of savings stems from the difference between the proposed funding and amounts in CBO’s baseline, which are determined by 2018 appropriations and adjusted for inflation. Savings under this option would be proportional: Decreasing Global Health appropriations to $3 billion instead (roughly their level in 2003), for instance, would save about $36 billion over 10 years. The option’s savings are somewhat uncertain because of the potential for actual appropriations to differ from CBO’s baseline projections.
Other EffectsOne argument for this option is that the goals for the program may have nearly been met. The U.S. gov-ernment’s strategy has been to control the HIV/AIDS epidemic by 2020 in a selected group of countries with high rates of infection. If the program has been able to largely achieve that goal, further spending in that category might not be as valuable. A second argument is that a reduction in Global Health appropriations could spur other organizations or governments to increase their investments in such initiatives. Those investments could be at least as effective—or even more effective—than those of the State Department and the Agency for International Development.
The main argument against this option is that combating certain diseases could be more difficult if other funding sources did not emerge. That outcome could adversely affect health worldwide.
Discretionary Spending—Option 18 Function 150
Reduce Appropriations for Global Health to Their Level in 2000
Total
Billions of Dollars 2019 2020 2021 2022 2023 2024 2025 2026 2027 20282019–
20232019–
2028
Change in Spending
Budget authority 0 -7.6 -7.8 -8.0 -8.1 -8.3 -8.5 -8.7 -8.9 -9.0 -31.5 -74.8
Outlays 0 -0.5 -3.3 -5.8 -6.9 -7.4 -7.8 -8.2 -8.4 -8.6 -16.5 -57.0
This option would take effect in October 2019.
The estimate of savings stems from the difference between the proposed funding and amounts in the Congressional Budget Office’s baseline, which are determined by 2018 appropriations and adjusted for inflation.

161CHAPTER THREE: DISCRETIONARY SPENDING OPTIONS OPTIONS FOR REDUCING THE DEFICIT: 2019 TO 2028
BackgroundThe National Aeronautics and Space Administration’s (NASA’s) Human Exploration and Operations Mission Directorate oversees both the development of the systems and capabilities required to explore deep space and the agency’s operations in low-Earth orbit. The director-ate’s human exploration programs fund the research and development of the next generation of systems for deep space exploration and provide technical and financial support to the commercial space industry. Complementing those efforts, the space operations programs carry out missions in low-Earth orbit, most notably using the International Space Station, and pro-vide facilities and services to communicate with satellites in space. In 2017, the directorate’s funding included all of the funding provided for deep space exploration, 85 percent of the funding for low-Earth orbit and space-flight, and 20 percent of the funding for exploration research and technology.
OptionThis option would eliminate all funding for NASA’s directorate for human exploration and operations in space starting in 2020. The agency’s science and aeronau-tics programs and robotic space missions would continue unchanged.
Effects on the BudgetProvided that federal appropriations were reduced accordingly, eliminating human space programs would save $89 billion between 2020 and 2028, the Congressional Budget Office estimates. By eliminating NASA’s Human Exploration and Operations Mission Directorate, this option would decrease appropriations in three areas that support human space exploration. The eliminated appropriations would not immediately
decrease outlays by the same amount, however, because funds appropriated in one year are typically spent over four years. If funding was eliminated in 2020, CBO expects that 75 percent of the resulting savings would accrue in that same year, 18 percent in the next year, and the remainder over the following two years. If funding was decreased rather than eliminated, the savings would be proportional to the change in spending, in CBO’s estimation. There is some uncertainty about the option’s savings as a result of restructuring in NASA’s budget accounts in recent years and the potential for actual appropriations to differ from CBO’s baseline projections.
Other EffectsThe main argument for this option is that increased capabilities in electronics and information technology have generally reduced the need for humans to fly space missions. The scientific instruments used to gather knowledge in space today rely much less (or not at all) on nearby humans to operate them. Also, to avoid putting humans in harm’s way, NASA and other federal agencies have increasingly used robots to perform poten-tially dangerous missions. To explore and study Mars, for example, NASA uses robotic rovers and orbiters. The Curiosity rover launched in November 2011, landed on Mars more than eight months later, and has been explor-ing the planet and conducting scientific studies since then, following commands delivered remotely.
Eliminating humans from spaceflights would avoid risk to human life and would decrease the cost of space exploration by reducing the weight and complexity of the vehicles needed for the missions. (Unlike instru-ments, humans need water, air, food, space to move around in, and rest.) In addition, by replacing people with instruments, one-way missions would be possible,
Discretionary Spending—Option 19 Function 250
Eliminate Human Space Exploration Programs
Total
Billions of Dollars 2019 2020 2021 2022 2023 2024 2025 2026 2027 20282019–
20232019–
2028
Change in Spending
Budget authority 0 -9.4 -9.6 -9.9 -10.1 -10.3 -10.6 -10.8 -11.0 -11.3 -38.9 -92.9
Outlays 0 -7.1 -9.0 -9.7 -10.0 -10.2 -10.5 -10.7 -11.0 -11.2 -35.7 -89.3
This option would take effect in October 2019.

162 OPTIONS FOR REDUCING THE DEFICIT: 2019 TO 2028 DECEMBER 2018
thus eliminating the cost and complexity of return and reentry into the Earth’s atmosphere. Return trips would be necessary only when a particular mission required it, such as to collect samples for further analysis.
A major argument against this option is that eliminating human spaceflight from the orbits near Earth would end the technical progress necessary to prepare for human missions to Mars (though such missions are—at a minimum—decades away). Moreover, if robotic missions
proved too limiting, then human space efforts might have to be restarted. Another argument against this option is that there might be some scientific advantage to having humans at the International Space Station to conduct experiments in microgravity that could not be carried out in other, less costly, ways. (However, the International Space Station is currently scheduled to be retired in 2024; its decommissioning was twice post-poned, first from 2015 and then from 2020.)

163CHAPTER THREE: DISCRETIONARY SPENDING OPTIONS OPTIONS FOR REDUCING THE DEFICIT: 2019 TO 2028
BackgroundThe Department of Energy (DOE) supports new tech-nologies throughout the various stages of the develop-ment process, from basic energy research through com-mercial demonstration projects. Roughly one-third of the department’s funding for research and development in 2017 went to funding basic research on energy sciences, and the remaining two-thirds went to technology devel-opment and demonstration. Excluding defense-related funding, nearly all of DOE’s spending for technology development and demonstration supported new tech-nologies in the areas of fossil and nuclear energy, energy efficiency, and renewable energy. Measured in 2017 dol-lars, funding for developing and demonstrating technol-ogies in those three areas has averaged $2.3 billion per year since 2010.
OptionThis option would reduce funding for technology development and demonstration in fossil energy, nuclear energy, energy efficiency, and renewable energy programs to roughly 25 percent of their 2018 amounts. The reduc-tion would be phased in over three years: Funding would be reduced by 25 percent in 2020, 50 percent in 2021, and the full amount of the cuts (75 percent) in 2022 and thereafter. This option would reduce DOE’s efforts to support the later stages of technology development and the demonstration of commercial feasibility but would not alter DOE’s support of basic and early applied research, which is carried out primarily through the department’s Office of Science. (This option would not affect funding for technical assistance or financial assis-tance, such as that provided for weatherization services for low-income families; for an option that would affect
Discretionary Spending—Option 20 Function 270
Reduce Department of Energy Funding for Energy Technology Development
Total
Billions of Dollars 2019 2020 2021 2022 2023 2024 2025 2026 2027 20282019–
20232019–
2028
Reduce Funding for Fossil Energy Research, Development, and Demonstration
Change in Spending
Budget authority 0 -0.2 -0.3 -0.5 -0.5 -0.5 -0.5 -0.5 -0.6 -0.6 -1.5 -4.2
Outlays 0 * -0.1 -0.2 -0.3 -0.4 -0.5 -0.5 -0.5 -0.5 -0.6 -3.0
Reduce Funding for Nuclear Energy Research, Development, and Demonstration
Change in Spending
Budget authority 0 -0.2 -0.4 -0.6 -0.6 -0.6 -0.6 -0.7 -0.7 -0.7 -1.8 -5.1
Outlays 0 -0.1 -0.3 -0.5 -0.6 -0.6 -0.6 -0.7 -0.7 -0.7 -1.4 -4.7
Reduce Funding for Energy Efficiency and Renewable Energy Research, Development, and Demonstration
Change in Spending
Budget authority 0 -0.4 -0.8 -1.3 -1.3 -1.3 -1.3 -1.4 -1.4 -1.4 -3.8 -10.7
Outlays 0 -0.1 -0.3 -0.6 -0.9 -1.1 -1.2 -1.3 -1.4 -1.4 -1.9 -8.3
Total
Change in Spending
Budget authority 0 -0.7 -1.5 -2.4 -2.4 -2.5 -2.5 -2.6 -2.6 -2.7 -7.1 -19.9
Outlays 0 -0.2 -0.7 -1.3 -1.8 -2.1 -2.3 -2.5 -2.5 -2.6 -3.9 -16.0
This option would take effect in October 2019.
* = between -$50 million and zero.

164 OPTIONS FOR REDUCING THE DEFICIT: 2019 TO 2028 DECEMBER 2018
such funding, see Discretionary Spending, Option 33, “Reduce Funding for Certain Grants to State and Local Governments.”)
Effects on the BudgetProvided that federal appropriations were reduced accordingly, reductions in funding for energy technol-ogy development would lower discretionary outlays by a total of $16 billion from 2020 through 2028, the Congressional Budget Office estimates. The reduction in outlays is smaller than the reduction in projected fund-ing because of lags between when the funds are appropri-ated and when they are expended. Historically, DOE has spent its funding for research and development within four to six years of its appropriation. That lag reflects the time it takes to plan and solicit research proposals, con-sider bids, and award contracts, and it is a key source of uncertainty surrounding the estimated effects of the cut in funding on outlays. A shorter lag time than CBO has estimated would result in greater deficit reduction over the next 10 years, and vice versa.
If funding for technology development was reduced by a smaller amount than it would be under this option, a smaller reduction in outlays would probably result. However, decreasing funding by a greater amount than this option envisions would not necessarily decrease outlays proportionally. For example, depending on the extent of the reductions, DOE might face unavoidable costs related to shutting down programs, which could limit savings in the near term.
Other EffectsAn argument for this option is that federal funding is generally more cost-effective when it supports basic science and research aimed at the very early stages of developing new technologies than when it supports research that is focused on technologies that are closer to reaching the marketplace. That is because basic research done early in the technology development process is
more likely to lead to knowledge that, although it may be valuable to society, results in benefits that cannot be fully captured by firms in the form of higher profits. In contrast, research done in the later stages of the technol-ogy development process is more likely to be profitable for private firms to undertake without federal funding.
Another argument for this option is that the private sector has an advantage in developing, demonstrating, and deploying new energy technologies. Generally, the direct feedback that markets provide to private investors has proven more effective than the judgment of govern-ment managers in selecting which technologies will be commercially successful. The limits on the government’s ability to promote the development of new energy technologies are illustrated by federal efforts to commer-cialize technology to capture and store carbon dioxide. Although DOE has offered financial incentives to firms to build that technology into new commercial power plants, it has found few firms willing to do so. Overall, DOE has long sought to introduce new energy technol-ogies for coal through expensive technology demonstra-tion plants that have often failed to deliver commercially useful knowledge or attract much private interest.
An argument against this option is that reducing fed-eral support may result in too little spending on the development and use of products that reduce energy consumption or produce energy with minimal green-house gas emissions. Reducing emissions of greenhouse gases would diminish the potentially large long-run costs associated with climate change, but producers and con-sumers have little incentive to manufacture or purchase technologies that reduce those emissions. That lack of incentive results from the fact that the costs imposed by climate change are not reflected in current energy prices. Federal support could help compensate for the resulting underinvestment in greenhouse gas–reducing technologies.
RELATED CBO PUBLICATIONS: Testimony of Terry Dinan, Senior Adviser, Microeconomic Studies Division, before the Subcommittee on Energy of the House Committee on Energy and Commerce, Federal Support for Developing, Producing, and Using Fuels and Energy Technologies (March 29, 2017), www.cbo.gov/publication/52521; Federal Efforts to Reduce the Cost of Capturing and Storing Carbon Dioxide (June 2012), www.cbo.gov/publication/43357; Federal Climate Change Programs: Funding History and Policy Issues (March 2010), www.cbo.gov/publication/21196

165CHAPTER THREE: DISCRETIONARY SPENDING OPTIONS OPTIONS FOR REDUCING THE DEFICIT: 2019 TO 2028
BackgroundThe federal government subsidizes intercity travel in var-ious ways. For example, the National Railroad Passenger Corporation—or Amtrak—received appropriations of about $1.5 billion in 2017 and $1.9 billion in 2018 to subsidize intercity passenger rail services. The 2018 fig-ure includes $650 million in grants for the Northeast Corridor and debt service and about $1.3 billion in grants for the national network that Amtrak operates. For comparison, Amtrak’s capital spending in 2017 was $1.6 billion and its operating expenses totaled $4.2 bil-lion (including $0.8 billion in depreciation and amorti-zation costs).
Another form of federal subsidy for intercity travel is the Essential Air Service (EAS) program, which received $150 million in discretionary budget authority and $122 million in mandatory budget authority in 2017; the latter came from overflight fees that are charged to aircraft that fly through U.S. airspace but take off and land in other countries. As of September 2018, the EAS program—created by the Airline Deregulation Act of 1978 to maintain airline service in communities that had been covered by federally mandated service—subsidized air service in 63 communities in Alaska, 2 in Hawaii, 1 in Puerto Rico, and 108 in the continental United States (CONUS). Based on EAS data available for those
CONUS communities, the federal subsidy per airline passenger in 2017 ranged from $14 in Joplin, Missouri, and Cody, Wyoming, to $536 in Alliance, Nebraska.
OptionThis option would eliminate funding for Amtrak and discontinue the EAS program.
Effects on the BudgetProvided that federal appropriations were reduced accordingly, this option would yield savings of about $21 billion in discretionary spending from 2020 through 2028, the Congressional Budget Office estimates. That amount consists of about $20 billion in savings from eliminating funding for Amtrak and roughly $2 billion in savings from eliminating the discretionary compo-nent of the EAS program (identified separately in the budget as Payments to Air Carriers). Discontinuing the EAS program would also yield savings totaling about $1 billion in mandatory spending over that same period, CBO estimates.
CBO’s baseline projections of budget authority for Amtrak and the discretionary component of EAS are based on the appropriations contained in the Consolidated Appropriations Act, 2018, adjusted for projected inflation through 2028. Estimated budget
Discretionary Spending—Option 21 Function 400
Eliminate Funding for Amtrak and the Essential Air Service Program
Total
Billions of Dollars 2019 2020 2021 2022 2023 2024 2025 2026 2027 20282019–
20232019–
2028
Eliminate Funding for Amtrak
Change in Discretionary Spending
Budget authority 0 -2.0 -2.1 -2.1 -2.2 -2.2 -2.3 -2.3 -2.3 -2.4 -8.4 -19.9
Outlays 0 -2.0 -2.1 -2.1 -2.2 -2.2 -2.3 -2.3 -2.3 -2.4 -8.3 -19.8
Discontinue Payments to Air Carriers Under the Essential Air Service Program
Change in Discretionary Spending
Budget authority 0 -0.2 -0.2 -0.2 -0.2 -0.2 -0.2 -0.2 -0.2 -0.2 -0.7 -1.6
Outlays 0 -0.1 -0.2 -0.2 -0.2 -0.2 -0.2 -0.2 -0.2 -0.2 -0.6 -1.5
Eliminate the Essential Air Service Program
Change in Mandatory Outlays 0 -0.1 -0.1 -0.2 -0.2 -0.2 -0.2 -0.2 -0.2 -0.2 -0.5 -1.4
This option would take effect in October 2019.
166 OPTIONS FOR REDUCING THE DEFICIT: 2019 TO 2028 DECEMBER 2018
authority for the mandatory component of EAS reflects anticipated revenues from the overflight fees, which are charged per nautical mile and may be adjusted period-ically so as to remain “reasonably related” to the gov-ernment’s cost of providing air traffic services. CBO’s projections of revenues from the fees primarily reflect its projections of economic output (gross domestic product, or GDP) and inflation in consumer prices.
In all three cases, most savings in outlays are pro-jected to occur in the same year as the reductions in budget authority. For instance, the Federal Railroad Administration is required to make quarterly payments to Amtrak, and CBO expects virtually all of a reduction in budget authority in a given year to result in outlay savings in the same year. For the EAS program, CBO projects the reductions in outlays from a given year’s cut in budget authority to be distributed over three years, with about two-thirds occurring in the same year and the remainder over the next two years, for both man-datory and discretionary spending. Those rates reflect the time required for the Department of Transportation (DOT) to select and contract with airlines to provide the subsidized air services, obligate funds, receive invoices for services provided, and review and approve the invoices as outlined in the contract.
Relatively little uncertainty surrounds the option’s sav-ings relative to CBO’s baselines for Amtrak and the EAS program—although those baseline projections could differ substantially from the amounts that the Congress might appropriate for the programs even if lawmakers did not change the programs otherwise. The effects on outlays of changes in budget authority have not varied much from year to year in the past, making the projec-tions of those effects fairly certain. The main source of uncertainty in this option is the projected revenues from the overflight fees; actual revenues, and hence the savings from not using those revenues for the EAS program, could differ from CBO’s baseline either because GDP or inflation diverged from the agency’s current baseline projections or because those factors are imperfect proxies for miles of overflight travel and changes in the costs of air traffic control.
Short of eliminating support for Amtrak and the EAS program, the Congress could reduce spending on either program in more limited ways. For example, the mini-mum distance for federal support of Amtrak’s rail lines
could be raised from 750 miles to some higher threshold, with corresponding reductions in appropriations. Setting the minimum at 1,000, 1,500, or 2,000 miles would reduce the number of eligible lines from 15 to 11, 6, or 4, respectively. Alternatively, eligibility for continued fed-eral support of Amtrak could be based on the number of states served: Five of the 15 lines serve 10 or more states, and an additional 8 lines serve between 5 and 8 states. Eligibility for subsidized air travel service in the EAS program could be tightened by increasing the minimum distance of a community from the nearest medium or large hub airport, lowering the maximum subsidy per passenger, or reducing or eliminating DOT’s authority to grant waivers of the existing requirements (discussed below).
Other EffectsOne argument in favor of this option is that when the Amtrak and EAS subsidies were first authorized in the 1970s, both were viewed as temporary measures. They were intended to help Amtrak become self-supporting and to aid communities and airlines as they adjusted to deregulation.
A second argument for the option is that both subsi-dies support transportation services that are of some value to particular groups of users but that are not commercially viable and provide little if any benefit to the general public. According to that argument, states or localities that highly value the subsidized rail or air services should provide the subsidies. States are already required to provide support for Amtrak service on rail lines less than 750 miles long in amounts determined by a cost- allocation method that Amtrak developed in consultation with the states to ensure that those lines cover their operating costs. Some analysts have called for the federal government to extend that requirement to Amtrak lines longer than 750 miles. The EAS program also has cost-sharing requirements, although they affect only the three communities in the program that are less than 40 miles from the nearest small hub airport: Those communities must now negotiate a local share of the costs before their participation in the program will be renewed. Communities not in the EAS program have used various methods to develop or maintain air ser-vice, including guaranteeing airlines a minimum level of revenues (in some cases, using federal grants to back the guarantees), waiving fees, and taking over ground- handling operations.
167CHAPTER THREE: DISCRETIONARY SPENDING OPTIONS OPTIONS FOR REDUCING THE DEFICIT: 2019 TO 2028
An argument against eliminating funding for either Amtrak or EAS is that rail or air service to some smaller communities would be curtailed without the federal subsidies. Amtrak’s long rail lines could be particularly vulnerable because reaching agreement among all of the affected states on how to replace the federal subsidies could be difficult. Eliminating service on existing rail lines could cause hardship for passengers who rely on them and might undermine the economies of affected communities.
Another argument against eliminating support for Amtrak is that the amount of such support needs to be analyzed relative to federal subsidies for other modes of travel. Rail travel has certain advantages for society, including a much lower fatality rate than travel by high-ways and lower emissions of air pollutants and green-house gases than travel by highways or air. Those advan-tages could be lost under the option: The loss of federal support could lead to sharp reductions in Amtrak’s oper-ations and capital investment and consequently could undermine the future viability of passenger rail service in the United States.
An additional argument against discontinuing EAS is that efforts to control the program’s costs are under way. Four communities with high average subsidy costs per passenger in 2015 or 2016 have lost their eligibility for EAS: In one case, the subsidy exceeded a cap of $200 for CONUS communities within 210 driving miles of a medium or large hub airport; the other subsidies exceeded a cap of $1,000 that applies to all CONUS communities. Also, a fifth community has taken a buyout to leave the program voluntarily. DOT used its authority to grant temporary waivers to 28 other com-munities that were out of compliance with the $200 cap in 2015 or 2016 or with a requirement that CONUS communities within 175 miles of a medium or large hub airport board an average of at least 10 passengers per day; seven of the 28 came into compliance by 2016 or 2017. Looking at the average 2017 subsidies of the remaining 21 communities, 9 fell between $201 and $250, and another 6 were $100 to $500 below their 2015 levels. (Four more communities fell out of compliance in 2016 or 2017; their 2017 subsidy rates ranged from $203 to $265.) Continued efforts by communities to comply with the requirements and by DOT to terminate the eligibility of communities unable to comply could help to control the EAS program’s costs.
RELATED CBO PUBLICATION: The Past and Future of U.S. Passenger Rail Service (September 2003), www.cbo.gov/publication/14769
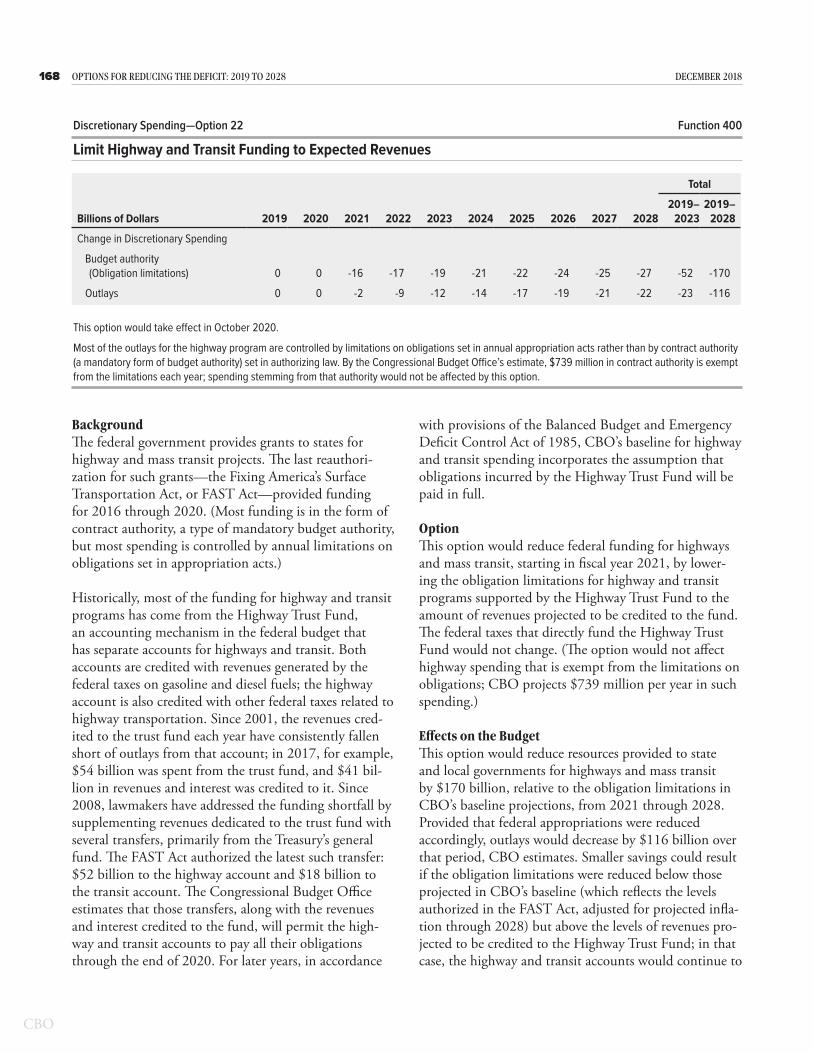
168 OPTIONS FOR REDUCING THE DEFICIT: 2019 TO 2028 DECEMBER 2018
BackgroundThe federal government provides grants to states for highway and mass transit projects. The last reauthori-zation for such grants—the Fixing America’s Surface Transportation Act, or FAST Act—provided funding for 2016 through 2020. (Most funding is in the form of contract authority, a type of mandatory budget authority, but most spending is controlled by annual limitations on obligations set in appropriation acts.)
Historically, most of the funding for highway and transit programs has come from the Highway Trust Fund, an accounting mechanism in the federal budget that has separate accounts for highways and transit. Both accounts are credited with revenues generated by the federal taxes on gasoline and diesel fuels; the highway account is also credited with other federal taxes related to highway transportation. Since 2001, the revenues cred-ited to the trust fund each year have consistently fallen short of outlays from that account; in 2017, for example, $54 billion was spent from the trust fund, and $41 bil-lion in revenues and interest was credited to it. Since 2008, lawmakers have addressed the funding shortfall by supplementing revenues dedicated to the trust fund with several transfers, primarily from the Treasury’s general fund. The FAST Act authorized the latest such transfer: $52 billion to the highway account and $18 billion to the transit account. The Congressional Budget Office estimates that those transfers, along with the revenues and interest credited to the fund, will permit the high-way and transit accounts to pay all their obligations through the end of 2020. For later years, in accordance
with provisions of the Balanced Budget and Emergency Deficit Control Act of 1985, CBO’s baseline for highway and transit spending incorporates the assumption that obligations incurred by the Highway Trust Fund will be paid in full.
OptionThis option would reduce federal funding for highways and mass transit, starting in fiscal year 2021, by lower-ing the obligation limitations for highway and transit programs supported by the Highway Trust Fund to the amount of revenues projected to be credited to the fund. The federal taxes that directly fund the Highway Trust Fund would not change. (The option would not affect highway spending that is exempt from the limitations on obligations; CBO projects $739 million per year in such spending.)
Effects on the BudgetThis option would reduce resources provided to state and local governments for highways and mass transit by $170 billion, relative to the obligation limitations in CBO’s baseline projections, from 2021 through 2028. Provided that federal appropriations were reduced accordingly, outlays would decrease by $116 billion over that period, CBO estimates. Smaller savings could result if the obligation limitations were reduced below those projected in CBO’s baseline (which reflects the levels authorized in the FAST Act, adjusted for projected infla-tion through 2028) but above the levels of revenues pro-jected to be credited to the Highway Trust Fund; in that case, the highway and transit accounts would continue to
Discretionary Spending—Option 22 Function 400
Limit Highway and Transit Funding to Expected Revenues
Total
Billions of Dollars 2019 2020 2021 2022 2023 2024 2025 2026 2027 20282019–
20232019–
2028
Change in Discretionary Spending
Budget authority (Obligation limitations) 0 0 -16 -17 -19 -21 -22 -24 -25 -27 -52 -170
Outlays 0 0 -2 -9 -12 -14 -17 -19 -21 -22 -23 -116
This option would take effect in October 2020.
Most of the outlays for the highway program are controlled by limitations on obligations set in annual appropriation acts rather than by contract authority (a mandatory form of budget authority) set in authorizing law. By the Congressional Budget Office’s estimate, $739 million in contract authority is exempt from the limitations each year; spending stemming from that authority would not be affected by this option.

169CHAPTER THREE: DISCRETIONARY SPENDING OPTIONS OPTIONS FOR REDUCING THE DEFICIT: 2019 TO 2028
require support from general revenues. Conversely, larger savings could result if the obligation limitations were set below the levels of projected revenues.
The estimated reductions in budget authority reflect the difference between the Highway Trust Fund’s projected revenues and its projected obligation limita-tions. Revenues depend largely on fuel use, which CBO projects will continue to decline through 2028 because of increases in fuel efficiency that exceed increases in miles traveled.
Outlay estimates are based on the estimated limitations on obligations, taking into account the fact that out-lays may continue for more than five years from the year of obligation. The federal government reimburses states only after they incur eligible expenses, and a small portion of obligations never result in outlays. About one-quarter of the savings in outlays associated with a reduction in obligations in a given year are projected to occur in the same year, and less than half occur the following year.
Fuel use and spending rates are the main sources of uncertainty in this option. More fuel consumption implies higher revenues credited to the trust fund and hence smaller savings resulting from limiting spending to revenues; conversely, less fuel consumption implies greater savings. Motorists could use more fuel than CBO projects if, for example, oil prices were lower than expected or federal fuel economy standards were loosened. Alternatively, fuel use could fall short of CBO’s projections if, for example, a recession reduced freight transportation and passenger travel. A recession could also affect the speed with which outlays occurred, as could the reduction in federal spending and other factors.
Other EffectsA key argument for this option is that funding highways and transit systems from charges on highway and transit users, including federal and state fuel taxes and transit fares, is fairer than funding those systems from general taxes paid by all taxpayers, because those who benefit pay the costs. In addition, it tends to promote a more efficient allocation of resources, because the charges give
users some incentive to limit their travel and because as use increases, more revenues become available. Those arguments suggest that if current revenues are too low to fund a desired level of federal support for highways and mass transit, an increase in the current taxes on users or creation of new such taxes is appropriate.
A related argument is that it is fairer and more efficient to have local or state tax revenues pay for transportation projects that primarily benefit people in a particular area and to reserve federal revenues for projects that have regional or national significance. Another argument for this option is that it would reduce the extent to which federal support for certain investments in highways and mass transit distorts choices states make between such investments and spending on operations and mainte-nance, or on other priorities. Also, some of the reduction in federal spending under this option could be offset by greater spending by state and local governments. (Some studies on the effects of federal highway grants have found that the availability of such grants has encour-aged state and local governments to reduce their own spending on highways and to use those funds for other purposes.)
A general argument against reducing federal spending on highways and mass transit is that doing so could increase the economic and social costs associated with aging roads, bridges, buses, and rail systems. In addition, the transportation network as a whole supports interstate commerce and thus strengthens the national economy.
An argument against the specific alternative of reducing spending to the available tax revenues from highway users is that portions of that spending go to transit projects (which more directly benefit transit users than highway users) and to projects and purposes that ben-efit the general public—such as sidewalks, bike paths, recreational trails, scenic beautification, and preservation of historic transportation structures. In addition, current federal taxes on highway users have limited effects on the efficiency of road use because they give motorists only weak incentives to avoid contributing to its two main social costs—traffic congestion and pavement damage by heavy trucks.

170 OPTIONS FOR REDUCING THE DEFICIT: 2019 TO 2028 DECEMBER 2018
RELATED OPTIONS: Discretionary Spending, “Eliminate the Federal Transit Administration” (page 171); Revenues, “Raise the Tax Rates on Long-Term Capital Gains and Qualified Dividends by 2 Percentage Points and Adjust Tax Brackets” (page 207)
RELATED CBO PUBLICATIONS: Federal Support for Financing State and Local Transportation and Water Infrastructure (October 2018), www.cbo.gov/publication/54549; Sheila Campbell, Fiscal Substitution of Investment for Highway Infrastructure, Working Paper 2018-08 (August 2018), www.cbo.gov/publication/54371; “Baseline Projections for Selected Programs: Highway Trust Fund Accounts” (April 2018), www.cbo.gov/publication/51300; The Macroeconomic and Budgetary Effects of Federal Investment (June 2016), www.cbo.gov/publication/51628; Approaches to Making Federal Highway Spending More Productive (February 2016), www.cbo.gov/publication/50150; cost estimate for the conference agreement on H.R. 22, the FAST Act, as posted on the website of the House Committee on Rules on December 1, 2015 (December 2, 2015), www.cbo.gov/publication/51051; testimony of Joseph Kile, Assistant Director for Microeconomic Studies, before the Senate Committee on Finance, The Status of the Highway Trust Fund and Options for Paying for Highway Spending (June 18, 2015), www.cbo.gov/publication/50297; Alternative Approaches to Funding Highways (March 2011), www.cbo.gov/publication/22059

171CHAPTER THREE: DISCRETIONARY SPENDING OPTIONS OPTIONS FOR REDUCING THE DEFICIT: 2019 TO 2028
BackgroundThe Department of Transportation’s Federal Transit Administration (FTA) provides financial and technical support to roughly 6,800 local public transit systems across the country, through about two dozen formula grant and competitive grant programs. Its funds sup-port capital investments, and in some cases operating expenses, for subways, buses, light-rail and commuter rail systems, trolleys, and ferries. The FTA was created in 1964, when it was known as the Urban Mass Transit Administration. Spending for programs administered by the FTA and administrative costs for the agency are projected to total about $127 billion from 2021 through 2028, or about $15 billion per year, the Congressional Budget Office estimates.
OptionThis option would phase out the FTA, terminating new spending on its programs after the Fixing America’s Surface Transportation Act expires in 2020 and eliminat-ing the agency entirely upon completion of its outstand-ing grants. The option would not affect the federal taxes on motor fuels that provide some of the funding for the FTA: The 2.86 cents per gallon now credited to the transit account of the Highway Trust Fund would con-tinue to be collected, whether the revenues were credited to the (sole remaining) highway account of the trust fund or to the general fund of the Treasury.
Effects on the BudgetImplementing this option would reduce spending by $87 billion over 10 years, CBO estimates, reflecting CBO’s current baseline projection for programs admin-istered by the FTA. (That figure does not take into account mandatory spending associated with various costs of closing the agency, such as payments to former employees for accrued annual leave, unemployment ben-efits, and early retirement.) CBO projects FTA’s budget authority by adjusting the amount appropriated in fiscal year 2019 by a measure of projected inflation. Savings would be smaller if lawmakers chose to phase out the FTA more gradually or to retain any of its programs by assigning them to a different agency, such as the Federal Highway Administration.
As with similar infrastructure programs, savings in outlays would initially be small relative to the reduction in budget authority because that reduction would cancel projects involving spending in multiple years. The bulk of the savings in outlays would occur within six years of the reductions in budget authority.
There is relatively little uncertainty about the option’s savings relative to CBO’s baseline—although whether actual appropriations made by the Congress would match CBO’s baseline projections in any given year is itself uncertain. The transition costs of closing the FTA are somewhat uncertain but also relatively small in com-parison with the agency’s total budget.
Discretionary Spending—Option 23 Function 400
Eliminate the Federal Transit Administration
Total
Billions of Dollars 2019 2020 2021 2022 2023 2024 2025 2026 2027 20282019–
20232019–
2028
Change in Spending
Budget authority (Including obligation limitations) 0 0 -15 -15 -15 -16 -16 -16 -17 -17 -45 -127
Outlays 0 0 -2 -6 -9 -11 -13 -15 -16 -16 -16 -87
This option would take effect in October 2020.
The option would eliminate programs currently funded from two sources: the mass transit account of the Highway Trust Fund and the general fund of the Treasury. Programs funded from the Highway Trust Fund receive mandatory budget authority in the form of contract authority. The Congressional Budget Office expects that the contract authority will continue to be controlled by limitations on obligations contained in appropriation acts. The budgetary resources reflect the estimated obligation limitations contained in CBO’s adjusted April 2018 baseline and the estimated budget authority for those programs funded from the general fund.

172 OPTIONS FOR REDUCING THE DEFICIT: 2019 TO 2028 DECEMBER 2018
Other EffectsThe main argument for eliminating the FTA is that the benefits of public transit systems are primarily local or regional and should be financed at the local or state level. If the people who benefit from a transit system bear its costs, it is less likely that too many projects or overly costly projects will be undertaken or that services of low value relative to their ongoing costs will continue to be supported. Relatedly, decisions made on the basis of state or local funding would not be influenced by the greater availability of federal support for capital invest-ments than for operating expenses. Less capital-intensive options (for example, dedicated bus lanes instead of light-rail lines) are often more cost-effective overall.
An argument against eliminating the FTA is that public transit has benefits that extend beyond the area directly served. Without continued federal funding, transit ser-vices would be cut back and systems would deteriorate, leading to increased road use, with its attendant prob-lems of traffic congestion, accidents, and emissions of local air pollutants and greenhouse gases. In turn, greater congestion could increase demand for road construction and development in outlying areas. Dispersion of eco-nomic activity to such areas, where greater distances and lower population density make the provision of transit services more costly, could reduce access to jobs by peo-ple who do not own cars.
RELATED OPTION: Discretionary Spending, “Limit Highway and Transit Funding to Expected Revenues” (page 168)

173CHAPTER THREE: DISCRETIONARY SPENDING OPTIONS OPTIONS FOR REDUCING THE DEFICIT: 2019 TO 2028
BackgroundThe Aviation and Transportation Security Act, enacted in response to the terrorist attacks of September 11, 2001, made the federal government, rather than airlines and airports, responsible for screening passengers, carry-on baggage, and checked baggage. Implementing new stan-dards under the 2001 law required the hiring of screeners who were more highly qualified and trained, necessitat-ing increased compensation and raising overall security costs. To help pay for those costs, the law directed air-lines to charge passengers a fee, remitted to the govern-ment, on trips beginning from an airport in the United States. Initially set at $2.50 for a one-way trip with no stops and $5 for a trip with one or more stops, the fee was raised and restructured by the Congress in 2013 and 2014. It is now set at $5.60 per one-way trip, with a maximum charge of $11.20 per round trip, regardless of the number of stops. In 2017, the Transportation Security Administration (TSA) collected about $3.9 billion from the fee, of which $2.4 billion helped to offset its appropriation of $7.3 billion for operations and support, most of which relates to civil aviation security. Of the remaining fees collected, $1.3 billion was depos-ited in the Treasury’s general fund and $250 million was allocated to TSA’s Aviation Security Capital Fund.
OptionThis option, which is similar to a proposal in the President’s 2019 budget, would increase the passenger fee to $8.25 per one-way trip by 2020, with a maximum
charge of $16.50 per round trip. Projected budget authority for TSA would not change.
Effects on the BudgetImplementing this option would boost collections (and thus reduce net budget authority and outlays) by $20 billion over 10 years, the Congressional Budget Office estimates. That increase in collections is based on CBO’s projections of future air travel, which in turn are largely based on the agency’s projections of gross domes-tic product (GDP), adjusted to account for a slight reduction in the amount of travel as a result of the higher fees. Once the option went into effect, the total amount of fees collected would be equivalent to 80 percent or more of the amount of projected total funding for TSA’s operations and support and for the allocation to its capital fund. A higher percentage of TSA’s costs could be recouped if the fee was set to some amount above $8.25 or vice versa; a given percentage increase or decrease in the fee relative to $8.25 would roughly change the effect on outlays by the same percentage.
Uncertainty surrounding CBO’s projections of future air travel is the primary source of uncertainty in the estimates of the option’s budgetary effects. The actual number of trips could be larger or smaller than CBO projects, either because actual GDP is higher or lower than anticipated in CBO’s current baseline or because travel can be affected by factors other than changes in GDP—for instance, by changes in airfares resulting from changes in the cost of jet fuel.
Discretionary Spending—Option 24 Function 400
Increase the Passenger Fee for Aviation Security
Total
Billions of Dollars 2019 2020 2021 2022 2023 2024 2025 2026 2027 20282019–
20232019–
2028
Change in Spending
Budget authority 0 -2.0 -2.0 -2.1 -2.2 -2.3 -2.4 -2.4 -2.5 -2.6 -8.3 -20.5
Outlays 0 -2.0 -2.0 -2.1 -2.2 -2.3 -2.4 -2.4 -2.5 -2.6 -8.3 -20.5
This option would take effect in October 2019.
Fees collected under this option could be recorded in the budget as revenues or as discretionary or mandatory offsets to spending, depending on the specific legislative language used to increase them.
174 OPTIONS FOR REDUCING THE DEFICIT: 2019 TO 2028 DECEMBER 2018
Other EffectsThe main arguments for and against this option rest on the principle that the beneficiaries of a service should pay for it; the differences lie in who is seen as benefiting from TSA’s aviation security efforts. An argument for the option is that the primary beneficiaries are passengers and that security is a basic cost of airline transportation, just as fuel and labor are. The current situation, in which roughly 40 percent of those costs are covered partly by taxpayers in general, provides a subsidy to airlines and their passengers.
Conversely, an argument against the option is that the economy as a whole and the public in general benefit from the availability and security of air transportation. To the extent that greater security reduces the risk of terrorist attacks, the entire population is better off. By that reasoning, using less funding provided by taxpayers in general to pay for the costs of transportation security measures is a disadvantage of the option.
RELATED OPTION: Revenues, “Impose Fees to Cover the Costs of Government Regulations and Charge for Services Provided to the Private Sector” (page 286)

175CHAPTER THREE: DISCRETIONARY SPENDING OPTIONS OPTIONS FOR REDUCING THE DEFICIT: 2019 TO 2028
BackgroundNational community service programs provide financial and in-kind assistance to students, seniors, and others who volunteer in their communities in areas such as education, public safety, the environment, and health care. In 2018, federal funding for the Corporation for National and Community Service (CNCS), which oper-ates the AmeriCorps and Senior Corps programs, totaled $1.1 billion. Participants in CNCS programs receive one or more of the following types of compensation: wages, stipends for living expenses, training, and subsidies for health insurance and child care. In addition, upon com-pleting their service, participants in certain programs can earn education awards, paid from the National Service Trust (NST), in amounts tied to the maximum value of the Pell grant ($6,095 for the 2018–2019 academic year). In 2018, roughly 75,000 people participated in AmeriCorps, and 222,000 people participated in Senior Corps.
OptionThis option would eliminate all federal funding for CNCS except for funding for the National Service Trust. Currently, programs such as AmeriCorps and Senior Corps are funded through a mix of public and private resources. Each year, private businesses and foundations contribute more than $1.2 billion to CNCS’s programs. In the absence of federal funding, the volunteer pro-grams could continue to operate, but only to the extent that state and local governments and private entities chose to fund them.
Effects on the BudgetThis option would reduce budget authority by $11 bil-lion from 2020 through 2028, the Congressional Budget Office estimates. That estimate includes not only the
savings in operational costs associated with terminating the volunteer programs, but also the savings in CNCS’s administrative costs. Under this option, CNCS would curtail its operations in 2019 and redirect its budget authority toward shutting down. Budget authority from 2020 through 2028 would be substantially smaller than in CBO’s baseline projection, but it would not be elim-inated entirely because of the ongoing claiming of edu-cation awards. Former volunteers generally have up to seven years (or longer if an extension is granted) to claim those awards after completing their service. Accordingly, CBO projects continued budget authority through 2028 to fund the administration of the NST.
Provided that federal appropriations were reduced accordingly, this option would decrease outlays by $9 bil-lion from 2020 through 2028, CBO estimates. Savings would be lower in 2020 and 2021 than in subsequent years because of the onetime costs of shutting down the agency, such as paying accrued annual leave and incurring penalties for canceling leases for office space. Drawing on budget authority provided before 2020, CNCS’s outlays would decrease gradually over the period but would not be eliminated in full because of continued disbursements from the NST. If the amount of education awards owed to former participants ever exceeded the legislated budget authority, the difference would be paid for by mandatory spending, not new budget authority.
Uncertainty in this estimate comes mainly from NST’s future disbursements. The amounts that would be paid out through 2028 depend on the number of current vol-unteers who would ultimately qualify for an education award, the share of eligible individuals who would claim an award, and the timing of those claims.
Discretionary Spending—Option 25 Function 500
Eliminate Federal Funding for National Community Service
Total
Billions of Dollars 2019 2020 2021 2022 2023 2024 2025 2026 2027 20282019–
20232019–
2028
Change in Spending
Budget authority 0 -1.0 -1.1 -1.2 -1.2 -1.2 -1.2 -1.3 -1.3 -1.3 -4.5 -10.9
Outlays 0 -0.2 -0.7 -0.9 -1.0 -1.1 -1.1 -1.2 -1.2 -1.2 -2.8 -8.6
This option would take effect in October 2019.

176 OPTIONS FOR REDUCING THE DEFICIT: 2019 TO 2028 DECEMBER 2018
From 2022 through 2028, a funding cut of less than 100 percent would have an effect on outlays that was roughly proportional to the size of the cut. For example, if funding was cut in half rather than in full, savings over that period would be approximately half the agency’s baseline funding level. In 2020 and 2021, however, a funding cut of less than 100 percent would have a pro-portionately larger effect on outlays. That is because costs to shut down CNCS would only occur in those early years if the option eliminated all funding for the agency. If funding was cut in half rather than in full, savings in 2020 and 2021 would be greater than half of the agency’s baseline funding level.
Other EffectsAn argument in favor of this option is that funding com-munity service programs at the local level might be more efficient than funding them at the federal level because the benefits of such programs accrue more to the local community than to the nation as a whole. According to that argument, the local government, community, or
organization that received the benefits of a given ser-vice project would be better positioned than the federal government to decide whether that project was valuable enough to fund and to determine which service projects should receive the highest priority. Another argument for eliminating student-focused national service pro-grams and the education benefits associated with them is that unlike most other federal programs that provide financial aid to students, CNCS’s education benefits are not targeted at low-income students. Participants in AmeriCorps are selected without regard to their families’ income or assets, so funds do not necessarily go to the students with the greatest financial need.
An argument against eliminating CNCS is that the programs provide opportunities for participants of all socioeconomic backgrounds to engage in public service and develop skills that are valuable in the labor market. In addition, if federal funding was not replaced by other sources, this option could have adverse effects on the communities in which CNCS operates.

177CHAPTER THREE: DISCRETIONARY SPENDING OPTIONS OPTIONS FOR REDUCING THE DEFICIT: 2019 TO 2028
BackgroundThe two Head Start programs provide comprehensive development services, including prekindergarten educa-tion, for children from low-income families. The Head Start program serves primarily 3- and 4-year-old pre-schoolers, and the Early Head Start program provides services to pregnant women and child care for children under age 3. (In this option, “Head Start” refers to both programs collectively.) Head Start is administered by the Department of Health and Human Services, but services are provided by state or local governments or by private nonprofit or for-profit institutions. Children in foster care, children who are homeless, and children from families that receive public assistance (from pro-grams such as Temporary Assistance for Needy Families or Supplemental Security Income) qualify for Head Start regardless of their families’ income.
OptionThis option would eliminate Head Start.
Effects on the BudgetProvided that federal appropriations were reduced accordingly, this option would save $92 billion between 2020 and 2028, the Congressional Budget Office estimates. Head Start served roughly 900,000 children in 2017 at an average cost of about $10,000 per child, for a total budgetary cost of $9 billion. Outlays for the program are projected to rise to $12 billion by 2028, CBO estimates. That estimate is based on projections of budget authority and on historical trends in spending. Eliminating Head Start would therefore reduce budget-ary costs by an average of about $10 billion per year over the coming decade.
CBO projects that about 40 percent of the budget authority provided for Head Start in a given year is spent in that year, in part because of the timing of contracts with grantee institutions, and the remainder is spent over the next few years. As a result, the reduction in outlays in 2020 would be smaller than the reduction in bud-get authority in that year because those outlays would include spending from the budget authority granted in the preceding few years.
For any given percentage cut to budget authority, out-lays over the 10-year period would decline by less than budget authority. For example, outlays would decline by roughly 90 percent if Head Start was eliminated and by roughly 45 percent if budget authority was reduced by 50 percent. Because CBO’s baseline projections of budget authority for discretionary programs reflect the assumption that current appropriations will con-tinue with adjustments for inflation (as described in this chapter’s introduction), uncertainty in the budget authority estimates primarily results from uncertainty in the amount of funding that the Congress will appropri-ate for Head Start in the coming years. A minor amount of additional uncertainty surrounds the rate at which outlays would occur.
Other EffectsThe main argument for this option is that many of the children expected to be enrolled in Head Start in the future would be enrolled in alternative preschool or child care programs (both public and private) if Head Start was eliminated. For example, several states have insti-tuted a universal prekindergarten program with the goal of enrolling all 4-year-olds. Most of the children cur-rently enrolled in Head Start in such states would instead be enrolled in the state-sponsored programs, and their
Discretionary Spending—Option 26 Function 500
Eliminate Head Start
Total
Billions of Dollars 2019 2020 2021 2022 2023 2024 2025 2026 2027 20282019–
20232019–
2028
Change in Spending
Budget authority 0 -10 -11 -11 -11 -11 -11 -12 -12 -12 -42 -101
Outlays 0 -4 -10 -10 -11 -11 -11 -11 -12 -12 -35 -92
This option would take effect in October 2019.
178 OPTIONS FOR REDUCING THE DEFICIT: 2019 TO 2028 DECEMBER 2018
families would probably pay no or only partial tuition. Children in states where such a program was not avail-able could be enrolled in private preschools, although the tuition costs for such programs would most likely exceed those for public programs.
The main argument against this option is that some children from low-income families would not be enrolled in any preschool program if Head Start was eliminated.
Young children who did not attend any program would enter kindergarten less prepared than those who did attend such programs, and research suggests that they might do less well in school and earn less as adults as a result. Consequently, economic growth could be lower in the future if Head Start was eliminated. In addition, eliminating federal subsidies for child care would place an additional burden on some low-income families.
RELATED CBO PUBLICATIONS: “How CBO Analyzes the Economic Effects of Changes in Federal Subsidies for Education and Job Training,” CBO Blog (May 3, 2017), www.cbo.gov/publication/52361; The Macroeconomic and Budgetary Effects of Federal Investment (June 2016), www.cbo.gov/publication/51628
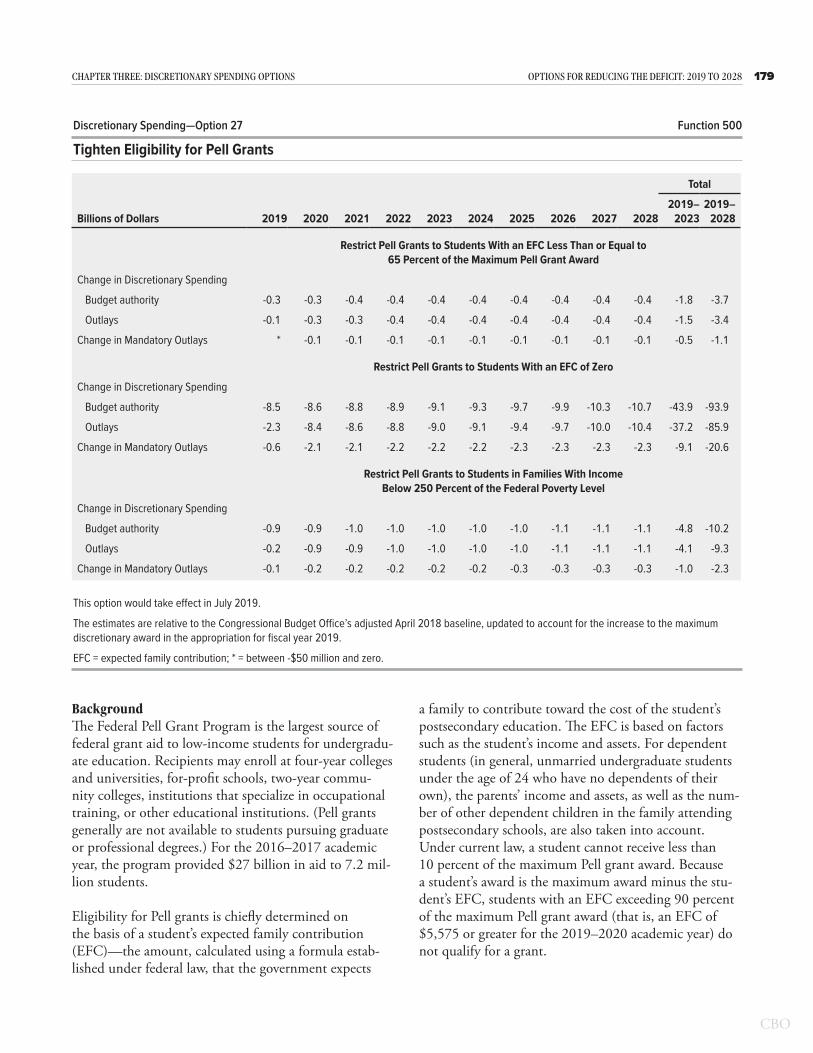
179CHAPTER THREE: DISCRETIONARY SPENDING OPTIONS OPTIONS FOR REDUCING THE DEFICIT: 2019 TO 2028
BackgroundThe Federal Pell Grant Program is the largest source of federal grant aid to low-income students for undergradu-ate education. Recipients may enroll at four-year colleges and universities, for-profit schools, two-year commu-nity colleges, institutions that specialize in occupational training, or other educational institutions. (Pell grants generally are not available to students pursuing graduate or professional degrees.) For the 2016–2017 academic year, the program provided $27 billion in aid to 7.2 mil-lion students.
Eligibility for Pell grants is chiefly determined on the basis of a student’s expected family contribution (EFC)—the amount, calculated using a formula estab-lished under federal law, that the government expects
a family to contribute toward the cost of the student’s postsecondary education. The EFC is based on factors such as the student’s income and assets. For dependent students (in general, unmarried undergraduate students under the age of 24 who have no dependents of their own), the parents’ income and assets, as well as the num-ber of other dependent children in the family attending postsecondary schools, are also taken into account. Under current law, a student cannot receive less than 10 percent of the maximum Pell grant award. Because a student’s award is the maximum award minus the stu-dent’s EFC, students with an EFC exceeding 90 percent of the maximum Pell grant award (that is, an EFC of $5,575 or greater for the 2019–2020 academic year) do not qualify for a grant.
Discretionary Spending—Option 27 Function 500
Tighten Eligibility for Pell Grants
Total
Billions of Dollars 2019 2020 2021 2022 2023 2024 2025 2026 2027 20282019–
20232019–
2028
Restrict Pell Grants to Students With an EFC Less Than or Equal to 65 Percent of the Maximum Pell Grant Award
Change in Discretionary Spending
Budget authority -0.3 -0.3 -0.4 -0.4 -0.4 -0.4 -0.4 -0.4 -0.4 -0.4 -1.8 -3.7
Outlays -0.1 -0.3 -0.3 -0.4 -0.4 -0.4 -0.4 -0.4 -0.4 -0.4 -1.5 -3.4
Change in Mandatory Outlays * -0.1 -0.1 -0.1 -0.1 -0.1 -0.1 -0.1 -0.1 -0.1 -0.5 -1.1
Restrict Pell Grants to Students With an EFC of Zero
Change in Discretionary Spending
Budget authority -8.5 -8.6 -8.8 -8.9 -9.1 -9.3 -9.7 -9.9 -10.3 -10.7 -43.9 -93.9
Outlays -2.3 -8.4 -8.6 -8.8 -9.0 -9.1 -9.4 -9.7 -10.0 -10.4 -37.2 -85.9
Change in Mandatory Outlays -0.6 -2.1 -2.1 -2.2 -2.2 -2.2 -2.3 -2.3 -2.3 -2.3 -9.1 -20.6
Restrict Pell Grants to Students in Families With Income Below 250 Percent of the Federal Poverty Level
Change in Discretionary Spending
Budget authority -0.9 -0.9 -1.0 -1.0 -1.0 -1.0 -1.0 -1.1 -1.1 -1.1 -4.8 -10.2
Outlays -0.2 -0.9 -0.9 -1.0 -1.0 -1.0 -1.0 -1.1 -1.1 -1.1 -4.1 -9.3
Change in Mandatory Outlays -0.1 -0.2 -0.2 -0.2 -0.2 -0.2 -0.3 -0.3 -0.3 -0.3 -1.0 -2.3
This option would take effect in July 2019.
The estimates are relative to the Congressional Budget Office’s adjusted April 2018 baseline, updated to account for the increase to the maximum discretionary award in the appropriation for fiscal year 2019.
EFC = expected family contribution; * = between -$50 million and zero.

180 OPTIONS FOR REDUCING THE DEFICIT: 2019 TO 2028 DECEMBER 2018
Funding for the Pell grant program has both discre-tionary and mandatory components. The discretionary component is the maximum award set in each fiscal year’s appropriation act. For the 2019–2020 academic year, that amount is $5,135 per student. One man-datory component is the funding stemming from the Higher Education Act that is dedicated to supporting the discretionary program. The other mandatory com-ponent is add-on funding that increases the maximum award. For the 2019–2020 award year, that increase is $1,060, resulting in a maximum award of $6,195. The Congressional Budget Office estimates that the average grant for the 2019–2020 academic year will be $4,200.
OptionThis option would tighten eligibility for Pell grants. The option could be implemented in one of three ways, and the savings would depend on the approach taken.
The first two alternatives would lower the EFC thresh-old. Under the first alternative, students with an EFC exceeding 65 percent of the total maximum Pell grant award (that is, an EFC of $4,026 or more for the 2019–2020 academic year) would be ineligible for a Pell grant. Under the second alternative, eligibility would be limited to students whose EFC is zero.
The third alternative would take a different approach, adding a criterion for Pell grant eligibility. To qualify for a grant under this alternative, students would need to be from families whose adjusted gross income is below 250 percent of the federal poverty level (FPL). For a fam-ily of four in 2018, the FPL is $25,100. In that example, Pell grants for the 2019–2020 program year would be limited to students from families of four with income below $62,750.
Effects on the BudgetUnder the first alternative, the number of Pell grant recipients would be about 5 percent lower during the 2019–2028 period, which represents a reduction of about 400,000 people per year, on average. Recipients who no longer qualified for grants under this alterna-tive would have received smaller Pell grants, averaging $1,260 (or less than one-third of the estimated average grant amount under current law). If the maximum discretionary Pell grant award remained at $5,135, this alternative would yield discretionary savings of $3 billion and mandatory savings of $1 billion from 2019 through
2028, CBO estimates, provided that federal appropria-tions were reduced accordingly.
Under the second alternative, the number of Pell grant recipients would be 37 percent lower during the 2019–2028 period, which is a reduction of 3 million people per year, on average. Again, recipients who no longer qualified for grants under this alternative would have received slightly smaller Pell grants, averaging $3,800 (or about 90 percent of the estimated average grant amount under current law). This alternative would yield discre-tionary savings of $86 billion and mandatory savings of $21 billion through 2028, CBO estimates. Although this alternative would reduce the number of Pell grant recipients by about 8 times as much as under the first alternative, the savings would be more than 20 times larger because the average amount granted to affected people under the second alternative is larger.
Under the third alternative, the number of Pell grant recipients would be about 6 percent lower during the 2019–2028 period, which is a reduction of 465,000 peo-ple per year, on average. Recipients who no longer quali-fied for grants under this alternative would have received Pell grants averaging $2,700 (or about 65 percent of the estimated average grant amount under current law). The savings would be larger under this alternative than under the first alternative because the average grant amount among those students is larger. Through 2028, discre-tionary savings would total $9 billion, and mandatory savings would total $2 billion, CBO estimates.
Under current law, the Pell Grant program’s costs and number of recipients are estimated to grow by about 2 percent per year. That growth is somewhat slower than the growth in the total number of students attending postsecondary schools because some students would lose eligibility for Pell grants as their family income grew. Under this option, the distribution of Pell grant applica-tions by EFC, income, and family size would remain sta-ble over the next decade, CBO estimates. To the extent allowed under current law, affected students would com-pensate by borrowing more through the federal student loan program, in CBO’s judgment. (Funding for the Pell grant program is primarily discretionary and, thus, subject to appropriation each year. Therefore, CBO does not show direct spending effects, including student loan effects, for changes specific to the Pell grant program.) The effects on outlays are much smaller in 2019 than in

181CHAPTER THREE: DISCRETIONARY SPENDING OPTIONS OPTIONS FOR REDUCING THE DEFICIT: 2019 TO 2028
other years because the option would take effect in July of that year and the fiscal year ends in September.
Uncertainty about the number of Pell grant recipients is the primary source of uncertainty in CBO’s estimates. The number of recipients is generally affected by eco-nomic factors, including job opportunities, the cost of attending school, and expectations of future opportu-nities for college graduates. The number of Pell grant recipients is also affected by the discretionary maximum award amount, which is set each year.
Other EffectsAn argument for this option, applicable to all three alternatives, is that it would focus federal aid on students who, on the basis of the federally calculated EFC (and the federally calculated FPL in the third alternative), tend to have lower income. Students who would be affected under the first alternative would probably still be able to pay to attend a public two-year college: Tuition and fees at those schools for the 2016–2017 academic year averaged about $3,500, which is below the EFC of students who would be affected under that alternative.
An additional argument, applicable to all three alterna-tives, is that many students affected by the tightening of eligibility criteria for Pell grants would qualify for other financial support. Most students whose EFC was in the affected range under either of the first two alter-natives would be eligible for $3,500 or more in federal loans that are interest-free while students are in school. Furthermore, educational institutions might respond
to the change by shifting some of their own aid to students who would not be eligible under the option. (A few studies suggest that institutions responded to past increases in the size of Pell grants by raising tuition and shifting more of their own aid to students who did not qualify for those grants.)
An argument against all three alternatives is that many Pell grant recipients have educational expenses that greatly exceed the sum of their family’s EFC and other aid (in the form of grants, loans, or work-study pro-grams) from federal, state, institutional, or other sources. In the 2015–2016 academic year, for example, 30 per-cent of students with an EFC above 65 percent of the maximum Pell grant at the time and 85 percent of students with an EFC between zero and 65 percent of the maximum grant incurred educational expenses that exceeded the sum of their family’s EFC and aid other than from Pell grants. Denying Pell grants to those students would further increase the cost of obtaining an undergraduate education and might cause some of them to pursue less postsecondary education or to forgo it altogether. Furthermore, some families may not be able or willing to contribute the EFC amount.
An argument against the third alternative is that high-income families who are eligible for Pell grants on the basis of the EFC formula because they have several children in college at the same time might not qualify on the basis of the FPL formula. Thus, that alterna-tive would limit benefits for some families with several members in college.
RELATED OPTIONS: Mandatory Spending, “Eliminate or Reduce the Add-On to Pell Grants, Which Is Funded With Mandatory Spending” (page 26), “Reduce or Eliminate Subsidized Loans for Undergraduate Students” (page 31); Revenues, “Eliminate Certain Tax Preferences for Education Expenses” (page 244)
RELATED CBO PUBLICATIONS: Federal Aid for Postsecondary Students (June 2018), www.cbo.gov/publication/53736; Distribution of Federal Support for Students Pursuing Higher Education in 2016 (June 2018), www.cbo.gov/publication/53732; The Pell Grant Program: Recent Growth and Policy Options (September 2013), www.cbo.gov/publication/44448; Options to Change Interest Rates and Other Terms on Student Loans (June 2013), www.cbo.gov/publication/44318
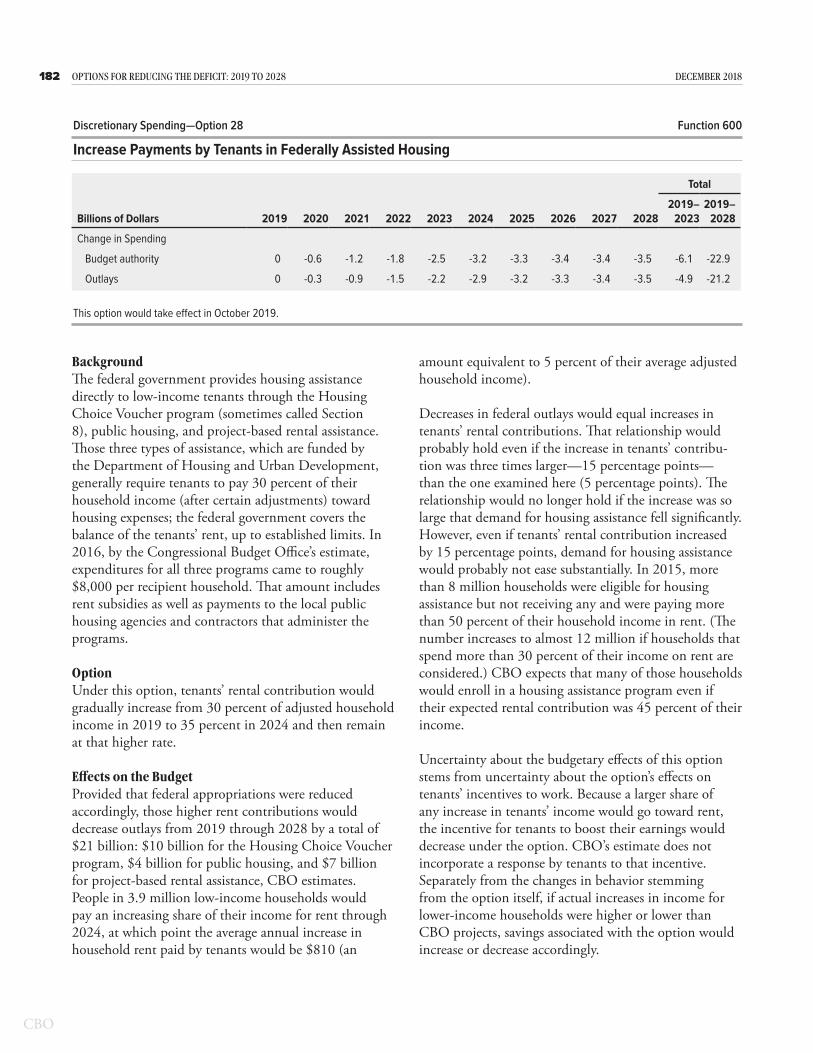
182 OPTIONS FOR REDUCING THE DEFICIT: 2019 TO 2028 DECEMBER 2018
BackgroundThe federal government provides housing assistance directly to low-income tenants through the Housing Choice Voucher program (sometimes called Section 8), public housing, and project-based rental assistance. Those three types of assistance, which are funded by the Department of Housing and Urban Development, generally require tenants to pay 30 percent of their household income (after certain adjustments) toward housing expenses; the federal government covers the balance of the tenants’ rent, up to established limits. In 2016, by the Congressional Budget Office’s estimate, expenditures for all three programs came to roughly $8,000 per recipient household. That amount includes rent subsidies as well as payments to the local public housing agencies and contractors that administer the programs.
OptionUnder this option, tenants’ rental contribution would gradually increase from 30 percent of adjusted household income in 2019 to 35 percent in 2024 and then remain at that higher rate.
Effects on the BudgetProvided that federal appropriations were reduced accordingly, those higher rent contributions would decrease outlays from 2019 through 2028 by a total of $21 billion: $10 billion for the Housing Choice Voucher program, $4 billion for public housing, and $7 billion for project-based rental assistance, CBO estimates. People in 3.9 million low-income households would pay an increasing share of their income for rent through 2024, at which point the average annual increase in household rent paid by tenants would be $810 (an
amount equivalent to 5 percent of their average adjusted household income).
Decreases in federal outlays would equal increases in tenants’ rental contributions. That relationship would probably hold even if the increase in tenants’ contribu-tion was three times larger—15 percentage points—than the one examined here (5 percentage points). The relationship would no longer hold if the increase was so large that demand for housing assistance fell significantly. However, even if tenants’ rental contribution increased by 15 percentage points, demand for housing assistance would probably not ease substantially. In 2015, more than 8 million households were eligible for housing assistance but not receiving any and were paying more than 50 percent of their household income in rent. (The number increases to almost 12 million if households that spend more than 30 percent of their income on rent are considered.) CBO expects that many of those households would enroll in a housing assistance program even if their expected rental contribution was 45 percent of their income.
Uncertainty about the budgetary effects of this option stems from uncertainty about the option’s effects on tenants’ incentives to work. Because a larger share of any increase in tenants’ income would go toward rent, the incentive for tenants to boost their earnings would decrease under the option. CBO’s estimate does not incorporate a response by tenants to that incentive. Separately from the changes in behavior stemming from the option itself, if actual increases in income for lower-income households were higher or lower than CBO projects, savings associated with the option would increase or decrease accordingly.
Discretionary Spending—Option 28 Function 600
Increase Payments by Tenants in Federally Assisted Housing
Total
Billions of Dollars 2019 2020 2021 2022 2023 2024 2025 2026 2027 20282019–
20232019–
2028
Change in Spending
Budget authority 0 -0.6 -1.2 -1.8 -2.5 -3.2 -3.3 -3.4 -3.4 -3.5 -6.1 -22.9
Outlays 0 -0.3 -0.9 -1.5 -2.2 -2.9 -3.2 -3.3 -3.4 -3.5 -4.9 -21.2
This option would take effect in October 2019.

183CHAPTER THREE: DISCRETIONARY SPENDING OPTIONS OPTIONS FOR REDUCING THE DEFICIT: 2019 TO 2028
Other EffectsOne argument for this option is that even if tenants’ required rental contribution was increased to 35 percent of their income, that share might still be lower than the share of income paid by their counterparts who do not receive housing assistance.
An argument against implementing this option is that assisted renters would have less money to purchase other necessary goods and services, such as food, health care, and transportation. In addition, by increasing the proportion of income that tenants are required to pay for rent, the option would reduce the incentive for partici-pants to boost their income.
RELATED OPTIONS: Discretionary Spending, “Reduce Funding for the Housing Choice Voucher Program or Eliminate the Program” (page 184); Revenues, “Repeal the Low-Income Housing Tax Credit” (page 276)
RELATED CBO PUBLICATIONS: Federal Housing Assistance for Low-Income Households (September 2015), www.cbo.gov/publication/50782; Growth in Means-Tested Programs and Tax Credits for Low-Income Households (February 2013), www.cbo.gov/publication/43934; An Overview of Federal Support for Housing (November 2009), www.cbo.gov/publication/41219
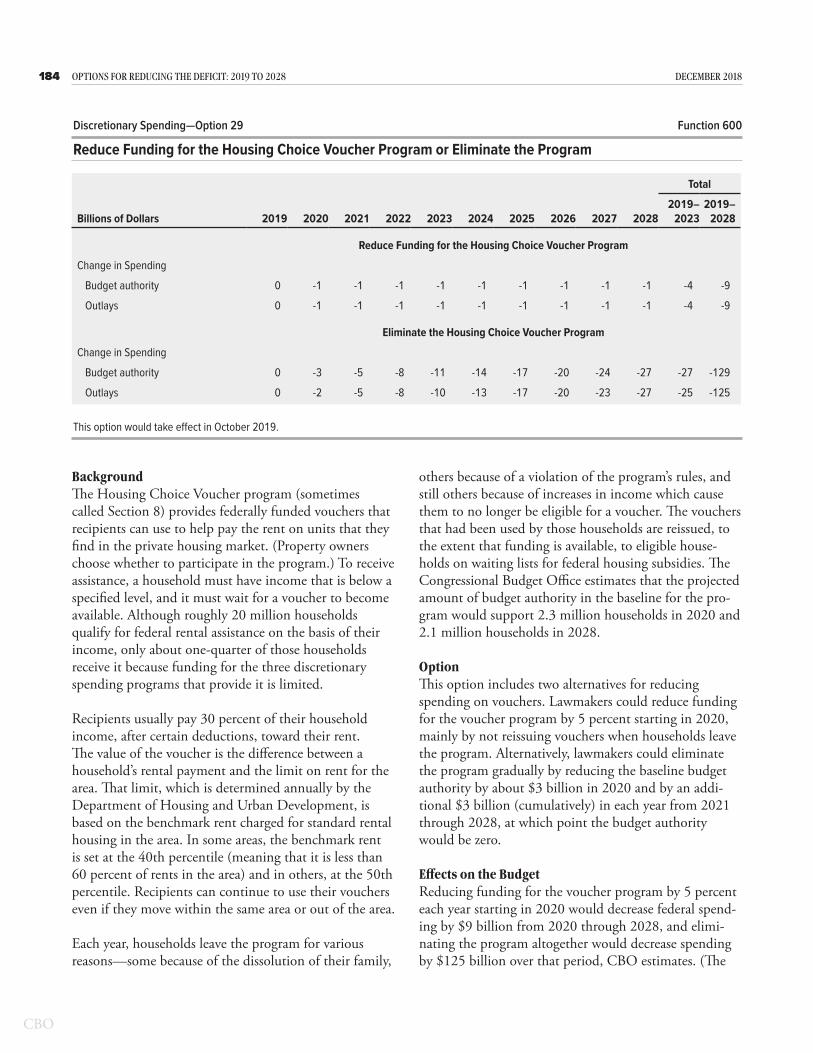
184 OPTIONS FOR REDUCING THE DEFICIT: 2019 TO 2028 DECEMBER 2018
BackgroundThe Housing Choice Voucher program (sometimes called Section 8) provides federally funded vouchers that recipients can use to help pay the rent on units that they find in the private housing market. (Property owners choose whether to participate in the program.) To receive assistance, a household must have income that is below a specified level, and it must wait for a voucher to become available. Although roughly 20 million households qualify for federal rental assistance on the basis of their income, only about one-quarter of those households receive it because funding for the three discretionary spending programs that provide it is limited.
Recipients usually pay 30 percent of their household income, after certain deductions, toward their rent. The value of the voucher is the difference between a household’s rental payment and the limit on rent for the area. That limit, which is determined annually by the Department of Housing and Urban Development, is based on the benchmark rent charged for standard rental housing in the area. In some areas, the benchmark rent is set at the 40th percentile (meaning that it is less than 60 percent of rents in the area) and in others, at the 50th percentile. Recipients can continue to use their vouchers even if they move within the same area or out of the area.
Each year, households leave the program for various reasons—some because of the dissolution of their family,
others because of a violation of the program’s rules, and still others because of increases in income which cause them to no longer be eligible for a voucher. The vouchers that had been used by those households are reissued, to the extent that funding is available, to eligible house-holds on waiting lists for federal housing subsidies. The Congressional Budget Office estimates that the projected amount of budget authority in the baseline for the pro-gram would support 2.3 million households in 2020 and 2.1 million households in 2028.
OptionThis option includes two alternatives for reducing spending on vouchers. Lawmakers could reduce funding for the voucher program by 5 percent starting in 2020, mainly by not reissuing vouchers when households leave the program. Alternatively, lawmakers could eliminate the program gradually by reducing the baseline budget authority by about $3 billion in 2020 and by an addi-tional $3 billion (cumulatively) in each year from 2021 through 2028, at which point the budget authority would be zero.
Effects on the BudgetReducing funding for the voucher program by 5 percent each year starting in 2020 would decrease federal spend-ing by $9 billion from 2020 through 2028, and elimi-nating the program altogether would decrease spending by $125 billion over that period, CBO estimates. (The
Discretionary Spending—Option 29 Function 600
Reduce Funding for the Housing Choice Voucher Program or Eliminate the Program
Total
Billions of Dollars 2019 2020 2021 2022 2023 2024 2025 2026 2027 20282019–
20232019–
2028
Reduce Funding for the Housing Choice Voucher Program
Change in Spending
Budget authority 0 -1 -1 -1 -1 -1 -1 -1 -1 -1 -4 -9
Outlays 0 -1 -1 -1 -1 -1 -1 -1 -1 -1 -4 -9
Eliminate the Housing Choice Voucher Program
Change in Spending
Budget authority 0 -3 -5 -8 -11 -14 -17 -20 -24 -27 -27 -129
Outlays 0 -2 -5 -8 -10 -13 -17 -20 -23 -27 -25 -125
This option would take effect in October 2019.

185CHAPTER THREE: DISCRETIONARY SPENDING OPTIONS OPTIONS FOR REDUCING THE DEFICIT: 2019 TO 2028
federal government will spend $9,400 per year, on aver-age, for each household that receives a voucher in 2019, CBO estimates.) Reducing funding for the program by 5 percent in 2020 would result in about 115,000 fewer households receiving housing assistance from the federal government, in CBO’s estimation. Eliminating the program would leave about 2.2 million households, cor-responding to about 5 million people, without housing assistance from the federal government in 2028.
Decreases in federal outlays associated with reducing funding for the voucher program by 5 percent start-ing in 2020 reflect CBO’s assumption that spending would decline in accordance with historical patterns. The Congress generally provides a portion of the fund-ing for the program a year in advance; consequently, CBO assumes that some of the reduction in budget authority would not result in lower outlays until the following year. Decreases in federal outlays associated with eliminating the housing choice voucher program reflect CBO’s assumption that budget authority for the program would be eliminated over nine years and that spending would fall accordingly.
Uncertainty about the budgetary effects of reducing funding for or eliminating the housing choice voucher program stems from uncertainty about whether actual appropriations would match CBO’s baseline projections. The budget authority for the option is based on CBO’s baseline projection of discretionary budget authority, which starts with the most recently appropriated amount and then grows with inflation.
Other EffectsAn argument in support of reducing funding for the voucher program by 5 percent is that no one would lose
assistance as a direct result of such a reduction. That is because the reduction in the number of vouchers that it would require would be less than the number of house-holds that CBO expects to leave the program in a given year. In 2017, for example, about 190,000 voucher- subsidized households (or about 8 percent of participat-ing households) left the program.
One argument in support of eliminating the voucher program entirely is that providing assistance to some households through the program is unfair to other households that qualify for federally assisted rental hous-ing but do not receive assistance. (That number is three times as large as the number of households that receive assistance from those programs.) Unassisted households must pay their own rent in full, and at least four-fifths of those households spend more than 30 percent of their income on rent.
An argument against reducing funding for the program is that doing so would lengthen the time that eligible but unassisted households would have to wait to receive assis-tance. In 2017, the households that were added to the voucher program had been waiting for 32 months, on average. That number probably understates the amount of time that households have to wait for assistance because many waiting lists are periodically closed to new applicants.
An argument against eliminating the voucher program entirely is that doing so would probably increase over-crowding and homelessness. Under that alternative, about 2 million households that would receive vouchers in 2028 under current law would no longer receive hous-ing assistance.
RELATED OPTIONS: Discretionary Spending, “Increase Payments by Tenants in Federally Assisted Housing” (page 182); Revenues, “Repeal the Low-Income Housing Tax Credit” (page 276)
RELATED CBO PUBLICATIONS: Federal Housing Assistance for Low-Income Households (September 2015), www.cbo.gov/publication/50782; Growth in Means-Tested Programs and Tax Credits for Low-Income Households (February 2013), www.cbo.gov/publication/43934; An Overview of Federal Support for Housing (November 2009), www.cbo.gov/publication/41219
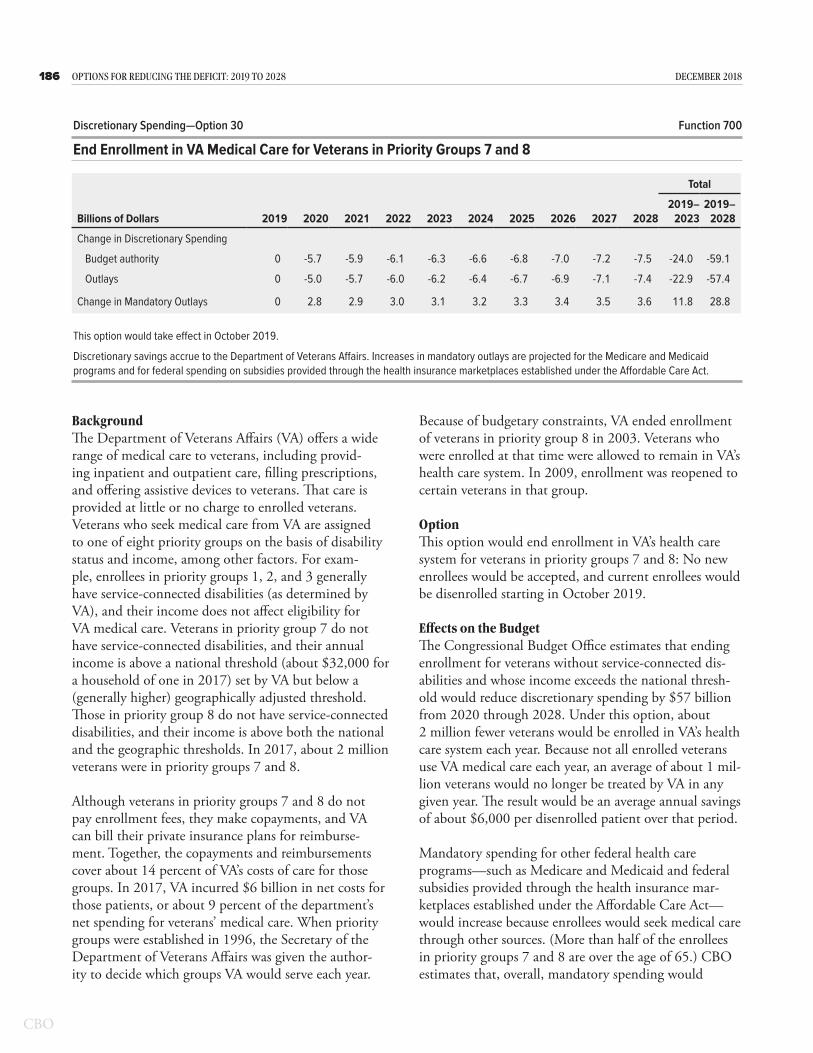
186 OPTIONS FOR REDUCING THE DEFICIT: 2019 TO 2028 DECEMBER 2018
BackgroundThe Department of Veterans Affairs (VA) offers a wide range of medical care to veterans, including provid-ing inpatient and outpatient care, filling prescriptions, and offering assistive devices to veterans. That care is provided at little or no charge to enrolled veterans. Veterans who seek medical care from VA are assigned to one of eight priority groups on the basis of disability status and income, among other factors. For exam-ple, enrollees in priority groups 1, 2, and 3 generally have service-connected disabilities (as determined by VA), and their income does not affect eligibility for VA medical care. Veterans in priority group 7 do not have service-connected disabilities, and their annual income is above a national threshold (about $32,000 for a household of one in 2017) set by VA but below a (generally higher) geographically adjusted threshold. Those in priority group 8 do not have service-connected disabilities, and their income is above both the national and the geographic thresholds. In 2017, about 2 million veterans were in priority groups 7 and 8.
Although veterans in priority groups 7 and 8 do not pay enrollment fees, they make copayments, and VA can bill their private insurance plans for reimburse-ment. Together, the copayments and reimbursements cover about 14 percent of VA’s costs of care for those groups. In 2017, VA incurred $6 billion in net costs for those patients, or about 9 percent of the department’s net spending for veterans’ medical care. When priority groups were established in 1996, the Secretary of the Department of Veterans Affairs was given the author-ity to decide which groups VA would serve each year.
Because of budgetary constraints, VA ended enrollment of veterans in priority group 8 in 2003. Veterans who were enrolled at that time were allowed to remain in VA’s health care system. In 2009, enrollment was reopened to certain veterans in that group.
OptionThis option would end enrollment in VA’s health care system for veterans in priority groups 7 and 8: No new enrollees would be accepted, and current enrollees would be disenrolled starting in October 2019.
Effects on the BudgetThe Congressional Budget Office estimates that ending enrollment for veterans without service-connected dis-abilities and whose income exceeds the national thresh-old would reduce discretionary spending by $57 billion from 2020 through 2028. Under this option, about 2 million fewer veterans would be enrolled in VA’s health care system each year. Because not all enrolled veterans use VA medical care each year, an average of about 1 mil-lion veterans would no longer be treated by VA in any given year. The result would be an average annual savings of about $6,000 per disenrolled patient over that period.
Mandatory spending for other federal health care programs—such as Medicare and Medicaid and federal subsidies provided through the health insurance mar-ketplaces established under the Affordable Care Act—would increase because enrollees would seek medical care through other sources. (More than half of the enrollees in priority groups 7 and 8 are over the age of 65.) CBO estimates that, overall, mandatory spending would
Discretionary Spending—Option 30 Function 700
End Enrollment in VA Medical Care for Veterans in Priority Groups 7 and 8
Total
Billions of Dollars 2019 2020 2021 2022 2023 2024 2025 2026 2027 20282019–
20232019–
2028
Change in Discretionary Spending
Budget authority 0 -5.7 -5.9 -6.1 -6.3 -6.6 -6.8 -7.0 -7.2 -7.5 -24.0 -59.1
Outlays 0 -5.0 -5.7 -6.0 -6.2 -6.4 -6.7 -6.9 -7.1 -7.4 -22.9 -57.4
Change in Mandatory Outlays 0 2.8 2.9 3.0 3.1 3.2 3.3 3.4 3.5 3.6 11.8 28.8
This option would take effect in October 2019.
Discretionary savings accrue to the Department of Veterans Affairs. Increases in mandatory outlays are projected for the Medicare and Medicaid programs and for federal spending on subsidies provided through the health insurance marketplaces established under the Affordable Care Act.

187CHAPTER THREE: DISCRETIONARY SPENDING OPTIONS OPTIONS FOR REDUCING THE DEFICIT: 2019 TO 2028
rise by $29 billion between 2020 and 2028 under this option.
The greatest sources of uncertainty in this estimate of savings over the next 10 years are CBO’s estimates of the number of veterans affected by the option and how their reliance on other forms of health care might change. Under current law, enrollees in priority groups 7 and 8 receive nearly 20 percent of their medical care from VA. As the health care delivery and insurance markets evolve over the projection period, that pattern of reliance might change.
Other EffectsAn advantage of this option is that VA could focus on veterans with the greatest service-connected medical
needs and the fewest financial resources. In 2017, nearly 90 percent of enrollees in priority groups 7 and 8 had other health care coverage, mostly through Medicare or private health insurance. As a result, the vast majority of veterans who would lose access to VA health care would have other sources of coverage, including the health insurance marketplaces.
A disadvantage of the option is that veterans in prior-ity groups 7 and 8 who have come to rely on VA, even in part, might find their health care disrupted. Some veterans—particularly those with income just above the thresholds—might find it difficult to obtain other care.
RELATED CBO PUBLICATIONS: Comparing the Costs of the Veterans’ Health Care System With Private-Sector Costs (December 2014), www.cbo.gov/publication/49763; testimony of Heidi L.W. Golding, Principal Analyst for Military and Veterans’ Compensation, before the Senate Committee on Veterans’ Affairs, Potential Costs of Health Care for Veterans of Recent and Ongoing U.S. Military Operations (July 27, 2011), www.cbo.gov/publication/41585; Potential Costs of Veterans’ Health Care (October 2010), www.cbo.gov/publication/21773

188 OPTIONS FOR REDUCING THE DEFICIT: 2019 TO 2028 DECEMBER 2018
BackgroundUnder the Federal Employees Pay Comparability Act of 1990 (FEPCA), most federal civilian employees receive a pay adjustment each January. As specified by that law, the size of the adjustment is set at the annual rate of increase in the employment cost index (ECI) for wages and salaries of workers in private industry minus 0.5 percentage points. The across-the-board increase as spelled out in FEPCA does not, however, always occur. The President can limit the size of the increase if he or she determines that a national emergency exists or that serious economic conditions call for such action. Similarly, the Congress can authorize an adjustment that differs from the one sought by the President. In each year since 2011, policymakers have either lowered the annual across-the-board adjustment for federal employ-ees below the percentage specified in FEPCA or canceled it altogether.
OptionThis option would reduce the annual across-the-board adjustment specified in FEPCA by 0.5 percentage points. From 2020 through 2028, the adjustment would equal the growth rate in the ECI minus 1 percentage point. If the growth rate for the ECI is less than 1 percent, which has not occurred during the 27 years the index has been recorded, then no across-the-board adjustment would be granted for that year.
Effects on the BudgetProvided that federal appropriations were reduced accordingly, federal outlays would decline by $58 billion from 2020 through 2028, the Congressional Budget Office estimates. Outlays would fall by $800 million in 2020, and the reduction would grow to $13 billion in 2028. The growth in the annual savings is a result of
the smaller pay raises accumulating over time; by 2028, federal employees’ pay would be 4 percent lower under this option than it would be otherwise.
The largest source of uncertainty in the estimate of savings over the next 10 years is the projected size of the federal civilian workforce. Over the past 20 years, the federal workforce has fluctuated between 1.8 mil-lion employees (in calendar year 2001) and 2.3 million employees (in calendar year 2010). Another source of uncertainty in the projected savings stems from the timing of retirement for eligible employees. If a signifi-cant number of retirement-eligible federal workers decide to retire as a result of the smaller increases in pay, then larger retirement costs could boost mandatory spending, which would offset some of the savings in compensation produced under this option. (CBO has not formally estimated the magnitude of those costs, but preliminary research indicates that they would offset only a small portion of the savings.)
For alternative approaches that would reduce the across-the-board adjustment by more than 0.5 percentage points, a couple of considerations could factor more heavily into the estimated savings. First, the increase in mandatory spending from workers’ retiring earlier could become substantial. That is because the growth of future annuity payments is based on salary growth for employ-ees who continue to work; for retirees age 62 or older, however, that calculation is based on the consumer price index. Thus, large cuts to the across-the-board adjust-ment would cause additional years of service to reduce the size of workers’ future annuity payments, which could prompt many of those workers to retire instead of continuing to work. Second, the option includes the stipulation that it would not result in across-the-board
Discretionary Spending—Option 31 Multiple Functions
Reduce the Annual Across-the-Board Adjustment for Federal Civilian Employees’ Pay
Total
Billions of Dollars 2019 2020 2021 2022 2023 2024 2025 2026 2027 20282019–
20232019–
2028
Change in Spending
Budget authority 0 -0.9 -2.1 -3.4 -4.8 -6.3 -7.8 -9.4 -11.1 -13.0 -11.2 -58.7
Outlays 0 -0.8 -2.1 -3.4 -4.7 -6.2 -7.7 -9.4 -11.1 -12.9 -11.0 -58.2
This option would take effect in January 2020.
189CHAPTER THREE: DISCRETIONARY SPENDING OPTIONS OPTIONS FOR REDUCING THE DEFICIT: 2019 TO 2028
adjustments that reduced salaries, because research indi-cates that workers are very averse to such reductions. In CBO’s estimation, that stipulation would not affect the savings for this option, but it could reduce the savings from alternative approaches that imposed larger reduc-tions to the across-the-board adjustment.
Other EffectsCompensation for federal civilian employees constitutes about 18 percent of discretionary spending. One argu-ment for this option is that reducing the annual across-the-board adjustment is a relatively straightforward way to substantially cut spending across agencies. In addition, those cuts may not significantly affect the agencies’ ability to retain employees for the roughly 40 percent of jobs that do not require a bachelor’s degree because those employees would probably still receive higher
compensation than similar workers in the private-sector earn, on average.
An argument against this option is that it could make it more difficult for the federal government to recruit and retain qualified employees, especially for agencies that require workers with advanced degrees and profes-sional skills. Recent research suggests that smaller salary increases have led to fewer employees continuing to work for the federal government. Other research suggests that federal workers with professional and advanced degrees are paid less than their private-sector counterparts. Thus, smaller across-the-board adjustments in federal pay would widen the gap in compensation between federal and private-sector workers for jobs that require more education.
RELATED OPTION: Discretionary Spending, “Reduce the Size of the Federal Workforce Through Attrition” (page 190)
RELATED CBO PUBLICATIONS: Justin Falk and Nadia Karamcheva, Comparing the Effects of Current Pay and Defined Benefit Pensions on Employee Retention, Working Paper 2018-06 (June 2018), www.cbo.gov/publication/54056; Comparing the Compensation of Federal and Private-Sector Employees, 2011 to 2015 (April 2017), www.cbo.gov/publication/52637; Analysis of Federal Civilian and Military Compensation (January 2011), www.cbo.gov/publication/22002

190 OPTIONS FOR REDUCING THE DEFICIT: 2019 TO 2028 DECEMBER 2018
BackgroundIn 2017, the federal government employed about 2.1 million civilian workers, excluding Postal Service employees. About 43 percent worked in the Department of Defense or Department of Homeland Security, and roughly 17 percent were employed by the Department of Veterans Affairs. The rest worked in agencies that pro-vide a variety of public services—regulating businesses, investigating crimes, collecting taxes, and administering programs for the elderly, poor, and disabled, for example. The largest costs that the federal government incurs for its civilian employees are for salaries, future retirement benefits, and health insurance.
OptionThis option would prohibit selected federal agencies from hiring more than one employee for every two workers who leave, until the number of federal civilian employ-ees at agencies the President allowed to be affected was reduced by 10 percent. Agencies would be limited in their ability to replace those employees with contrac-tors or to increase compensation for new hires because their appropriations would be decreased accordingly. The President would be allowed to exclude an agency from the requirement to replace every two workers with one worker under certain conditions—because of a national security concern or an extraordinary emergency, for instance, or if the performance of a critical mission required doing so.
Effects on the BudgetThis option would reduce the deficit by $35 billion from 2019 through 2028, the Congressional Budget Office estimates. CBO arrived at that figure by combining estimates of the reduction in hiring with estimates of the average cost of compensating a hire. About two-thirds of
the federal civilian workforce would be exempt from the requirement, in CBO’s estimation, leaving an affected workforce of about 700,000 and a total reduction in that workforce of about 70,000. Given recent rates of employee turnover, the government would reach that total by hiring about 21,000 fewer employees in each year through 2022 and about 6,000 fewer employees in 2023. By the end of 2020, CBO expects, the average cost of compensating an employee would be about $72,000 for his or her first full year of employment. Thus, if employees are hired at roughly the same rate throughout the year, the amount spent on them would be reduced by about $800 million in the first year after enactment of this or a similar option. The deficit would fall by a smaller amount—$600 million—because about one-fifth of employees are paid from fees their agency collects for providing certain services, such as customs fees and patent registration fees. CBO expects that decreasing the number of people providing those services would reduce those collections by an equal amount. By 2028, the reduction in the deficit would grow to $5.3 billion as the effects of reduced hiring on the size of the workforce accumulated.
A large source of uncertainty in this option’s estimate of savings over the next 10 years is CBO’s estimate of the portion of workers who would be exempt from this requirement. To determine that number, CBO examined data from the two most recent government shutdowns. On the basis of the number of employees who continued working during those shutdowns, CBO estimates that about two-thirds of the federal civilian workforce would be exempt from this requirement. However, it is unclear whether the President would respond to this option the way past Presidents responded to temporary shutdowns.
Discretionary Spending—Option 32 Multiple Functions
Reduce the Size of the Federal Workforce Through Attrition
Total
Billions of Dollars 2019 2020 2021 2022 2023 2024 2025 2026 2027 20282019–
20232019–
2028
Change in Spending
Budget authority 0 -0.6 -2.0 -3.4 -4.3 -4.7 -4.9 -5.0 -5.2 -5.3 -10.3 -35.4
Outlays 0 -0.6 -1.9 -3.3 -4.3 -4.7 -4.8 -5.0 -5.2 -5.3 -10.2 -35.2
This option would take effect in October 2019.

191CHAPTER THREE: DISCRETIONARY SPENDING OPTIONS OPTIONS FOR REDUCING THE DEFICIT: 2019 TO 2028
A second large source of uncertainty is the portion of nonexempt workers whose compensation is provided from agency collections. Depending on which agencies the President chose to exempt from this requirement, the fraction of the reduction in budgetary authority that represented a decrease in offsetting collections would vary. That is because the employees whose compensation is funded by such collections are unevenly spread across agencies.
Alternative approaches that set more or less stringent limits on the fraction of departing workers that agencies could replace might lead to the President’s exempting more or fewer agencies from the limit. For example, the savings from a hiring freeze (in which case agencies are not allowed to hire any employees for every two who leave) would be less than twice the savings generated by this option if the freeze constrained the ability of more agencies to perform critical missions.
Other EffectsAn argument for this option is that some agencies could continue to provide crucial services with a smaller work-force by operating more efficiently and by eliminating services that are not cost-effective. The number of man-agement and supervisory positions has increased in many agencies as the workforce has aged, and research suggests that, in some cases, the additional layers of management hamper performance. This option could encourage agen-cies to reduce the number of managers and supervisors through attrition as people in those positions retire over the next few years. Research also suggests that federal
workers in the roughly 40 percent of jobs that do not require a college degree earn more than their counter-parts in the private sector. If private-sector compensation is indicative of the value of those positions, then the savings generated by trimming that part of the workforce would exceed the value of the services that those jobs produce.
An argument against this option is that trends in federal employment suggest that the federal workforce might already be under strain from previous cost-cutting measures and that further reductions could impair the government’s ability to fulfill parts of its mission. The federal civilian workforce has grown little over the past 20 years, whereas both the number of people the gov-ernment serves (as measured by the population of the United States) and federal spending per person have grown substantially. Moreover, the workforce at most agencies has shrunk, and the modest growth in the total number of federal civilian employees largely reflects hiring for the Department of Homeland Security (which was established in 2002) and the Department of Veterans Affairs (which increased the volume of services it pro-vides to veterans). Workforce reductions at those or other agencies would probably reduce the quality and quantity of some of the services provided and could have other negative effects, such as increasing the amount of fraud and abuse in some government programs. Lastly, because this option would be phased in as workers left their posi-tions, federal agencies would have little control over the timing of the workforce reductions.
RELATED OPTION: Discretionary Spending, “Reduce the Annual Across-the-Board Adjustment for Federal Civilian Employees’ Pay” (page 188)
RELATED CBO PUBLICATION: Comparing the Compensation of Federal and Private-Sector Employees, 2011 to 2015 (April 2017), www.cbo.gov/publication/52637

192 OPTIONS FOR REDUCING THE DEFICIT: 2019 TO 2028 DECEMBER 2018
Discretionary Spending—Option 33 Multiple Functions
Reduce Funding for Certain Grants to State and Local Governments
Total
Billions of Dollars 2019 2020 2021 2022 2023 2024 2025 2026 2027 20282019–
20232019–
2028
Reduce Department of Energy Grants for Energy Conservation and Weatherization
Change in Spending
Budget authority 0 -0.1 -0.2 -0.2 -0.2 -0.2 -0.2 -0.2 -0.2 -0.2 -0.6 -1.5
Outlays 0 * -0.1 -0.1 -0.1 -0.2 -0.2 -0.2 -0.2 -0.2 -0.3 -1.2
Reduce Environmental Protection Agency Funding for
Wastewater and Drinking Water Infrastructure and Other Grants
Change in Spending
Budget authority 0 -0.9 -1.8 -1.9 -1.9 -1.9 -2.0 -2.1 -2.1 -2.2 -6.4 -16.7
Outlays 0 -0.1 -0.7 -1.4 -1.8 -1.9 -1.9 -2.0 -2.0 -2.1 -4.0 -14.0
Reduce Department of Housing and Urban Development Funding for
Community Development Block Grants
Change in Spending
Budget authority 0 -0.8 -1.6 -1.7 -1.7 -1.7 -1.8 -1.8 -1.8 -1.9 -5.8 -14.8
Outlays 0 * -0.2 -0.7 -1.3 -1.6 -1.7 -1.7 -1.8 -1.8 -2.2 -10.7
Reduce Funding for Certain Department of Education Grants
Change in Spending
Budget authority 0 -0.4 -0.7 -0.8 -0.8 -0.8 -0.8 -0.8 -0.8 -0.9 -2.6 -6.8
Outlays 0 * -0.2 -0.6 -0.7 -0.8 -0.8 -0.8 -0.8 -0.8 -1.5 -5.5
Reduce Funding for Certain Department of Justice Grants
Change in Spending
Budget authority 0 -0.7 -1.5 -1.5 -1.5 -1.6 -1.6 -1.6 -1.7 -1.7 -5.2 -13.4
Outlays 0 -0.1 -0.5 -0.9 -1.2 -1.4 -1.5 -1.6 -1.6 -1.6 -2.7 -10.5
Total
Change in Spending
Budget authority 0 -2.8 -5.8 -5.9 -6.1 -6.2 -6.4 -6.5 -6.7 -6.8 -20.7 -53.2
Outlays 0 -0.3 -1.7 -3.7 -5.1 -5.8 -6.1 -6.2 -6.4 -6.5 -10.8 -41.9
This option would take effect in October 2019.
* = between -$50 million and zero.
BackgroundThe federal government provided $675 billion in grants to state and local governments in 2017. Those grants redistribute resources among communities around the country, finance local projects that may have national benefits, encourage policy experimentation by state and local governments, and promote national priorities.
Although federal grants to state and local governments fund a wide variety of programs, spending is con-centrated in the areas of health care, income security, education, the environment, and transportation. The conditions that accompany those federal funds vary substantially: Some grant programs give state and local
193CHAPTER THREE: DISCRETIONARY SPENDING OPTIONS OPTIONS FOR REDUCING THE DEFICIT: 2019 TO 2028
governments broad flexibility in spending federal funds, whereas others impose more stringent conditions.
OptionThis option would reduce funding for a group of grants by 50 percent over two years. New funding would be decreased by 25 percent in 2020 and by 50 percent for the remaining years through 2028. (The grants are illustrative of those made by the federal government to state and local governments.) The option includes several changes that could be implemented individually or together. Those changes would reduce funding for the following programs:
• The Department of Energy’s grants for energy conservation and weatherization through the Weatherization and Intergovernmental Programs Office.
• The Environmental Protection Agency’s (EPA’s) grants for wastewater and drinking water infrastructure, as well as other grants that help states implement federal water, air, waste, and chemical programs.
• The Department of Housing and Urban Development’s Community Development Block Grant (CDBG) program.
• Certain Department of Education grants, like those for the 21st Century Community Learning Centers, which fund nonacademic programs that address the physical, emotional, and social well-being of students.
• Certain Department of Justice grants to nonprofit community organizations and state and local law enforcement agencies. Those grants include State and Local Law Enforcement Assistance programs, Juvenile Justice Programs, Community Oriented Policing Services grants, and grants administered through the Office on Violence Against Women.
More details on the individual grant programs appear in similar options presented in the Congressional Budget Office’s March 2011 version of this report.
Effects on the BudgetIf all of those reductions were put in place, federal spend-ing would decline by $42 billion from 2020 through
2028, provided that federal appropriations were reduced accordingly. During the 10-year budget period, outlays would decline by less than budget authority because some spending for grant programs occurs in years after the year in which it is authorized. Grants made through the CDBG program are used by state and local govern-ments over eight years, for example, the longest period for this group of grants. (More than 90 percent of those CDBG outlays occur within four years of funding.) EPA’s grants for wastewater and drinking water infra-structure and the Department of Education’s grants have the shortest spending period in this group, with outlays completed over the four years following funding.
If budget authority for this group of programs was reduced by more or less than 50 percent, a proportionate reduction in outlays would probably result. However, eliminating the programs completely would probably impose shutdown costs that would limit savings in the near term.
Relatively little uncertainty surrounds this option’s esti-mated savings relative to CBO’s baselines for the pro-grams. (The formula block grants provided in the CDBG program, for example, are spent slowly but predictably.) Uncertainty about how actual appropriations will com-pare with CBO’s baseline projections contributes to the overall uncertainty about this estimate, however.
Other EffectsThe main argument for this option is that the concerns addressed by those grant programs are primarily local, so allowing state and local governments to decide whether to continue to pay for the programs would probably lead to a more efficient allocation of resources. According to that reasoning, if state and local governments had to bear the full costs of those activities, they might be more careful in weighing those costs against potential benefits when making spending decisions. In addition, federal funding might not always provide a net increase in spending for those activities because state and local governments might reduce their own funding of such programs in response to the availability of federal funds.
One argument against this option is that those grants support programs that the federal government priori-tizes but that state and local governments may lack the incentive or funding to promote to the extent desirable from a national perspective. In fact, many state and local

194 OPTIONS FOR REDUCING THE DEFICIT: 2019 TO 2028 DECEMBER 2018
governments face fiscal constraints that might make it difficult for them to compensate for the loss of federal funds. In addition, reducing funding for grants that redistribute resources across jurisdictions could lead to more persistent inequities among communities or
individuals. Less federal support could also limit the fed-eral government’s ability to encourage experimentation and innovation at the state and local levels and to learn from the different approaches taken to address a given policy issue.
RELATED CBO PUBLICATION: Federal Grants to State and Local Governments (March 2013), www.cbo.gov/publication/43967

195CHAPTER THREE: DISCRETIONARY SPENDING OPTIONS OPTIONS FOR REDUCING THE DEFICIT: 2019 TO 2028
BackgroundSince 1935, the Davis-Bacon Act has required that work-ers on all federally funded or federally assisted construc-tion projects whose contracts total more than $2,000 be paid no less than the prevailing wages in the area where the project is located. (A federally assisted construction project is paid for in whole or in part with funds pro-vided by the federal government or borrowed using the credit of the federal government.) The Department of Labor determines prevailing wages on the basis of the wages and benefits earned by at least 50 percent of the workers doing a particular type of job or on the basis of the average wages and benefits paid to workers perform-ing that type of job.
OptionThis option would repeal the Davis-Bacon Act and reduce appropriations accordingly. The government’s authority to enter into obligations for certain transporta-tion programs would likewise be reduced.
Effects on the BudgetIf that change was implemented, the federal government would spend less on construction, saving $12 billion in discretionary outlays from 2019 through 2028, the Congressional Budget Office estimates. Mandatory spending on federally funded or federally assisted con-struction projects would also decline, but by less than $1 billion over that period. (The largest component of that mandatory spending is construction funded
through the Tennessee Valley Authority.) Savings would generally accrue to federal agencies that engage in con-struction projects. In 2018, about half of all federal or federally assisted construction was funded through the Department of Transportation, although a significant portion of federal construction projects were funded through the Department of Defense, the Department of Housing and Urban Development, and the Department of Veterans Affairs.
In general, savings in outlays are smaller than savings in budget authority for construction projects because the outlays occur over many years. However, the rate at which those outlays occur can vary for different types of projects. Because repealing the Davis-Bacon Act would affect many types of federally funded or federally assisted construction projects, the difference between budget authority savings and outlay savings in this option rep-resents the average difference across the affected projects.
CBO’s estimate of the savings associated with this option is primarily based on the agency’s estimates of federal spending on construction and of the share of that spend-ing that would be eliminated if the Davis-Bacon Act was repealed. In CBO’s estimation, repealing the Davis-Bacon Act would reduce total federal spending on con-struction by 0.9 percent. Most of those savings—0.8 per-centage points—would result from a reduction in wages and benefits. The other 0.1 percentage point would stem from a reduction in compliance costs associated
Discretionary Spending—Option 34 Multiple Functions
Repeal the Davis-Bacon Act
Total
Billions of Dollars 2019 2020 2021 2022 2023 2024 2025 2026 2027 20282019–
20232019–
2028
Change in Discretionary Spending
Spending authority 0 -1.0 -2.0 -2.1 -2.1 -2.1 -2.2 -2.2 -2.3 -2.3 -7.1 -18.4
Budget authority 0 -0.5 -0.9 -1.0 -1.0 -1.0 -1.0 -1.1 -1.1 -1.1 -3.4 -8.6
Outlays 0 -0.4 -1.1 -1.3 -1.4 -1.5 -1.5 -1.6 -1.6 -1.6 -4.3 -12.1
Change in Mandatory Outlays 0 * * * * * * * * * -0.1 -0.3
This option would take effect in October 2019.
Spending authority includes budget authority as well as obligation limitations (such as those for certain transportation programs). The estimates are relative to the Congressional Budget Office’s adjusted April 2018 baseline, further adjusted to exclude the extrapolation over the 2019–2028 period of the large amount of emergency funding for disaster assistance provided in 2018 to the Federal Emergency Management Agency.
* = between -$50 million and zero.

196 OPTIONS FOR REDUCING THE DEFICIT: 2019 TO 2028 DECEMBER 2018
with the Davis-Bacon Act. In addition to a reduction in federal spending on construction, there would be a small amount of savings for the Department of Labor associated with the elimination of the act’s administrative costs.
The largest source of uncertainty in this option is CBO’s estimate of the share of federal spending on construction that would be eliminated by repealing the Davis-Bacon Act. Some research suggests that repealing prevailing wage laws by eliminating the act would not result in sav-ings (Azari-Rad, Philips, and Prus 2003), whereas other research suggests that repealing such laws would result in greater savings than CBO estimates (Dunn, Quigley, and Rosenthal 2005).
Other EffectsAn argument for repealing the Davis-Bacon Act is that, since the 1930s, other policies (including a federal min-imum wage) have been put in place that ensure mini-mum wages for workers employed in federal or federally assisted construction. Moreover, when prevailing wages (including fringe benefits) are higher than the wages and benefits that would be paid in the absence of the Davis-Bacon Act, the act distorts the market for construction workers. In that situation, federally funded or federally assisted construction projects are likely to use more capi-tal and less labor than they otherwise would, thus reduc-ing the employment of construction workers. Additional arguments for repealing the Davis-Bacon Act are that the paperwork associated with the act makes compliance
more difficult for small firms than for large firms and that the act is difficult for the federal government to administer effectively. For instance, prevailing wage rates are based on surveys and are supposed to be issued for job classifications by county. However, survey responses are often insufficient to generate county-level estimates of prevailing wages for some occupations. Finally, under current law some agencies charge people separate fees or higher rates than they otherwise would to fund certain federal construction projects. To the extent that those agencies passed on the savings from reduced construc-tions costs to their users, those users would experience lower costs for services.
One argument against repealing the Davis-Bacon Act is that doing so would lower the earnings of some construc-tion workers. Another argument against such a change is that it might jeopardize the quality of construction at federally funded or federally assisted projects. When possible, managers of some construction projects would decrease costs by paying a lower wage than is permit-ted under the Davis-Bacon Act. As a result, they might attract workers who are less skilled or do lower-quality work. Also, if one of the objectives of federal projects is to increase earnings for the local population, repealing the Davis-Bacon Act might undermine that aim. The act prevents out-of-town firms from coming into an area, using lower-paid workers from other regions of the coun-try to compete with local contractors for federal work, and then leaving the area upon completion of the work.
WORK CITED: Hamid Azari-Rad, Peter Philips, and Mark J. Prus, “State Prevailing Wage Laws and School Construction Costs,” Industrial Relations, vol. 42, no. 3 (June 2003), pp. 445–457, https://doi.org/10.1111/1468-232X.00299; Sarah Dunn, John M. Quigley, and Larry A. Rosenthal, “The Effects of Prevailing Wage Requirements on the Cost of Low-Income Housing,” Industrial and Labor Relations Review, vol. 59, no.1 (October 2005), pp. 141–157, https://doi.org/10.1177/001979390505900108