Embed Size (px)
Citation preview
Discrete Mathematics and
Modeling for High School
Students and Teachers
Mona Toncheff PUHSD: Math Content Specialist Jeanette Scott Cesar Chavez: Math Instructional Leader

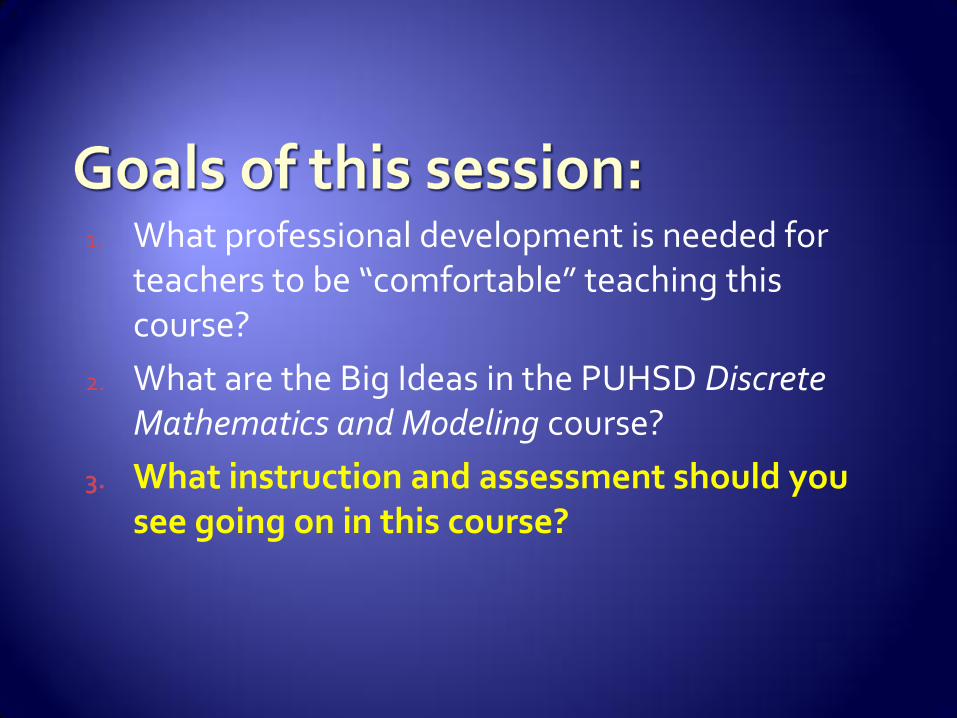
1. What professional development is needed for teachers to be “comfortable” teaching this course?
2. What are the Big Ideas in the PUHSD Discrete Mathematics and Modeling course?
3. What instruction and assessment should you see going on in this course?

December 2008
Graduating class of 2013 needs 4 years of Math credit
One credit is equivalent to Algebra II
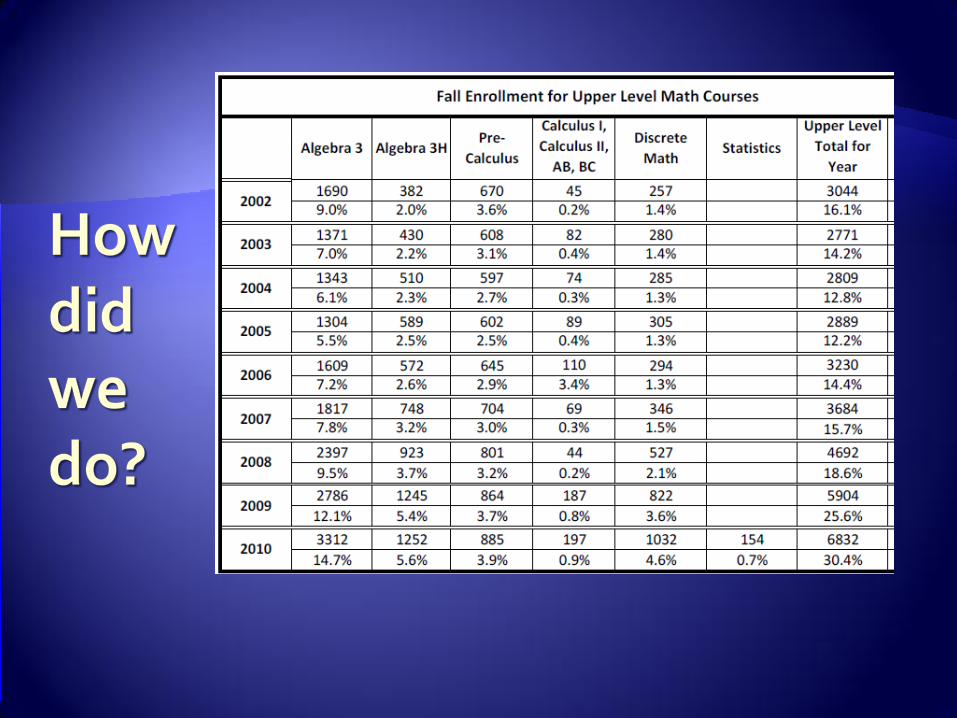
Only 18% of the student population were in Jr./Sr. level Math classes
We needed more options for students not pursuing Calculus
Aligned with the newly released AZ 2008 College and Career Readiness Standards

MSP Grant: Mathematics Modeling Partnership: Preparing Urban Teachers for Implementing College and Work Readiness Standards

Goals were to create curriculum for 4th year course
Increase teacher content knowledge
Increase student achievement
135 hours of PD
1 week workshop first summer
Developing teacher content knowledge (TCK) and “comfort”
8 Saturdays throughout the school year
Build curriculum and TCK
Modeling instruction
1 week summer workshop at the end of the grant

1. What professional development is needed for teachers to be “comfortable” teaching this course?
2. What are the Big Ideas in the PUHSD Discrete Mathematics and Modeling course?
3. What instruction and assessment should you see going on in this course?
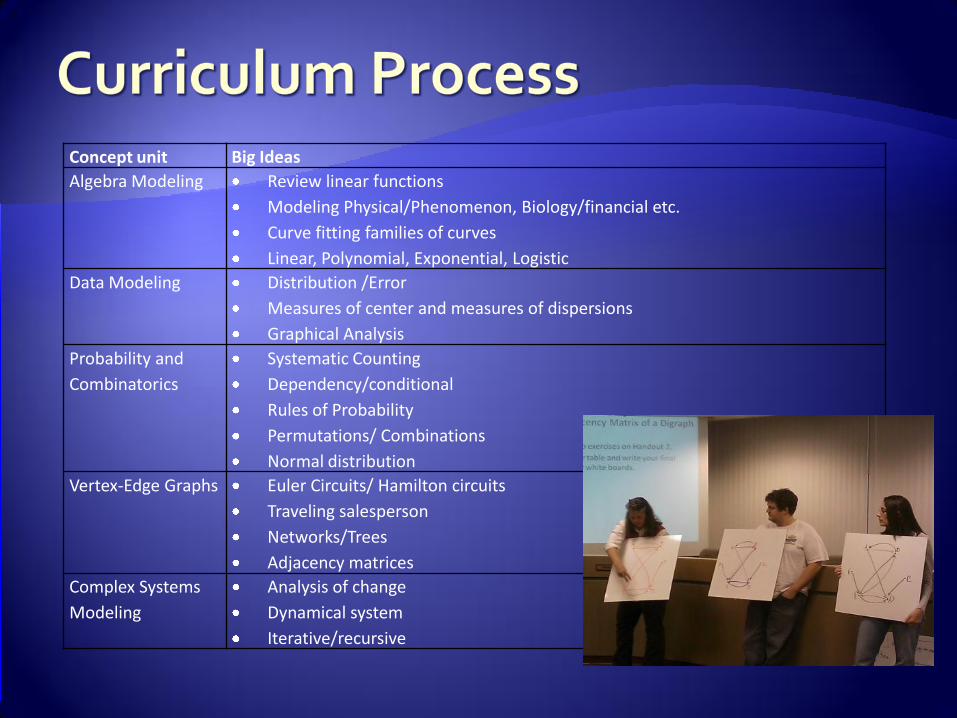
Concept unit Big Ideas
Algebra Modeling Review linear functions
Modeling Physical/Phenomenon, Biology/financial etc.
Curve fitting families of curves
Linear, Polynomial, Exponential, Logistic
Data Modeling Distribution /Error
Measures of center and measures of dispersions
Graphical Analysis
Probability and
Combinatorics
Systematic Counting
Dependency/conditional
Rules of Probability
Permutations/ Combinations
Normal distribution
Vertex-Edge Graphs Euler Circuits/ Hamilton circuits
Traveling salesperson
Networks/Trees
Adjacency matrices
Complex Systems
Modeling
Analysis of change
Dynamical system
Iterative/recursive

http://ccl.northwestern.edu/netlogo/
1. What professional development is needed for teachers to be “comfortable” teaching this course?
2. What are the Big Ideas in the PUHSD Discrete Mathematics and Modeling course?
3. What instruction and assessment should you see going on in this course?
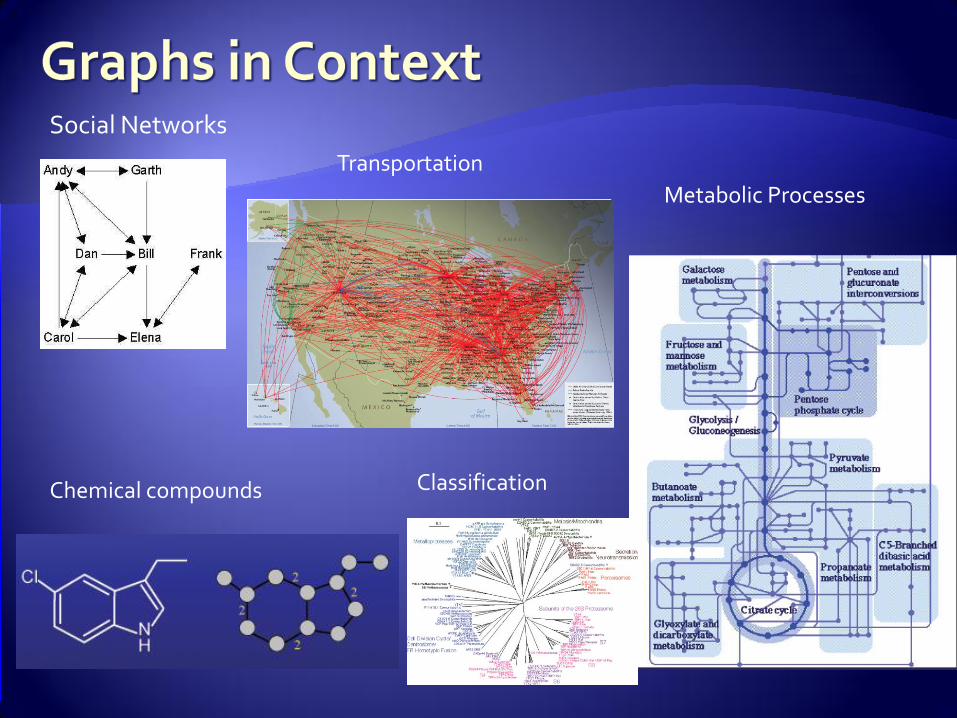
Social Networks
Chemical compounds
Metabolic Processes
Transportation
Classification
Each group member will be given a clue to solve the problem
One rule- you may not show your clue to anyone else. You may tell them about it, you may read it to them, but you cannot show it to them.
You have to tell others what you know
Each clue contains connections between different barges that make up the city
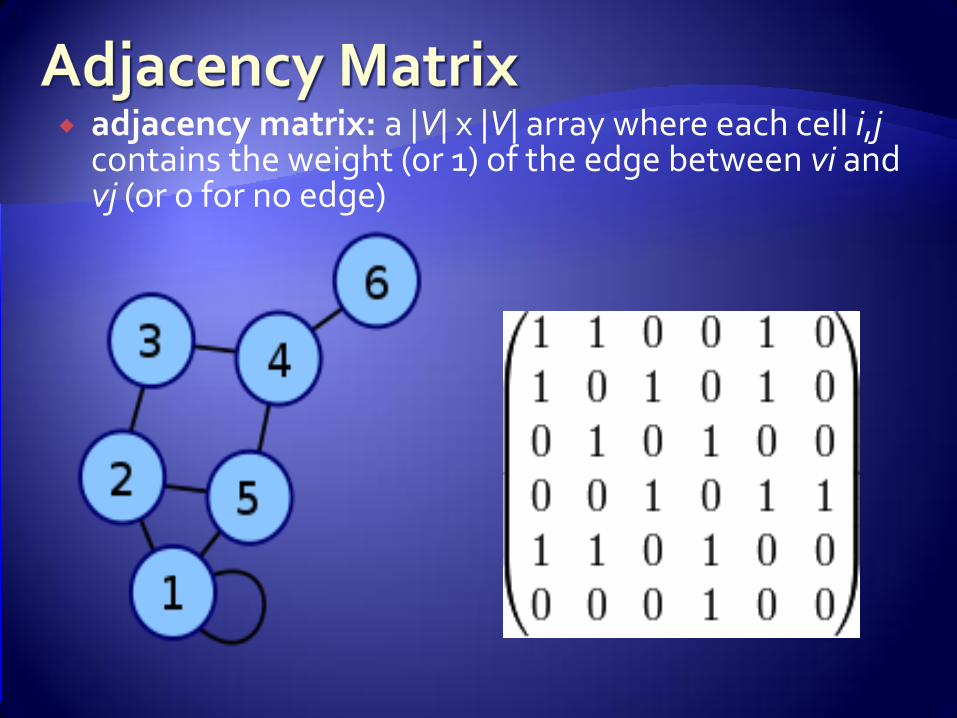
adjacency matrix: a |V| x |V| array where each cell i,jcontains the weight (or 1) of the edge between vi and vj (or 0 for no edge)
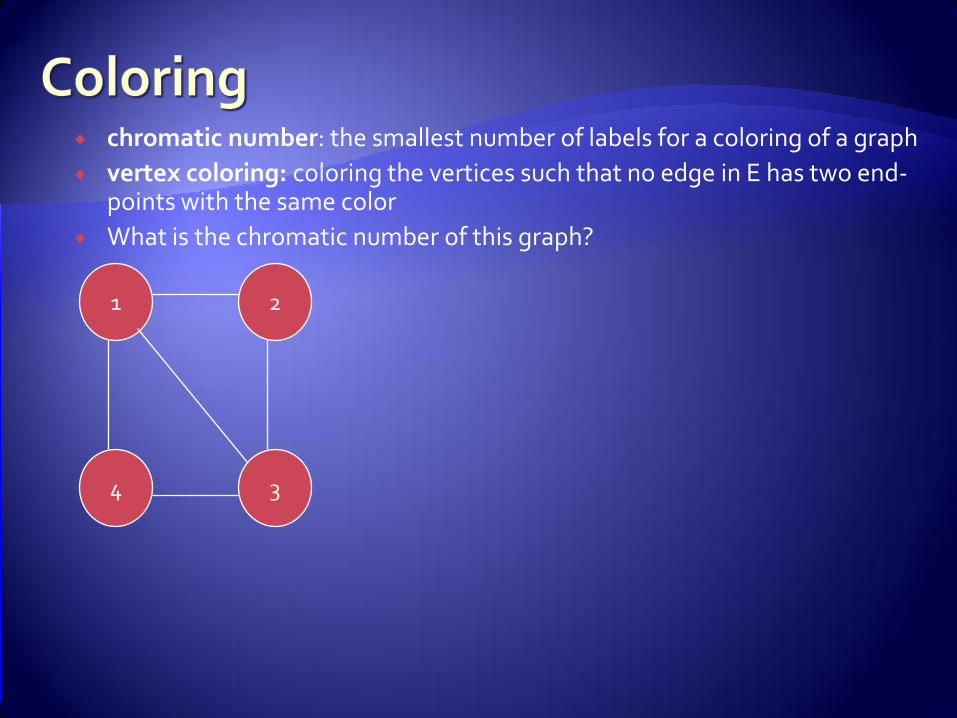
chromatic number: the smallest number of labels for a coloring of a graph
vertex coloring: coloring the vertices such that no edge in E has two end-points with the same color
What is the chromatic number of this graph?
1 2
4 3

The four color theorem, or the four color map theorem, states that given any separation of a plane into contiguous regions, called a map, the regions can be colored using at most four colors so that no two adjacent regions have the same color. Two regions are called adjacent only if they share a border segment, not just a point. This can be extended to all planar graphs.
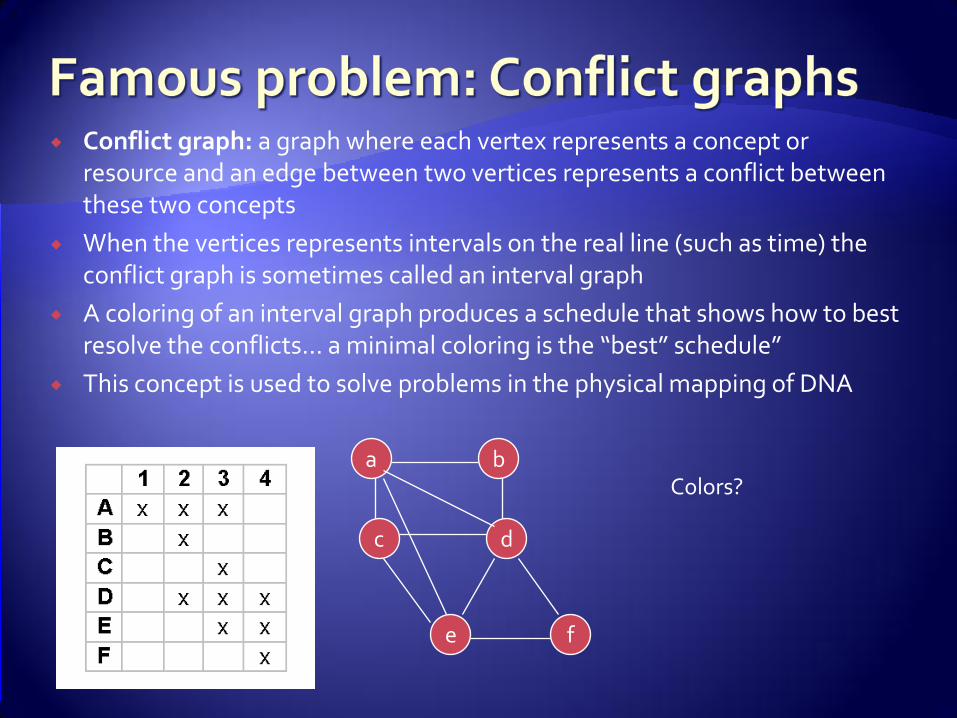
Conflict graph: a graph where each vertex represents a concept or resource and an edge between two vertices represents a conflict between these two concepts
When the vertices represents intervals on the real line (such as time) the conflict graph is sometimes called an interval graph
A coloring of an interval graph produces a schedule that shows how to best resolve the conflicts… a minimal coloring is the “best” schedule”
This concept is used to solve problems in the physical mapping of DNA
a b
c
fe
d
Colors?

Must assess higher order thinking skills
Rubrics to evaluate group progress

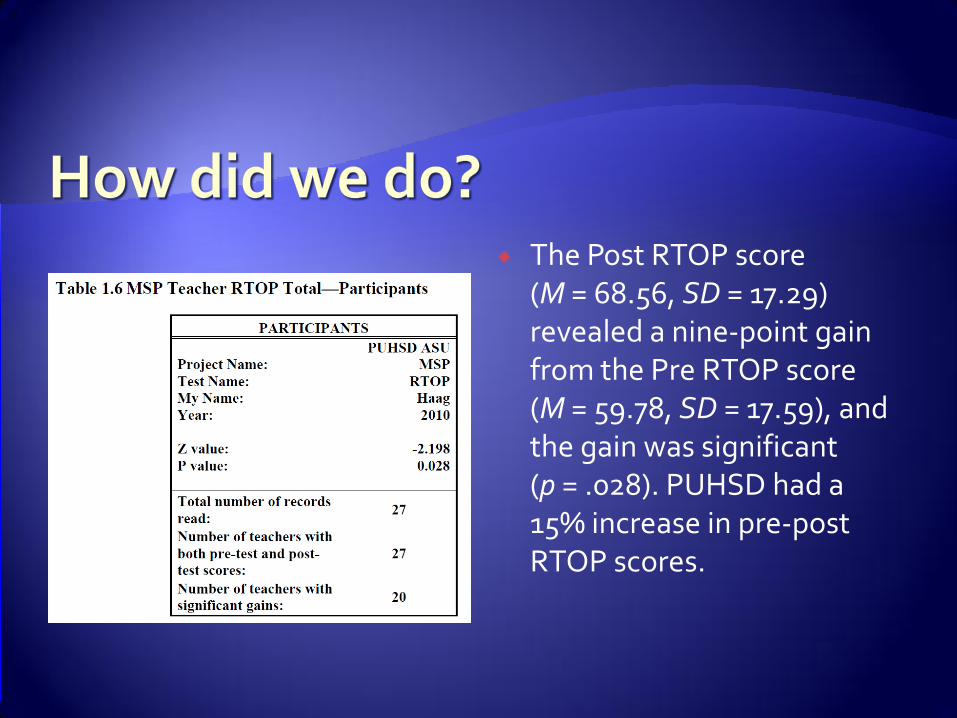
The Post RTOP score (M = 68.56, SD = 17.29) revealed a nine-point gain from the Pre RTOP score (M = 59.78, SD = 17.59), and the gain was significant (p = .028). PUHSD had a 15% increase in pre-post RTOP scores.
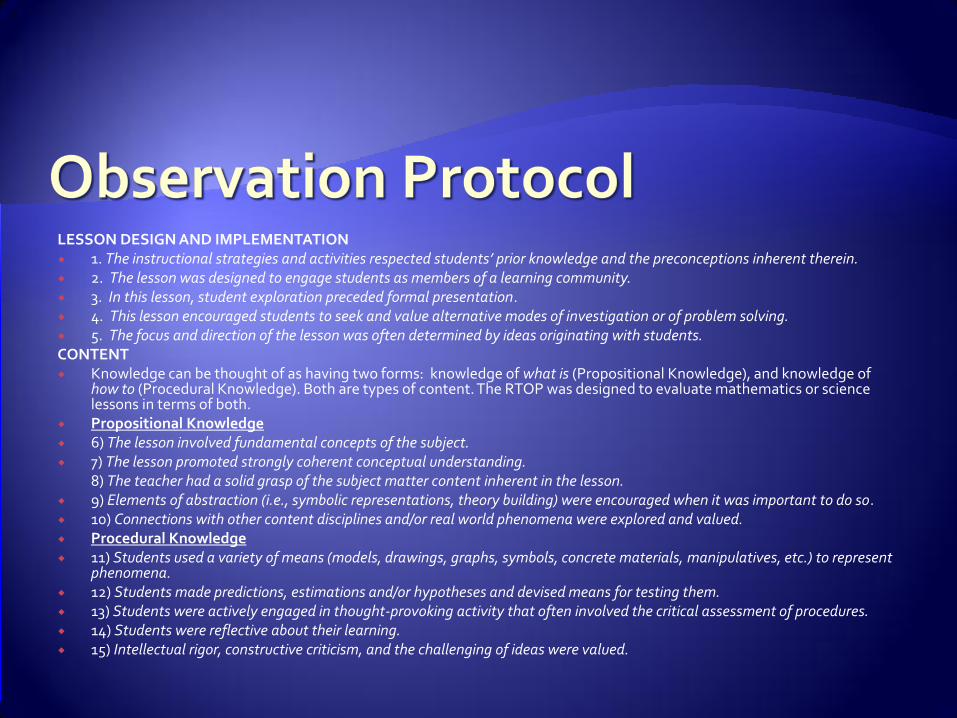
LESSON DESIGN AND IMPLEMENTATION 1. The instructional strategies and activities respected students’ prior knowledge and the preconceptions inherent therein. 2. The lesson was designed to engage students as members of a learning community. 3. In this lesson, student exploration preceded formal presentation. 4. This lesson encouraged students to seek and value alternative modes of investigation or of problem solving. 5. The focus and direction of the lesson was often determined by ideas originating with students.CONTENT Knowledge can be thought of as having two forms: knowledge of what is (Propositional Knowledge), and knowledge of
how to (Procedural Knowledge). Both are types of content. The RTOP was designed to evaluate mathematics or science lessons in terms of both.
Propositional Knowledge 6) The lesson involved fundamental concepts of the subject. 7) The lesson promoted strongly coherent conceptual understanding.
8) The teacher had a solid grasp of the subject matter content inherent in the lesson. 9) Elements of abstraction (i.e., symbolic representations, theory building) were encouraged when it was important to do so. 10) Connections with other content disciplines and/or real world phenomena were explored and valued. Procedural Knowledge 11) Students used a variety of means (models, drawings, graphs, symbols, concrete materials, manipulatives, etc.) to represent
phenomena. 12) Students made predictions, estimations and/or hypotheses and devised means for testing them. 13) Students were actively engaged in thought-provoking activity that often involved the critical assessment of procedures. 14) Students were reflective about their learning. 15) Intellectual rigor, constructive criticism, and the challenging of ideas were valued.
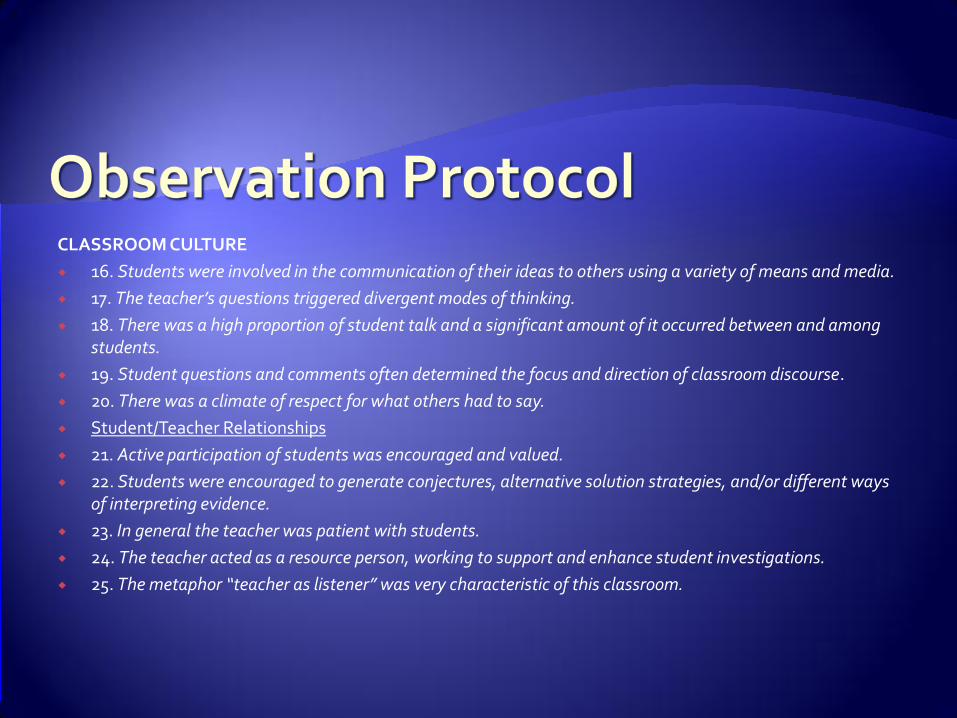
CLASSROOM CULTURE
16. Students were involved in the communication of their ideas to others using a variety of means and media.
17. The teacher’s questions triggered divergent modes of thinking.
18. There was a high proportion of student talk and a significant amount of it occurred between and among students.
19. Student questions and comments often determined the focus and direction of classroom discourse.
20. There was a climate of respect for what others had to say.
Student/Teacher Relationships
21. Active participation of students was encouraged and valued.
22. Students were encouraged to generate conjectures, alternative solution strategies, and/or different ways of interpreting evidence.
23. In general the teacher was patient with students.
24. The teacher acted as a resource person, working to support and enhance student investigations.
25. The metaphor “teacher as listener” was very characteristic of this classroom.
https://sites.google.com/site/puhsddiscrete RTOP
http://physicsed.buffalostate.edu/AZTEC/RTOP/RTOP_full/ Netlogo http://ccl.northwestern.edu/netlogo/ Dr. DeBellis http://discreteteaching.com/discrete_ii.html Navigating through Discrete Mathematics in Grades 6-12
NCTM 2008 COMAP For all Practical Purposes : mathematical literacy in
today's world United we Solve, Tim Erickson Jim Middleton [email protected] Susan Haag- evaluator [email protected]