Embed Size (px)
Citation preview

Discrete element modelling of the influence of lifters on powerdraw of tumbling mills q
N. Djordjevic
Julius Kruttschnitt Mineral Research Centre, University of Queensland, Brisbane, Australia
Received 11 December 2002; accepted 13 January 2003
Abstract
Crushing and grinding are the most energy intensive part of the mineral recovery process. A major part of rock size reduction
occurs in tumbling mills. Empirical models for the power draw of tumbling mills do not consider the effect of lifters. Discrete element
modelling was used to investigate the effect of lifter condition on the power draw of tumbling mill. Results obtained with PFC3D
code show that lifter condition will have a significant influence on the power draw and on the mode of energy consumption in the
mill. Relatively high lifters will consume less power than low lifters, under otherwise identical conditions. The fraction of the power
that will be consumed as friction will increase as the height of the lifters decreases. This will result in less power being used for high
intensity comminution caused by the impacts. The fraction of the power that will be used to overcome frictional resistance is de-
termined by the material�s coefficient of friction. Based on the modelled results, it appears that the effective coefficient of friction for
in situ mill is close to 0.1.
� 2003 Elsevier Science Ltd. All rights reserved.
Keywords: Comminution; SAG milling; Modelling
1. Introduction
Lifters are an essential element in the tumbling action
of a grinding mill, whose purpose is to prevent slippage
of the mill charge. Such slippage consumes energy
without substantial breakage, and the mill may not lift
the charge sufficiently high to promote impact breakage.Hence, the size, shape and number of lifters will have a
strong impact on the tumbling action of the media
(King, 2001). The power required to operate large mills
is typically 5–10 MW. Hence, optimisation of the power
consumption will have a significant impact on the
overall economic performance and environmental im-
pact of the mineral processing plant.
Empirical models for the power draws of the tum-bling mills do not consider the effect of lifters (Morrell,
1996; Napier-Munn et al., 1996; King, 2001). Input
parameters are size of the mill, rotational speed and
parameters related to the rock and steel balls. The issues
of the lifter height and number are not considered.
The computing power of modern desktop computers
presents an opportunity to use a discrete element mod-
elling (DEM) for mill modelling (Mishra and Rajamani,
1994), in this case Particle Flow Code 3D (Itasca Inc.,
1999). Power draw calculated using PFC3D refers to the
total power draw accumulated for each rock and steel
ball in the mill. In order to compare modelled powerwith measured power, it is necessary to add an estimate
of the power required to rotate the empty mill.
Cleary (2001) used DEM to investigate the effect of
lifter pattern of the specific power draw of the 2D mill.
He concluded that substantial influences of the lifter
pattern occur only for relatively high rotational velocities
of the mill (greater than 80% of critical). He noticed that
by reducing the number of lifters by half, the specificpower draw (kW/tonne) of the mill could be increased
substantially. This means that more efficient grinding can
be achieved by reducing the number of lifters (from 24 to
12 in his 2D model of the 5 m mill) (Cleary, 2001).
2. Discrete element modelling using PFC3D code
PFC3D code models the behaviour of particles,
which may be enclosed within a finite volume by the
qPresented at Minerals Engineering �02, Perth, Australia, September
2002.
E-mail address: [email protected] (N. Djordjevic).
0892-6875/03/$ - see front matter � 2003 Elsevier Science Ltd. All rights reserved.
doi:10.1016/S0892-6875(03)00019-0
Minerals Engineering 16 (2003) 331–336This article is also available online at:
www.elsevier.com/locate/mineng

non-deformable walls. The code keeps a record of in-
dividual particles and updates any contact with other
particles or walls. Each calculation step includes appli-
cation of the laws of motion to a particle, a force–dis-
placement law to each contact, and constant updating of
wall position (Cundall and Strack, 1979).
The PFC3D modelling is based on the assumptionthat the individual particles (balls) are treated as stiff
bodies. At contacts, rigid particles can overlap. The
magnitude of the overlap is related to the contact force.
Overlaps are small relative to the size of the particles.
Individual particles can also be bonded to form clusters
to mimic rock shape and strength.
During contact, the behaviour of a material is simu-
lated using a linear contact model. The contact forcevector between two balls or ball and wall is composed of
a normal and shear components. The normal contact
force vector is calculated using the formula:
Fn ¼ KnUnni
where Kn is normal stiffness at the contact; Un is the
relative contact displacement in the normal direction; niis unit normal vector.
The incremental shear force is calculated using the
formula:
DFs ¼ �Ks DUs
where Ks is the shear stiffness at contact; DUs is the in-cremental shear displacement at contact.
PFC3D also includes a slip model. The slip model is
defined by the friction coefficient at the contact, where
the active relevant friction coefficient is taken to be the
minimum friction coefficient of the two contacting en-
tities. Each contact is checked for slip conditions, by
calculating the maximum allowable shear contact force:
Fs ðmaxÞ ¼ labsðFnÞwhere l is the friction coefficient; Fn is the normal force.
The energy state of the entire set of particles can be
examined by recording various forms of energy. Fric-
tional work is defined as the total cumulative energy
dissipated by frictional sliding at all contacts. Intensity
of deformation can be assessed using strain energy,
which is defined as the total strain energy stored at all
contacts assuming a linear contact-stiffness model.
The PFC3D model of the mill is composed of anumber of walls which represent liner and lifters as well
as balls which represents mill charge. The power of the
mill is calculated for each instant of time by summing
products of moments that are applied to the mill liner
and lifters and rotational velocity of the mill.
A critical aspect of DEM is selection of material
parameters. Parameters such as material stiffness, coef-
ficient of friction, and damping ratio may affect not justthe value of the power draw but also computational
time. Considering that realistic full 3D modelling of the
tumbling mills may require many thousands of particles,
the ability to produce a modelling result within a rea-
sonable time is of large practical significance.
Strain energy at contact can be defined as:
E ¼ 0:5ðF 2n =Kn þ F 2
s =KsÞwhere E is the strain energy stored at the contact of two
colliding objects; Fn, Fs are the magnitudes of the normal
and shear component of the contact force; Kn, Ks are the
normal and shear contact stiffness.
The contact stiffness is computed assuming that the
stiffness�s of two contacting entities (ball and wall) act in
series:
Kn ¼ KbKw=ðKb þ KwÞwhere Kb, Kw are the normal stiffness of the ball and
wall; Kn is the normal contact stiffness.In the case of perpendicular impact, shear component
can be ignored. Contact force is described with formula:
Fn ¼ KnUn
where Kn is the normal contact stiffness; Un is total
normal displacement.
By combining these equations, for the case of normal
impact, the strain energy can be described with the
formula:
E ¼ KnU 2n
Considering that normal displacement at contact is
inversely proportional to the contact stiffness, it is likely
that an increase of stiffness of the ball will not have a
dramatic influence on the amount of strain energy.Within a mill, all energies eventually need to come from
the external power source. Consequently, induced strain
energy is directly proportional to the power. In order to
preserve the accuracy of the computation, sampling time
was chosen to always be 20% of the minimum stable
critical time step for the particular modelling case.
Previous work (Djordjevic, 2002), has showed that a
full sized mill can be reliably represented by a verticalslice of sufficient thickness. In absence of the fluid in-
duced pressure gradient, the motion of the particles
within the PFC3D model is essentially constrained
within a relatively narrow disk, with the main motion
occurring in the vertical plane, while mixing of the
particles along the length of mill is relatively insignifi-
cant. The previous results also showed that in terms of
power draw, the PFC3D model power is consistent withthe power draw predicted using empirical models.
Hence, as a standard case we used one meter thick slices
for a mill with a diameter of 5 m.
3. Influence of lifters height on power
The effect of the lifter height is computed in terms ofenergy distribution that occurs within the mill. Some
332 N. Djordjevic / Minerals Engineering 16 (2003) 331–336

fraction of the power required to rotate the mill will be
consumed in friction between balls and between balls
and the mill shell. We postulate that the fraction of the
input power that will be consumed in friction will in-
crease with a decrease of the lifter height. With increases
in power consumption as frictional energy, the influence
of rock abrasion will increase. This will result in lessenergy being consumed in high-energy impact breakage.
Consequently, the overall rate of size reduction within
the mill will decrease, although the product may become
finer.
Influence of the lifter height on the power draw of the
mill and amount of power that will be consumed in the
form of frictional energy has been investigated. Fric-
tional forces will be developed at contacts of balls andballs and mill liner. Frictional energy is converted into
frictional power by dividing accumulated energy by
time. Within the PFC3D code, frictional work dissi-
pated by frictional sliding at all contacts (ball/ball or
ball/wall) is defined as:
Ef ¼X
Fis DUis
where Ef is the cumulative frictional work or energy; Fisis the average shear force at the specific contact for the
current time step; DUis is the average increment of slip
displacement at the contact for the current time step;P
is the summation for all contacts for the current time
step.
Power (Pf ) required for frictional work in a certain
time interval (DT ) is given by:
Pf ¼ Ef=DT
The modelled mill was 5 m diameter, with 20 lifters
with height of 0.2, 0.1 and 0.05 m. The width of the
lifters remained constant (0.1 m). Angular rotational
velocity of the mill was kept constant, at 70% (or 1.38
rad/s) of its critical speed. Relatively low values of mill
fill factor of 5% and 10% were used in order to reduce
the number of balls, which makes it possible to complete
modelling within a reasonable time using a standarddesktop personal computer.
The properties of balls are given in Table 1.
The heights of the lifters were chosen to equal 2, 1 or
0.5 ball diameters, or high, medium and low lifters. Low
lifters correspond to the case where due to severe wear
and tear, lifters were reduced to 25% of their initial
height. The pattern of ball motion and their velocity
vectors for three types of lifters for constant speed and
fill factor is shown in Figs. 1–3.
High lifters are able to more efficiently lift a larger
numbers of balls. This reduces the thickness of the mill
charge in the base of the mill. Due to the slightly longer
contact time with the mill shell, balls detach later from
the mill. After free fall, they tend to intercept the millshell at a higher position. Clearly, the number of balls
that are involved in tumbling action per unit of time is
larger with high lifters.
The highly variable net-power draw time history is
shown in Fig. 4, smoothed time history in Fig. 5. This
net-power draw refers to the 1 m thick slice of the 5 m
mill. Hence, for any comparison with real mills, it is
Table 1
Properties of balls used for the modelling
Diameter 0.1 m
Density 2500 kg/m3
Normal stiffness 0.1 MN/m
Shear stiffness 0.1 MN/m
Coefficient of friction 0.3 (0.1)
Viscous damping coefficient 0.3
Coefficient of restitution 0.38
Fig. 1. Ball motion pattern and velocity vectors for the mill with high
lifters.
Fig. 2. Ball motion pattern and velocity vectors for the mill with
medium lifters.
Fig. 3. Ball motion pattern and velocity vectors for the mill with low
lifters.
N. Djordjevic / Minerals Engineering 16 (2003) 331–336 333
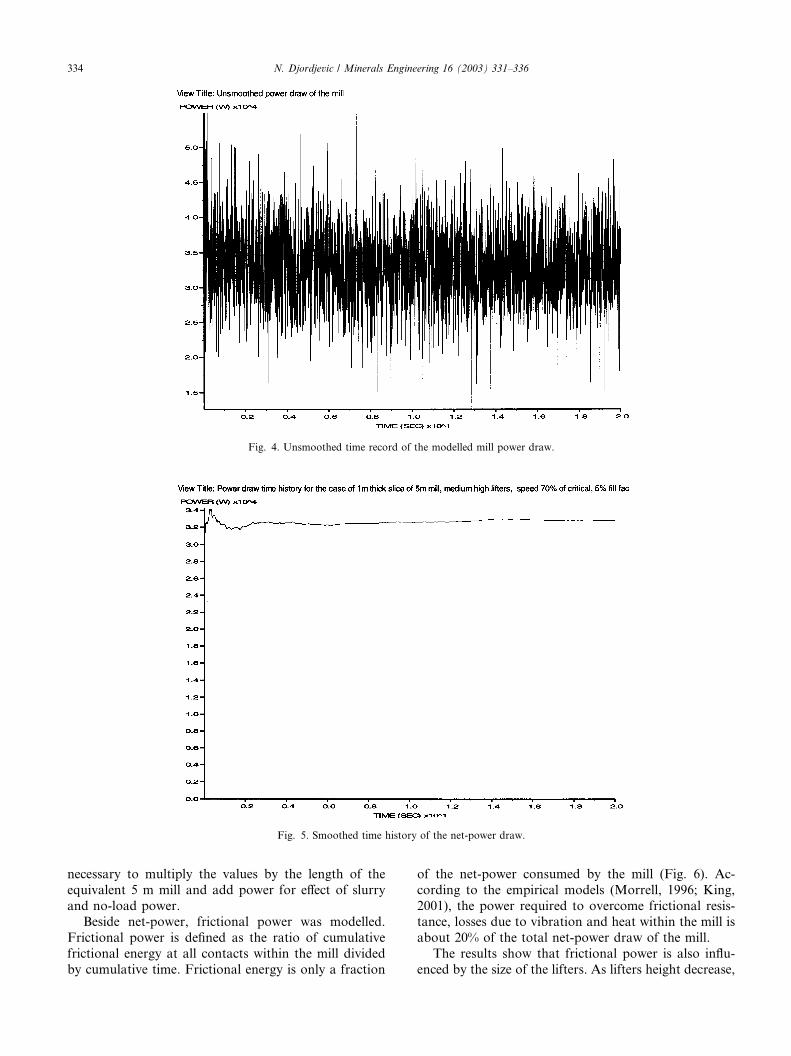
necessary to multiply the values by the length of the
equivalent 5 m mill and add power for effect of slurry
and no-load power.Beside net-power, frictional power was modelled.
Frictional power is defined as the ratio of cumulative
frictional energy at all contacts within the mill divided
by cumulative time. Frictional energy is only a fraction
of the net-power consumed by the mill (Fig. 6). Ac-
cording to the empirical models (Morrell, 1996; King,
2001), the power required to overcome frictional resis-tance, losses due to vibration and heat within the mill is
about 20% of the total net-power draw of the mill.
The results show that frictional power is also influ-
enced by the size of the lifters. As lifters height decrease,
Fig. 4. Unsmoothed time record of the modelled mill power draw.
Fig. 5. Smoothed time history of the net-power draw.
334 N. Djordjevic / Minerals Engineering 16 (2003) 331–336

the amount of power which is consumed to overcome
friction increases. For constant coefficient of friction
(0.3), and fill factor (5%), the influence of the lifter
height on the net-power draw and frictional power draw
are given in the Fig. 7.The ratio of the frictional-power to net-power clearly
increases with decrease in lifter height. The modelled
ratios are much higher than 20%. This could be due to a
relatively high coefficient of friction (0.3) used in this
modelling, or due to the low filling factor. In the case of
the real mills, the presence of the slurry will act as a
lubricant, reducing the effective coefficient of friction.
The influence of a low coefficient of friction (0.1) on thepower draws is presented in Fig. 8. The ratio of the
frictional power and net-power draw is now close to 0.2,
which corresponds favourably with empirical models.
For the extreme case when the coefficient of friction is
nil there will be no frictional losses within the mill.
However, this does not result in overall net-power draw
being lower. Hence, it appears based on this modelling
that the coefficient of friction will influence how theapplied power will be consumed within the mill (friction
or impacts), but it will not have a significant effect on the
overall power draw of the mill. This confirms the results
obtained earlier by Cleary (2001).
Another contributing factor to the relatively high
values of the frictional power is low fill factor (5%).
Empirical models are developed with typical fill factors
in the range of 35–45%. An increased fill factor will re-duce the relative amount of power required to overcome
frictional resistance within the charge, and at the con-
tacts of balls and mill shell. Results show that when the
Fig. 7. Influence of the lifter height on the power draw. Fig. 8. Influence of the balls coefficient of friction on the power draw.
Fig. 6. Smoothed time history of the power consumed by friction.
N. Djordjevic / Minerals Engineering 16 (2003) 331–336 335

fill factor is increased from 5% to 10%, the fraction of
power consumed as friction decreases from 0.4 to 0.34
for the case of high lifters. A similar trend is also ob-served for the case of medium high and small lifters (Fig.
9). Although increased fill factor may reduce the relative
significance of the frictional energy, it is clear that the
major influence is the coefficient of friction. In the real
mills effective coefficient of friction, due to effect of
water, is probably quite low.
4. Conclusions
DEM results obtained with the PFC3D code show
that the lifter condition will have a significant influence
on the power draw and on the mode of energy con-
sumption with the mill. Mill with relatively high lifters
will consume less power than mill with low lifters, under
otherwise identical conditions. The fraction of the powerthat will be consumed as friction will increase as the
height of the lifters decreases. This means that less
power is available for high intensity comminution
caused by impacts. The fraction of the power that must
be used to overcome frictional resistance is determined
by the material�s coefficient of friction. Based on the
modelled results, it appears that effective coefficient of
friction for real mill is close to 0.1. Slurry acts as a lu-
bricant, reducing the coefficient of friction of dry feed or
steel balls. When higher value for coefficient of friction is
used in modelling (0.3), the fraction of net-power con-
sumed for friction is much higher than that which em-pirical models suggests (0.2).
Acknowledgement
The author wishes to thank Dr. Robert Morrison for
the useful discussions and helpful comments.
References
Morrell, S., 1996. Power draw of wet tumbling mills and its
relationship to charge dynamics. Part 2: an empirical approach to
modelling of mill power draw. Trans. Inst. Mining Metall. (Section
C: Mineral Process. Ext. Metall.) 105, C54–C62.
Napier-Munn, T.J., Morrell, S., Morrison, R.D., Kojovic, T. Mineral
Comminution Circuits. Their Operation and Optimisation. Julius
Kruttschnitt Mineral Research Centre, Brisbane, 1996.
King, R.P., 2001. Modelling and Simulation of Mineral Processing
Systems. Butterworth-Heinemann.
Cundall, P.A., Strack, O.D.L., 1979. A discrete numerical model for
granular assemblies. Geotechnique 29, 47.
Cleary, P.W., 2001. Charge behaviour and power consumption in ball
mills: sensitivity to mill operating conditions, liner geometry and
charge composition. Int. J. Mineral Process. 63, 79–114.
Djordjevic, N., 2002. Discrete element modelling of power draw of
tumbling mills. In: Proceedings of IMM/AusIMM, submitted for
publication.
Mishra, B.K., Rajamani, R.K., 1994. Simulation of charge motion in
ball mills: Part 1. Experimental verifications. Int. J. Mineral
Process. 40, 171–186.
PFC3D Particle Flow Code in 3 Dimensions, 1999. Itasca Consulting
Group Inc., Minneapolis, MN.
Fig. 9. Influence of lifter height and fill factor (5% and 10%) on the
fraction of power consumed by friction.
336 N. Djordjevic / Minerals Engineering 16 (2003) 331–336