Embed Size (px)
Citation preview

Powder Technology 231 (2012) 122–134
Contents lists available at SciVerse ScienceDirect
Powder Technology
j ourna l homepage: www.e lsev ie r .com/ locate /powtec
Discrete element modelling and experimental validation for the falling process of drygranular steps
H.T. Chou a, C.F. Lee a, Y.C. Chung b,⁎, S.S. Hsiau c
a Department of Civil Engineering, National Central University, Jhongli 32001, Taiwan ROCb Department of Computer Science and Information Engineering, Taoyuan Innovation Institute of Technology, Jhongli 32091, Taiwan ROCc Department of Mechanical Engineering, National Central University, Jhongli 32001, Taiwan ROC
⁎ Corresponding author. Tel.: +886 3 4361070x6946E-mail address: [email protected] (Y.
0032-5910/$ – see front matter © 2012 Elsevier B.V. Allhttp://dx.doi.org/10.1016/j.powtec.2012.08.001
a b s t r a c t
a r t i c l e i n f oArticle history:Received 19 March 2012Received in revised form 26 July 2012Accepted 6 August 2012Available online 11 August 2012
Keywords:Granular collapseDEMExperimental validationRheology
This paper presents an experimental validation of discrete element method (DEM) simulation for falling pro-cess of dry granular steps. Three chute slopes were considered in the study. The corresponding physical ex-periments were carried out in our previous study. The DEM simulations matched well with the experimentalresults regarding the external flow characteristics such as flow regimes, surface profiles, final deposit angles,velocity profiles at the sidewall, receding upper granular surfaces and flow rates. Subsequently, the DEM sim-ulations were used to explore the internal flow patterns of the granular collapse, including translational ve-locity profiles and angular velocity profiles inside the granular assembly. According to the DEM simulationresults, a mixed velocity profile (an upper convex and lower concave profile) appears in the central part ofthe chute, whilst the velocity profile follows a sidewall-stabilized heap (SSH) rheology (a concave profile)near the sidewall. The chute inclination facilitates the transformation from the SSH rheology to the mixed ve-locity profile in a narrow channel. The DEM simulations not only verify the experimental observation but alsoenhance the understanding of flow patterns induced by the collapse of dry granular steps.
© 2012 Elsevier B.V. All rights reserved.
1. Introduction
The collapse of a granular column is a simple experiment, but aes-thetically exhibits many interesting phenomena and successfully pro-vides geophysical and astrophysical applications. Lube et al. [1]explored the dynamics of static and flowing regions by the collapse ofrectangular columns of sand into a wide horizontal channel. The growthrate of the static area is independent of the initial height in the free-fallphase, whereas the static area increases linearly with time and dependson the height-width aspect ratio in the later spreading phase. The non-dimensional deposition rate is a linear function of the aspect ratio.Balmforth and Kerswell [2] experimentally investigated the collapse ofgranular columns inside rectangular channels with four different granu-lar media. The power laws properly describe the relationship betweenthe final deposit and the initial aspect ratio, and their proportionality co-efficients are affected by the sidewalls and the frictional properties ofgranular material. Lajeunesse et al. [3] conducted the experimentalstudy on the collapse of a glass-bead column over a horizontal surface.The velocity measured at the sidewall varies linearly with depth in theflowing layer and decreases exponentially with depth near the staticlayer. Lacaze et al. [4] performed a quasi 2D collapse test of granular col-umn and a discrete element simulation to study the flow behaviour ofpolypropylene spheres over a horizontal substrate. A predominantly
; fax: +886 3 4361070x6999.C. Chung).
rights reserved.
linear velocity profile was found in the moving layer over an evolvingstatic pile, and the runout distance increases with the increasing aspectratio in a power-law relation. Staron andHinch [5] presented 2D discreteelement simulations of the collapse and spreading of circular disk col-umns onto a horizontal plane. The final shape of the deposit dependsonly on the initial aspect ratio of the column. The normalized runout dis-tance versus the aspect ratio also follows a power-law relation.
Due to the limitation of measurement technology, most experimentalstudies focused on external flow behaviours of granular collapse. Conse-quently, the internal flow characteristics are by far still inadequately un-derstood. On the other hand, the Discrete Element Method (DEM) [6–9]has been a promising tool to examine the internal physical quantities,while the careful experimental validations of DEM simulation are lessreported. This paper presents a 3D DEM simulation for the falling processof dry granular steps. Our research rationale is as follows: the DEM simu-lation is first validated with the corresponding experimental results, andis then used to probe the internal flow characteristics of granular collapse.To achieve a quantitative validation, the particle properties required forDEM simulation were not just given, but measured from our developedlaboratory testers. Several important modelling aspects regarding theDEM simulation, such as the contact force model, critical time step, parti-cle generation and input parameters, were carefully defined. The externalflow characteristics of granular steps during collapse, including flow re-gime, surface profile, final deposit angle, velocity profile at the sidewall,receding upper granular surface and flow rate, were analyzed. The com-parison between the DEM simulation and experimental results was

Fig. 2. Simplified Hertz-Mindlin contact force model (cited from [13]).
123H.T. Chou et al. / Powder Technology 231 (2012) 122–134
made and discussed. The internalflow characteristics, such as translation-al velocity profile and angular velocity profile inside the granular assem-bly, were also analyzed in this paper.
2. Description of the systems
2.1. Physical model and discrete element modelling
The physical model of dry granular steps filled in an inclined chutesubjected to sudden lateral collapse is schematically shown in Fig. 1.Themodel is established to study theflowbehaviour of granularmaterialsduring avalanche. The chute has a length of Li, a height of H and awidth ofW, which is inclined at θ from the horizontal. The granularmaterials usedin this study were white spherical polystyrene beads. The discrete ele-ment method (DEM) with soft contact approach was used to model thegranular assembly in this study. The theory of the DEM can be found else-where e.g. Cundall and Strack [10] andwill not be elaborated here. Severalimportantmodelling features however need to be clarified below, includ-ing the contact force model, critical time step, particle generation andinput parameters.
The simplified Hertz–Mindlin contact force model (HM visco-elasticcontact force model) (Tsuji et al. [11]), as shown schematically in Fig. 2,was adopted in this study. This contact force model has a non-linearspring, a non-linear dashpot and a frictional slider in the tangential direc-tion aswell as a non-linear spring and a non-linear dashpot in the normaldirection. The particulate system energy is dissipated through contactfriction and contact damping. The tangential contact force is limited bythe Coulomb friction law and some energy is always dissipated in over-coming friction. Contact damping operates on the relative velocities atthe contacts and ismodelled as dashpots acting in the normal and tangen-tial directions. The damping ratio is related to the coefficient of restitution.The required parameters for this contact force model are the Poisson'sratio ν, Young's modulus E (or shear modulus: G=E/2(1+ν)), particle-surface and inter-particle friction coefficients (μw, μp), and particle-surface and inter-particle restitution coefficients (ew, ep). A multiplier of0.20 was applied to the Rayleigh critical time step [12] for all DEM simu-lations. This valuewas found to be sufficient to achieve numerical stabilitywithout excessive computational cost [13,14].
The polystyrene beads were randomly generated inside the space ofthe chute. Theywere all assigned an initial zero velocity and then allowedto fall under gravity to achieve the initial filled state. The particles weredeemed to have settled down when the kinetic energy of the systemapproached zero (b10−8 J) and the mean unbalanced force approached
Fig. 1. Physical model and experimental setup for falling tests of dry granular steps.
zero (b10−6 N), compared to a polystyrene bead weight of2.1×10−3 N. After achieving the filled state, three numerical sampleswere prepared as follows: one was for the chute slope with θ=0°, andthe other two were respectively for the chute slope with θ=5° andθ=10°. In the latter two samples, the whole chute was rotated aboutthe right-bottom corner of the chute with a very slow angular speed,which prevented disturbing the packing structure. The granular ava-lanche down a chute was simulated by quickly removing the right wallof the chute.
The DEM simulations were performed using the PFC3D code(Itasca 2010) [15], which successfully passes a set of benchmarktests at particle impact level [16] and gives confidence in modellingthe particulate systems composed of tens of thousands of particles.The DEM input parameters for the polystyrene beads are listed inTable 1. To achieve a quantitative validation, the key particle proper-ties (friction coefficient and coefficient of restitution) required forDEM simulation were not simply assumed but measured directly,which will be described in 2.2 Experimental setup. The values forthe diameter, density, Young's modulus and Poisson's ratio weretaken from the manufacturer in this study. The number of particleswas calculated to produce a very close match with the physical ex-periments. The DEM simulations in this study assumed mono-dispersed particles although small particle size variation did existin the physical experiments.
2.2. Experimental setup
The falling tests of dry granular steps have been performed in our pre-vious study [17] and the experimental features are briefly reviewed here.The falling test setup, as also shown in Fig. 1, was devised to study theflow behaviour of granularmaterials subjected to sudden lateral collapse.The experimental system consisted of a rotatable chute, a high speedcamera, two halogen lamps and a personal computer. The rectangularchute was made of transparent acrylic plates for visualization purposeand its length, height andwidth are 60 cm, 40 cm and 5 cm respectively.The chute can be rotated to the prescribed inclination angle (θ). Threechute slopes (i.e. 0°, 5° and10°)were selected to study the influence of in-clination angle on the falling process. The CCD camerawas IDTMotionProX3 PLUSwith 8 GB RAM and equippedwith a 50 mmNikkor (f/1.4) lens.
Table 1DEM input parameters for polystyrene beads.
Properties Mean value CoV (%) Unit
Diameter (d) 5.8±0.1 mmDensity (ρ) 2100 kg/m3
Young's modulus (E) 3.25 GPaPoisson's ratio (ν) 0.34Number of polystyrene beads (θ=0° and 5°) 9000Number of polystyrene beads (θ =10°) 12000Bead-wall static friction coefficient (μw) 0.43 8.3Bead-bead static friction coefficient (μp) 0.38 7.9Bead-wall restitution coefficient (ew) 0.66 7.6Bead-bead Restitution Coefficient (ep) 0.69 7.2
124 H.T. Chou et al. / Powder Technology 231 (2012) 122–134
The captured region was illuminated by two 650 W halogen lampsat both ends. The polystyrene beads have a diameter (d) of 5.8 mm(tolerance=±0.1 mm) and a density (ρ) of 2100 kg/m3. To pre-vent the particle slipping at the bottom of the chute, a layer of iden-tical polystyrene beads were glued to the chute bottom. The chute
FRONT VIEW
Base plate
R
Hinge
Base plate can rotate
Bottom plate θ
Tested plate
a) three-particle s
200mm
100mm
a) Filled state b) Releasi
Granular solidConstant displ
b) repose an
c) drop t
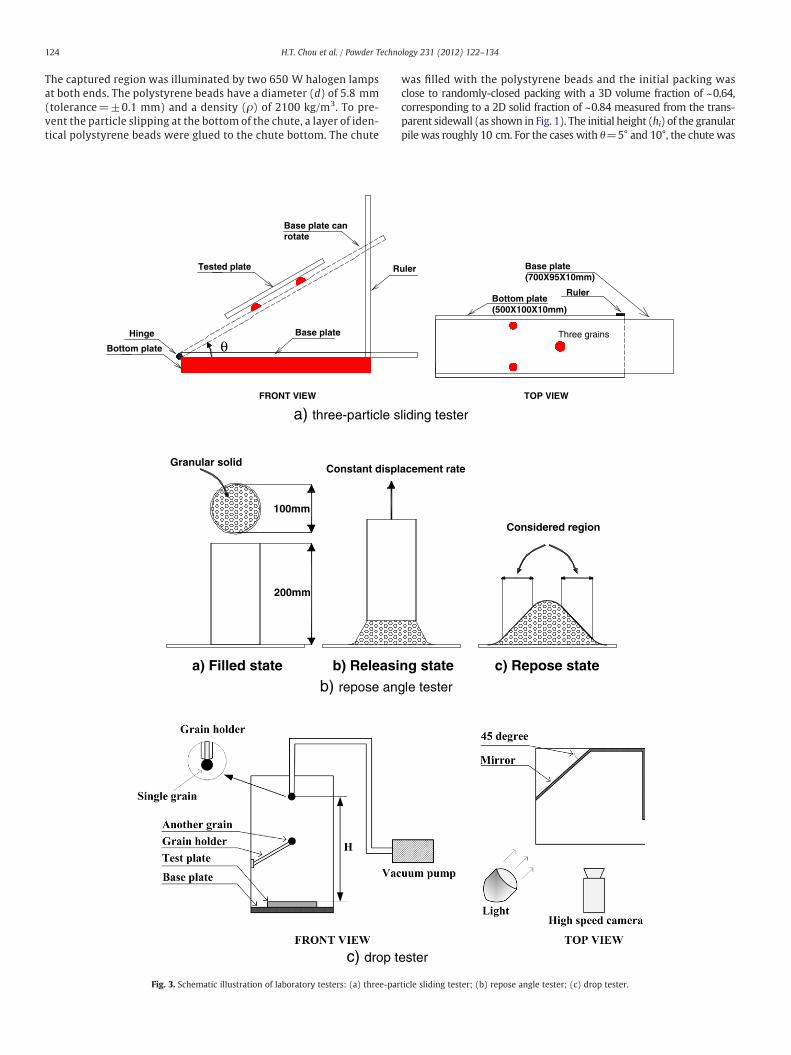
Fig. 3. Schematic illustration of laboratory testers: (a) three-par
was filled with the polystyrene beads and the initial packing wasclose to randomly-closed packing with a 3D volume fraction of ~0.64,corresponding to a 2D solid fraction of ~0.84 measured from the trans-parent sidewall (as shown in Fig. 1). The initial height (hi) of the granularpile was roughly 10 cm. For the cases with θ=5° and 10°, the chute was
uler
TOP VIEW
Base plate(700X95X10mm)
Bottom plate (500X100X10mm)
Ruler
Three grains
liding tester
Considered region
ng state c) Repose state
acement rate
gle tester
ester
ticle sliding tester; (b) repose angle tester; (c) drop tester.

Fig. 4. Schematic illustration of collapse process of polystyrene beads (cited from [17]).
125H.T. Chou et al. / Powder Technology 231 (2012) 122–134
then very slowly rotated to the given angle without disturbance. Afterthe polystyrene beads settled down, the lateral gate was suddenly re-leased to allow particles to laterally collapse under gravity.
The movements of polystyrene beads were recorded from the gateopening to the end of avalanche. The window of the CCD camera wasset to capture a region of around 50 cm×50 cm, which correspondedto 1350 square pixels (i.e. 1 cm≈27pixel). The location of the regionis also shown in Fig. 1. Since the final static point (as shown in Fig. 4)did not run out of this region for all the tests, it was enough to observethe whole flow behaviour of polystyrene beads. Every recorded imagewas digitized to grey levels, ranging from 0 to 255. These digital imageswere then transferred to the personal computer and stored for furtheranalysis. In the image processing analysis, particle tracking velocimetry(PTV) based on the Voronoi cellmethod [18]was employed tomake ve-locity measurements with high spatial and temporal resolutions. Therelative error in particle velocity measurements was found to be lessthan 6.6%.
The input parameters used in DEM simulation were often given bytrial and error, seldom being measured in laboratory tests, so the inter-pretation of DEM simulations can be rather ambiguous. Since the energydissipation of the system depends mainly on the key parameters such asfriction coefficient and coefficient of restitution, these two parametersinvolved in DEM simulation should be carefully determined. In thisstudy, several laboratory testers, including three-particle sliding friction
Fig. 5. Sequence of photographs from experiment for three chute slopes: (a) θ=0°; (b) θ=layer interface).
tester, repose angle tester and drop tester, were devised to measurethese parameters [19].
The three-particle sliding friction test (Fig. 3a)was devised tomeasurethe particle-surface static friction coefficient. Three randomly-selectedgrains were glued on the horizontal base plate. The acrylic test platewas not glued but placed on top of the three grains, and the level waschecked using a spirit level. The inclination of the base platewas graduallyincreased using an automatically-driven jack with constant displacementrate, until relative sliding between the grains and test plate occurred. Theinclination angle (θw) of the base plate at this instant was calculated fromthe height measurement of the ruler. The static particle-surface frictioncoefficient μw can be determined from μw=tan θw. The repose angletest (Fig. 3b) was designed to determine the inter-particle friction coeffi-cient (μp). The grains were filled into a cylindrical tube. After the grainssettled down, the cylindrical tube connected to an automatically-drivenjack was lifted upward with constant displacement rate, until a conicalgrain pile completely formed. The repose states on two orthogonal direc-tions were photographed and the final deposit angles θp (μp=tan θp)were measured using image analysis package ImageJ (available fromhttp://rsb.info.nih.gov/ij/). The drop test apparatus (Fig. 3c) was designedto determine the particle-surface and inter-particle restitution coeffi-cients (ew and ep respectively). A vacuum pump was used to hold agrain and the grain then feely dropped onto a test plate (for particle-surface restitution coefficient) or another identical grain (for inter-particle restitution coefficient). A high-speed camera (IDT MotionPro X3PLUS) was used to record the grain motion immediately before andafter impact. The restitution coefficient here is based on a measure of en-ergy lost during a collision and defined as ew or ep ¼ ffiffiffiffiffiffiffiffiffiffiffiffiffiffiffiffi
Eout=Einp
(Eout andEin are the kinetic energies immediately after and before impact, respec-tively). Details of the above careful characterization tests can be foundin Chung [19]. The mean value and coefficient of variation (ratio of stan-dard deviation to mean) for the friction coefficient and restitution coeffi-cient are listed in Table 1. The variation coefficient is less than 10% for alltests, so the laboratory tests are stable and reproducible.
3. Results and discussion
For interpreting the experimental and numerical results, the nomen-clature isfirst defined as follows. The polystyrene bead systemduring col-lapse can be divided into three regions [17]: the fast flowing layer, creepmotion (temporal static) layer and static zone, as shown in Fig. 4. Theglobal coordinate system is designated by X, Y and Z, originated from
5°; (c) θ=10° (red dashed line: flowing layer interface; blue dashed line: creep motion

Fig. 6. Sequence of snapshots from DEM simulation for three chute slopes: (a) θ=0°; (b) θ=5°; (c) θ=10° (red dashed line: flowing layer interface; blue dashed line: creep motionlayer interface).
Fig. 7. Illustrations of three flow stages: (a)solid-like sliding; (b)granular transition; (c)fluid-like surface flow. Dark gray particles denote the flowing layer, whereas light gray par-ticles denote the static zone (cited from [17]).
20 30 40 50 60
s [c
m]
02468
10
X [cm]20 30 40 50 60
s [c
m]
02468
10
20 30 40 50 60
s [c
m]
02468
10
a) θ=0o
c) θ=5o
e) θ=10o
Exp
Exp
Exp
20 30 40 50 60
s [c
m]
02468
10
20 30 40 50 60
s [c
m]
02468
10
X [cm]20 30 40 50 60
s [c
m]
02468
10
b) θ=0o
d) θ=5o
f) θ=10o
PFC
PFC
PFC
Fig. 8. Measured and DEM predicted evolution of flowing surface at different instants for three chute slopes: (a) θ=0° (exp); (b) θ=0° (DEM); (c) θ=5° (exp); (d) θ=5° (DEM);(e) θ=10° (exp); (f) θ=10° (DEM).
126 H.T. Chou et al. / Powder Technology 231 (2012) 122–134

Table 2Comparison of final deposit angle between experiment and DEM simulation for threechute slopes.
Chute slope θ (°) Deposit angle (°) Difference (%)
Experiment DEM simulation
0 26.1 26.6 1.95 26.4 26.8 1.510 25.8 26.4 2.3
t*0.0 0.2 0.4 0.6 0.8 1.0
L*
0.0
0.2
0.4
0.6
0.8
1.0
Exp, d=5.8mm(θ=0o)Exp, d=5.8mm(θ=5o)Exp, d=5.8mm(θ=10o)DEM, d=5.8mm(θ=0o)DEM, d=5.8mm(θ=5o)DEM, d=5.8mm(θ=0o)Model prediction(K=0.07)
Fig. 10. Measured, DEM predicted and analytical dimensionless length against dimen-sionless time for three chute slopes.
127H.T. Chou et al. / Powder Technology 231 (2012) 122–134
the left-bottom corner of the chute (as also shown in Fig. 1). The flowdepth and the local coordinate along depth denote h and y respectively.Li and Lf denote the initial and final upper surface lengths respectively.At any time t, the distance along the upper surface between the nickpoint A and the final static point B is given by L. A characteristic time τcproposed by Lajeunesse et al. [3] is defined as τc ¼
ffiffiffiffiffiffiffiffiffihi=g
p, which repre-
sents the free-fall time above thebase of a granular block through aheightof hi (g=9.81 m/s2, hi=0.1 m and τc=0.1 s in this study). The normal-ized time t⁎ is given by t⁎=t/tf, where tf is the final avalanching time.
3.1. Comparison between DEM simulation and experimental results
3.1.1. Flow regime, surface profile and final deposit angleFigs. 5 and 6 show the long-exposure images of fiveflowing stages at
three chute slopes (θ=0°, 5° and 10°) for experiments and DEM simula-tions, respectively. The snapshots at the sidewall (Y=0 cm) inDEMsim-ulations were extracted with the same frame rate as the experiments tocompare with the corresponding experimental images. The followingprocedure was applied both to the photographed images and to theDEM snapshots to determine the flowing layer interface (red dashedline) and creep motion layer interface (blue dashed line). Ten consecu-tive images for each flowing stage were overlapped in the same frame,which is similar to long-exposure process. Two critical velocity values(νflow=0.005 cm/s and νcreep=0.0001 cm/s) were prescribed. νflowcan distinguish between the flowing layer and creep motion layer,whereas νcreep can tell the creep motion layer from the static zone. TheDEM predicted flowing images match well with the photographedflowing images at the corresponding instants (t=0, τc, 2τc, 10τcand tf). The avalanching phenomenon can be classified into threeflow stages (as shown in Fig. 7) according to the flow depth [17]:(1) solid-like sliding stage: sudden sliding causes the flow depth atthe downstream outlet to be larger than that at the midpoint of theinclined surface (hout>h, Fig. 7a); (2) granular transition stage: theflow depth at the midpoint exceeds the flow depth at the outletand its flow transforms from the solid phase to the fluid phase(h>hout, Fig. 7b); (3) fluid-like surface flow stage: a thin flow layeris observed in the later stage of avalanche and the flow depths at
v/(gd)0.50 1 2
y/d
0
2
4
6
8
v/(gd)0.50 1
0
2
4
6
8a)θ=0o b)θ=5o
Fig. 9. Measured and DEM predicted normalized velocity profiles of the sidewall at di
both the midpoint and the outlet are then close to each other(hout~h, Fig. 7c). Both the experimental results (Fig. 5) and theDEM predicted results (Fig. 6) all show three flow stages during col-lapse. A solid sliding stage occurred when tbτc. When the lateral gatewas suddenly released, the granular assembly was in Rankine's ac-tive state. Most particle trajectories above the sliding failure surfacewere parallel to the slip surface. Both the flowing zone (above reddashed line) and the creep motion zone (between red and bluedashed lines) apparently appeared in this stage. The sliding failuresurface in both results is also consistent with the well-knownMohr-Coulomb failure criterion: θf=45+θp/2 [deg] (θf is the angleof failure plane from the horizontal line; θp is the repose angle ofpolystyrene beads). In general, the granular bed with larger inclina-tion angle can induce a thicker flow depth and a longer travelling dis-tance (t=2τc). The flow depth increases with the inclination angle inthe surface flow stage (t=10τc). Fig. 8 shows the evolutions of mea-sured and DEM predicted flowing surface at different instants forthree chute slopes. The DEM simulation produces a reasonablematch with the experiment except the local arching effect at thesidewall (i.e. surface bulge, also shown in Figs. 5 and 6 at t=2τc)
t*=0.1(exp)
t*=0.3(exp)
t*=0.5(exp)
t*=0.1(PFC)
t*=0.3(PFC)
t*=0.5(PFC)
2
v/(gd)0.50 1 2
0
2
4
6
8 c)θ=10o
fferent instants (t⁎=0.1, 0.3 and 0.5) for three chute slopes (θ=0°, 5° and 10°).

0.0 0.1 0.2 0.3 0.4 0.5 0.6 0.7 0.8 0.9 1.0
0
2
4
6
8
10
12
14
16
PFC_θ=0o
exp_θ=0o
0
2
4
6
8
10
12
14
16
PFC_θ=5o
exp_θ=5o
t*0.0 0.1 0.2 0.3 0.4 0.5 0.6 0.7 0.8 0.9 1.0
Qou
t/(gd
3 )0.5
Qou
t/(gd
3 )0.5
Qou
t/(gd
3 )0.5
0
2
4
6
8
10
12
14
16
PFC_ θ=10o
exp_ θ=10o
a
b
c
solid
slid
ing
transitionsurface flow
Fig. 11. Measured and DEM predicted evolution of normalized flow rate for three chute slopes (θ=0°, 5° and 10°).
128 H.T. Chou et al. / Powder Technology 231 (2012) 122–134
occurring in transition and surface flow stages. This may be attribut-ed to the different packing structures from experiment and simula-tion. The measured and DEM predicted final deposit angles of staticzone for three chute slopes are listed in Table 2. The final deposit an-gles were measured using package ImageJ applied both to the exper-imental photos and to the DEM snapshots. The differences betweenexperiment and DEM simulation are all less than 3%, so there is anexcellent agreement between both results.
3.1.2. External velocity profileThemeasured transient dimensionless velocity profiles at the sidewall
against different instants (t⁎=0.1, 0.3 and 0.5) for three chute slopes are
v/(gd)0.5 v/(g
0 1 2
0 1 2
y/d
0
2
4
6
8
10
12
14
Y=0 cmY=1.25cmY=2.5 cm
a) t*=0.1 b)
0.0 0
0.0 00
2
4
6
8
10
12
14
Fig. 12. DEM predicted dimensionless velocity profiles at different instants and v
plotted in Fig. 9. The dimensionless velocity is defined as v=ffiffiffiffiffiffigd
p, where ν
is the granular velocity and d is the bead diameter. The correspondingDEM predicted results are also plotted in this figure. The velocity profilewas calculated based on the middle point of flowing layer (point M, asshown in Fig. 4). The DEM predicted velocity profiles are in good agree-mentwith those from the experiment. There still exists some discrepancy(the difference b11%). The possible sources of the discrepancymay be thedifferent particle size distributions and packing structures between theDEM simulation and experiment. Both results show that the velocity in-creases with the inclination angle and decreases with the increasingtime. The experimental and DEM simulation results all exhibit an expo-nential decay in the vicinity of the static layer. Both results are also
d)0.5 v/(gd)0.5
t*=0.3 c) t*=0.5
.5 1.0
.5 1.0
Y=0 cmY=1.25cmY=2.5 cm
0.1 0.2 0.30.0
0.1 0.2 0.30.00
2
4
6
8
10
12
14
Y=0 cmY=1.25cmY=2.5 cm
arious locations for chute slope θ=0°: (a) t⁎=0.1; (b) t⁎=0.3; (c) t⁎=0.5.

0 1 2
0 1 2
y/d
0
2
4
6
8
10
12
14
Y=0 cm
Y=1.25cm
Y=2.5 cm
0.0 0.5 1.0
0.0 0.5 1.00
2
4
6
8
10
12
14
Y=0 cm
Y=1.25cm
Y=2.5 cm
0.1 0.2 0.3 0.40.0
0.1 0.2 0.3 0.40.00
2
4
6
8
10
12
14
Y=0 cm
Y=1.25cm
Y=2.5 cm
a) t*=0.1 b) t*=0.3 c) t*=0.5
v/(gd)0.5 v/(gd)0.5 v/(gd)0.5
Fig. 13. DEM predicted dimensionless velocity profiles at different instants and various locations for chute slope θ=5°: (a) t⁎=0.1; (b) t⁎=0.3; (c) t⁎=0.5.
129H.T. Chou et al. / Powder Technology 231 (2012) 122–134
compared with the model proposed by du Pont et al. [20], which isexpressed in Eq. (1).
vffiffiffiffiffiffigd
p ¼ vs tð Þffiffiffiffiffiffigd
p exp − yd
� �� λd
� �� �ð1Þ
where νs is the surface velocity at the sidewall; λ is the characteristiclength for granular collapse, which can be determined by linear regres-sion from the semi-log plot of the velocity profile. The characteristiclength reflects theflowcharacteristics of granular collapse, and representsthe decay length and decay extent of the velocity profile. The smallercharacteristic length indicates a smaller flow depth and a sharper decayof the velocity with depth, and vice versa [17,21]. The experimental andDEM simulation results are apparently in line with the green solid linesfrom Eq. (1).
3.1.3. Receding upper granular surfaceFig. 10 shows the evolution of measured and DEM predicted dimen-
sionless length (L⁎) against dimensionless time (t⁎) for three chute slopes(θ=0°, 5° and 10°). The dimensionless length (L⁎) is defined as a ratioof L to La, where La=Li−Lf, as shown in Fig. 4. The DEMpredicted dimen-sionless lengths are in good agreement with the experimental data. Bothresults show that the dimensionless length decreases with the increasingdimensionless time, indicating that the nick point recedes from the initialpoint to the final static point B during collapse. The experimental andDEM simulation results can be compared with the scaling law for the
0 1 2
0 1 2
y/d
0
2
4
6
8
10
12
14
Y=0 cm
Y=1.25cm
Y=2.5 cm
0.0 0.5
0.0 0.50
2
4
6
8
10
12
14
Y
Y
Y
v/(gd)0.5 v/(g
a)t*=0.1 b)t*
Fig. 14. DEM predicted dimensionless velocity profiles at different instants and va
receding upper granular surface by Chou and Lee [17], as expressed inEq. (2).
L� ¼ LLa
¼ K1−K2
1− t� þ K 1−t�ð Þð Þ2t� þ K 1−t�ð Þð Þ ð2Þ
where K is the coefficient of characteristic time and its value is approxi-mately 0.07 for many kinds of granular materials [17]. This solution wasderived based on the following assumptions: (1) the collapsing processconsists of two co-existing modes: an initial fast solid-like sliding and aslow surface granular flow; (2) the rolling rate in the surface flow is con-stant and the avalanchingmode depends on the sliding scale and also de-cays with time. The corresponding analytic solution (in red line) is alsoplotted in Fig. 10. It can be seen that the experimental and DEM simula-tion results all match well with the scaling law.
3.1.4. Flow rateFig. 11 shows the measured and DEM predicted dimensionless flow
rate Qout
� ffiffiffiffiffiffiffiffigd3
q� �against dimensionless time t⁎ for three chute slopes
(θ=0°, 5° and 10°). The flow rate Q out in this study was calculated fromthe particles flowing out of the chute. Both results match reasonablywell. The DEM simulation predicts the same trend as the experimentfor three chute slopes, but the predicted flow rates all are a bit largerthan the measured ones in the sliding stage (the difference b10%). Thismay be that the DEM simulation removed the lateral gate more quickly
1.0
1.0
=0 cm
=1.25cm
=2.5 cm
0.2 0.4 0.60.0
0.2 0.4 0.60.00
2
4
6
8
10
12
14
Y=0 cm
Y=1.25cm
Y=2.5 cm
d)0.5 v/(gd)0.5
=0.3 c)t*=0.5
rious locations for chute slope θ=10°: (a) t⁎=0.1; (b) t⁎=0.3; (c) t⁎=0.5.

v(y)/vs
0.0 0.2 0.4 0.6 0.8 1.0
y/h
0.0
0.1
0.2
0.3
0.4
0.5
0.6
0.7
0.8
0.9
1.0
PFC3D(wall)
Experiments(wall)
SSH rheology
Bagnold's rheology
PFC3D(center)
Fig. 15. Measured, DEM predicted and modelled normalized velocity profiles at thesidewall and centerline for three chute slopes.
130 H.T. Chou et al. / Powder Technology 231 (2012) 122–134
than the experiment did. This discrepancy should be further investigat-ed. The DEM simulation data can be described by Eq. (3) using curvefitting.
Qout
. ffiffiffiffiffiffiffiffigd3
q¼ α⋅t�e−β⋅t� ð3Þ
where α and β are constants depending on the inclination angle(α=13.9, β=−71.0 for θ=0°; α=14.6, β=−90.7 for θ=5°;α=14.5, β=−92.5 for θ=10° ; R2=0.91~0.97 for all cases). It shouldbe noted that the flow rate is related to the gate width, but this studykept the gate width constant (W=5 cm). In addition, three major flowstages on time series are also indicated in Fig. 11: initial solid-like sliding(t~τc or t⁎b0.06), granular transition (0.06b t⁎b0.20) and shallowfluid-like surface flow (0.20b t⁎b1.00). The transient granular behaviourin the chute is mainly in the surface flow regime, which constitutes 80%of the entire avalanching duration. The early sliding stage amounts tomerely about 6%. Since the energy is dissipated during particle collisions,the transient fluctuation on flow rate emerges mainly from the initialrapid failure and then reduces during the later surface flow. The influ-ence of inclination angle on the flow rate is also shown in Fig. 11. Thesteeper chute slope induces a greater scale of granular collapse and agreater flow rate in the initial solid-like sliding stage. The identificationof flow regimes may provide an insight into the inertia characteristicsof granular flows.
3.2. Internal flow characteristics from DEM simulation
3.2.1. Internal velocity profile and rheologyFigs. 12–14 show the DEMpredicted dimensionless velocity profiles
at different instants (t⁎=0.1, 0.3 and 0.5) and various locations (Y=0,1.25 and 2.5 cm) for chute slope θ=0°, 5° and 10°, respectively. TheDEM simulation results show a mixed velocity profile (convex profilenear the flowing surface and concave profile away from theflowing sur-face) at the center line in the early collapse stage (Figs. 12a, 13a and 14a,t⁎=0.1). The DEM simulations also show that the concave profile grad-ually transforms into a mixed velocity profile approaching to the centerof the chute, where the effect of wall friction is negligible. The necessarycondition for SSH rheology [22] is the existence of wall friction in thedense granular flow. The steeper chute slope enhances the formationof convex profile along the centerline for a longer time scale (Fig. 14b,t⁎=0.3, surface flow), whilst the velocity reveals a classic SSH or linearprofile due to the decreasingflowdepth (Figs. 12c, 13c and 14c, t⁎=0.5,shallow surface flow). The DEM results imply that even in such a nar-row chute (width=5 cm), the velocity profile at the centerline isquite different from that at the side wall.
Fig. 15 shows themeasured and DEM predicted normalized velocityprofiles (ν/νs) at the sidewall (Y=0 cm) for three chute slopes. TheDEM predicted profile is in line with the measured one. Both resultsshow a concave trend and can be described by the well-knownpower-law velocity profile (Eq. (4)), as presented by the solid bluecurve in Fig. 15.
v yð Þ=vs ¼ 1−y=hð Þη ð4Þ
where η=2.2 in this study. The index η slightly decreases as the time t⁎
increases and the influence of the inclination angle on η is negligiblehere. Thewell-knownBagnold's velocity profile (η=1.5) [23] is not suit-ablewhen the sidewall effect is appreciable. All of themeasured andpre-dicted velocity profiles at the sidewall (Y=0 cm) during collapse aresubstantially different from that given by Bagnold's rheology (the convexprofile in Fig. 15). Since theflow configuration in this study is strongly af-fected by sidewall friction, SSH rheology should be more appropriatethan Bagnold's rheology. The normalized velocity profile at the center-line (Y=2.5 cm) from DEM simulation is also plotted in Fig. 15, whichalso deviates from the SSH behavior. There is an inflection point located
at near y/h=0.3 along depth, indicating that the effect of wall frictionvanishes gradually away from the sidewalls.
The predicted 3D dimensionless velocity distributions along depth forthree chute slopes are plotted in Fig. 16. The cross-sectional velocity pro-files at free surface (y/h=0) exhibit parabolic distributions in the transi-tion stage or even in the early surface flow stage (t⁎=0.1 and 0.3).Recalling the velocity profiles at the center line in Figs. 12–15, the velocitydistribution transforms fromamixedpattern (anupper convex and lowerconcave pattern) to a fully concave patternwith the increasing time for allthree chute slopes. Moreover, by comparison with the chutes with θ=0°and θ=5°, the chutewith θ=10° has a thicker flowing layer and the cor-responding parabolic cross-sectional velocity profile lasts longer(Fig. 16c). The granular bed with a larger inclination angle possesses thelarger down slope force and consequently triggers a thicker and fasterflow.
Fig. 17 compares the flow characteristics between at the sidewall(Y=0 cm) and at the centerline (Y=2.5 cm) for the chute slope withθ=10°. The corresponding profiles for dimensionless velocityv=
ffiffiffiffiffiffigd
p� �, shear rate (γ=dν/dy) and packing fraction (ϕ) are plotted
at different instants. These profiles in both locations are quite differentin the earlier flow stage, but both exhibit a similar pattern in the later sur-face flow stage (t⁎~0.5). The maximum shear rate emerges typically atfree surface for a thickerflowon the frictional sidewall but occurs beneaththe top surface in a central region (see Fig. 17b and e). The packing frac-tion also shows a noticeable difference in the flowing layer (as shown inFig. 17c and f, y/d≤5) between both locations. The smaller solid fractionnear free surface at the centerline (Y=2.5 cm) indicates a faster flowingvelocity as shown in Fig. 17a and d.
In summary, particle collision and sidewall friction contribute torheological behavior of granular materials and consequently affectthe velocity profile. Both Bagnold's rheology [23–26] and SSH rheol-ogy (sidewall-stabilized heap or super stable heap) [22] are widelyreported in the literature. For a wide channel, Bagnold's velocity pro-file following the relationship v∝h3/2 is often observed for thickflows. The sidewall-stabilized heap, which usually occurs in a narrowand sidewall frictional system, is characterized by a quasi-static deepregion beneath the flowing layer. The remarkable differences be-tween Bagnold's rheology and SSH rheology is summarized inTable 3. The main features are as follows: (1) Bagnold's rheology

Fig. 16. DEM predicted dimensionless velocity distributions for three chute slopes: (a) θ=0°; (b) θ=5°; (c) θ=10°.
131H.T. Chou et al. / Powder Technology 231 (2012) 122–134
usually shows a bulk flow and the slipping on the bottom [26], whilstSSH rheology indicates a shallow flow; (2) The solid fraction inBagnold's rheology is uniform except near the static region, whereasthe packing profile in SSH rheology demonstrates a drastic decreasenear free surface. The two rheology models for granular flow can bedetermined by a dimensionless parameter ξ [7,22], as expressed inEq. (5).
ξ ¼ μwhμpW
ð5Þ
where μw and μp are the effective particle-wall and inter-particle frictioncoefficients, respectively; W is the channel width ; h is the flow depth.The physical meaning for ξ is the competition of the wall friction to theflow inertia. When ξ>>1 or ~1 (as h/W increases), the granular flowdevelops toward SSH rheology with a concave velocity profile. On theother hand, the granular flow approaches to Bagnold's rheology with aconvex velocity profile when ξbb1 (as h/W decreases). An intermediate
transition regime occurs between both rheologies. This concept is also il-lustrated in Fig. 18. The similar concept (the ratio of h/W) was confirmedin other researchers’ studies [27,28].
According to the experimental data and DEM simulations, the granu-lar flow in the chute follows the SSH rheology and intermediate transi-tion, as shown in Fig. 18, which is in line with Bi's criterion (2005)based on adimensionless parameter ξ [7,17,22]. A concave velocity profileis observed in theflatter chutewith θ=0° (as describedbyEq. (4) or illus-trated in Fig. 19a) and follows SSH rheology since wall friction dominatesthe flow system. As the inclination angle increases, the flow transformsfrom SSH to intermediate transition, especially in the central part of thechute. In Fig. 19b, the central region depicts amixed-layer velocity profilewith distinct dynamic characteristics: upper collisional layer and lowerfrictional layer. In the collisional layer, the particles collide more violentlywith each other and the collision is characterized by shorter contact dura-tion. The collisional layer has a lower solid packing fraction in the centralregion of the chute, as shown in Fig. 17f. On the contrary, the frictionallayer gives a greater packing fraction and frictional collision. As shown

velocity
y/d
0
2
4
6
8
10
12
t*=0.1
t*=0.3
t*=0.5
y/d
0
2
4
6
8
10
12
t*=0.1
t*=0.3
t*=0.5
d)Y=2.5 cm
a)Y=0 cm
shear rate packing fraction
0
2
4
6
8
10
12
t*=0.1
t*=0.3
t*=0.5
0
2
4
6
8
10
12
t*=0.1
t*=0.3
t*=0.5
e)Y=2.5 cm
0
2
4
6
8
10
12
t*=0.1
t*=0.3
t*=0.5
0 1 2
0 1 2
0 4 8 12 16 20
0 4 8 12 16 20
0.0 0.2 0.4 0.6
0.0 0.2 0.4 0.6
0
2
4
6
8
10
12
t*=0.1
t*=0.3
t*=0.5
f)Y=2.5 cm
v/(gd)0.5 γ φ
b)Y=0 cm c)Y=0 cm
Fig. 17. DEM predicted dimensionless velocity, shear rate and packing fraction along depth at the sidewall (Y=0 cm) and centerline (Y=2.5 cm) for the chute slope θ=10°.
2.5
3.0
d=5.8mm(sidewall, exp)
d=5.8mm(sidewall, PFC)
SSH rheologyBagnold rheology
132 H.T. Chou et al. / Powder Technology 231 (2012) 122–134
in Fig. 19b, there is an inflection point existing between the collisional andfrictional layers. The granular flow is affected primarily by dispersiveshear stress above the inflection point (ybhinf) and reveals a convex ve-locity profile. The velocity profile in the collisional layer can be describedby Eq. (6), which is modified from Su's equation [29].
v y; tð Þ ¼ 2κ3
h−hcð Þ1:5− y= h−hcð Þð Þ1:5h i
ybh inf ð6Þ
where κ and hc are model constants; hinf is the depth of inflection pointfrom the surface. Both dispersive shear stress and friction resistance si-multaneously dominate themotion of granularmaterial below the inflec-tion point (y>hinf), so the velocity profile shows a concave pattern. The
Table 3Comparison between Bagnold's rehology and SSH rehology.
Characteristics Bagnold's rheology SSH rehology
Flow depth, h The flow occupies the entiredepth.
The flow occurs in very deep ornarrow channel and the flowinglayer is always thinner thanthat in the static region.
Velocityprofile, ν(y)
v∝h3/2, a linear (thinnerflow) or an exponential(deeper flow) tail exists.
v(y)=vsexp(−y/λ), with anexponential tail near thestatic zone.
densityprofile, ϕ
A uniform packing fractionprofile along depth.
A decreasing packing fractionprofile near the free surface.
flow rate, Q Q∝h5/2 Q∝(h−hjam)sidewall effect Very minor influence Significant influenceLimitation The model is not suitable for
the flatter chute slope andnarrow channel.
The model fails in W≤5d dueto arching effect.
velocity profile in the frictional layer can still be described by Eq. (4)when y>hinf. Generally, the intermediate regime can be regarded as atransition from SSH rheology to Bagnold's rheology. If the chute is wide
0.0 0.2 0.4 0.6 0.8 1 1.2
1.0
1.5
2.0
intermediate transition 0o
5o
=10o
η=1
Fig. 18. Index η versus dimensionless number ξ for granular flow.

Fig. 19. Illustrations of velocity profiles at the sidewall and at the centerline of the chute: (a) exponential profile; (b) mixed profile.
133H.T. Chou et al. / Powder Technology 231 (2012) 122–134
enough, the upper part of velocity profile in the central region may ap-proach to the Bagnold's profile.
3.2.2. Angular velocity profileIn fact, particle movement also involves particle rotation as well as
particle translation and the granular velocity hence includes the trans-lational velocity and angular velocity. Particle rotation is an essentialindex in identifying shear bands [30,31] and can play a significant rolein a vibrated granular bed [32]. The angular velocity was scrutinizedhere to more deeply understand the falling process of dry granularsteps. Fig. 20 shows the DEM predicted normalized angular velocityprofiles (ωX=
ffiffiffiffiffiffiffiffig=d
p, ωY=
ffiffiffiffiffiffiffiffig=d
pand ωZ=
ffiffiffiffiffiffiffiffig=d
p) about X, Y and Z axes at
t⁎=0.1 for the chute slopewith θ=0°. The normalized angular velocityprofiles at different locations from the sidewall to the centerline (Y=0,1.25 and 2.5 cm) are shown in the figure. The center line shows a great-er Y-directional angular velocity than the other locations (Fig. 20b). Themixed profile is similar to the corresponding translational velocity pro-file (Fig. 12a) and this is attributed to the fading of the sidewall frictioneffect. The Z-directional angular velocity at the sidewall ismuch greaterthan those at the other locations. This may imply that when the particlesin contactwith the sidewalls begin toflow into the central part of the nar-row chute, the frictional force causes them to rotate about Z axis (μw>μpin the study). In addition, the angular velocity about X axis (parallel toflow direction) is much smaller than those about Y and Z axes(ωX~0.1ωZ), as shown in Fig. 20a.
The DEMpredicted angular velocities about Y axis against dimension-less time for three chute slopes are shown in Fig. 21. Three kinds of flowstages (solid-like sliding, granular transition and shallowfluid-like surfaceflow) are indicated in the figure. The Y-directional angular velocities in-crease rapidly with time during the sliding stage and then reach a
0
2
4
6
8
10
b) y
ωx /(g/d)0.5 ωy /(g0.0 0.1 0.20.00 0.02 0.04 0.06 0.08 0.10
y/d
0
2
4
6
8
10
Y=0 cmY=1.25 cmY=2.5 cm
a) x-axis
Fig. 20. DEM predicted normalized rotational velocity profiles along X, Y and Z direction a
maximum in the transition stage. A lump of granular assembly was ob-served to slide on the slip surface and the sliding stage immediately trans-forms into a granular transition collapse with translational and rollingmotion. The steeper chute slope induces a greater scale of granular col-lapse as well as a greater angular velocity. The evolution of angular veloc-ity also displays a similar trend to that of the flow rate but with a time lag(~0.09 tf).
4. Conclusions
A rigorous discrete element simulation has been presented to inves-tigate the falling process of dry granular steps. The corresponding phys-ical experiments with different chute slopes were conducted in ourprevious study. The contact force model, critical time step, particle gen-eration and input parameters in the discrete element modelling werecarefully defined. The key DEM model parameters were obtained bylaboratory tests. The flow regime, surface profile, final deposit angle, ve-locity profile at the sidewall, receding upper granular surface and flowrate during collapse have been evaluated. Comparisons between DEMsimulations and physical experiments have been made, which providea quantitative validation for the DEM simulation. The DEM simulationhas further been employed to probe the translational velocity profilesand angular velocity profiles inside the granular assembly. The mainfindings are summarized below.
(1) The sidewall friction affects the velocity profile at the top ofmainflowing layer and vanishes gradually while deviating from thesidewalls.
(2) The central part of the chute displays a mixed velocity pro-file, whereas the sidewall shows a SSH velocity profile. An
Y=0 cmY=1.25 cmY=2.5 cm
-axis
0
2
4
6
8
10
Y=0 cmY=1.25 cmY=2.5 cm
c) z-axis
/d)0.5 ωz /(g/d)0.50.3 0.4 0.5 0.0 0.2 0.4 0.6 0.8
t t⁎=0.1 for the chute slope with θ=0°: (a) ωX=ffiffiffiffiffiffiffiffig=d
p; (b) ωY=
ffiffiffiffiffiffiffiffig=d
p; (c) ωZ=
ffiffiffiffiffiffiffiffig=d
p.

t*0.0 0.1 0.2 0.3 0.4 0.5 0.6 0.7 0.8 0.9 1.0
ωy
/(g/
d)0.
5
0.00
0.02
0.04
0.06
0.08
0.10
0.12
0.14
PFC_θ=0o
θ=5o
θ=10o
PFC_
PFC_
solid
slid
ing
transition surface flow
Fig. 21. DEM predicted evolution of normalized rotational velocity about Y axis against dimensionless time for three chute slopes.
134 H.T. Chou et al. / Powder Technology 231 (2012) 122–134
intermediate transition is corroborated between SSH andBagnold's regimes, which is characterized by an upper convexand lower concave velocity profile.
(3) The chute inclination enhances the changes from the SSH rhe-ology to the intermediate transition.
(4) The evolution of particle angular velocity with time exhibits asimilar trend to that of the flow rate but with a time delay.
The DEM simulation not only confirms the experimental observationbut also enhances the understanding of the falling process of dry granularsteps.
Acknowledgment
The authors would like to thank the National Science Council ofthe Republic of China, Taiwan, for financially supporting this re-search under Grant No. NSC-99-2625-M-008-007 and Grant No.NSC 99-2221-E-253-007.
References
[1] G. Lube, H.E. Huppert, R.S.J. Sparks, A. Freundt, Static and flowing regions in granularcollapses down channels, Physics of Fluids 19 (2007) 043301.
[2] N.J. Balmforth, R.R. Kerswell, Granular collapse in two dimensions, Journal ofFluid Mechanics 538 (2005) 399–428.
[3] E. Lajeunesse, J.B. Monnier, G.M. Homsy, Granular slumping on a horizontal surface,Physics of Fluids 17 (2005) 103302.
[4] L. Lacaze, J.C. Phillips, R.R. Kerswell, Planar collapse of a granular column: experimentsand discrete element simulations, Physics of Fluids 20 (2008) 063302.
[5] L. Staron, E.J. Hinch, Study of the collapse of granular columns using two-dimensionaldiscrete-grain simulation, Journal of Fluid Mechanics 545 (2005) 1–27.
[6] R. Zenit, Computer simulations of the collapse of a granular column, Physics ofFluids 17 (2005) 031703.
[7] W. Bi, R. Delannay, P. Richard, N. Taberlet, V. Alexandre, Two and three dimensionalconfinedgranular chuteflows: experimental andnumerical results, Journal of Physics:Condensed Matter 17 (2005) 2457–2480.
[8] N. Taberlet, P. Richard, R. Delannay, The effect of sidewall friction on dense granularflows, Computers & Mathematics with Applications 55 (2008) 230–234.
[9] L. Lacaze, R.R. Kerswell, Axisymmetric granular collapse: a transient 3D flow testof viscoplasticity, Physical Review Letters 102 (2009) 108305.
[10] P.A. Cundall, O.D.L. Strack, Discrete numerical-model for granular assemblies,Geotechnique 29 (1979) 47–65.
[11] Y. Tsuji, T. Tanaka, T. Ishida, Lagrangian numerical-simulation of plug flow ofcohesionless particles in a horizontal pipe, Powder Technology 71 (1992)239–250.
[12] C. Thornton, C.W. Randall, Applications of theoretical contact mechanics to solidparticle system simulation, in: M. Satake, J.T. Jenkins (Eds.), Micromechanics ofGranular Materials, Elsevier, Amsterdam, 1988, pp. 133–142.
[13] Y.C. Chung, J.Y. Ooi, A study of influence of gravity on bulk behaviour of particulatesolid, Particuology 6 (2008) 467–474.
[14] Y.C. Chung, J.Y. Ooi, Influence of discrete element model parameters on bulk behaviourof a granular solid under confined compression, Particulate Science and Technology 26(2008) 83–96.
[15] Itasca Consulting Group Inc., PFC3D — Particle Flow Code in three Dimensions,Minneapolis, USA, 2010.
[16] Y.C. Chung, J.Y. Ooi, Benchmark tests for verifying discrete element modellingcodes at particle impact level, Granular Matter 13 (2011) 643–656.
[17] H.T. Chou, C.F. Lee, Falling process of a rectangular granular step, Granular Matter13 (2011) 39–51.
[18] H. Capart, D.L. Young, Y. Zech, Voronoï imaging methods for the measurement ofgranular flows, Experiments in Fluids 32 (2002) 121–135.
[19] Y.C. Chung, Discrete element modelling and experimental validation of a granularsolid subject to different loading conditions, PhD Thesis, University of Edinburgh,Edinburgh, UK, 2006.
[20] S.C. du Pont, R. Fischer, P. Gondret, B. Perrin, M. Rabaud, Instantaneous velocityprofiles during granular avalanches, Physical Review Letters 94 (2005) 048003.
[21] A.V. Orpe, D.V. Khakhar, Rheology of surface granular flows, Journal of Fluid Mechanics571 (2007) 1–32.
[22] N. Taberlet, P. Richard, A. Valance, W. Losert, J.M. Pasini, J.T. Jenkins, R. Delannay,Superstable granular heap in a thin channel, Physical Review Letters 91 (2003)(264301-1-4).
[23] R.A. Bagnold, Experiments on a gravity-free dispersion of large solid spheres in aNewtonian fluid under shear, Proceedings of the Royal Society of London Series A225 (1954) 49–63.
[24] L.E. Silbert, D. Ertaş, G.S. Grest, T.C. Halsey, D. Levine, S.J. Plimpton, Granular flowdown an inclined plane: Bagnold scaling and rheology, Physical Review E 64(2001) 051302.
[25] GDR MiDi, On dense granular flow, European Physical Journal E 14 (2004)341–365.
[26] N. Taberlet, P. Richard, J.T. Jenkins, R. Delannay, Density inversion in rapid granularflows: the supported regime, European Physical Journal E 22 (2007) 17–24.
[27] P. Jop, Y. Forterre, O. Pouliquen, A constitutive law for dense granular flows, Nature441 (2006) 72730.
[28] C.J. Cawthorn, A constitutive law for granular flows: Predicting the appearance ofstatic zones, Smith-Knight/Rayleigh-Knight Essay, 2008.
[29] C.G. Su, H.P. Lien, Y.C. Chiang, Study on the velocity distribution of debris flow,Journal of Chinese Soil and Water Conservation 24 (1993) 75–82 (in Chinese).
[30] D.M. Mueth, G.F. Debregeas, G.S. Karczmar, P.J. Eng, S.R. Nagel, H.M. Jaeger, Signaturesof granular microstructure in dense shear flows, Nature 406 (2000) 385–389.
[31] M. Oda, K. Iwashita, Study on couple stress and shear band development in granularmedia based on numerical simulation analyses, International Journal of EngineeringScience 38 (2000) 1713–1740.
[32] Y.C. Chung, S.S. Hsiau, H.H. Liao, J.Y. Ooi, An improved PTV technique to evaluatethe velocity field of non-spherical particles, Powder Technology 202 (2010)151–161.