Embed Size (px)
Citation preview
ARTICLE
Discovery of biomarkers for glycaemic deteriorationbefore and after the onset of type 2 diabetes: rationaleand design of the epidemiological studieswithin the IMI DIRECT Consortium
Robert W. Koivula & Alison Heggie & Anna Barnett & Henna Cederberg & Tue H. Hansen &
Anitra D. Koopman & Martin Ridderstråle & Femke Rutters & Henrik Vestergaard &
RamneekGupta & SannaHerrgård &MartijnW.Heymans &MandyH. Perry & SimoneRauh &
Maritta Siloaho & Harriet J. A. Teare & Barbara Thorand & Jimmy Bell & Søren Brunak &
Gary Frost & Bernd Jablonka & Andrea Mari & Tim J. McDonald & Jacqueline M. Dekker &
Torben Hansen & Andrew Hattersley & Markku Laakso & Oluf Pedersen & Veikko Koivisto &
Hartmut Ruetten & Mark Walker & Ewan Pearson & Paul W. Franks &
for the DIRECT Consortium
Received: 17 December 2013 /Accepted: 24 February 2014 /Published online: 4 April 2014# The Author(s) 2014. This article is published with open access at Springerlink.com
AbstractAims/hypothesis The DIRECT (Diabetes Research on PatientStratification) Study is part of a EuropeanUnion Framework 7Innovative Medicines Initiative project, a joint undertakingbetween four industry and 21 academic partners throughout
Europe. The Consortium aims to discover and validate bio-markers that: (1) predict the rate of glycaemic deteriorationbefore and after type 2 diabetes onset; (2) predict the responseto diabetes therapies; and (3) help stratify type 2 diabetes intoclearly definable disease subclasses that can be treated more
Mark Walker, Ewan Pearson and Paul W. Franks contributed equally tothis work.
Electronic supplementary material The online version of this article(doi:10.1007/s00125-014-3216-x) contains peer-reviewed but uneditedsupplementary material, which is available to authorised users.
R. W. Koivula : P. W. Franks (*)Department of Clinical Sciences, Lund University, Genetic andMolecular Epidemiology, CRC, Skåne University Hospital Malmö,Building 91, Level 10, Jan Waldenströms gata 35,SE-205 02 Malmö, Swedene-mail: [email protected]
A. Heggie :M. Walker (*)Institute of Cellular Medicine (Diabetes), The Medical School,Newcastle University, Framlington Place,Newcastle upon Tyne NE2 4HH, UKe-mail: [email protected]
A. Barnett : E. Pearson (*)Division of Cardiovascular & Diabetes Medicine, Medical ResearchInstitute, University of Dundee, Dundee DD1 9SY, UKe-mail: [email protected]
H. Cederberg :M. Siloaho :M. LaaksoDepartment of Medicine, University of Eastern Finland and KuopioUniversity Hospital, Kuopio, Finland
T. H. Hansen :H. Vestergaard : T. Hansen :O. PedersenThe Novo Nordisk Foundation Center for Basic Metabolic Research,Section of Metabolic Genetics, Faculty of Health Sciences,University of Copenhagen, Copenhagen, Denmark
A. D. Koopman : F. Rutters :M. W. Heymans : J. M. DekkerDepartment of Epidemiology and Biostatistics,VUmc, Amsterdam, the Netherlands
A. D. Koopman : F. Rutters :M. W. Heymans : S. Rauh :J. M. DekkerEMGO+ Institute for Health and Care Research,VUmc, Amsterdam, the Netherlands
M. RidderstråleDepartment of Clinical Sciences, Clinical Obesity,Skåne University Hospital Malmö,Malmö, Sweden
M. RidderstråleSteno Diabetes Center, Gentofte, Denmark
Diabetologia (2014) 57:1132–1142DOI 10.1007/s00125-014-3216-x

effectively than without stratification. This paper describestwo new prospective cohort studies conducted as part ofDIRECT.Methods Prediabetic participants (target sample size2,200–2,700) and patients with newly diagnosed type 2diabetes (target sample size ~1,000) are undergoing detailedmetabolic phenotyping at baseline and 18 months and36 months later. Abdominal, pancreatic and liver fat isassessed using MRI. Insulin secretion and action are assessedusing frequently sampled OGTTs in non-diabetic participants,and frequently sampled mixed-meal tolerance tests in patientswith type 2 diabetes. Biosamples include venous blood, fae-ces, urine and nail clippings, which, among other biochemicalanalyses, will be characterised at genetic, transcriptomic,metabolomic, proteomic and metagenomic levels. Lifestyleis assessed using high-resolution triaxial accelerometry, 24 hdiet record, and food habit questionnaires.Conclusions/interpretation DIRECT will yield an unprece-dented array of biomaterials and data. This resource, availablethrough managed access to scientists within and outside theConsortium, will facilitate the development of new treatmentsand therapeutic strategies for the prevention and managementof type 2 diabetes.
Keywords Epigenetic . Gene–environment interaction .
Genome . Glycaemic control . Lifestyle . Microbiome .
Prediabetes . Proteome . Transcriptome . Type 2 diabetes
AbbreviationsDIRECT Diabetes Research on Patient StratificationEU European UnionfsOGTT Frequently sampled OGTTIMI Innovative Medicines InitiativeMMTT Mixed-meal tolerance testWP2 Glycaemic deterioration work package
Introduction
Type 2 diabetes is a highly prevalent disease that is usuallypreceded by four pathophysiological phases: (1) a graduallyaccumulating resistance to the peripheral effects of insulin oncellular glucose transportation; (2) a compensatory rise inendogenous insulin secretion; (3) a progressive failure of betacell function; (4) a corresponding loss of glycaemic controlthat eventually manifests as type 2 diabetes. The order of these
R. Gupta : S. Herrgård : S. BrunakCenter for Biological Sequence Analysis, Department of SystemsBiology, Technical University of Denmark,Kongens Lyngby, Denmark
M. H. Perry : T. J. McDonaldNIHR Exeter Clinical Research Facility, University of Exeter,Exeter, UK
M. H. Perry : T. J. McDonaldBlood Sciences, Royal Devon and Exeter NHS Foundation Trust,Exeter, UK
H. J. A. TeareHeLEX, Nuffield Department of Population Health,University of Oxford, Oxford, UK
B. ThorandInstitute of Epidemiology II, Helmholtz ZentrumMuenchen, GermanResearch Center for Environmental Health (GmbH),Neuherberg, Germany
B. ThorandGerman Center for Diabetes Research (DZD), Neuherberg, Germany
J. BellMetabolic and Molecular Imaging Group, MRC Clinical ScienceCentre, Imperial College Hammersmith Campus, London, UK
G. FrostDivision of Endocrinology and Metabolism, Nutrition and DieteticResearch Group, Imperial College London, London, UK
B. Jablonka :H. RuettenSanofi-Aventis Deutschland GmbH, R&D,Frankfurt am Main, Germany
A. MariInstitute of Biomedical Engineering, National Research Council,Padova, Italy
T. HansenFaculty of Health Sciences, University of Southern Denmark,Odense, Denmark
A. HattersleyGenetics of Complex Traits,University of Exeter Medical School,Exeter, UK
A. HattersleyGenetics of Diabetes, University of Exeter Medical School,Exeter, UK
O. PedersenHagedorn Research Institute, Gentofte, Denmark
O. PedersenInstitute of Biomedical Science,Faculty of Health Sciences, University of Copenhagen,Copenhagen, Denmark
V. KoivistoEli Lilly & Company, Helsinki, Finland
P. W. FranksDepartment of Nutrition, Harvard School of Public Health,Boston, MA, USA
P. W. FranksDepartment of Public Health & Clinical Medicine,Section for Medicine, Umeå University Hospital,Umeå, Sweden
Diabetologia (2014) 57:1132–1142 1133
phases can differ, with the primordial defect in certain high-risk populations appearing to be at the level of the pancreaticbeta cell rather than in peripheral cells [1]. In patients withtype 2 diabetes, clinical interventions initially focus onregaining glucose homeostasis through lifestyle-inducedweight loss and/or with pharmacotherapies designed to reducehepatic glucose production (e.g. metformin), enhance beta cellfunction (e.g. sulfonylureas), reduce glycogen concentrations(e.g. gliptins) or sensitise peripheral cells to the effects ofinsulin (e.g. thiazolidinediones). Each therapy is designed todirectly or indirectly enhance the function of the remainingbeta cells and/or improve insulin action; however, beta cellmass and function usually continue to decline after the therapyis initiated and thereafter the therapy’s effectiveness lessens asthe time since diagnosis increases. Indeed, roughly 25% ofpatients with type 2 diabetes require exogenous insulin within6 years of diagnosis, and 42% within 10 years [2].
Although the diagnosis of type 2 diabetes is straightfor-ward, determined primarily on the basis of elevated bloodglucose concentrations, it is a diagnosis of exclusion, suchthat it is diagnosed when no other plausible cause is known.Patients vary greatly in their clinical characteristics, treatmentrequirements, rate of glycaemic deterioration, and susceptibil-ity to diabetic complications. As we discover more about theaetiology of diabetes, it is likely that this group with ‘type 2diabetes’ will be reclassified into other subclasses of diabeteswith different pathophysiologies. If these pathophysiologicalsubclasses could be identified before or around the time ofdiagnosis, this information might help facilitate targeted inter-ventions, which in turn might lead to improved treatmenteffectiveness, a reduction in unnecessary side effects, lesscostly treatments, better patient adherence to treatments, andimproved quality of life. The identification of biomarkers thataid therapeutic targeting in prediabetes (Study 1) or early-onset type 2 diabetes (Study 2) is a major innovative objectiveof the DIRECT (Diabetes Research on Patient Stratification)Consortium. The term ‘prediabetic’ is used in our paper be-cause the target population of Study 1 was identified using arisk prediction algorithm that explicitly seeks to identify menand womenwho are in the prediabetic blood glucose or HbA1c
ranges and who are at elevated risk of rapid glycaemic dete-rioration (seeMethods). Therefore, whilst many persons with-in the general population who are defined to have ‘prediabetic’levels of blood glucose will regress to normal glycaemia, mostin the Study 1 population are, by selection, likely to go on todevelop diabetes. We use the term ‘prediabetes’ with thisassumption from hereon.
The DIRECT Consortium was formed under the banner ofthe Innovative Medicines Initiative (IMI), a joint undertakingbetween the European Union (EU), European academic insti-tutions and pharmaceutical companies that forms part of theSeventh Framework Programme (FP7). The overarching ob-jectives of the DIRECTConsortium are to identify biomarkers
that address current bottlenecks in diabetes drug developmentand to develop a stratified medicines approach to treatment oftype 2 diabetes with either existing or novel therapies. TheDIRECT Consortium seeks to address two key areas in whichimprovements in diabetic medicine are required: (1) the rate atwhich peoples’ glycaemic control deteriorates either fromprediabetes to type 2 diabetes or through type 2 diabetes withincreasing treatment requirements; (2) the extent to whichcertain therapeutic interventions (either pharmacological orsurgical) result in improved glycaemic control.
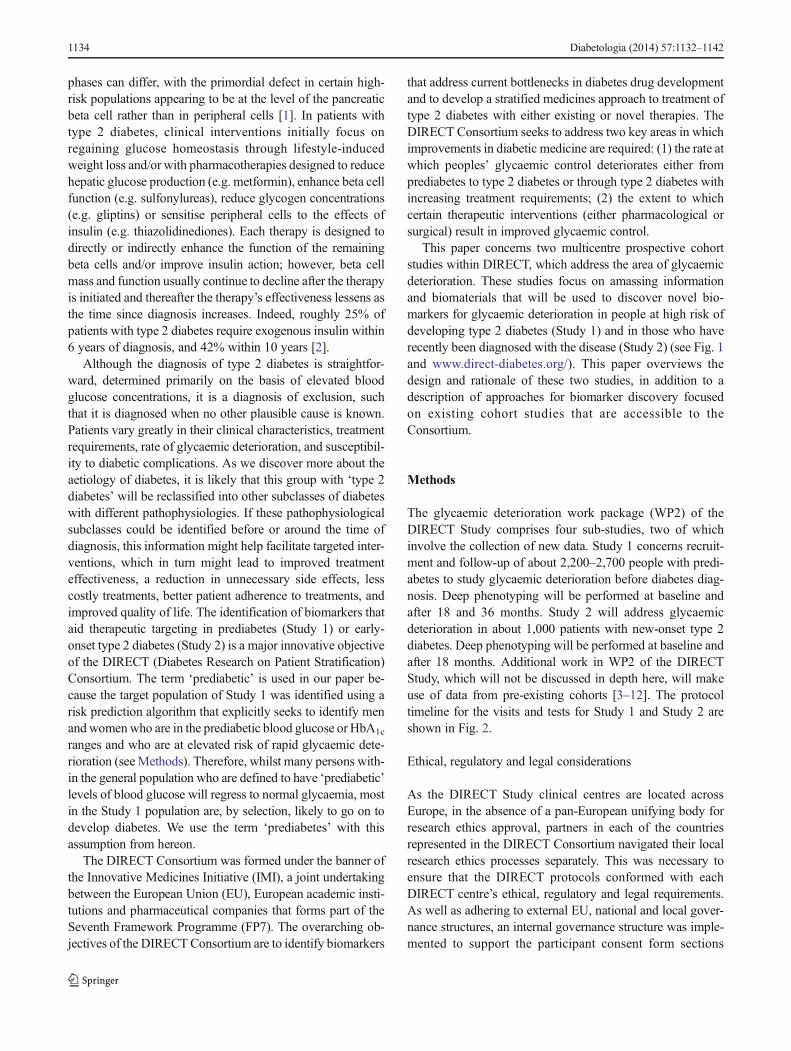
This paper concerns two multicentre prospective cohortstudies within DIRECT, which address the area of glycaemicdeterioration. These studies focus on amassing informationand biomaterials that will be used to discover novel bio-markers for glycaemic deterioration in people at high risk ofdeveloping type 2 diabetes (Study 1) and in those who haverecently been diagnosed with the disease (Study 2) (see Fig. 1and www.direct-diabetes.org/). This paper overviews thedesign and rationale of these two studies, in addition to adescription of approaches for biomarker discovery focusedon existing cohort studies that are accessible to theConsortium.
Methods
The glycaemic deterioration work package (WP2) of theDIRECT Study comprises four sub-studies, two of whichinvolve the collection of new data. Study 1 concerns recruit-ment and follow-up of about 2,200–2,700 people with predi-abetes to study glycaemic deterioration before diabetes diag-nosis. Deep phenotyping will be performed at baseline andafter 18 and 36 months. Study 2 will address glycaemicdeterioration in about 1,000 patients with new-onset type 2diabetes. Deep phenotyping will be performed at baseline andafter 18 months. Additional work in WP2 of the DIRECTStudy, which will not be discussed in depth here, will makeuse of data from pre-existing cohorts [3–12]. The protocoltimeline for the visits and tests for Study 1 and Study 2 areshown in Fig. 2.
Ethical, regulatory and legal considerations
As the DIRECT Study clinical centres are located acrossEurope, in the absence of a pan-European unifying body forresearch ethics approval, partners in each of the countriesrepresented in the DIRECT Consortium navigated their localresearch ethics processes separately. This was necessary toensure that the DIRECT protocols conformed with eachDIRECT centre’s ethical, regulatory and legal requirements.As well as adhering to external EU, national and local gover-nance structures, an internal governance structure was imple-mented to support the participant consent form sections
1134 Diabetologia (2014) 57:1132–1142
relating to privacy, data sharing and data security, which wereestablished in consultation with all DIRECT partners. A com-mittee was established to develop policies relating to thehandling of samples and data. To ensure that participantprivacy and data security standards are maintained, whilenot unnecessarily impeding the research process and ensuringequity for all research partners, a Data Access Committeemade up of Consortium members was formed, which isresponsible for reviewing, approving and enabling access todata by research partners.
Methods common to Study 1 and Study 2
Anthropometric and blood pressure
All measurement procedures are standardised across studysites and performed by trained nurses or research assistants.
Height is measured using calibrated wall-mountedstadiometers, weight using calibrated scales, and waist, hip,thigh and calf circumferences using non-stretchable measur-ing tapes. Blood pressure is measured using calibrated manual(or automatic) sphygmomanometers with an appropriatelysized arm cuff; three seated measures are recorded in eachparticipant. Some centres also estimate body compositionusing bioimpedance scales, although this is not a requirementof the core protocol.
Blood omics
Fasting blood samples are taken in both studies for genomic,epigenomic, transcriptomic, proteomic and metabolomicassessments. These analyses are carried out to allow systems-based investigations, which will be a major feature of theDIRECT Study [13]. A variety of omics data will be generated
CORE;MMTT
Fasting blood;anthropometry
-6m-12 to -3y -3m 18m 36ma-7 to -1y 0m 9m
CORE;fsOGTT
CORE;fsOGTT
CORE;fsOGTT
CORE;MMTT
Study 1
Study 2
Cohort data assimilation
Cohort data assimilation
Risk data scoring
Recruitment
Screening HbA1c
HbA1c
HbA1c
HbA1c
HbA1c
HbA1c
HbA1c
HbA1c
HbA1c
Cohor
t dat
a as
simila
tion
Recru
itmen
t
Scree
ning
Risk d
ata
scor
ingU-CP
U-CPU-CP
U-CPU-CP
U-CPU-CP
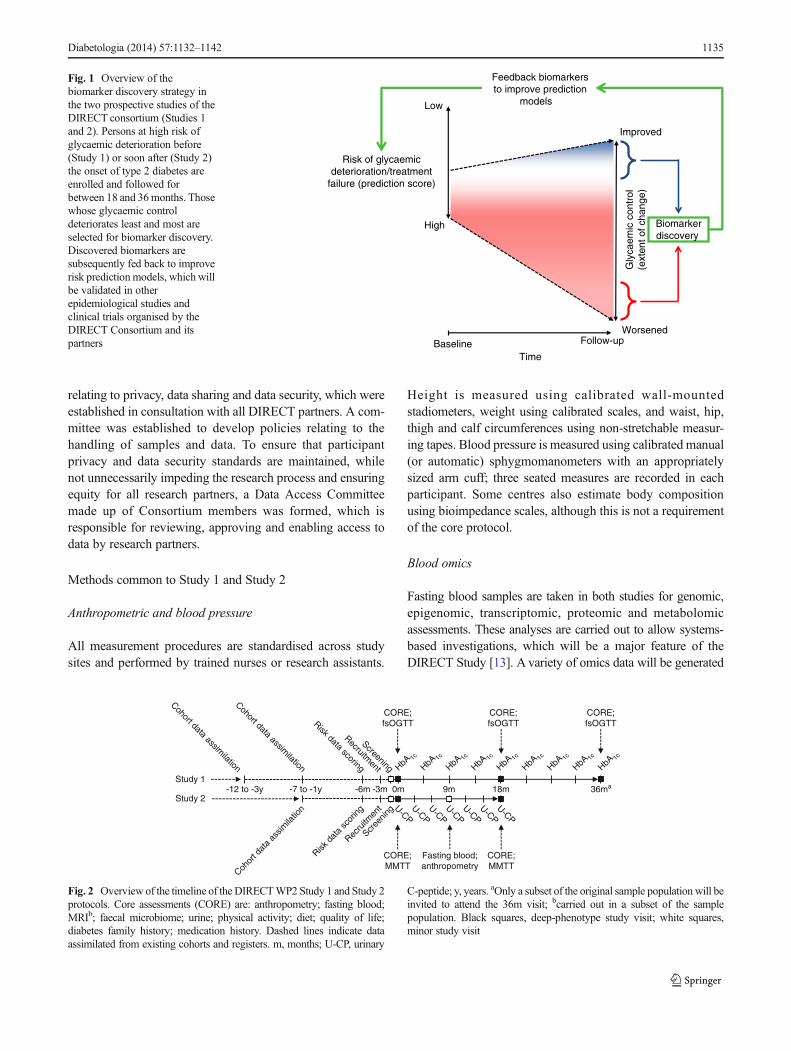
Fig. 2 Overview of the timeline of the DIRECTWP2 Study 1 and Study 2protocols. Core assessments (CORE) are: anthropometry; fasting blood;MRIb; faecal microbiome; urine; physical activity; diet; quality of life;diabetes family history; medication history. Dashed lines indicate dataassimilated from existing cohorts and registers. m, months; U-CP, urinary
C-peptide; y, years. aOnly a subset of the original sample population will beinvited to attend the 36m visit; bcarried out in a subset of the samplepopulation. Black squares, deep-phenotype study visit; white squares,minor study visit
Improved
Worsened
TimeBaseline Follow-up
Risk of glycaemicdeterioration/treatment
failure (prediction score)
Low
High Biomarkerdiscovery
Feedback biomarkersto improve prediction
models
Gly
caem
ic c
ontr
ol(e
xten
t of c
hang
e)
Fig. 1 Overview of thebiomarker discovery strategy inthe two prospective studies of theDIRECT consortium (Studies 1and 2). Persons at high risk ofglycaemic deterioration before(Study 1) or soon after (Study 2)the onset of type 2 diabetes areenrolled and followed forbetween 18 and 36months. Thosewhose glycaemic controldeteriorates least and most areselected for biomarker discovery.Discovered biomarkers aresubsequently fed back to improverisk prediction models, which willbe validated in otherepidemiological studies andclinical trials organised by theDIRECT Consortium and itspartners
Diabetologia (2014) 57:1132–1142 1135

with validated methods to be defined in subsequent studiesdepending on the hypotheses being tested. The omics methodsused will hence be described in detail in subsequent papers.
Beta cell function and insulin sensitivity
Beta cell function and insulin sensitivity will be assessedusing validated modelling methods based on an OGTT or amixed-meal tolerance test (MMTT), as well as empiricalindices [14, 15].
Microbiome assessment
A faecal sample for DNA isolation and metagenome deepsequencing is collected under standardised conditions. Thesesamples are immediately frozen at home and transported to theclinical research centres in cooled packages. The samples aresubsequently stored at −80°C until DNA extraction. BacterialDNAwill be extracted following standardised consensus pro-cedures and subjected to deep metagenomic next generationsequencing, as previously described [16]. For each sample,3 Gb clean sequence data are generated, and, on the basis ofbacterial gene annotation, principal component and clusteranalyses are performed. Taxonomic classification of knownspecies, metagenomic assessment of unknown species, andfunctional-potential analyses are undertaken to identifychanges in the gut microbiota composition and function andto correlate such signatures with a series of biochemical andphysiological variables of the host [16].
Urine sample
A fasting urine sample is taken and a pregnancy test is per-formed in premenopausal female participants. A dipstick testis also performed on all urine samples using Multistix 10(Bayer, Leverkusen, Germany). Samples are aliquoted intoplain tubes and stored at −80°C.
MRI
Magnetic resonance images are acquired on approximatelyevery second participant in sequence, within age (5 years) andsex (male and female) strata, to ensure an approximately evendistribution of scans of men and women and across the spec-trum of age in both studies at five locations throughout north-ern Europe. Local protocols were standardised across studycentres by an experienced radiographer to harmonise the scanmethodology as far as possible given that each centre hasdifferent equipment. Scans are made at 1.5 and 3.0T fieldstrengths, depending on equipment, and using different man-ufacturers’ scanner models: Siemens Trio 3T (University ofDundee, UK), Philips Intera 1.5T (University of Exeter, UK),Siemens Espree 1.5T (University of Newcastle, UK), Philips
Achieva 3T (Copenhagen University, Denmark) and SiemensAvanto 1.5T (University of Eastern Finland, Finland and VUUniversity Medical Center, Amsterdam, the Netherlands).
Abdominal MRI All participants are scanned in the proneposition with arms extended above the head. T1-weightedimages are acquired from the diaphragm to acetabulum usingthe maximum field of view during free breathing (slice thick-ness of 10 mm, with a slice gap of 10 mm).
Pancreatic volume Imaging of the pancreas is achieved fol-lowing additional survey scans while in suspended respira-tion. A three-dimensional T1-weighted scan with fat suppres-sion is placed over the pancreas to cover the entire organ. Ablock of 50–80 slices with a thickness ranging from 1.2 to2 mm is used depending on scanner limitations. Scans areperformed in a single breath-hold on expiration.
Multi-echo for pancreatic liver fat The pancreas is identifiedand further axial images are performed during suspendedrespiration, which are used to position a single slice multi-echo sequence through the pancreas using a surface coil.Typical variables include: repetition time, 1,500 ms; field ofview, 500; slice thickness, 10 mm. Echo times vary between 8and 20 ms, depending on the scanner used, and are chosen torepresent in and out of phase, the shortest acquired at 1.15 msand the longest at 23 ms. An identical single slice is thenacquired through the liver in the axial plane. This method hasbeen appropriately validated previously [17].
Raw data are converted into an analysable format usingImage J (Image; National Institutes of Health, Bethesda, MD).An automated pixel-by-pixel analysis is performed to obtaincolour-coded parametric maps of the entire pancreas and liverusing Matlab version 7.7 (Mathworks, Natick, MA, USA).Relative proportions of fat and water within each organ arethen calculated.
Dietary assessment
For the assessment of diet and nutrition, a 24 h multi-passdietary record is used. Diet assessments in each participant aremade the day before the study visit. Twenty-four hour multi-pass dietary records are open-ended, do not require a highdegree of literacy, and impose a relatively low level of burdenon the respondent. The method is well validated against thegold standard for energy intake quantification (double-labelled water) and has good reproducibility [18–20]. Themethods for the dietary record and the food habit question-naire have been validated as part of the Euroaction Study [21].The method is structured into three levels of dietaryquestioning or ‘passes’. The first pass aims to document a‘usual’ day’s meal. The second pass aims to give the respon-dent the time to reflect and add to the foods recorded in the
1136 Diabetologia (2014) 57:1132–1142

first pass. The third pass of the food record aims to obtaininformation about portion size and method of preparationusing a food portion size atlas. Participants also complete afood habit questionnaire to assess the overall quality of thediet against healthy eating and diabetes guidelines, and as aninternal quality control check for the record. Toenail clippingsfor the objective assessment of trace elements are also collect-ed using stainless-steel clippers and are stored in paper enve-lopes in a cool, dry environment.
Analysis of diet data will be undertaken using Dietplan-6, acomprehensive food analysis program (version 6.70.43, 2013;Forestfield Software, Horsham, UK). Because Studies 1 and 2are pan-European, diet questionnaires were written in severallanguages. Thus, each questionnaire is translated into Englishby a native speaker of the respective non-English language.Micro- and macro-nutrient content are calculated in a way thatpreserves the meal structure. Each individual’s questionnairecontains the contribution of each food’s nutritional contentrelated to the total intake in the meal structure. Under- andover-reporting of energy intake will be assessed usingGoldberg’s equation [22, 23].
Physical activity, sedentary behaviour and sleep assessment
Habitual physical activity is assessed using a wrist-worntriaxial accelerometer (ActiGraph GT3X+; ActigraphLLC, Pensacola, FL, USA). The monitor is fitted tothe participant’s non-dominant wrist using an adjustablestrap (Actigraph LLC). The participant is requested towear the monitor continuously for 10 days to allowhabitual uninterrupted measures of both sleep and phys-ical activity. The monitor is set to record at 30 Hz withthe manufacturer’s sleep mode disabled. Participantsselected for detailed assessments at the 18-month andfinal 36-month study visit (in Study 1) will wear anadditional monitor on their dominant hip. The partici-pants are instructed to remove the monitor only whenundertaking water-based activities (deeper than 1 m andlasting longer than 30 min), or if the monitor causesdiscomfort. Participants are given a prepaid, addressed,padded envelope in which to deposit the monitor andreturn it. A wide variety of methods can be used toanalyse the raw data to provide meaningful summaryvariables. The analytical methods used will depend onthe specific research question and will be described indetail in subsequent papers.
Additional questionnaires
Questionnaire data are also collected on quality of life (SF12),dental health status, family history of diabetes and medicationhistory.
Central database
A relational database has been constructed to store all fore-ground data collected in the DIRECT project. This includes auser-friendly interface for creating participant profiles, dataentry from case report forms, importing processed laboratoryand measurement data, and for data query. All samples arebarcoded, linked to the participant’s study identification num-ber, and registered in the database. A comprehensive sampleand data-tracking approach ensures that samples can be local-ised to the specific placeholder in a rack at a specified storagefacility, which is an important infrastructural feature of theproject that will minimise data loss due to human error.Additional functions for data interrogation, reporting errorsand anomalies, and repair processes are built into the database.The database was constructed using mySQL (version 5.1.46).The backend was built using Perl (version 5.12.1), and thefrontend was built using Javascript (version 1.8.5) and jQuery(version 1.7.1).
Statistical power
There are many possible scenarios under which analyses willbe performed in DIRECT. The following is merely an exam-ple to illustrate the statistical power for one such scenario forprediabetic participants. Analysis will involve linear regres-sion analysis where we model the ability of a given biomarkerto predict change in a continuous trait outcome. Power willvary depending on a variety of factors. However, we cancalculate an example where we use a range of biomarkerfrequencies to show power for detecting difference in changein glucose concentrations (population mean ± SD,5.8±0.6 mmol/l) during the study. Where a dichotomousbiomarker is present in 10% of the cohort, we will have99.9%, 99.9% and 73.9% power (α 0.05) to detect changesin fasting glucose of 0.5 mmol/l, 0.2 mmol/l and 0.1 mmol/l,respectively. If the biomarker is more common and the otherassumptions outlined above remain the same, power exceeds95% in all examples. The power calculations above assume asingle hypothesis test. In DIRECT, we are likely to undertakemany thousands of hypothesis tests; therefore, determiningtrue from false positive findings will rely on replication stud-ies (in existing epidemiological cohorts linked to DIRECT)and validation studies (in clinical trials that will be undertakenin the second stage of the DIRECT project).
Prediabetic glycaemic deterioration (Study 1)
Study 1 rationale
The primary objective of Study 1 is to collect biosamples andinformation that might yield novel, predictive biomarkers forglycaemic deterioration in non-diabetic high-risk participants.
Diabetologia (2014) 57:1132–1142 1137

Study 1 participant identification
Participants in Study 1 were recruited from existing prospec-tive cohort studies in or around each of the following Euro-pean cities: Malmö, Sweden (Malmö Diet and Cancer Study[12]); Amsterdam, The Netherlands (Hoorn Study [3]);Copenhagen, Denmark (Inter99 [10]); and Kuopio, Finland(METSIM [24]). A clinically practicable screening tool(DIRECT-DETECT) was used to identify at-risk participantsfrom existing cohort studies, who were then recruited into thisnew prospective cohort study (Study 1). Inclusion and exclu-sion criteria for Study 1 are outlined in Table 1.
Participants invited to attend the baseline visit are defined as‘prediabetic’ based on HbA1c (5.7–6.4%, 40–48 mmol/mol).Participants with HbA1c values at baseline ≥6.5%, or who areknown to have prevalent diabetes according to the ADA 2011criteria [25], are excluded. Participants who are clinicallydiagnosed with diabetes during the course of the study willbe allowed to remain in the study provided that their fastingblood glucose levels do not exceed 10 mmol/l at a follow-upvisit. Treatments and medications for diabetes and other indi-cations are recorded. Those participants who have startedantidiabetic medications are asked to stop taking them 24 hbefore the 18- and 36-month follow-up examinations to
minimise their effects on the interpretation of drug-sensitivebiomarkers.
Like other diabetes screening tools, DIRECT-DETECT isneither 100% specific nor sensitive; thus, we anticipate that,although on average glycaemic control will decline in thecohort, the extent to which this occurs will vary widely acrossthe cohort. Thus, participants in the top and bottom quantiles(n=300 per quantile) of the distribution of glycaemic changein Study 1 will be selected for deeper phenotyping, andcomparisons will be made to identify biomarkers that differsubstantially between the two groups, and hence might im-prove the predictive accuracy of the DIRECT-DETECT riskprediction algorithms (see Fig. 1).
Development of the DIRECT-DETECT prediction model Theprediction tool comprises two models. The focus of the firstmodel is to identify non-diabetic individuals who are at highrisk of rapid, short-term glycaemic deterioration, predicted byquestionnaire variables only. The focus of the second model isto further predict glycaemic deterioration by adding a recentHbA1c measure to the model. The DIRECT-DETECT tool isan adapted version of the DETECT-2 algorithm [26]. To createthe tool, data from three existing prospective cohort studies(Hoorn Study, Cooperative Health Research in the Region ofAugsburg [KORA S4/F4 Study] and Inter99 Study; cohortcharacteristics are presented in Table 2 and published in detailelsewhere [3, 4, 10]) were used to model the relationshipsbetween selected variables determined at baseline (age, BMI,waist circumference, use of antihypertensive medication,smoking and parental diabetes) and change in HbA1c duringthe following 4–8 years.
The prediction models were developed in men and womenseparately using linear regression equations. The models wereevaluated for their calibrative and discriminative abilitiesusing calibration plots (to assess agreement between the pre-dicted and observed values of HbA1c) and by selecting par-ticipants with the highest 50% observed and predicted HbA1c
values within whom sensitivity, specificity, and positive andnegative predictive values were assessed respectively. Theprediction models were internally validated usingbootstrapping techniques. External validation of the modelwas performed in the METSIM cohort.
Table 1 Inclusion and exclusion criteria for Study 1
Inclusion criteria
• No treatment with insulin-sensitising, glucose-lowering or otherantidiabetic drugs
• Fasting capillary blood glucose <10 mmol/l at baseline
• White European (self-report of parental ethnicity)
• Age ≥35 and <75 years
Exclusion criteria
• Diagnosed diabetes of any type, HbA1c ≥6.5% (48 mmol/mol) orfasting plasma glucose ≥7.0 mmol/l or 2 h plasma glucose>11.0 mmol/l previously
• For women, pregnancy, lactation or plans to conceivewithin the studyperiod
• Use of a pacemaker
• Any other significant medical reason for exclusion as determined bythe investigator
Table 2 Description of the characteristics of the studies used to develop the DIRECT-DETECT prediction model
Characteristic All studies (n=6,136) Hoorn (n=1,345) KORA S4/F4 (n=904) Inter99 (n=3,887)
Age (years) 52 (30–79) 60 (50–77) 64 (55–74) 46 (30–61)
Sex (% male) 49% 46% 51% 50%
HbA1c at follow-up (%) 5.66±0.44 5.47±0.62 5.64±0.41 5.73±0.34
HbA1c at follow-up (mmol/mol) 38.4±4.8 36.3±6.8 38.1±4.5 3.91±3.7
Follow-up duration (years) 6 (4–8) 6.5 (4–8) 7 (6.5–8) 5.5 (5–6.5)
Values are mean (range) or mean ± SD
1138 Diabetologia (2014) 57:1132–1142
Study 1 screening examination
Using the DIRECT-DETECT tool, a total of around 10,000high-risk participants have been identified from the existingpopulation-based prospective cohort studies at each studycentre. The participants are ranked according to theDIRECT-DETECT model scores, and the highest-rankingare invited to attend a screening examination. A detaileddescription of the risk prediction model will be publishedelsewhere. To ensure that only high-risk individuals are invit-ed to the full study, updated information on the predictionvariables and information on inclusion/exclusion criteria areobtained, and HbA1c is measured at the screening examina-tion. In some centres, fasting and/or 2 h glucose concentra-tions are also measured at this stage and used for the samepurpose as HbA1c. Participants who satisfy the inclusion/exclusion criteria (see Table 1) and have been identified asbeing at high risk of glycaemic deterioration from retrospec-tive cohort data are invited to attend the baseline visit. Partic-ipants with apparently normal glycaemia who are determinedto be at high risk on the basis of the DIRECT-DETECTsecondmodel score are also invited to participate in the full study. Theintention is to enrol between 2,200 and 2,700 of the highest-risk persons across all DIRECT Study centres.
Study 1 baseline examination
Examinations are carried out the morning after a 10 h over-night fast. Study-specific written, informed consent is obtain-ed in person. Anthropometrics and blood pressure are mea-sured. A stool sample, toenail clippings and urine sample arecollected. The participant is fitted with an accelerometer (asoutlined above) for measurement of physical activity, seden-tary behaviour and sleep. Data on quality of life (SF12) anddiet (as outlined above) are obtained by questionnaire. Ab-dominal MRI scans (as outlined above) are conducted. Allcurrent medication including over-the-counter and herbalmedication is documented.
Frequently sampled OGTT (fsOGTT) For the collection ofblood, a cannula is inserted into a forearm vein for samplingat time points 0, 15, 30, 45, 60, 90 and 120 min during the75 g fsOGTT. Blood samples for downstream blood omicsprocessing (as described above) are extracted and stored. Astandard finger-stick fasting capillary blood glucose sample(with a HemoCue Glucose 201 or similar) is taken beforethe fsOGTT, and those with corrected fasting venous glu-cose >10 mmol/l (capillary glucose >11 mmol/l) are ex-cluded from the study. To adjust for difference betweenplasma glucose and capillary blood glucose, a correctionfactor of ~1.11 is applied manually or automatically, as permost commercially available capillary blood glucosemeters [27].
Study 1 measurements between core examinations
All participants are provided with a finger-stick blood sam-pling kit for the collection of a blood spot (as described above)for HbA1c assessment, a non-stretchable tape measure for theassessment of waist circumference, and a data collection formfor recording waist circumference and body weight. Partici-pants are asked to use the same weighing scales throughoutthe study so that home measurements can be calibrated withclinical measurements. Each measurement is obtained at18-week intervals from the baseline visit to the follow-up visit18 months later (a total of three intermediate measurements).The participant is requested to return the blood spots andquestionnaires to the study centre by surface mail in a prepaidenvelope. Blood spot measures are processed according to avalidated protocol [28].
Study 1 follow-up examinations at 18 and 36 months
Similar to the baseline visit, anthropometric, diet and quality-of-life data, blood pressure, stool samples, toenail clippingsand urine samples are collected. The participant is fitted againwith the accelerometer for measurement of physical activity,sedentary behaviour and sleep. Fasting and fsOGTT bloodsamples are obtained. At the 18-month follow-up visit, the300 participants at each end of the glycaemic change distri-bution (n=600) are selected from the full cohort (N=2,200–2,700) for additional deep phenotyping. The cut-off points forthe tails in the rate of glycaemic deterioration are determinedusing data from the sequential HbA1c data collected during the18-month follow-up period. Because participants within thetails of this distribution will be identified as study data isaccrued, and many of these will be identified before all ofthe sequential HbA1c data are available, it will be necessary topredict the distribution of glycaemic change using all of theavailable data at that time. This dataset will be continuouslyupdated with additional HbA1c data, thereby maximising thecorrect classification of participants included in the deep-phenotyped subgroup of Study 1. These participants have afurther MRI scan. An additional hip-worn accelerometer isalso fitted to these individuals to further assess physical activ-ity, sedentary behaviour and sleep.
New-onset diabetes glycaemic deterioration (Study 2)
Study 2 rationale
The primary objective of Study 2 is to collect biosamples andinformation that might yield novel, predictive biomarkers forglycaemic deterioration in people who have recently beendiagnosed with type 2 diabetes.
Diabetologia (2014) 57:1132–1142 1139

Study 2 participant identification
Participants in Study 2 of DIRECT are recruited from ornearby each of the following European cities: Malmö, Swe-den; Amsterdam, the Netherlands; Copenhagen, Denmark;Exeter, UK; Newcastle, UK; Dundee, UK. Potential partici-pants are recruited through targeted searches of existing data-bases and research registers combined with person-to-personcontact at educational clinics and through routine retinalscreening programmes. The target sample size is 1,000 par-ticipants evenly distributed across the six European centres.Inclusion and exclusion criteria for Study 2 are shown inTable 3.
Study 2 screening examination
Participant eligibility is assessed, and written informed con-sent is obtained in person. Additional information on diabeticcomplications and other comorbidities, family history andlifestyle factors such as alcohol and smoking status are ob-tained. All current medications including over-the-counter andherbal medication are documented. Current HbA1c and renalfunction are checked with venepuncture and local laboratoryanalysis.
Study 2 baseline examination
Examinations are performed in the morning after a 10 hovernight fast. Participants remain on their usual non-diabetes medications; metformin, if used, is stopped forthe 24 h preceding the study visit and restarted immedi-ately after. As with Study 1 (described above),
anthropometric, diet and quality of life data, blood pres-sure, stool samples, toenail clippings and urine samplesare collected. An intravenous cannula is inserted into aforearm vein according to local protocols. Baseline bloodsamples are immediately collected for analysis of GADand islet antigen-2 antibodies, glucagon-like peptide-1,glucagon, insulin, C-peptide, metabolomics, proteomics,HbA1c, DNA and RNA. The participant is also fitted withan accelerometer for measurement of physical activity,sedentary behaviour and sleep over 10 days.
MMTT In addition, fasting samples (MMTT time point 0 min)for glucose, insulin and C-peptide analysis are collected. Aspart of the MMTT, participants consume 250 ml Fortisipliquid drink (18.4 g carbohydrate per 100 ml) over a periodof 2–5 min. Blood samples are collected every 30 min for 2 hfor subsequent glucose, insulin and C-peptide assays. A post-prandial urine sample is also collected, analysed with a simpledipstick and stored for later C-peptide analysis. As part of thebaseline visit, all participants also have an abdominal MRIscan, as described above.
Study 2 measurements between visits
Each participant’s diabetes management is continued as nor-mal. For monitoring of beta cell function, participants collectpostprandial urine samples every 3 months, which arereturned to the study centre for analysis of C-peptide.
Study 2 follow-up examinations
Two follow-up study visits are carried out in Study 2, one at9 months and another at 18months after the baseline visit. The9-month follow-up involves a repeated medical assessment,medication review and anthropometric assessment, as docu-mented above for the baseline visit. Fasting blood samples arecollected in a manner identical with the baseline visit (exclud-ing a blood sample for RNA processing and analysis). The18-month follow-up examination is identical with the baselineexamination.
Summary
The IMI DIRECT Study is one of the largest and mostcomprehensive projects ever undertaken for the discov-ery and validation of biomarkers for glycaemic deterio-ration and type 2 diabetes. WP2 of DIRECT focuses onderiving new data and biomaterials from two new pro-spective cohort studies, as well as assimilating data andmaterials from existing cohort studies led by membersof the DIRECT Consortium. The new studies aredesigned to: (1) identify persons who are clinically
Table 3 Study 2 inclusion and exclusion criteria
Inclusion criteria
• Patients diagnosed with type 2 diabetes not less than 6 months andnot more than 24 months before baseline examination
• Management by lifestyle with or without metformin therapy
• All HbA1c <7.6% (<60 mmol/mol) within previous 3 months
• White European
• Age ≥35 and <75
• Estimated GFR >50 ml/min
Exclusion criteria
• Type 1 diabetes
• A previous HbA1c >9.0% (>75 mmol/mol)
• Prior treatment with insulin or an oral hypoglycaemic agent other thanmetformin
• BMI <20 or >50 kg/m2
• Pregnancy, lactation or plans to conceive within the study period
• Any other significant medical reason for exclusion as determined bythe investigator
1140 Diabetologia (2014) 57:1132–1142
defined as being at high risk of rapid glycaemic deteri-oration and, by consequence, type 2 diabetes, in whomadditional novel biomarkers that inform the predictionof these outcomes can be discovered (Study 1); (2)identify persons with recently diagnosed type 2 diabe-tes, in whom novel biomarkers for diabetes progression(glycaemic deterioration and failure of therapy) mightbe found. These studies involve in-depth phenotypingusing a range of cutting-edge technologies such as: MRIscans of the liver, pancreas and abdomen; metagenomicsof faecal DNA; genomic, epigenomic, transcriptomic,proteomic and metabolomic assessments of blood andurine; estimates of pancreatic insulin secretion andinsulin action; and detailed lifestyle assessments. Thehypotheses generated using these materials will be test-ed in specially designed clinical trials, which take placein the second part of the DIRECT Study.
Acknowledgements We thank the participants across all DIRECTStudy centres for their contributions to the study. We also thank all thestaff listed in the electronic supplementary material (ESM) for theircontribution to the planning, implementation or conduct of the study.
Funding The work leading to this publication was funded by theInnovative Medicines Initiative Joint Undertaking under grant agreementNo. 115317 (DIRECT), resources of which are composed of financialcontributions from the European Union's Seventh Framework Pro-gramme (FP7/2007-2013), and European Federation of PharmaceuticalIndustries and Associations (EFPIA) companies’ in kind contribution.
Duality of interest BJ and HR are employed by Sanofi-AventisDeutschland GmbH, R&D, Frankfurt am Main, Germany. VK isemployed by Eli Lilly & Company, Helsinki, Finland. All other authorsdeclare that there is no duality of interest associated with this manuscript.
Contribution statement AM, TJM, JMD, TH, AHa, ML, OP, VK,HR, MW, EP and PWF designed the prospective studies. RWK and PWFwrote the first draft of the manuscript and coordinated the inclusion ofspecific sections as outlined. AHe and MW wrote aspects of the sectionsrelating to Study 2. FR, MWH and JMD drafted aspects of the sectionsrelating to risk prediction modelling (DIRECT-DETECT). SH drafted thesection relating to the central database coordination. HJAT drafted thesection on ethical, regulatory and legal considerations. JB drafted thesection on MRI assessment. GF drafted aspects of the section relating todiet assessment. OP and TH drafted the section on microbiome analyses.All authors have made substantial contributions to the conception anddesign of the various aspects of the prospective studies or the acquisitionof data. All authors also contributed to drafting the article or revising itcritically for important intellectual content and have given final approvalof the version to be published. MW, EP and PWF are responsible for theintegrity of the work as a whole.
Open Access This article is distributed under the terms of the CreativeCommons Attribution License which permits any use, distribution, andreproduction in any medium, provided the original author(s) and thesource are credited.
References
1. Weyer C, Bogardus C, Mott DM, Pratley RE (1999) The naturalhistory of insulin secretory dysfunction and insulin resistance in thepathogenesis of type 2 diabetes mellitus. J Clin Invest 104:787–794
2. Ringborg A, Lindgren P, Yin DD, Martinell M, Stalhammar J (2010)Time to insulin treatment and factors associated with insulin prescrip-tion in Swedish patients with type 2 diabetes. Diabetes Metab 36:198–203
3. Mooy JM, Grootenhuis PA, de Vries H et al (1995) Prevalence anddeterminants of glucose intolerance in a Dutch Caucasian population.The Hoorn Study. Diabetes Care 18:1270–1273
4. Rathmann W, Strassburger K, Heier M et al (2009) Incidence oftype 2 diabetes in the elderly German population and the effectof clinical and lifestyle risk factors: KORA S4/F4 cohort study.Diabet Med J Br Diabet Assoc 26:1212–1219
5. Ajanki T (2013) ANDIS-Alla Nya Diabetiker i Skåne. http://diabetesportalen.se/foerdjupning/viktiga-vetenskapliga-undersoekningar/andis-alla-nya-diabetiker-i-skaane/. Accessed 15Oct 2013
6. Mennen LI, Balkau B, Vol S, Caces E, Eschwege E (1999) Fibrinogen:a possible link between alcohol consumption and cardiovascular dis-ease? DESIR Study Group. Arterioscler Thromb Vasc Biol 19:887–892
7. Doney AS, Fischer B, Leese G, Morris AD, Palmer CN (2004)Cardiovascular risk in type 2 diabetes is associated withvariat ion at the PPARG locus: a Go-DARTS study.Arterioscler Thromb Vasc Biol 24:2403–2407
8. Groop L, Forsblom C, Lehtovirta M et al (1996) Metabolic conse-quences of a family history of NIDDM (the Botnia study): evidencefor sex-specific parental effects. Diabetes 45:1585–1593
9. Vangipurapu J, Stancakova A, Kuulasmaa T et al (2012) Associationbetween liver insulin resistance and cardiovascular risk fac-tors. J Intern Med 272:402–408
10. Harder MN, Ribel-Madsen R, Justesen JM et al (2013) Type 2diabetes risk alleles near BCAR1 and in ANK1 associate with de-creased beta-cell function whereas risk alleles near ANKRD55 andGRB14 associate with decreased insulin sensitivity in the DanishInter99 cohort. J Clin Endocrinol Metab 98:E801–E806
11. Hills SA, Balkau B, Coppack SW et al (2004) The EGIR-RISCSTUDY (The European group for the study of insulin resistance:relationship between insulin sensitivity and cardiovascular diseaserisk): I. Methodology and objectives. Diabetologia 47:566–570
12. Berglund G, Elmstahl S, Janzon L, Larsson SA (1993) The MalmöDiet and Cancer Study. Design and feasibility. J Intern Med 233:45–51
13. Franks PW, Pearson E, Florez JC (2013) Gene-environment andgene-treatment interactions in type 2 diabetes: progress, pitfalls, andprospects. Diabetes Care 36:1413–1421
14. Mari A, Pacini G, Murphy E, Ludvik B, Nolan JJ (2001) A model-based method for assessing insulin sensitivity from the oral glucosetolerance test. Diabetes Care 24:539–548
15. Mari A, Tura A, Gastaldelli A, Ferrannini E (2002) Assessing insulinsecretion by modeling in multiple-meal tests: role of potentiation.Diabetes 51(Suppl 1):S221–S226
16. Qin J, Li R, Raes J et al (2010) A human gut microbial gene catalogueestablished by metagenomic sequencing. Nature 464:59–65
17. Thomas EL, Fitzpatrick JA, Malik SJ, Taylor-Robinson SD,Bell JD (2013) Whole body fat: content and distribution.Prog Nucl Magn Reson Spectrosc 73:56–80
18. Moshfegh AJ, Rhodes DG, Baer DJ et al (2008) The US Departmentof Agriculture Automated Multiple-Pass Method reduces bias in thecollection of energy intakes. Am J Clin Nutr 88:324–332
Diabetologia (2014) 57:1132–1142 1141

19. Subar AF, Kipnis V, Troiano RP et al (2003) Using intake biomarkersto evaluate the extent of dietary misreporting in a large sample ofadults: the OPEN study. Am J Epidemiol 158:1–13
20. Neuhouser ML, Tinker L, Shaw PA et al (2008) Use of recoverybiomarkers to calibrate nutrient consumption self-reports inthe Women's Health Initiative. Am J Epidemiol 167:1247–1259
21. Wood DA, Kotseva K, Connolly S et al (2008) Nurse-coordinatedmultidisciplinary, family-based cardiovascular disease preventionprogramme (EUROACTION) for patients with coronary heartdisease and asymptomatic individuals at high risk of cardiovasculardisease: a paired, cluster-randomised controlled trial. Lancet 371:1999–2012
22. Black AE (2000) The sensitivity and specificity of theGoldberg cut-off for EI:BMR for identifying diet reports ofpoor validity. Eur J Clin Nutr 54:395–404
23. Black AE (2000) Critical evaluation of energy intake using theGoldberg cut-off for energy intake:basal metabolic rate. Apractical guide to its calculation, use and limitations.Int J Obes Relat Metab Disord 24:1119–1130
24. Stancakova A, Javorsky M, Kuulasmaa T, Haffner SM, Kuusisto J,Laakso M (2009) Changes in insulin sensitivity and insulinrelease in relation to glycemia and glucose tolerance in 6,414Finnish men. Diabetes 58:1212–1221
25. American Diabetes Association (2011) Standards of medical care indiabetes–2011. Diabetes Care 34(Suppl 1):S11–S61
26. AlssemaM, Vistisen D, HeymansMWet al (2011) The Evaluation ofScreening and Early Detection Strategies for Type 2 Diabetes andImpaired Glucose Tolerance (DETECT-2) update of the Finnishdiabetes risk score for prediction of incident type 2 diabetes.Diabetologia 54:1004–1012
27. D'Orazio P, Burnett RW, Fogh-Andersen N et al (2006) ApprovedIFCC recommendation on reporting results for blood glucose:International Federation of Clinical Chemistry and LaboratoryMedicine Scientific Division, Working Group on SelectiveElectrodes and Point-of-Care Testing (IFCC-SD-WG-SEPOCT). Clin Chem Lab Med 44:1486–1490
28. Lakshmy R, Gupta R (2009) Measurement of glycated hemo-globin A1c from dried blood by turbidimetric immunoassay.J Diabetes Sci Technol 3:1203–1206
1142 Diabetologia (2014) 57:1132–1142