Embed Size (px)
Citation preview
www.morganmarkets.com
Global Equity Research14 July 2011
Discovering LimitsGlobal Microfinance Valuation Survey 2011
J.P. Morgan Global Research
Frederic de Mariz AC*
(5511) 3048 3398
Banco J.P. Morgan S.A.
* Registered/qualified as a research analyst under NYSE/FINRA rules.
See page 27 for analyst certification and important disclosures, including non-US analyst disclosures.J.P. Morgan does and seeks to do business with companies covered in its research reports. As a result, investors should be aware that the firm may have a conflict of interest that could affect the objectivity of this report. Investors should consider this report as only a single factor in making their investment decision.
CGAP
Xavier Reille
Lead Microfinance Specialist
Daniel Rozas
Microfinance Specialist
This report is the result of a collaborative effort between CGAP (Consultative Group to Assist the Poor) and J.P. Morgan. CGAP is a nonprofit research organization, affiliated with the World Bank, that specializes in low income finance. J.P. Morgan analysts are solely responsible for the investment opinions and recommendations in this report.

3
Global Equity Research14 July 2011
Frederic de Mariz(5511) 3048 [email protected]
Executive Summary
This report is the result of a partnership between CGAP (Consultative Group to Assist the Poor) and J.P. Morgan with the support of the Council of Microfinance Equity Funds (CMEF). It combines CGAP and CMEF knowledge of microfinance with J.P. Morgan’s equity research skills in emerging markets. This is the third edition in a series begun in 2009. Our objective is to provide benchmarks for valuation of microfinance equity, both private and publicly listed, drawing on two data sets: a sample of 238 private equity transactions between 2005 and 2010 (compared to 200 transactions in last year’s edition of the report), which represents the largest such data set gathered to date, and data on 11 publicly traded lower income financial institutions (LIFIs).1
This year’s edition is entitled “Discovering Limits” as the recent experience of unsustainable growth, and the risk of client over-indebtedness in several countries, has given the sector a better appreciation of the limits of growth. Microfinance valuations in the public and private markets are starting to converge with those of traditional financial institutions. Despite a challenging environment, the equity market remained vibrant in 2010 with US$205mn in private equity investments captured by our survey. Latin America and the Caribbean represented the largest share of investments, with 56% of the total transaction value in 2010. Equity prices continue to be supported by a broad base of public and private investors with a long-term commitment to the asset class.
But the overall slowdown in the sector’s growth is causing equity investors to revise their return expectations downward. Microfinance institution (MFI) valuations have reversed a four-year growth path, with book value multiples falling slightly, from an average price-to-book multiple of 1.7x in 2009 to 1.6x in 2010. However, severe corrections have only happened in the most affected countries, such as India, as we had predicted in our report last year.2
Table 1: The increase in price-to-book multiples reversed in 2010; while price-to-earnings multiples have increased since 2009
Historical P/E* Forward P/BYear Average Median Average Median2005 9.1 7.9 1.1 0.92006 8.5 7.3 1.0 0.92007 10.4 7.2 1.2 1.02008 10.3 8.1 1.4 1.12009 12.8 13.0 1.7 1.42010 20.1 23.4 1.6 1.4
Source: CGAP. * Average and median calculations exclude transactions with P/E valuations >40 and <0. This exclusion
encompassed 51% of all transactions in 2010 (mostly due to P/E being negative).
1 Because there are few publicly listed MFIs, we consider a group of 11 listed financialinstitutions targeting lower income individuals and note that their business models are verydiverse.2 See Global Microfinance Valuation Survey 2010.

4
Global Equity Research14 July 2011
Frederic de Mariz(5511) 3048 [email protected]
This year’s edition brings an interesting new set of data, for the first time providing valuation analysis at the country level, showing trends in valuation multiples for eight countries. Interestingly, despite the slowdown, many countries continue toenjoy significant investor support, with 2010 book multiples remaining above the 4-year median value for nearly all countries on the list.
Table 2: Valuations trends in selected countries (2007-2010)
# of transactions Amount ($m) 4-yr median P/B (fwd) 2010 vs. 4-yr median
India 30 176.0 1.8 DecreaseCambodia 14 29.4 1.1 IncreaseMongolia 12 23.1 1.2 IncreaseNicaragua 10 28.9 1.0 n/aPeru 10 114.4 0.9 IncreaseBolivia 10 12.8 0.9 n/aTanzania 6 1.5 1.0 IncreaseNigeria 5 7.7 1.0 n/a
Source: CGAP; n/a indicates no deals in 2010.
The public markets this year set a major milestone, with the IPO of SKS—the largest MFI in India—raising US$350 million in August 2010. However, this landmark transaction was quickly followed by a social and political crisis that pushed the stock down 45% from its listing price.
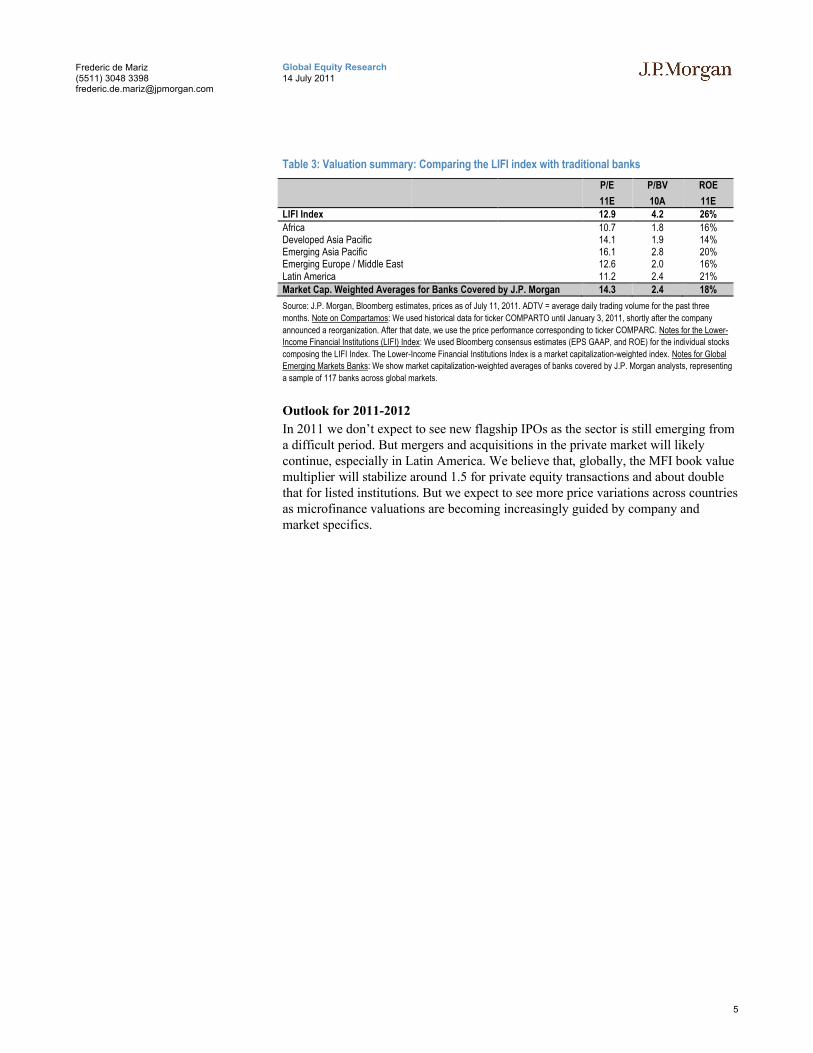
Recent months have also seen interesting developments for the other listed low-income lenders included in the LIFI index (Lower Income Finance Index). Over the long run, the LIFI index has largely outperformed traditional banks both globally and in emerging markets. The LIFI index increased 736% since its launch in 2003, while world financials’ stock prices decreased 20% (MSCI World Financials, ticker: MXWOOFN) and emerging markets banks’ stock prices increased 224% (MSCI Emerging Markets Banks; ticker: MXEFF0BK).
However, over the past few months, the performance of the LIFI index has been less clear. For 2011 year to date, the outperformance of the LIFI index over global banks had not been significant up until a few weeks ago. The LIFI index has been rather volatile in 2011, but it is still outperforming, up 8% YTD, versus 0% for World Financials and -1% for Emerging Markets Banks.
The LIFI index currently trades at 12.9x 2011E earnings and 4.2x 2010 book value for an average ROE of 26. By comparison, global banks trade at 14.3x 2011E earnings and 2.4x 2010 book value, for an average ROE of 18%.
5
Global Equity Research14 July 2011
Frederic de Mariz(5511) 3048 [email protected]
Table 3: Valuation summary: Comparing the LIFI index with traditional banks
P/E P/BV ROE
11E 10A 11ELIFI Index 12.9 4.2 26%
Africa 10.7 1.8 16%Developed Asia Pacific 14.1 1.9 14%Emerging Asia Pacific 16.1 2.8 20%Emerging Europe / Middle East 12.6 2.0 16%Latin America 11.2 2.4 21%Market Cap. Weighted Averages for Banks Covered by J.P. Morgan 14.3 2.4 18%
Source: J.P. Morgan, Bloomberg estimates, prices as of July 11, 2011. ADTV = average daily trading volume for the past three
months. Note on Compartamos: We used historical data for ticker COMPARTO until January 3, 2011, shortly after the company
announced a reorganization. After that date, we use the price performance corresponding to ticker COMPARC. Notes for the Lower-
Income Financial Institutions (LIFI) Index: We used Bloomberg consensus estimates (EPS GAAP, and ROE) for the individual stocks
composing the LIFI Index. The Lower-Income Financial Institutions Index is a market capitalization-weighted index. Notes for Global
Emerging Markets Banks: We show market capitalization-weighted averages of banks covered by J.P. Morgan analysts, representing
a sample of 117 banks across global markets.
Outlook for 2011-2012
In 2011 we don’t expect to see new flagship IPOs as the sector is still emerging from a difficult period. But mergers and acquisitions in the private market will likely continue, especially in Latin America. We believe that, globally, the MFI book value multiplier will stabilize around 1.5 for private equity transactions and about double that for listed institutions. But we expect to see more price variations across countries as microfinance valuations are becoming increasingly guided by company and market specifics.

6
Global Equity Research14 July 2011
Frederic de Mariz(5511) 3048 [email protected]
Table of ContentsExecutive Summary .................................................................3
Introduction ..............................................................................8
1. Valuation of Private Equity Transactions—Microfinance Institutions ..............................................................................10
The Private Equity Market in 2010 ........................................................................10
Less Primary Issuance; Secondary Markets Are Developing ..................................10
Valuation Multiples Decreased Slightly in 2010, Putting an End to a 4-Year Growth Trend ....................................................................................................................11
Country Trends Reflect Market Characteristics ......................................................13
2. Valuation of Publicly Listed Companies—Lower Income Finance Institutions................................................................17
Enhancing the LIFI Index......................................................................................17
The LIFI Index Outperformed over the Long Term . . . ..........................................19
. . . but Outperformance Was Volatile in 2011........................................................20
Conclusion..............................................................................23
AppendicesAppendix I: Methodology.......................................................24

7
Global Equity Research14 July 2011
Frederic de Mariz(5511) 3048 [email protected]
The authors are particularly thankful to Deborah Drake and Stephanie Dolan, at the Council of Microfinance Equity Funds (CMEF) for their expertise and participation.
The authors would also like to acknowledge the contributions of Christina Leijonhufvud, Yasemin Saltuk, and John Buley from the Social Sector Finance team at J.P. Morgan and Paul Measday, Mervin Naidoo, and Aditya Srinath from the Equity Research team at J.P. Morgan.
We would also like to thank Elisa Sitbon for managing the private equity survey, and Greg Chen and Jasmina Glisovic for their valuable review and input.
Finally, the authors are grateful for Elizabeth Littlefield and Nick O’Donohoe’s leadership role in launching this annual publication in 2009.

8
Global Equity Research14 July 2011
Frederic de Mariz(5511) 3048 [email protected]
Introduction
In 2010, microfinance began to recover from the crisis that rocked the sector the year before. Globally, the average rate of non-performing loans (PAR 30) for leading institutions attracting foreign investment returned to below 5%.3 However, several markets, particularly in Eastern Europe, Africa, and South Asia, continued to experience a severe delinquency crisis.
A major milestone for the year has been the landmark IPO of SKS, the leading MFI in India, which raised US$350 million in August 2010. The offering was oversubscribed 13 times, and the company’s valuation at US$1.5 billion came in at the top end of the offering price range. However, social and political events in the state of Andhra Pradesh triggered unfavorable regulations that pushed SKS stock down 45% below its listing price.
The deterioration in microfinance institution (MFI) performance and increasing over-indebtedness in several markets have tarnished the sector’s reputation. No longer can microfinance investment be viewed as an exclusively do-good, low-risk, relative safe haven. And equity investors are reassessing the social and financial performance of the asset class.
Our research sheds new light on equity valuation at this critical juncture. In 2010 MFI valuations have declined for the first time since 2006 and are now trading at 1.6 time book value, down from an average of 1.7x in 2009. Trends in the public market show a similar pattern. Low-income finance institutions are still trading above emerging market banks in terms of multiples, but year-to-date their stock performance has been less impressive.
Section One of the report examines the microfinance private equity market, including transaction characteristics, valuation trends, and underlying drivers. This section also delves into a deeper country analysis, including a comparison between the two largest microfinance equity markets: India and Peru.
Section Two looks at the valuation trends in the public market for lower income finance institutions (LIFIs) in developing countries. Since LIFIs serve largely similarmarkets as MFIs, their valuation levels represent a useful comparable for MFIs, especially as microfinance has now discovered its growth limits.
3 Average of 50 leading MFIs with significant foreign capital investments (Symbiotics SYM 50 index)

9
Global Equity Research14 July 2011
Frederic de Mariz(5511) 3048 [email protected]
Methodology & Sources
Our analysis is based on two original samples: (1) a private transaction data set encompassing 238 equity transactions involving 110 MFIs in 53 countries (including 37 transactions in 21 countries during 2010) as well as (2) a sample of 11 publicly traded lower income finance institutions (LIFIs). We estimate that this sample of private equity transactions represents roughly 80% of the cross-border equity market.
LIFIs are publicly traded commercial institutions that provide financial services to customers who overlap significantly with those of MFIs—the lower income population in emerging markets. However, in many cases LIFIs do not necessarily have an explicit social agenda, and their loan portfolios tend to feature more consumer loans than microenterprise loans.
This year’s data on private equity transactions was collected by CGAP in a strictly confidential survey conducted in the spring of 2011. Four development finance institutions (DFIs) and 17 microfinance investment vehicles (MIVs) provided data on their transactions for the year 2010 (for a list of contributors see Appendix II).
Combined with surveys from prior years, our sample now covers 238 transactions that occurred between January 2005 and December 2010 with an aggregate value close to US$768 million. This is the most comprehensive data set on private equity placements in microfinance to date.
CGAP followed strict procedures to ensure full confidentiality of the data reported. These included confidentiality agreements with all survey participants and restricted access policies to the database. Only three CGAP staff and consultants had access to the underlying data. CGAP was responsible for quality control of the data and preliminary analysis. Only aggregated benchmarks based on at least five data points were shared with J.P. Morgan. These aggregated data are available on CGAP’s Web site, at www.cgap.org. J.P. Morgan had no access to the underlying database.
Table 4: Our Sample Represents the Largest Available Data Set to Date
Year Transactions (#)
Transaction($mln)
2005 28 1062006 37 202007 37 602008 63 1442009* 32 2302010 37 205n/a 4 3
Total 238 768
Source: CGAP. For 2009, we only show transaction for
the Jan-Sept period due to a problem in our database.
Table 5: 11 Institutions in the LIFI Index
Bank Rakyat IndonesiaBank Danamon IndonesiaBank Tabungan Pensiunan IndonesiaSKS IndiaAfrican Bank South AfricaCapitec South AfricaEquity Bank KenyaCompartamos Mexico / PeruFinanciera Independencia MexicoFirst Cash Financial Mexico / USAIPF Eastern Europe
/ Mexico
Source: J.P. Morgan. We indicate the region in which
the institution has the largest presence.

10
Global Equity Research14 July 2011
Frederic de Mariz(5511) 3048 [email protected]
1. Valuation of Private Equity Transactions—Microfinance Institutions
The microfinance private equity market remained active in 2010 despite the continuing effects of the delinquency surge experienced in 2009, most notably in Eastern Europe and Central Asia (ECA). However, the level of activity was more muted than in 2009, with the dollar amount of private equity transacted in 2010 declining by 30%.4
The first section of this report examines the trends in the private equity market, including valuations of MFIs. In particular we try to answer three questions:
What are the characteristics of private equity transactions in 2010 and how do they compare with 2009?
What are the general valuation trends and significant valuation drivers?
What private equity trends emerge at the country level, especially for the largest microfinance markets: India and Peru?
The Private Equity Market in 2010
This year’s edition of the Global Microfinance Valuation Survey gathered 37 private equity transactions, totaling US$205 million. As in previous years, Latin America and the Caribbean (LAC) accounted for more than half of the total amount invested. On the other hand, Easter Europe and Central Asia (ECA) (heavily impacted by the 2009 crisis and by higher delinquencies) saw the largest pullback of private equity deals, declining by more than half the dollar value between 2009 and 2010. Investment in the India-dominated Asia region has remained largely flat, while Africa has recorded strong growth, albeit from an admittedly low base.5
Less Primary Issuance; Secondary Markets Are Developing
Primary Issuance6 Accounted for 29% of Transactions in 2010
New equity investments in microfinance institutions have declined steadily over the past four years. Having peaked in 2008, primary issuance has since dropped by 37% to US$59 million in 2010.
The drop in primary issuance is particularly notable in India, where new share investments have declined by 65% from their 2008 peak. This was driven largely by IPO plans—SKS, the country’s largest MFI, raised equity via IPO in 2010, while other major players were holding out for their IPOs in anticipation of better pricing.7
4 Data for 2009 includes only transactions for the first nine months (Jan-Sep). Comparisons of volume trends for 2009 are thus pro rated for the full year.5 Note that the private equity valuation database excludes greenfield and other investments valued at book value. Such greenfields represented a meaningful part of total investments into microfinance, especially when measured by number of transactions.6 Primary issuance or the issuance of new shares to increase the MFI capital base.7 “After SKS success, Share Microfin, Spandana Sphoorty may go public,” LiveMint.com, Aug 11, 2010. In late 2009, Spandana’s negotiations with Temasek Holdings over a US$65m
New equity investment in
microfinance institutions hasdeclined steadily over the past
four years.
11
Global Equity Research14 July 2011
Frederic de Mariz(5511) 3048 [email protected]
Figure 1: LAC receives the largest share of private equity investments
Source: CGAP.
Figure 2: Secondary market dominant since 2009; large decline in the issuance of new shares in India
Source: CGAP.
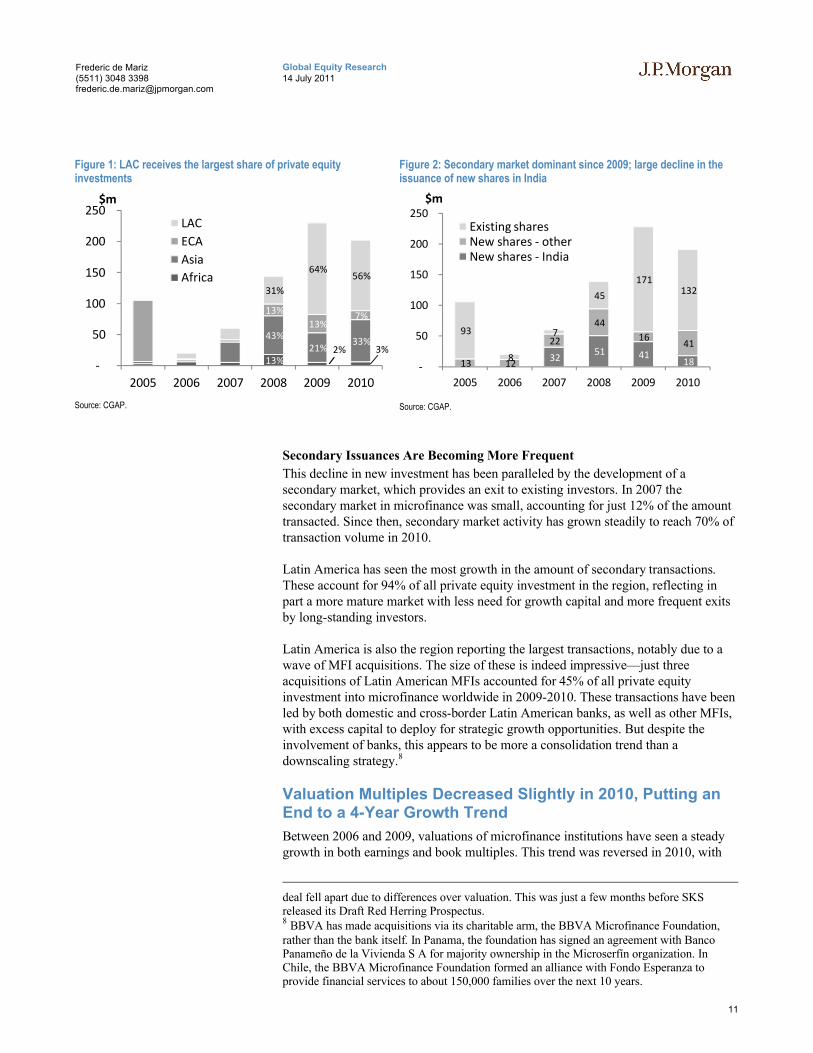
Secondary Issuances Are Becoming More Frequent
This decline in new investment has been paralleled by the development of a secondary market, which provides an exit to existing investors. In 2007 the secondary market in microfinance was small, accounting for just 12% of the amount transacted. Since then, secondary market activity has grown steadily to reach 70% of transaction volume in 2010.
Latin America has seen the most growth in the amount of secondary transactions.These account for 94% of all private equity investment in the region, reflecting in part a more mature market with less need for growth capital and more frequent exits by long-standing investors.
Latin America is also the region reporting the largest transactions, notably due to a wave of MFI acquisitions. The size of these is indeed impressive—just three acquisitions of Latin American MFIs accounted for 45% of all private equity investment into microfinance worldwide in 2009-2010. These transactions have been led by both domestic and cross-border Latin American banks, as well as other MFIs, with excess capital to deploy for strategic growth opportunities. But despite the involvement of banks, this appears to be more a consolidation trend than a downscaling strategy.8
Valuation Multiples Decreased Slightly in 2010, Putting an End to a 4-Year Growth Trend
Between 2006 and 2009, valuations of microfinance institutions have seen a steady growth in both earnings and book multiples. This trend was reversed in 2010, with
deal fell apart due to differences over valuation. This was just a few months before SKS released its Draft Red Herring Prospectus. 8 BBVA has made acquisitions via its charitable arm, the BBVA Microfinance Foundation, rather than the bank itself. In Panama, the foundation has signed an agreement with Banco Panameño de la Vivienda S A for majority ownership in the Microserfín organization. In Chile, the BBVA Microfinance Foundation formed an alliance with Fondo Esperanza to provide financial services to about 150,000 families over the next 10 years.
13%2% 3%
43%21%
33%
13%
13%7%
31%
64%56%
-
50
100
150
200
250
2005 2006 2007 2008 2009 2010
$m
LAC
ECA
Asia
Africa
32 51 41
18 13 12
22
44
16 41
93
8
7
45
171 132
-
50
100
150
200
250
2005 2006 2007 2008 2009 2010
$m
Existing sharesNew shares - otherNew shares - India

12
Global Equity Research14 July 2011
Frederic de Mariz(5511) 3048 [email protected]
the forward book value multiple—the key benchmark for equity valuation on the private market—dropping to an average of 1.6x book in 2010 from a high of 1.7x set the year before.
Meanwhile, earnings multiples have spiked in 2010, jumping by over 50% from 2009 levels. However, rather than being a reflection of higher valuations, this spike has been driven by declining earnings of MFIs. With over half of reported transactions in 2010 qualified as outliers, earnings multiples have largely lost their relevance to investors as useful valuation metrics.
Table 6: The increase in price-to-book multiples reversed in 2010; while price-to-earnings multiples have increased since 2009
Historical P/E* Forward P/BYear Average Median Average Median
2005 9.1 7.9 1.1 0.92006 8.5 7.3 1.0 0.92007 10.4 7.2 1.2 1.02008 10.3 8.1 1.4 1.12009 12.8 13.0 1.7 1.42010 20.1 23.4 1.6 1.4
Source: CGAP.
* Average and median calculations exclude transactions with P/E valuations >40 and <0. This exclusion encompassed 51% of all
transactions in 2010 (mostly due to P/E being negative).
Table 7: Valuation breakdown by region
Median Historical P/E Median Forward P/B
2005 2006 2007 2008 2009 2010 2005 2006 2007 2008 2009 2010Africa 5.6 6.2 17.1 13.2 NA NA 0.7 0.9 1.3 1.1 NA NAAsia NA NA NA 6.9 24.6 23.7 1.0 1.9 1.2 1.4 2.1 1.6ECA 9.3 8.6 13.8 9.4 14.5 NA 1.1 1.1 0.9 1.2 1.5 1.2LAC NA 6.7 5.6 7.8 8.3 10.0 0.9 0.8 0.9 1.0 1.0 1.0
Source: Source: CGAP. NA = less than 5 non-outlier transactions. ECA = E. Europe and C. Asia; LAC = Latin America & Caribbean.
Portfolio Quality Has Been the Primary Driver of Valuations
We believe that the slight decrease in valuation in terms of price to book multiples has been the consequence of the market downturn that began in 2009, and whose effects continued to be felt through 2010.
The increase in delinquency (PAR30) seen in many markets has driven MFIs to increase their loss reserves, resulting in lower or even negative earnings in 2010.
Due to widespread loan losses,
earnings multiples have largely
lost their relevance to investors as useful valuation metrics.
13
Global Equity Research14 July 2011
Frederic de Mariz(5511) 3048 [email protected]
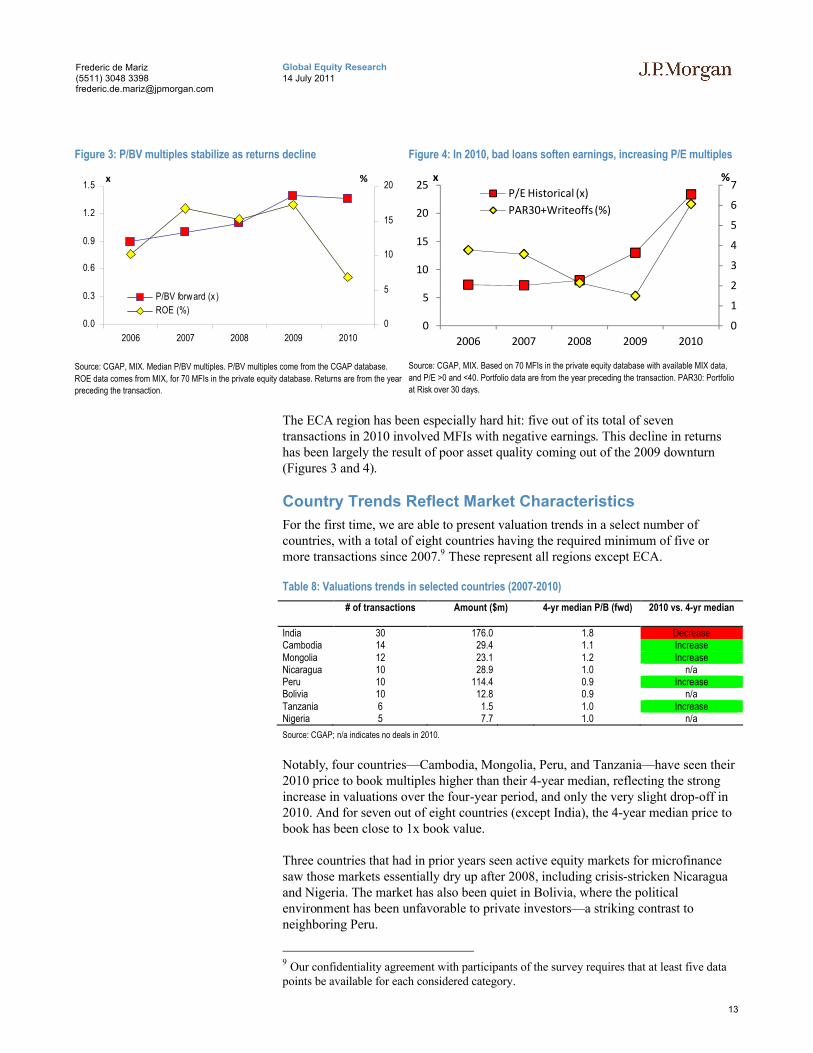
The ECA region has been especially hard hit: five out of its total of seventransactions in 2010 involved MFIs with negative earnings. This decline in returns has been largely the result of poor asset quality coming out of the 2009 downturn (Figures 3 and 4).
Country Trends Reflect Market Characteristics
For the first time, we are able to present valuation trends in a select number of countries, with a total of eight countries having the required minimum of five or more transactions since 2007.9 These represent all regions except ECA.
Table 8: Valuations trends in selected countries (2007-2010)
# of transactions Amount ($m) 4-yr median P/B (fwd) 2010 vs. 4-yr median
India 30 176.0 1.8 DecreaseCambodia 14 29.4 1.1 IncreaseMongolia 12 23.1 1.2 IncreaseNicaragua 10 28.9 1.0 n/aPeru 10 114.4 0.9 IncreaseBolivia 10 12.8 0.9 n/aTanzania 6 1.5 1.0 IncreaseNigeria 5 7.7 1.0 n/a
Source: CGAP; n/a indicates no deals in 2010.
Notably, four countries—Cambodia, Mongolia, Peru, and Tanzania—have seen their 2010 price to book multiples higher than their 4-year median, reflecting the strong increase in valuations over the four-year period, and only the very slight drop-off in 2010. And for seven out of eight countries (except India), the 4-year median price tobook has been close to 1x book value.
Three countries that had in prior years seen active equity markets for microfinance saw those markets essentially dry up after 2008, including crisis-stricken Nicaragua and Nigeria. The market has also been quiet in Bolivia, where the political environment has been unfavorable to private investors—a striking contrast to neighboring Peru.
9 Our confidentiality agreement with participants of the survey requires that at least five data points be available for each considered category.
Figure 3: P/BV multiples stabilize as returns decline
Source: CGAP, MIX. Median P/BV multiples. P/BV multiples come from the CGAP database.
ROE data comes from MIX, for 70 MFIs in the private equity database. Returns are from the year
preceding the transaction.
Figure 4: In 2010, bad loans soften earnings, increasing P/E multiples
Source: CGAP, MIX. Based on 70 MFIs in the private equity database with available MIX data,
and P/E >0 and <40. Portfolio data are from the year preceding the transaction. PAR30: Portfolio
at Risk over 30 days.
0.0
0.3
0.6
0.9
1.2
1.5
2006 2007 2008 2009 2010
x
0
5
10
15
20%
P/BV forward (x )
ROE (%)
0
1
2
3
4
5
6
7
0
5
10
15
20
25
2006 2007 2008 2009 2010
%x
P/E Historical (x)
PAR30+Writeoffs (%)

14
Global Equity Research14 July 2011
Frederic de Mariz(5511) 3048 [email protected]
The list also includes two countries that stand out far above all others in terms of total transaction amounts: India and Peru. At US$290 million, the combined transactions of the two countries account for 38% of the value in CGAP’s private equity database across all six years of collected data.
India: Unprecedented Crisis, but No Spill-Overs AbroadUntil recently, India’s private equity market reflected extraordinary dynamism, with portfolios seeing near-100% growth every year since 2006. However, as indicated in the graph below, new share issuance in India fell dramatically in 2010, with most of the reported transactions occurring in the secondary market.10 These transactions also saw a significant drop in forward price to book multiples. With Indian MFIs continuing to operate under crisis conditions, these multiples are likely to fall further during 2011, possibly below the world median of 1.4x book.
Figure 5: India’s shift in transaction types
Source: CGAP
Figure 6: Impact of Andhra Pradesh crisis on SKS
Source: SKS Red Herring Prospectus, Bombay Stock Exchange.
SKS issued its IPO on August 16, 2010. In October, following widely publicized suicides of several microfinance borrowers in Andhra Pradesh (AP), government action at the state level essentially stopped all microfinance activity in the state. There were no private equity transactions in India in 2010 after the AP crisis, and investor feedback suggests much reduced activity in 2011. Meanwhile, the performance of SKS stock illustrates the depth of the current crisis in Indian microfinance (SKS is down 45% since its IPO vs. +9% for the MSCI World Financials over the same time period).
However, the crisis in Indian microfinance has had little impact on microfinance valuation in other countries. As suggested by the chart below, the stock price performance of banks involved in microfinance such as Compartamos in Mexico or Bank Rakyat in Indonesia has not been affected by the AP crisis, reflecting instead company- and country-specific factors. The same has been true in the private equity space, with equity investors reporting little impact from the AP crisis on their investment activity outside India.
10 The decline in primary issuance took place well in advance of the current crisis in Andhra Pradesh that began in October 2010.
0
10
20
30
40
50
60
2007 2008 2009 2010
$m
Existing sharesNew shares
India and Peru alone represent 38% of total transaction amounts
since 2005.

15
Global Equity Research14 July 2011
Frederic de Mariz(5511) 3048 [email protected]
Figure 7: The Indian microfinance crisis has had little impact on other marketsRelative stock price performance of Compartamos, Bank Rakyat, and SKS since the AP crisis: valuations are
driven by country- and company-specific factors
Source: J.P. Morgan estimates, Bloomberg. Prices as of July 11, 2011.
We believe that the Indian microfinance market will go through a difficult adjustment phase, with high delinquency rates, significant write-offs, and lower funding availability for MFIs, especially for those MFIs with a high exposure in AP. On the regulatory front, the outlook is improving but remains uncertain. The Reserve Bank of India (RBI) issued its long-awaited policy on microfinance institutions on May 3, 2011, which includes interest rate and margin caps. On July 6, 2011, the Indian Finance Ministry introduced “The Micro Finance Institutions Bill,” which gives RBI the authority to regulate microfinance activities. This bill overrides other laws, in particular state laws. However, we believe that the implementation of this bill and in particular collections of loans will continue to be difficult in the medium term.
Peru: a Mature Market with Favorable InstitutionsPeru is in many respects the opposite of India. It is a mature microfinance market, with a penetration of microcredit at 10.6% of the population. The sector has grown at 36% per annum over 2005-09—about half the rate of Indian MFIs during the same period.11 Unlike India, growth in Peruvian microfinance is also largely driven by deposits instead of wholesale bank funding and features more diverse product lines than India’s largely mono-line provision of group credit. Peru also boasts one of the best microfinance regulatory frameworks in the world, including a well functioning credit bureau.12
These factors, combined with a positive macroeconomic outlook, have attracted a lot of interest from microfinance investors.13 Another sign of Peru’s market maturation has been the degree of market consolidation, including the record-setting US$96 million acquisition of Financiera Edyficar by Banco de Credito de Peru in 2009.
11 MIX Market.12 Global microscope on the microfinance business environment 2010, Economist Intelligence Unit13 However, we note that the recent presidential election of Mr. Humala could represent a risk to the sector, in case unorthodox measures are approved.
0
20
40
60
80
100
120
140
160
1-Oct-10 1-Nov-10 1-Dec-10 1-Jan-11 1-Feb-11 1-Mar-11 1-Apr-11 1-May-11 1-Jun-11 1-Jul-11
COMPARC* Equity BBRI IJ Equity SKSM IN Equity

16
Global Equity Research14 July 2011
Frederic de Mariz(5511) 3048 [email protected]
Nevertheless, despite this supportive environment, there have been indications that the risk of over-indebtedness in Peru may be rising.14
Table 9: Top acquisition transactions may herald new phase of consolidation
Date Target AcquirerTransaction
AmountForward
P/BHistorical
P/E
Sep 2009 Financiera Edyficar (Peru) Banco de Credito de Peru US$96mn 2.5x 4.3xNov 2009 FINSOL (Mexico / Brazil) Financiera Independencia (Mexico) US$41mn NA 18.0xDec 2010 Apoyo Economico Familiar (Mexico) Financiera Independencia (Mexico) US$87mn 5.4x NAMar 2011 Financiera CREAR (Peru) Compartamos Banco (Mexico) US$63mn 3.6x 10.9x
Source: J.P. Morgan.
India vs. Peru
These different elements are reflected in the valuation levels of the two countries. Given the rapid growth of Indian MFIs and the size of their potential market, Indian MFIs have commanded a substantial premium over their counterparts in Peru—sometwo times higher book valuation every year since 2006. However, considering the current situation in India, we would expect price to book multiples there to decline substantially in 2011. Meanwhile, Peruvian MFI valuations may well continue their moderately upward trajectory over the near future.
Table 10: India valuations roughly double Peru’s over the years
Median P/BV (forward) Amt ($m) # of transactions
Year India Peru India Peru India Peru2005 n/a
0.80.2 0.3 1 2
20061.8
0.3 1.9 1 72007
0.832.2 6.4 4 3
2008 1.4 50.7 1.8 6 22009* 2.1
0.946.7 101.8 10 3
2010 1.7 46.5 4.4 10 2
Source: CGAP. * 2009 Jan-Sep only; Valuations are aggregated across years such that a minimum of 5 observations are available.
14 Over-indebtedness and Microfinance: Constructing an Early Warning Index. Center for Microfinance, University of Zurich: 2010.

17
Global Equity Research14 July 2011
Frederic de Mariz(5511) 3048 [email protected]
2. Valuation of Publicly Listed Companies—Lower Income Finance Institutions
Lower income finance institutions (LIFIs) provide financial services (consumer, microenterprise loans, payments, savings, and insurance) to low-income segments of the population but do not necessarily have a double bottom line. As they operate largely in the same market, they offer interesting comparables for MFI valuations. The companies that we select as LIFIs must meet the following conditions: 1) offer financial services; 2) serve the low-income segment of the population; 3) be listed on an exchange, with daily liquidity of at least US$0.2 million.15
Based on these criteria, we identified 11 listed LIFIs that have a broad microfinance focus. In this section, we attempt to answer three key questions:
What is the performance of LIFI stocks in absolute and relative terms?
Do LIFIs continue to outperform traditional banks; and if not, do we see evidence that valuations of LIFIs are converging toward valuations of traditional banks?
What impact did India’s Andhra Pradesh crisis have on LIFIs and MFIs outside of India?
Enhancing the LIFI Index
The LIFI Index is a market cap–weighted index of 11 companies, encompassing various geographies and business models. The index includes banks that are not exclusively offering working capital loans to micro-entrepreneurs, broadening the scope to include consumer loans and other financial services.
Since last year’s edition of our report, we have removed Banco PanAmericano from the index as its valuation was impacted by a large-scale fraud in November 2010, requiring bailout from the Brazilian deposit-guarantee agency. At the same time, we have added four institutions to the index: Equity Bank (Kenya), SKS (India, listed August 16, 2010), Capitec (South Africa), and Bank Tabungan Pensionan (Indonesia).
We list in the table below the main country of operations of those LIFIs as well as their focus. The last column indicates the current weight of each institution in the index, based on its market capitalization.
However, we decided to reduce the weight of some institutions as their operations are not fully focused on low income finance. For example, we assign a weight of 50% to Bank Rakyat Indonesia as we estimate that roughly 50% of BRI’s revenues and operations correspond to lower income finance, reducing its weight in the index to 50% of what its market cap would imply.
15 We defined this third condition with an arbitrary daily liquidity minimum target of US$0.2 million. Stock liquidity ensures that the price reported by data providers, such as Bloomberg, is not distorted by temporary imbalances between supply and demand of shares.
The LIFI index comprises 11 lower income finance
institutions in various
geographies.

18
Global Equity Research14 July 2011
Frederic de Mariz(5511) 3048 [email protected]
Table 11: Institutions in the LIFI Index
Company Country FocusAdjustment to Market
Cap WeightCurrent Weight in
the LIFI Index
Bank Rakyat Indonesia
Government-owned bank (57%) focusing on rural micro-lending (4,420 outlets across Indonesia). Micro- and payroll loans represent ~50% of the loan book, but a higher stake in revenues.
50% 37%
Bank Danamon Indonesia
Consumer mass market lending, with more than 1,000 outlets. Self-employed entrepreneurs are ~20% of loans, while segment of 2- and 4-wheelers represents ~40% of total loans.
60% 13%
Bank Tabungan Pensiunan IndonesiaMostly focused on pensioners, while ~20% of loans go to micro-borrowers.
20% 2%
SKS IndiaLargest MFI in India with a market share of ~23%, with loan growth of ~15x over the past 4 years. Andhra Pradesh represents ~30% of total loans of SKS.
100% 3%
African Bank South AfricaIndividual consumer lending. African Bank owns a furniture retailer (~25% of group's revenues).
75% 11%
Capitec South AfricaIndividual consumer lending. Capitec offers a full suite of transactional banking services.
100% 9%
Equity Bank KenyaMicro-lender offering credit, savings and fund transfer services in Kenya, Southern Sudan, and Uganda. The bank accounts for roughly half of Kenyan bank accounts.
100% 4%
Compartamos Mexico / PeruMicro-loans to entrepreneurs; group lending methodology (more than 80% of total loans).
100% 11%
Financiera Independencia MexicoMicro-loans to individual consumers (~80% of total) and group lending to entrepreneurs (~20% of total loans).
100% 2%
First Cash Financial Mexico / USAPawn store, with half of revenues coming from interest income and half coming for inventory sales.
100% 5%
IPF Eastern Europe / MexicoConsumer lending present in six countries, originated through independent workforce.
100%
Source: J.P. Morgan. We indicate the weight in the LIFI index as of July 11, 2011.
We show in the two charts below the distribution of countries and individual stocks in the LIFI index.
The breakdown of countries in the LIFI index (i.e., on public markets) is very different from the breakdown on the private equity market described in the section above. The countries attracting meaningful interest from private equity players in microfinance—India, Peru, and Cambodia—are not represented in the LIFI index. Peru and Cambodia are not represented at all, while India represents only 3% of the index (via SKS—the only listed LIFI in India). We highlight that the weight of SKS reached a peak of 10% of the index in September 2010, but its market capitalization, and hence weight in the index, fell significantly due to the Andhra Pradesh crisis (Oct 2010). The resulting weighting of the index only serves to remind us that Indonesia combines the most mature and competitive market for microfinance (Bank Rakyat was founded in 1895) with an especially well-developed stock market (unlike Bangladesh, for example).
The LIFI index is a market cap–
weighted index: Indonesia
represents 51% of the index, India only 3%.

19
Global Equity Research14 July 2011
Frederic de Mariz(5511) 3048 [email protected]
Figure 8: Breakdown of the LIFI index by country
Source: J.P. Morgan. Other include the operations of IPF—International Personal Finance,
present in six countries in Eastern Europe and Mexico. The category also includes the revenues
derived from the US operations of First Cash Financial (approximately half of the total for First
Cash). Data as of July 11, 2011.
Figure 9: Breakdown of the LIFI index by stock
Source: J.P. Morgan. Data as of July 11, 2011.
The LIFI Index Outperformed over the Long Term . . .
We present below the historical evolution of the LIFI index, and in particular its relative performance compared to world financial stocks and emerging markets banks. We then look at the current trading multiples of the index.
Figure 10: Since Nov-2003: LIFI outperform
Source: J.P. Morgan, Bloomberg, prices as of July 11, 2011. LIFI index as built by J.P. Morgan.
MSCI World Financials, ticker: MXWOOFN Index. MSCI EM Banks, ticker: MXEF0BK Index.
Figure 11: Since Nov-2007 (index pick): LIFI outperform
Source: J.P. Morgan, Bloomberg, prices as of July 11, 2011. LIFI index as built by J.P. Morgan.
MSCI World Financials, ticker: MXWOOFN Index. MSCI EM Banks, ticker: MXEF0BK Index.
Figure 12: Since Sep-2008 (Lehman bankruptcy): LIFI outperform
Source: J.P. Morgan, Bloomberg, prices as of July 11, 2011. LIFI index as built by J.P. Morgan.
MSCI World Financials, ticker: MXWOOFN Index. MSCI EM Banks, ticker: MXEF0BK Index.
Figure 13: Since Oct-2010 (Andhra Pradesh crisis): LIFI volatile
Source: J.P. Morgan, Bloomberg, prices as of July 11, 2011. LIFI index as built by J.P. Morgan.
MSCI World Financials, ticker: MXWOOFN Index. MSCI EM Banks, ticker: MXEF0BK Index.
Indonesia52%South
Africa20%
Mexico16%
Kenya4%
India3%
Other5%
Rakyat37%
Danamon13%
African Bk12%
Comparc11%
Capitec9%
First Cash5%
Equity4%
SKS3%
Findep2%
IPF2%
Tabungan2%
0
100
200
300
400
500
600
700
800
900
Nov-03 Nov-04 Nov-05 Nov-06 Nov-07 Nov-08 Nov-09 Nov-10
LIFI Index MSCI World Financials MSCI EM Banks
0
20
4060
80
100
120140
160
180
Nov-07 May-08 Nov-08 May-09 Nov-09 May-10 Nov-10 May-11
LIFI Index MSCI World Financials MSCI EM Banks
0
50
100
150
200
250
Sep-08 Mar-09 Sep-09 Mar-10 Sep-10 Mar-11
LIFI Index MSCI World Financials MSCI EM Banks
80
85
90
95
100
105
110
115
Oct-10 Dec-10 Feb-11 Apr-11 Jun-11
LIFI Index MSCI World Financials MSCI EM Banks

20
Global Equity Research14 July 2011
Frederic de Mariz(5511) 3048 [email protected]
Historical Performance of the LIFI IndexAs noted in previous editions of this report, LIFIs have generally outperformed both emerging markets and developed markets banks. We compare the performance of the LIFI Index versus global financial institutions (as measured by the MSCI World Financials Index) and emerging markets banks (as measured by the MSCI EM Banks Index). The charts above show that the LIFI index outperformed significantly both global financials and EM banks over long time periods:
Since the launch of the LIFI index in November 2003, LIFIs outperformed global financials by 756% and EM banks by 512%.
Since the LIFI index reached its peak in November 2007, LIFIs outperformed global financials by 99% and EM banks by 59%.
Since the Lehman bankruptcy in September 2008, generally considered as the beginning of the past financial crisis, LIFIs outperformed global financials by 142% and EM banks by 83%.
. . . but Outperformance Was Volatile in 2011
Looking at the performance of LIFIs since the Andhra Pradesh crisis at the end of October 2010, or even year to date, LIFIs still outperform but their performance is volatile. In particular, LIFIs outperformed world financials by 8% and EM banks by 9% year-to-date. This outperformance happened despite the decline in SKS market capitalization, which dropped by 15% year-to-date. We analyzed the performance of the LIFI index for each year since January 2004. The table below shows the annual performance of the indices considered (LIFI, MSCI World Financials, MSCI EM Banks).
Table 13: Year-to-date performance of indices: LIFIs outperformed every year expect 2005 and 2007
2004 YTD 2005 YTD 2006 YTD 2007 YTD 2008 YTD 2009 YTD 2010 YTD 2011 YTD
LIFI Index 108% 10% 53% 14% -42% 93% 47% 8%MSCI World Financials 14% 9% 20% -12% -55% 25% 2% 0%MSCI EM Banks 39% 32% 32% 23% -53% 83% 17% -1%
Source: J.P. Morgan, Bloomberg, prices as of July 11, 2011.
Importantly, LIFIs outperformed World Financials and EM banks for six of the eight years since 2004, except for 2005 and 2007.
In both years (2005 and 2007), the LIFI Index had a positive performance, but it was lower than for traditional emerging market banks as measured by the MSCI EM Banks index. In 2005, the LIFI index was negatively impacted by the underperformance of BRI (stock up only 3% in FY2005 vs. 32% for emerging market banks), in particular in the second half of the year. And in 2005, BRI represented more than a third of the total index due to its relatively larger market cap.
In 2007, the LIFI index was mostly impacted by the underperformance of Mexican stocks: Compartamos was down 9% in 2007 (despite its successful IPO in April), while Financiera Independencia was down 24% in 2007. Both stocks represented
Over long time periods, the LIFI
index generally outperformed global financials and emerging
markets banks.
Table 12: Performance of LIFI
LIFI Index
MSCI World
Financials
MSCI EM Banks
Since launch (Nov-2003)
836 80 324
Since peak
(Nov-2007)152 53 93
Since Lehman
(Sep-2008)224 82 142
Source: Bloomberg, J.P. Morgan, prices as of July 11, 2011.
Indices rebased for each period, 100 for the beginning of each
time period.
More recently (year-to-date), the
LIFI index has had a volatile performance, but still
outperformed world financials
and EM banks.

21
Global Equity Research14 July 2011
Frederic de Mariz(5511) 3048 [email protected]
22% of the LIFI index at the end of 2007. In 2007, emerging market bank stocks increased by 23%.
If we consider 2011 year-to-date, world financials started the year outperforming the other indices, catching up a bit after a few years of disappointing performance. This is in line with what we saw in global markets, where developed markets generally outperformed emerging markets across asset classes in 1Q2011. However, in 2Q2011, world financials stocks reversed the outperformance seen in the beginning of the year and are flat year-to-date. Year-to-date, the LIFI Index outperformed the other indices.
Current Valuation of the LIFI Index
The Lower Income Finance Index was used to track historical performance. As forward looking estimates lack for some of the companies in the index, we focus only on trailing multiples in the table below.
Table 14: Valuation summary: Comparing the LIFI index with traditional banks
Country of Mkt. Cap ADTV Local P/E P/BV ROE
Company Ticker Listing (US$ MM) (US$ MM) Price 11E 10A 11E
African Bank ABL SJ S. Africa 4,052 16.6 3,447.0 11.8 2.2 16%Capitec CPI SJ S. Africa 2,330 1.3 18,450.0 18.7 5.5 45%Equity Bank EQBNK KN Kenya 982 0.6 24.0 9.2 3.3 30%Bank Rakyat BBRI IJ Indonesia 19,777 23.1 6,850.0 13.0 4.7 30%Danamon BDMN IJ Indonesia 5,865 4.7 5,950.0 14.3 2.8 19%Tabungan BTPN IJ Indonesia 2,237 0.2 3,375.0 15.1 4.6 24%SKS SKSM IN India 884 6.9 543.7 NA 2.1 NACompartamos COMPARTO MM Mexico 2,973 0.1 21.6 15.9 6.6 35%Fin. Independencia FINDEP* Mexico 603 0.3 9.9 11.8 2.7 29%First Cash Financial FCFS US USA / Mexico 1,337 7.4 42.7 19.2 5.0 20%IPF IPF LN UK 1,498 0.9 366.1 12.3 3.1 22%
LIFI Index 12.9 4.2 26%
11E 10A 11E
Africa 10.7 1.8 16%Developed Asia Pacific 14.1 1.9 14%Emerging Asia Pacific 16.1 2.8 20%Emerging Europe / Middle East 12.6 2.0 16%Latin America 11.2 2.4 21%Market Cap. Weighted Averages for Banks Covered by J.P. Morgan 14.3 2.4 18%
Source: J.P. Morgan, Bloomberg estimates, prices as of July 11, 2011. ADTV = average daily trading volume for the past three months.
Note on Compartamos: We used historical data for ticker COMPARTO until January 3, 2011, shortly after the company announced a reorganization. After that date, we use the price performance
corresponding to ticker COMPARC.
Notes for the Lower-Income Financial Institutions (LIFI) Index: We used Bloomberg consensus estimates (EPS GAAP, and ROE) for the individual stocks composing the LIFI Index. The Lower-
Income Financial Institutions Index is a market capitalization-weighted index.
Notes for Global Emerging Markets Banks: We show market capitalization-weighted averages of banks covered by J.P. Morgan analysts, representing a sample of 117 banks across global
markets.
We note that the LIFI Index currently trades at 12.9x 2011E earnings and 4.2x 2010 book value. This represents a lower earnings multiple and higher book multiple than traditional global banks. We focus more on the book value multiples, as earnings of traditional banks have been under pressure, therefore inflating earnings multiples. In fact, global banks, as measured by an average of 117 banks covered by J.P. Morgan analysts, trade at average multiples of 14.3x 2011E earnings and 2.4x 2010 book value.
22
Global Equity Research14 July 2011
Frederic de Mariz(5511) 3048 [email protected]
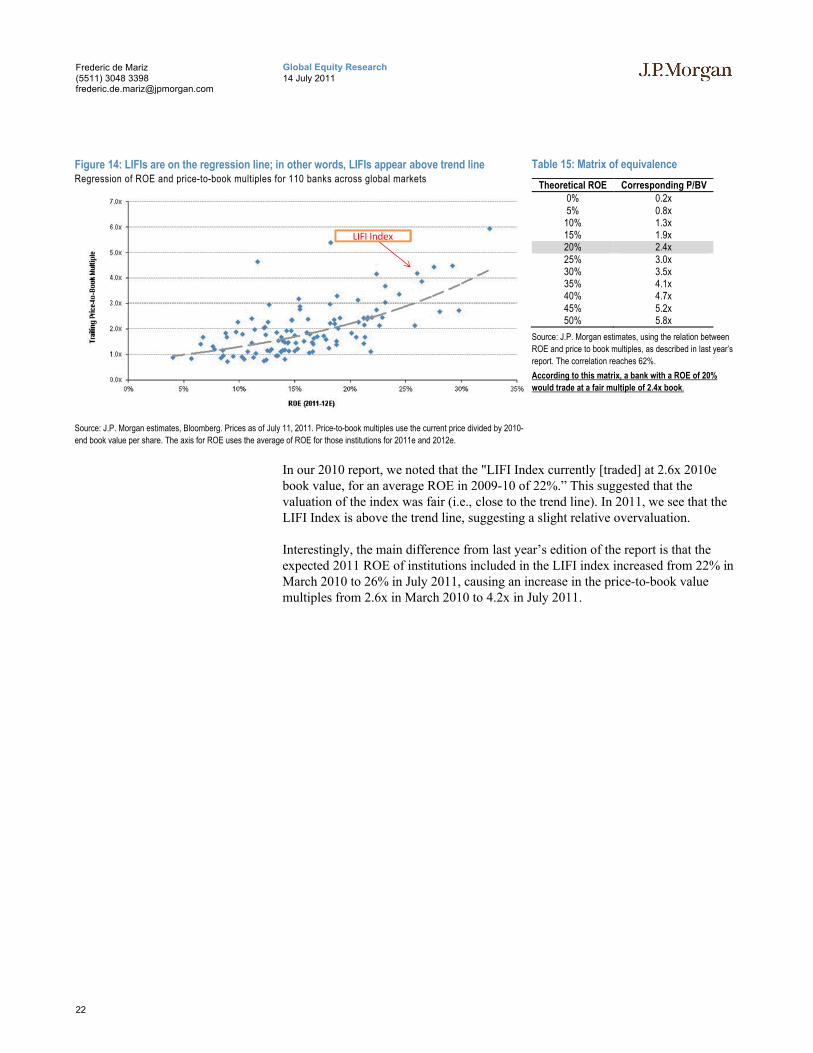
Figure 14: LIFIs are on the regression line; in other words, LIFIs appear above trend lineRegression of ROE and price-to-book multiples for 110 banks across global markets
Source: J.P. Morgan estimates, Bloomberg. Prices as of July 11, 2011. Price-to-book multiples use the current price divided by 2010-
end book value per share. The axis for ROE uses the average of ROE for those institutions for 2011e and 2012e.
Table 15: Matrix of equivalence
Theoretical ROE Corresponding P/BV0% 0.2x5% 0.8x
10% 1.3x15% 1.9x20% 2.4x25% 3.0x30% 3.5x35% 4.1x40% 4.7x45% 5.2x50% 5.8x
Source: J.P. Morgan estimates, using the relation between
ROE and price to book multiples, as described in last year’s
report. The correlation reaches 62%.
According to this matrix, a bank with a ROE of 20%
would trade at a fair multiple of 2.4x book.
In our 2010 report, we noted that the "LIFI Index currently [traded] at 2.6x 2010e book value, for an average ROE in 2009-10 of 22%.” This suggested that the valuation of the index was fair (i.e., close to the trend line). In 2011, we see that the LIFI Index is above the trend line, suggesting a slight relative overvaluation.
Interestingly, the main difference from last year’s edition of the report is that the expected 2011 ROE of institutions included in the LIFI index increased from 22% in March 2010 to 26% in July 2011, causing an increase in the price-to-book value multiples from 2.6x in March 2010 to 4.2x in July 2011.
LIFI Index

23
Global Equity Research14 July 2011
Frederic de Mariz(5511) 3048 [email protected]
Conclusion
The years 2009-2010 have been difficult for the global microfinance sector. The problems of unsustainable growth and the associated risk of over-indebtedness in some of the most active investor markets—Bosnia, Nicaragua, and most recently, India—have seriously tarnished the industry’s image.
Globally, MFI book valuations have reversed their four-year growth trend, recording a slight drop in book value multiples. However, there are strong country variations. While several flagship microfinance markets, such as India, have experienced a severe correction, valuations in several other countries, especially in Latin America, have continued to increase. Publicly listed LIFIs have for the most part tended to reflect local country- and company-specific trends, with no apparent impact from the broader downturn.
New investment opportunities for cross-border equity investors appear to be in large emerging microfinance markets such as China, Nigeria or Brazil earlier in their development cycle. In more mature markets, and especially in parts of Latin America, domestic and regional strategic investors are expected to play an increased role. Already large financial institutions are seeking to expand downmarket and acquire MFIs. Recent examples include acquisitions by the BBVA foundation of nine MFIs in Latin America. Some mobile network operators are also looking at strategic partnerships with financial institutions, including MFIs. Consolidation and MFI mergers should accelerate in the most mature markets, such as Peru.
In 2011 we don’t expect to see new IPOs as the market is still recovering and learning its lesson from the disappointing SKS IPO in India. Under this backdrop, we believe that MFI book value multiples will stabilize around 1.5x book for private equity and around current levels (or roughly 4x book) for listed institutions on a forward basis. We also expect to see more price variations between countries, as valuations become increasingly guided by company and market specifics.

24
Global Equity Research14 July 2011
Frederic de Mariz(5511) 3048 [email protected]
Appendix I: Methodology
The sample covers 238 transactions that occurred between January 2005 and December 2010, excluding the 3-month period of Sep-Dec 2009. The aggregate value of all transactions is US$768 million.
Transaction data were collected and processed by CGAP and communicated to J.P. Morgan in the form of aggregates. This was done to preserve the confidentiality of the underlying data.
During this survey cycle, covering the period of Jan-Dec 2010, we collected 66 individual transactions, only 37 of which were included in our sample (one additional deal was added for 2009). Transactions were dropped when they met the following criteria: if they were executed at nominal value where no valuation process could be assumed; if they were part of loans being converted into equity; part of a pre-agreed investment stage, the price of which had been set during prior years; or other deal types where valuation was not done during this cycle. In addition, when calculating price to earnings ratios, we followed last year’s process and eliminated outliers with (1) negative multiples and (2) price to earnings multiples above 40.
Transactions that involved multiple parties that had done the valuation jointly are treated as one single transaction. This avoids a potential bias caused by including the same transaction information several times in the database.
This report presents aggregates only when at least five underlying observations per aggregate were available. Cases with fewer observations are marked with “NA” throughout the report.
This year’s report features an important change in the book valuation methodologyused throughout the report. In previous reports we have relied on the historical priceto book valuation, defined by the following formula: Market capitalization at time of transaction / historical book value.
Figure 15: Forward book multiple has no upward skewing
Source: CGAP.
While this is a widely used standard in the industry, for new money transactions, it tends to skew the result, essentially by accounting for the newly invested money in the numerator but excluding it in the denominator. The general effect has thus been to skew book valuations upward, and the greater the amount of equity invested relative to prior book value, the larger the skewing effect (Figure A1).
Historical
Forward
0
1
2
3
4
5
2005 2006 2007 2008 2009 2010
Historical AvgHistorical MedForward AvgForward Med
To avoid upward skewing effects, we have changed book
valuation from historical to
forward book value.

25
Global Equity Research14 July 2011
Frederic de Mariz(5511) 3048 [email protected]
We therefore prefer to use post-money book value multiples, that is, include the newly invested equity in the denominator. However, since we have not collected this data since the start of the private equity survey, we used the next-best option—the forward book value provided by investors. While this may bias the valuation slightly downward for companies with especially high ROEs (as their retained earnings reflect a greater addition to book value after the transaction date), we believe this to be a significantly smaller bias than the upward bias of using historical book value. Although the new methodology has lowered overall book valuation levels, the general trends have remained unchanged.
Below, we include a set of summary 2010 valuation tables, grouped by different performance and organizational metrics. Please note that due to the small size of the dataset (37 transactions in survey, only 29 of them with MIX data), one shouldapproach extrapolation with caution. In particular, it’s important to note that for those metrics that appear to have some predictive value, such as Total Assets (and its proxies, Market Cap and Transaction Size), PAR 30 + Write-Offs, and ROE, the high-valuation group is largely dominated by the same group of five MFIs across all categories, making extrapolation all the more problematic.
Figure 16: Transaction multiples
Source: CGAP, MIX.
Median Average Sample Median Average Sample
<$1 million 1.2 1.2 10 <$10 million 1.1 1.1 13
$1-2 million 1.3 1.5 8 $10-50 million 1.2 1.3 13
$2-5 million 1.3 1.4 8 >$50 million 2.4 2.7 9
>$5 million 2.0 2.3 9
Median Average Sample Median Average Sample
<3% 1.9 2.1 10 <0% 1.2 1.2 10
3-10% 1.1 1.3 8 0-15% 1.4 1.6 9
>10% 1.2 1.7 9 >15% 2.2 2.3 9
Median Average Sample Median Average Sample
<3 1.5 1.5 6 <$50 million 1.2 1.3 10
3-6 1.2 1.8 12 $50-200 million 1.1 1.6 10
>6 1.7 1.7 10 >$200 million 2.3 2.3 8
Leverage
P/BV Forward
Total Assets
P/BV Forward
Transaction
Size
P/BV Forward
Market Cap
P/BV Forward
PAR 30 +
Writeoff
P/BV Forward
ROE
P/BV Forward

26
Global Equity Research14 July 2011
Frederic de Mariz(5511) 3048 [email protected]
Data Sources
Throughout this report, when we indicated CGAP as a source, we used data that came from a number of institutions active in the microfinance private equity market, listed below. CGAP takes the data it receives from these institutions and aggregates it.
ACCION*
Advans
Bellwether
BIO
Blue Orchard
DWM
DFE
EBRD
Elevar Capital
FMO
Incofin
India Financial Inclusion Fund
Microvest
MicroCred
NMI
Norfund
Oikocredit
Omidyar-Tufts
Proparco
ResponsAbility
SIDI
Triodos
* Daniel Rozas, one of the collaborators, is currently employed as a Risk Manager at Accion.
27
Global Equity Research14 July 2011
Frederic de Mariz(5511) 3048 [email protected]
Analyst Certification: The research analyst(s) denoted by an “AC” on the cover of this report certifies (or, where multiple research analysts are primarily responsible for this report, the research analyst denoted by an “AC” on the cover or within the document individually certifies, with respect to each security or issuer that the research analyst covers in this research) that: (1) all of the views expressed in this report accurately reflect his or her personal views about any and all of the subject securities or issuers; and (2) no part of any of the research analyst's compensation was, is, or will be directly or indirectly related to the specific recommendations or views expressed by the research analyst(s) in this report.
In compliance with Instruction 483 issued by Comissao de Valores Mobiliarios (the Brazilian securities commission) on July 6, 2010, the Brazilian primary analyst signing this report declares: (1) that all the views expressed herein accurately reflect his or her personal views about the securities and issuers; (2) that all recommendations issued by him or her were independently produced, including from the entity in which he or she is an employee; and (3) that he or she will set forth any situation or conflict of interest believed to impact the impartiality of the recommendations herein, as per article 17, II of Instruction 483.
Important Disclosures
MSCI: The MSCI sourced information is the exclusive property of Morgan Stanley Capital International Inc. (MSCI). Without prior written permission of MSCI, this information and any other MSCI intellectual property may not be reproduced, redisseminated or used to create any financial products, including any indices. This information is provided on an 'as is' basis. The user assumes the entire risk of any use made of this information. MSCI, its affiliates and any third party involved in, or related to, computing or compiling the information hereby expressly disclaim all warranties of originality, accuracy, completeness, merchantability or fitness for a particular purpose with respect to any of this information. Without limiting any of the foregoing, in no event shall MSCI, any of its affiliates or any third party involved in, or related to, computing or compiling the information have any liability for any damages of any kind. MSCI, Morgan Stanley Capital International and the MSCI indexes are services marks of MSCI and its affiliates.
Explanation of Equity Research Ratings and Analyst(s) Coverage Universe: J.P. Morgan uses the following rating system: Overweight [Over the next six to twelve months, we expect this stock will outperform the average total return of the stocks in the analyst's (or the analyst's team's) coverage universe.] Neutral [Over the next six to twelve months, we expect this stock will perform in line with the average total return of the stocks in the analyst's (or the analyst's team's) coverage universe.] Underweight [Over the next six to twelve months, we expect this stock will underperform the average total return of the stocks in the analyst's (or the analyst's team's) coverage universe.] The analyst or analyst's team's coverage universe is the sector and/or country shown on the cover of each publication. See below for the specific stocks in the certifying analyst(s) coverage universe.
Coverage Universe: de Mariz, Frederic Rozeira: Anhanguera (AEDU3.SA), Banco ABC Brasil (ABCB4.SA), Banco PanAmericano (BPNM4.SA), Banrisul (BRSR6.SA), BicBanco (BICB4.SA), Brasil Insurance (BRIN3.SA), Cetip (CTIP3.SA), Compartamos (COMPARC.MX), Estacio (ESTC3.SA)
J.P. Morgan Equity Research Ratings Distribution, as of June 30, 2011
Overweight(buy)
Neutral(hold)
Underweight(sell)
J.P. Morgan Global Equity Research Coverage 47% 42% 11%IB clients* 50% 46% 32%
JPMS Equity Research Coverage 45% 47% 8%IB clients* 70% 64% 52%
*Percentage of investment banking clients in each rating category.For purposes only of FINRA/NYSE ratings distribution rules, our Overweight rating falls into a buy rating category; our Neutral rating falls into a hold rating category; and our Underweight rating falls into a sell rating category.
Equity Valuation and Risks: Please see the most recent company-specific research report for an analysis of valuation methodology and risks on any securities recommended herein. Research is available at http://www.morganmarkets.com , or you can contact the analyst named on the front of this note or your J.P. Morgan representative.
Equity Analysts' Compensation: The equity research analysts responsible for the preparation of this report receive compensation based upon various factors, including the quality and accuracy of research, client feedback, competitive factors, and overall firm revenues, which include revenues from, among other business units, Institutional Equities and Investment Banking.
Other Disclosures
J.P. Morgan ("JPM") is the global brand name for J.P. Morgan Securities LLC ("JPMS") and its affiliates worldwide. J.P. Morgan Cazenove is a marketing name for the U.K. investment banking businesses and EMEA cash equities and equity research businesses of JPMorgan Chase & Co. and its subsidiaries.

28
Global Equity Research14 July 2011
Frederic de Mariz(5511) 3048 [email protected]
Options related research: If the information contained herein regards options related research, such information is available only to persons who have received the proper option risk disclosure documents. For a copy of the Option Clearing Corporation's Characteristics and Risks of Standardized Options, please contact your J.P. Morgan Representative or visit the OCC's website at http://www.optionsclearing.com/publications/risks/riskstoc.pdf
Legal Entities Disclosures U.S.: JPMS is a member of NYSE, FINRA,SIPC and the NFA. JPMorgan Chase Bank, N.A. is a member of FDIC and is authorized and regulated in the UK by the Financial Services Authority. U.K.: J.P. Morgan Securities Ltd. (JPMSL) is a member of the London Stock Exchange and is authorized and regulated by the Financial Services Authority. Registered in England & Wales No. 2711006. Registered Office 125 London Wall, London EC2Y 5AJ. South Africa: J.P. Morgan Equities Limited is a member of the Johannesburg Securities Exchange and is regulated by the FSB. Hong Kong: J.P. Morgan Securities (Asia Pacific) Limited (CE number AAJ321) is regulated by the Hong Kong Monetary Authority and the Securities and Futures Commission in Hong Kong. Korea: J.P. Morgan Securities (Far East) Ltd, Seoul Branch, is regulated by the Korea Financial Supervisory Service. Australia: J.P. Morgan Australia Limited (ABN 52 002 888 011/AFS Licence No: 238188) is regulated by ASIC and J.P. Morgan Securities Australia Limited (ABN 61 003 245 234/AFS Licence No: 238066) is a Market Participant with the ASX and regulated by ASIC. Taiwan: J.P.Morgan Securities (Taiwan) Limited is a participant of the Taiwan Stock Exchange (company-type) and regulated by the Taiwan Securities and Futures Bureau. India: J.P. Morgan India Private Limited, having its registered office at J.P. Morgan Tower, Off. C.S.T. Road, Kalina, Santacruz East, Mumbai - 400098, is a member of the National Stock Exchange of India Limited (SEBI Registration Number - INB 230675231/INF 230675231/INE 230675231) and Bombay Stock Exchange Limited (SEBI Registration Number - INB 010675237/INF 010675237) and is regulated by Securities and Exchange Board of India. Thailand: JPMorgan Securities (Thailand) Limited is a member of the Stock Exchange of Thailand and is regulated by the Ministry of Finance and the Securities and Exchange Commission. Indonesia: PT J.P. Morgan Securities Indonesia is a member of the Indonesia Stock Exchange and is regulated by the BAPEPAM LK. Philippines: J.P. Morgan Securities Philippines Inc. is a member of the Philippine Stock Exchange and is regulated by the Securities and Exchange Commission. Brazil: Banco J.P. Morgan S.A. is regulated by the Comissao de Valores Mobiliarios (CVM) and by the Central Bank of Brazil. Mexico: J.P. Morgan Casa de Bolsa, S.A. de C.V., J.P. Morgan Grupo Financiero is a member of the Mexican Stock Exchange and authorized to act as a broker dealer by the National Banking and Securities Exchange Commission. Singapore: This material is issued and distributed in Singapore by J.P. Morgan Securities Singapore Private Limited (JPMSS) [MICA (P) 025/01/2011 and Co. Reg. No.: 199405335R] which is a member of the Singapore Exchange Securities Trading Limited and is regulated by the Monetary Authority of Singapore (MAS) and/or JPMorgan Chase Bank, N.A., Singapore branch (JPMCB Singapore) which is regulated by the MAS. Malaysia: This material is issued and distributed in Malaysia by JPMorgan Securities (Malaysia) Sdn Bhd (18146-X) which is a Participating Organization of Bursa Malaysia Berhad and a holder of Capital Markets Services License issued by the Securities Commission in Malaysia. Pakistan: J. P. Morgan Pakistan Broking (Pvt.) Ltd is a member of the Karachi Stock Exchange and regulated by the Securities and Exchange Commission of Pakistan. Saudi Arabia: J.P. Morgan Saudi Arabia Ltd. is authorized by the Capital Market Authority of the Kingdom of Saudi Arabia (CMA) to carry out dealing as an agent, arranging, advising and custody, with respect to securities business under licence number 35-07079 and its registered address is at 8th Floor, Al-Faisaliyah Tower, King Fahad Road, P.O. Box 51907, Riyadh 11553, Kingdom of Saudi Arabia. Dubai: JPMorgan Chase Bank, N.A., Dubai Branch is regulated by the Dubai Financial Services Authority (DFSA) and its registered address is Dubai International Financial Centre - Building 3, Level 7, PO Box 506551, Dubai, UAE.
Country and Region Specific Disclosures U.K. and European Economic Area (EEA): Unless specified to the contrary, issued and approved for distribution in the U.K. and the EEA by JPMSL. Investment research issued by JPMSL has been prepared in accordance with JPMSL's policies for managing conflicts of interest arising as a result of publication and distribution of investment research. Many European regulators require a firm to establish, implement and maintain such a policy. This report has been issued in the U.K. only to persons of a kind described in Article 19 (5), 38, 47 and 49 of the Financial Services and Markets Act 2000 (Financial Promotion) Order 2005 (all such persons being referred to as "relevant persons"). This document must not be acted on or relied on by persons who are not relevant persons. Any investment or investment activity to which this document relates is only available to relevant persons and will be engaged in only with relevant persons. In other EEA countries, the report has been issued to persons regarded as professional investors (or equivalent) in their home jurisdiction. Australia: This material is issued and distributed by JPMSAL in Australia to "wholesale clients" only. JPMSAL does not issue or distribute this material to "retail clients". The recipient of this material must not distribute it to any third party or outside Australia without the prior written consent of JPMSAL. For the purposes of this paragraph the terms "wholesale client" and "retail client" have the meanings given to them in section 761G of the Corporations Act 2001. Germany: This material is distributed in Germany by J.P. Morgan Securities Ltd., Frankfurt Branch and J.P.Morgan Chase Bank, N.A., Frankfurt Branch which are regulated by the Bundesanstalt für Finanzdienstleistungsaufsicht. Hong Kong: The 1% ownership disclosure as of the previous month end satisfies the requirements under Paragraph 16.5(a) of the Hong Kong Code of Conduct for Persons Licensed by or Registered with the Securities and Futures Commission. (For research published within the first ten days of the month, the disclosure may be based on the month end data from two months prior.) J.P. Morgan Broking (Hong Kong) Limited is the liquidity provider/market maker for derivative warrants, callable bull bear contracts and stock options listed on the Stock Exchange of Hong Kong Limited. An updated list can be found on HKEx website: http://www.hkex.com.hk. Japan: There is a risk that a loss may occur due to a change in the price of the shares in the case of share trading, and that a loss may occur due to the exchange rate in the case of foreign share trading. In the case of share trading, JPMorgan Securities Japan Co., Ltd., will be receiving a brokerage fee and consumption tax (shouhizei) calculated by multiplying the executed price by the commission rate which was individually agreed between JPMorgan Securities Japan Co., Ltd., and the customer in advance. Financial Instruments Firms: JPMorgan Securities Japan Co., Ltd., Kanto Local Finance Bureau (kinsho) No. 82 Participating Association / Japan Securities Dealers Association, The Financial Futures Association of Japan. Korea: This report may have been edited or contributed to from time to time by affiliates of J.P. Morgan Securities (Far East) Ltd, Seoul Branch. Singapore: JPMSS and/or its affiliates may have a holding in any of the securities discussed in this report; for securities where the holding is 1% or greater, the specific holding is disclosed in the Important Disclosures section above. India: For private circulation only, not for sale. Pakistan: For private circulation only, not for sale. New Zealand: This material is issued and distributed by JPMSAL in New Zealand only to persons whose principal business is the investment of money or who, in the course of and for the purposes of their business, habitually invest money. JPMSAL does not issue or distribute this material to members of "the public" as determined in accordance with section 3 of the Securities Act 1978. The recipient of this material must not distribute it to any third party or outside New Zealand without the prior written consent of JPMSAL. Canada: The information contained herein is not, and under no circumstances is to be construed as, a prospectus, an advertisement, a public offering, an offer to sell securities described herein, or solicitation of an offer to buy securities described herein, in Canada or any province or territory thereof. Any offer or sale of the securities described herein in Canada will be made only under an exemption from the requirements to file a prospectus with the relevant Canadian securities regulators and only by a dealer properly registered under applicable securities laws or, alternatively, pursuant to an exemption from the dealer registration requirement in the relevant province or territory of Canada in which such offer or sale is made. The information contained herein is under no circumstances to be construed as investment advice in any province or territory of Canada and is
29
Global Equity Research14 July 2011
Frederic de Mariz(5511) 3048 [email protected]
not tailored to the needs of the recipient. To the extent that the information contained herein references securities of an issuer incorporated, formed or created under the laws of Canada or a province or territory of Canada, any trades in such securities must be conducted through a dealer registered in Canada. No securities commission or similar regulatory authority in Canada has reviewed or in any way passed judgment upon these materials, theinformation contained herein or the merits of the securities described herein, and any representation to the contrary is an offence. Dubai: This report has been issued to persons regarded as professional clients as defined under the DFSA rules.
General: Additional information is available upon request. Information has been obtained from sources believed to be reliable but JPMorgan Chase & Co. or its affiliates and/or subsidiaries (collectively J.P. Morgan) do not warrant its completeness or accuracy except with respect to any disclosures relative to JPMS and/or its affiliates and the analyst's involvement with the issuer that is the subject of the research. All pricing is as of the close of market for the securities discussed, unless otherwise stated. Opinions and estimates constitute our judgment as of the date of this material and are subject to change without notice. Past performance is not indicative of future results. This material is not intended as an offer or solicitation for the purchase or sale of any financial instrument. The opinions and recommendations herein do not take into account individual client circumstances, objectives, or needs and are not intended as recommendations of particular securities, financial instruments or strategies to particular clients. The recipient of this report must make its own independent decisions regarding any securities or financial instruments mentioned herein. JPMS distributes in the U.S. research published by non-U.S. affiliates and accepts responsibility for its contents. Periodic updates may be provided on companies/industries based on company specific developments or announcements, market conditions or any other publicly available information. Clients should contact analysts and execute transactions through a J.P. Morgan subsidiary or affiliate in their home jurisdiction unless governing law permits otherwise.
"Other Disclosures" last revised June 13, 2011.
Copyright 2011 JPMorgan Chase & Co. All rights reserved. This report or any portion hereof may not be reprinted, sold or redistributed without the written consent of J.P. Morgan. #$J&098$#*P