Embed Size (px)
Citation preview

DISCERNING TRENDS IN COMMODITY PRICES
WorkshoponCommoditySuperCycles– BankofCanada(Ottawa)April27‐28,2015
1DiscerningTrendsinCommodityPrices
DimitriDimitropoulosandAdonisYatchew
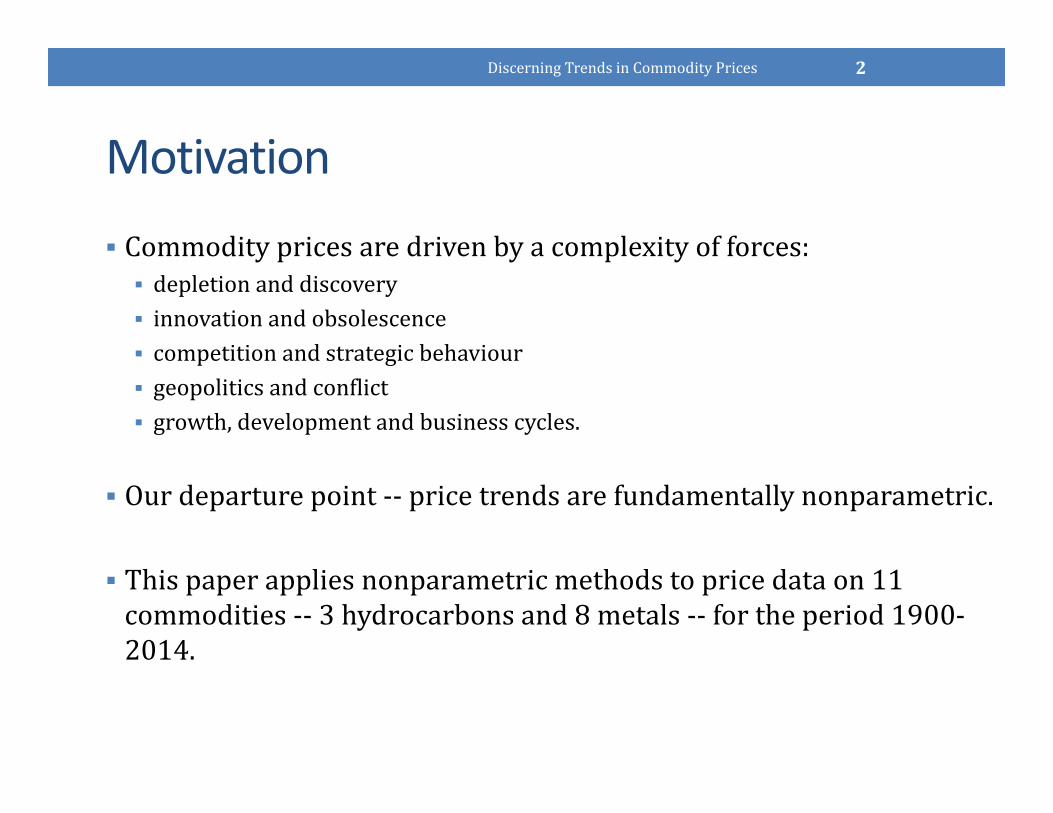
Motivation Commoditypricesaredrivenbyacomplexityofforces: depletionanddiscovery innovationandobsolescence competitionandstrategicbehaviour geopoliticsandconflict growth,developmentandbusinesscycles.
Ourdeparturepoint‐‐ pricetrendsarefundamentallynonparametric.
Thispaperappliesnonparametricmethodstopricedataon11commodities‐‐ 3hydrocarbonsand8metals‐‐ fortheperiod1900‐2014.
DiscerningTrendsinCommodityPrices 2

Nonparametric Modeling of TrendWedrawonthreeideasinthenonparametrics literaturetoconstructandestimateparsimoniousmodels:
1. ThePartialLinearModel
2. Cross‐Validation
3. ShapeSimilarity
DiscerningTrendsinCommodityPrices 3
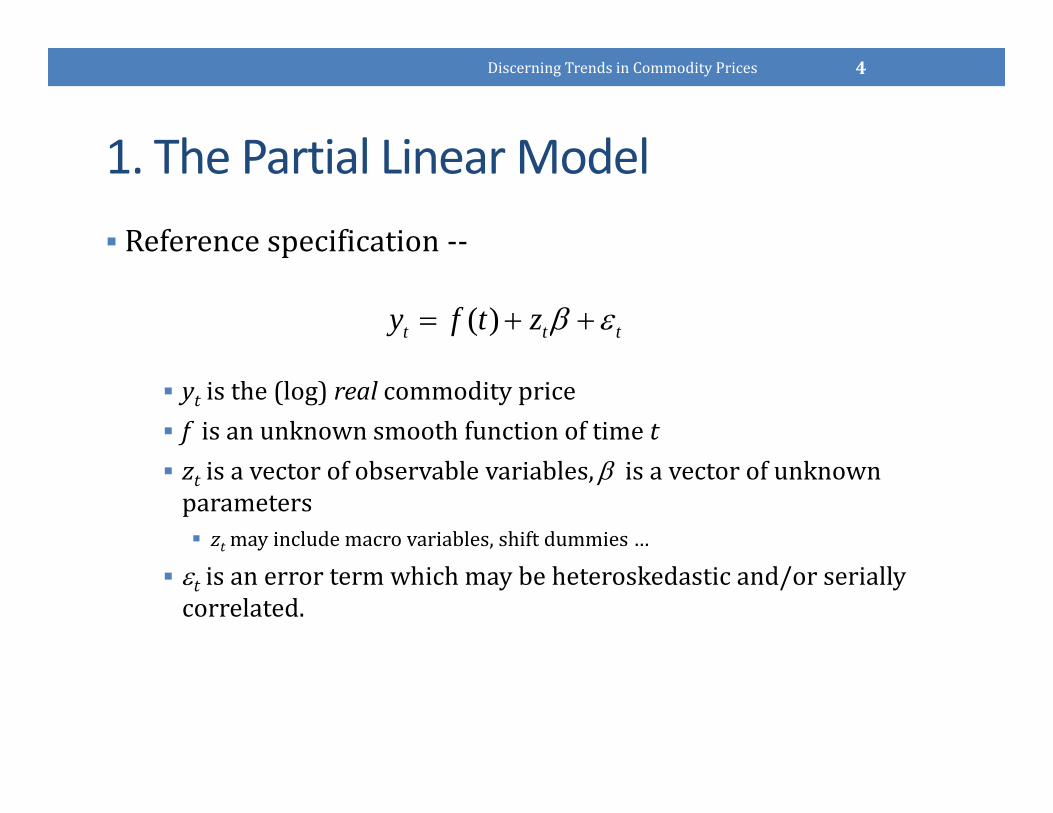
1. The Partial Linear Model Referencespecification‐‐
yt isthe(log)real commodityprice f isanunknownsmoothfunctionoftimet zt isavectorofobservablevariables, isavectorofunknownparameters ztmayincludemacrovariables,shiftdummies…
t isanerrortermwhichmaybeheteroskedasticand/orseriallycorrelated.
DiscerningTrendsinCommodityPrices 4
( )t t ty f t z

2. Cross‐Validation Considerapurenonparametrictrendmodel yt f(t) t.Nonparametricestimators‘smooth’thedata. Howdoesoneselectanappropriatedegreeofsmoothing?
Over‐smoothing Under‐smoothing
Minimizingthemeansquareerrorbychoosingthesmoothingparameterλwillnotwork– oneobtainsaperfectfit. Solution?Cross‐validation.
DiscerningTrendsinCommodityPrices 5
Year
log
pric
e
1900 1920 1940 1960 1980 2000
2.5
3.0
3.5
4.0
4.5
5.0
Oil
Yearlo
g pr
ice
1900 1920 1940 1960 1980 2000
2.5
3.0
3.5
4.0
4.5
5.0
Oil
21
1
ˆ ,T
tTt
y f t

2. Cross‐Validation in iid Setting Intheiid setting,cross‐validationpermitsoptimalselectionofthesmoothingparameterλ. Fixλ andforeacht,estimatef(t)whileomitting thet‐thobservation. Repeattheprocessoveragridofvaluesofλ. Selectthevalueofλthatminimizesmeansquarederror:
Essentially,determinationofthedegreeofsmoothingisbasedontheabilitytopredict‘outofsample’.
DiscerningTrendsinCommodityPrices 6
21
1
ˆmin .,t
T
tTt
fC y tV

2. Cross‐Validation in AR Setting Nearbyobservationsarenotstatisticallyindependent. Omittingindividual observationswillleadtoover‐fitting.
Solution?OmitobservationsinaneighborhoodN(t)ofeachpoint:
DiscerningTrendsinCommodityPrices 7
21
1mi ˆ ,n .N
T
tT tt
fCV ty
x
y
0.0 0.2 0.4 0.6 0.8 1.0
-0.1
0.0
0.1
0.2
0.3
True FunctionOver-fittingOptimal Smoothing

3. Shape Similarity
DiscerningTrendsinCommodityPrices 8
Year
log
pric
e
1900 1920 1940 1960 1980 2000
3.0
3.2
3.4
3.6
3.8
4.0
4.2
4.4
Coal
Year
log
pric
e
1900 1920 1940 1960 1980 2000
2.5
3.0
3.5
4.0
4.5
5.0
Oil

Model Features1. Ourparsimoniousspecificationbalancesflexibility
andprecision:i. Nonparametriccomponentallowsflexibleidentificationoftrend.ii. But,apurenonparametricmodelwherezvariablesarealsotreated
nonparametricallyissubjectto‘curseofdimensionality’.iii. Macroeconomiceffectsarearguablyamenabletoparametricmodeling,
e.g.,mightexpectunemploymenttohavemonotoneeffectoncopperprices.Shiftvariables,whichcapture‘regimechange’maybeincludedinthezvector.
2. Cross‐validationallowsdata‐drivendeterminationofsmoothnessparameter.
3. Toolsavailableforassessing/testingshapesimilarityoftrends.
DiscerningTrendsinCommodityPrices 9
( )t t ty f t z

Model Estimation ‐consistentestimatesofthecoefficientsonthez’s canbeobtainedbyregressingthe‘detrended’priceonthe‘detrended’parametricvariables
Sincetheresidualsarelikelyheteroskedasticandseriallycorrelated,wereportNewey‐Weststandarderrors,adaptedtothecurrentsetting.
Afterremovingtheestimatedparametriceffects,thetrendeffectcanbeestimatedbyperformingnonparametricregressiononthemodel
Asymptoticconfidencebandscanbeconstructedaroundtheestimateofnonparametricfunctiontogaugeprecisionofestimatedtrend.
DiscerningTrendsinCommodityPrices 10
[ | ] [ | ] .t t t t ty E y t z E z t
n
ˆ .t t ty z f t

Endogeneity Issues Inestimatingtheparametriceffects,wehaveastandardregressionmodeloftheform
where
However,inmodelingoilprices,ormoregenerallyhydrocarbonprices,certainmacroeconomicvariables(e.g.,unemployment)arelikelytobecorrelatedwiththeresidual.
Inthesecasesweapplyinstrumentalvariableestimationtothepartiallinearmodel.
DiscerningTrendsinCommodityPrices 11
* *t t ty z
* *[ | ] and [ | ]t t t t t ty y E y t z z E z t

Data Pricesof11commodities:3hydrocarbons(oil,naturalgas,coal)and8metals(copper,nickel,zinc,iron,tin,silver,lead,aluminium)fortheperiod1901to2014.
MainsourceisManthy (1978),fromwhichweobtainthecommoditypriceseriesandthewholesalepriceindexpriorto1973.
Additionalsourcesareusedtoupdatethedatato2014. Thepriceseriesforoil,naturalgasandcoalareaugmentedusingpricespublishedbytheUSEnergyInformationAdministration(EIA).
Formetalsprices,theUSGeologicalSurveyHistoricalStatisticsforMineralandMaterialCommoditiesintheUnitedStates isusedtocompletethetimeseriesto2012,andLMEpricesthroughto2014.
ThewholesalepriceindexisupdatedusingtheProducerPriceIndex(Commodities) aspublishedbytheU.S.BureauofLaborStatistics.
DiscerningTrendsinCommodityPrices 12

Data Macroeconomicvariablesareincludedtocontrolforshorttermbusinesscycledynamicsandlongertermeconomicgrowthtrends; growthrateoftheGrossDomesticProduct(GDP)of20OECDcountriesaswellas6developingcountries. Source:MaddisonProject'sStatisticsonWorldPopulationandGDP1‐2010,updatedto2014usingWorldBank'sWorldDevelopmentIndicatorsdatabase.
USunemploymentrateseriesconstructedfromLesbergott (‘57)fortheperiod1900‐42,andfromtheBureauofLaborStatisticsthroughto2014.
UKunemploymentrateseriesconstructedfromDenmanandMcDonald(‘96)fortheperiod1900‐70,andfromtheOfficeofNationalStatisticsthroughto2014.
Indicatorvariablesforeventsthatareexpectedtohaveinfluencedcommodityprices,e.g.,OPECactionsin1973,U.S.Federalminingandenvironmentallegislationinthelate1960s.
DiscerningTrendsinCommodityPrices 13

Hotelling and His Descendants
HotellingRuletellsusthattherealpriceofanexhaustibleresourceshouldbetrendingupwardinthelongrun.
However,suchpredictionsaretypicallyrejectedbydata,aspricesareoftenobservedtofall,atleastovercertainperiodsoftime.
Inattemptstorationalizethisphenomenon,variousauthorshaveproposedextensionsofthebasicframeworktoallowforU‐shapedtrends,oscillatorytrends,structuralbreaks….
DiscerningTrendsinCommodityPrices 14
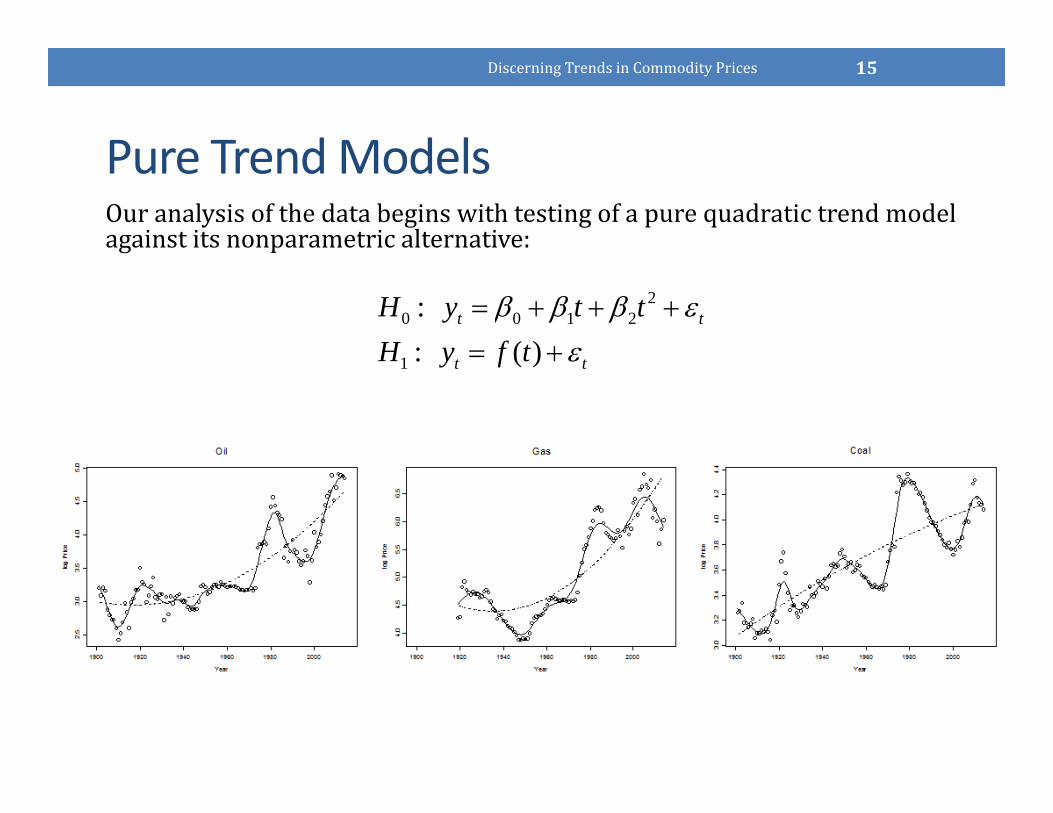
Pure Trend ModelsOuranalysisofthedatabeginswithtestingofapurequadratictrendmodelagainstitsnonparametricalternative:
V15.8 V10.6 V27.2
DiscerningTrendsinCommodityPrices 15
20 0 1 2
1
: : ( )
t t
t t
H y t tH y f t

DiscerningTrendsinCommodityPrices 16

Pure Trend Models Inmostcasesthequadratictrendmodelisrejectedinfavourofthenonparametricversion,theexceptionsbeingzinc,leadandaluminum.
Casualinspectionsuggestsdegreeofshapesimilarityamongvariousgroups:(i)hydrocarbons,(ii)copper‐nickel,(iii)iron‐tin.
Aluminumisonlycommoditythatdisplaysastrongseculardownwardtrend.
Weconsidermoreformallywhethercertaincommoditiesbearshapesimilarityintheirlongertermtrendsbycomparingindividualtrendsagainstapooledestimate,togetherwithits95%uniformconfidenceband.
DiscerningTrendsinCommodityPrices 17

Pure Trend Models ‐‐ Shape Similarity
Boththeoilandgastrendestimatesliewithinthepooleduniformbandformostofthedataperiod.
Beginningaround2009,theindividualpricetrendsdiverge‐‐ U.S.naturalgaspricesplummetfirst,asaresultofthefracking revolution,whileoilpricesremainhighuntillate2014,atwhichtimetheyalsoplunge.
DiscerningTrendsinCommodityPrices 18
YearPool
1920 1940 1960 1980 2000
-2-1
01
23
OilGasPooledUniform Conf Band
Oil and Gas -- Uniform Confidence Band

Pure Trend Models ‐‐ Shape Similarity
Bothoilandcoaltrendsfollowgenerallysimilarpaths,althoughtherearesomedifferencesintiming.
Formostofthe1901‐2014period,oilandcoaltrendsgenerallyliewithinthe95%uniformconfidenceboundsofthepooledtrendestimate.
DiscerningTrendsinCommodityPrices 19
YearPool
1900 1920 1940 1960 1980 2000
-2-1
01
23
OilcoalPooledUniform Conf Band
Oil and Coal -- Uniform Confidence Band

Pure Trend Models ‐‐ Shape Similarity
Metalspricesexhibitconsiderablevolatility,buttheestimatedtrendcurvesforcopperandnickel,andironandtin,showadegreeofsimilarity.
Inbothcases,theuniformboundsofthepooledestimatecapturetheindividualtrendpathsforeachofthemetalspairs.
DiscerningTrendsinCommodityPrices 20

Inclusion of Macro Variables
Wenowincorporateparametriceffectsintoourmodels,andestimatethepartiallinearmodeloftheform:
Smoothnessparametersaredeterminedthroughcross‐validation.
DiscerningTrendsinCommodityPrices 21
( )t t ty f t z
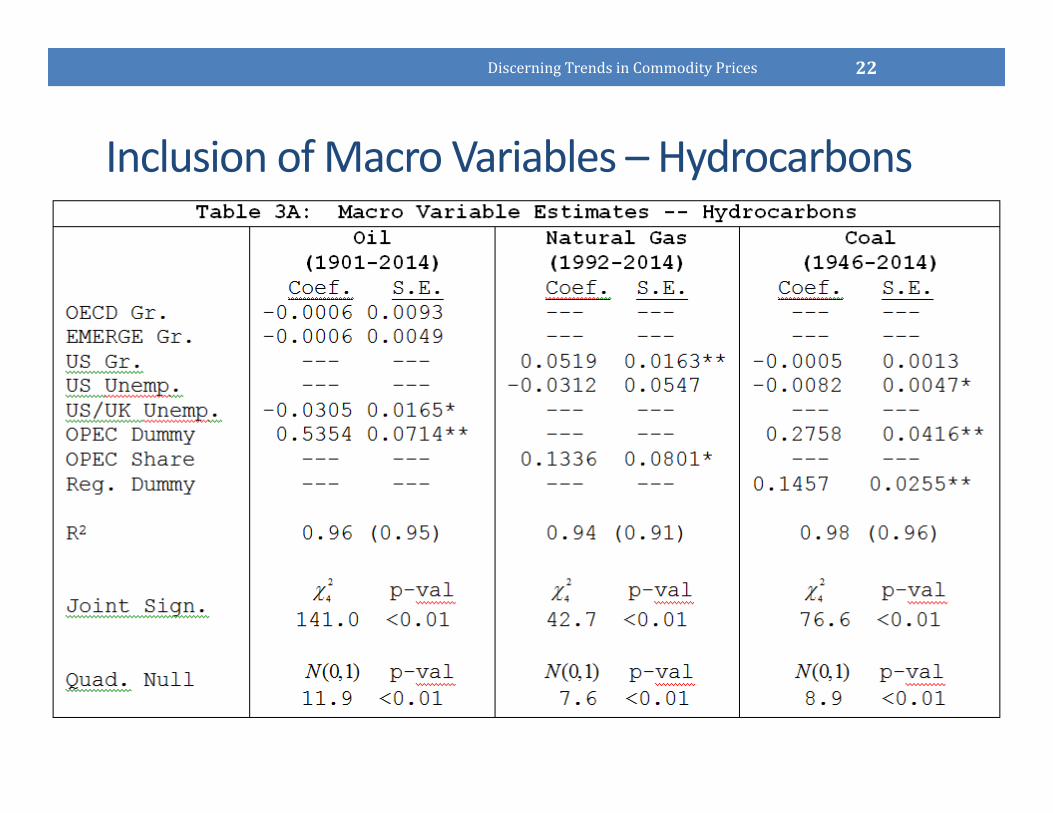
Inclusion of Macro Variables – Hydrocarbons
DiscerningTrendsinCommodityPrices 22

Inclusion of Macro Variables – Hydrocarbons
Theseexhibitstrongjointsignificanceinthemodelsforallthreefuels.
Theirinclusionwouldappeartohaveamodestimpactontotalexplanatorypower.Thereasonisthatinthepurenonparametricmodel,thetrendvariableispickingupmacroeffects.Inthepartiallinearmodel,theroleoftrenddeclinessignificantly.
Foroilprices, NeitherOECDnoremergingeconomiesgrowthrateshaveasignificantimpact. TheaverageUS/UKunemploymentrateismarginallysignificant. ThechangeinstrategicbehaviourbyOPECbeginninginlate1973isestimatedtoincreaseoilprices,onaverage,inexcessof50%.
DiscerningTrendsinCommodityPrices 23

Inclusion of Macro Variables – Hydrocarbons Fornaturalgasprices, Asthesemarketsareprimarilycontinental.WeuseU.S.pricesandthereforeU.S.growthandunemploymentrates.
Wefocusonpost1992data,asthismarketwentthroughaperiodofpriceconstraintsforinter‐statetradeuntiltheearly1990’s.(Estimatesfor1919‐2014areavailable.)
U.S.growthisastronglysignificantdriverofcontinentalnaturalgasprices,whileU.S.unemploymentisnot.
NotethatanOPECdummywouldnotbeidentified,sointhiscaseweincludetheOPECmarketshare‐‐ whichissignificantatthe10%level.
Forcoalprices, WeuseU.S.growthandunemploymentrates. Wefocusonthepost‐warperiod,1946‐2014. U.S.economicgrowthisnotasignificantfactorinexplainingthepriceseries,butunemploymentismarginallysignificantwithanegativeimpactonprices.
TheOPECeffectislargeandstronglysignificant,increasingcoalpricesinexcessof25%onaveragerelativetotrend.
The“RegulatoryDummy”‐‐ whichcapturestheimpactsofcoalminesafetylegislationpassedin1969,andtheamendmentstotheCleanAirActin1970‐‐isstronglystatisticallysignificant,increasingcoalpricesbyanestimated15%.
DiscerningTrendsinCommodityPrices 24

Inclusion of Macro Variables –Metals
DiscerningTrendsinCommodityPrices 25

Inclusion of Macro Variables –Metals Thereissubstantialvariationinthedata‐drivensmoothingparameter,leadingtoconsiderablevariationinthegoodness‐of‐fitacrossmodels.
Theparametricvariables– OECDandemergingeconomygrowthrates,andtheUS/UKunemploymentrate– arejointlysignificantin5outof8metals.
OECDgrowthratesaresignificantinthecopperandleadequations,whilegrowthinemergingeconomiesisstatisticallyinsignificantinallmodels.
Theunemploymentrateissignificantinexplainingcopper,iron,lead,tin,silverandzincprices.
DiscerningTrendsinCommodityPrices 26

Goodness of FitPureTrendModel PartialLinearModel
Total
Oil 1901‐2014 0.950 0.960 0.774 0.488
NaturalGas 1992‐2014 0.910 0.940 0.753 0.112
Coal 1946‐2014 0.960 0.980 0.497 0.640
Copper 1901‐2014 0.770 0.810 0.640 0.357
Nickel 1901‐2014 0.830 0.830 0.824 0.012
Zinc 1901‐2014 0.230 0.260 0.177 0.252
Iron 1901‐2014 0.920 0.930 0.867 0.403
Tin 1901‐2014 0.800 0.830 0.748 0.066
Silver 1901‐2014 0.900 0.910 0.870 0.029
Lead 1901‐2014 0.420 0.490 0.356 0.079
Aluminium 1901‐2014 0.930 0.930 0.922 0.006
DiscerningTrendsinCommodityPrices 27

Relationship to the Literatures
Deterministictrendmodels
Super‐cycles,spectralanalysis
Stochastictrendmodels
DiscerningTrendsinCommodityPrices 28

Concluding Comments Trendsarefunctionsofunknownshape– hencenonparametrictechniquesareuseful.
Estimationoftrendfunctioncanbeguidedbytheabilityoftheestimatortopredictoutofsample(cross‐validation).
Commoditytrendsmaydisplayshapesimilarity,atleastovercertainperiodsoftime.Thiscanimproveprecisionofestimationandanticipationofcertainscenarios.
DiscerningTrendsinCommodityPrices 29

Hydrocarbon Shape Similarity• Considerthehydrocarbontriad.From1946to2008thecorrelationsofthe(log)priceofoilwithgasandcoalare97%and98%respectively.
• Thengasandcoalpricesturndown.
• Perhapstherecentdropinoilpricesisnotentirelysurprising.
DiscerningTrendsinCommodityPrices 30
Year
YCoa
l
1960 1980 2000
3.6
3.8
4.0
4.2
4.4
Coal
Year
YG
as
1960 1980 2000
4.0
4.5
5.0
5.5
6.0
6.5
Gas
Year
YO
il
1960 1980 2000
3.0
3.5
4.0
4.5
Oil