Embed Size (px)
Citation preview
Disaster Recovery Report 2018
© 2018 CloudEndure 2
Table of Contents
Table of Contents .................................................................................................................................................................................................................. 2
Executive Summary ................................................................................................................................................................................................................ 3
Production Machines in the Organization ................................................................................................................................................................................... 4
Production Machines Using Disaster Recovery............................................................................................................................................................................. 5
Workloads Primarily Covered by Disaster Recovery ..................................................................................................................................................................... 6
Current Approaches to Disaster Recovery .................................................................................................................................................................................. 7
Disaster Recovery Technology ................................................................................................................................................................................................. 8
Disaster Recovery Site Infrastructure ........................................................................................................................................................................................ 9
Service Availability Goals ...................................................................................................................................................................................................... 10
Meeting Service Availability Goals .......................................................................................................................................................................................... 11
Last Downtime Event ........................................................................................................................................................................................................... 12
Recovery Point Objective...................................................................................................................................................................................................... 13
Recovery Time Objective ...................................................................................................................................................................................................... 14
Meeting RPO and RTO Goals .................................................................................................................................................................................................. 15
How Often Do You Conduct Disaster Recovery Drills? ................................................................................................................................................................. 16
Top Risks to Service Availability ............................................................................................................................................................................................. 17
Who Is Responsible for Disaster Recovery? ............................................................................................................................................................................... 18
Hours Invested in Disaster Recovery per Week ......................................................................................................................................................................... 19
Estimated Annual Cost of Backup/DR ...................................................................................................................................................................................... 20
Estimated Cost per Day of Downtime ...................................................................................................................................................................................... 21
Current Satisfaction With Disaster Recovery Solutions ............................................................................................................................................................... 22
Respondent Demographics: Annual Company Revenue ............................................................................................................................................................... 23
Respondent Demographics .................................................................................................................................................................................................... 24
Table of Figures .................................................................................................................................................................................................................. 25
About CloudEndure .............................................................................................................................................................................................................. 26
© 2018 CloudEndure 3
Executive Summary
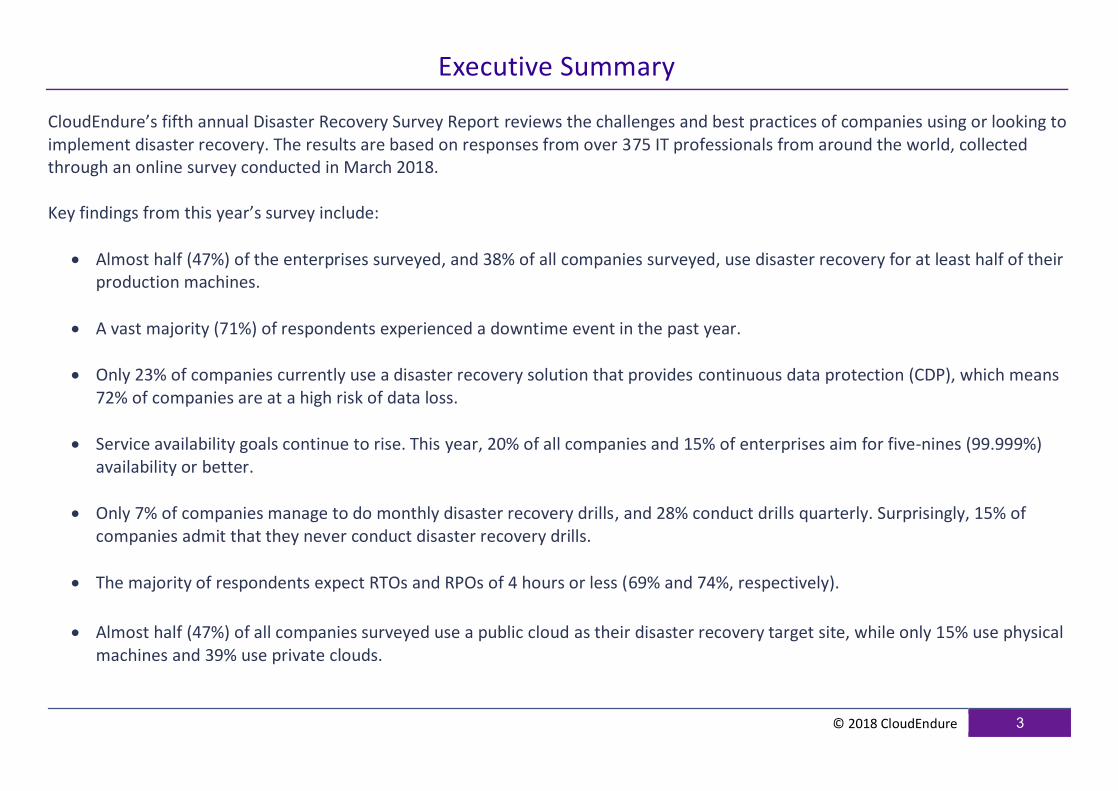
CloudEndure’s fifth annual Disaster Recovery Survey Report reviews the challenges and best practices of companies using or looking to implement disaster recovery. The results are based on responses from over 375 IT professionals from around the world, collected through an online survey conducted in March 2018. Key findings from this year’s survey include:
• Almost half (47%) of the enterprises surveyed, and 38% of all companies surveyed, use disaster recovery for at least half of their production machines.
• A vast majority (71%) of respondents experienced a downtime event in the past year.
• Only 23% of companies currently use a disaster recovery solution that provides continuous data protection (CDP), which means 72% of companies are at a high risk of data loss.
• Service availability goals continue to rise. This year, 20% of all companies and 15% of enterprises aim for five-nines (99.999%) availability or better.
• Only 7% of companies manage to do monthly disaster recovery drills, and 28% conduct drills quarterly. Surprisingly, 15% of companies admit that they never conduct disaster recovery drills.
• The majority of respondents expect RTOs and RPOs of 4 hours or less (69% and 74%, respectively).
• Almost half (47%) of all companies surveyed use a public cloud as their disaster recovery target site, while only 15% use physical machines and 39% use private clouds.
© 2018 CloudEndure 4
Production Machines in the Organization
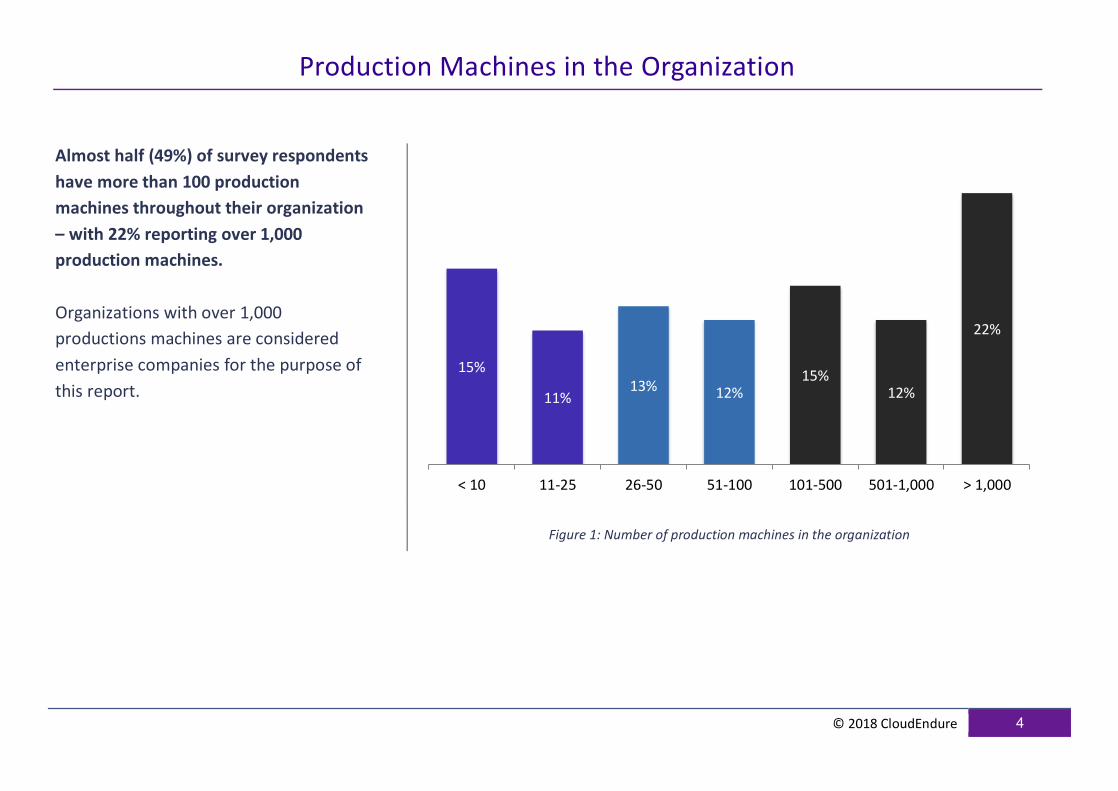
Almost half (49%) of survey respondents
have more than 100 production
machines throughout their organization
– with 22% reporting over 1,000
production machines.
Organizations with over 1,000
productions machines are considered
enterprise companies for the purpose of
this report.
Figure 1: Number of production machines in the organization
15%
11%13% 12%
15%12%
22%
< 10 11-25 26-50 51-100 101-500 501-1,000 > 1,000
© 2018 CloudEndure 5
Production Machines Using Disaster Recovery
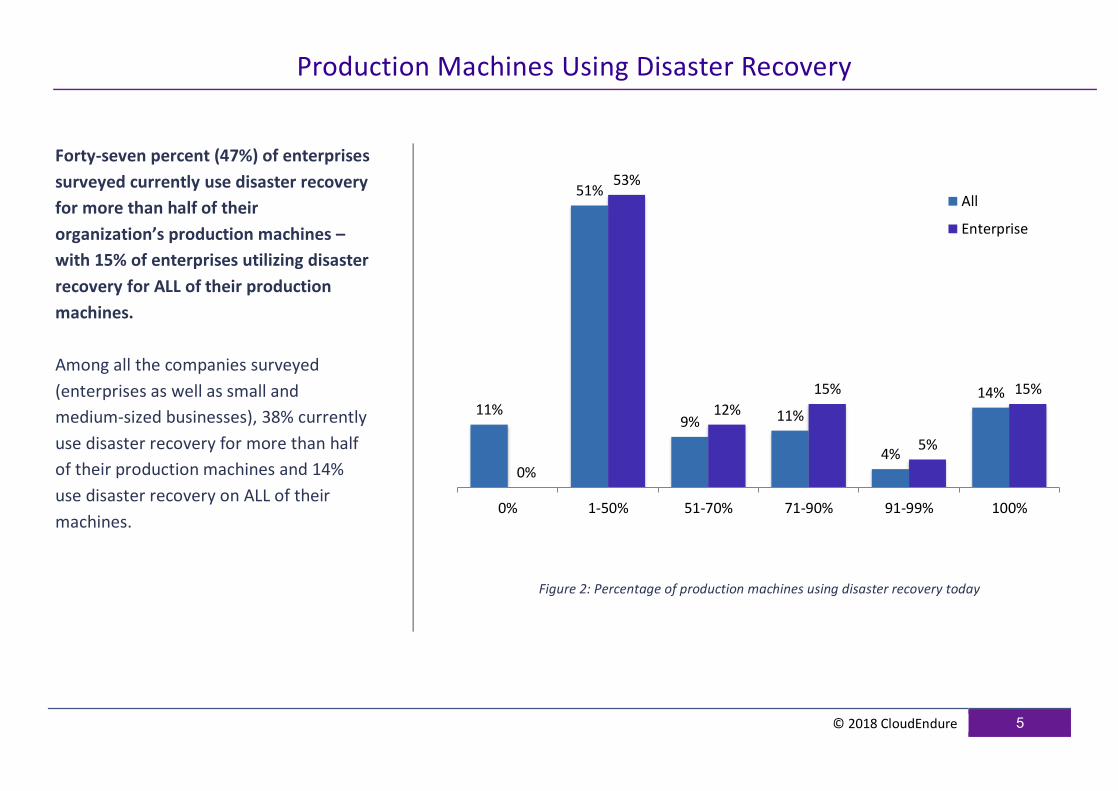
Forty-seven percent (47%) of enterprises
surveyed currently use disaster recovery
for more than half of their
organization’s production machines –
with 15% of enterprises utilizing disaster
recovery for ALL of their production
machines.
Among all the companies surveyed
(enterprises as well as small and
medium-sized businesses), 38% currently
use disaster recovery for more than half
of their production machines and 14%
use disaster recovery on ALL of their
machines.
Figure 2: Percentage of production machines using disaster recovery today
11%
51%
9% 11%
4%
14%
0%
53%
12%
15%
5%
15%
0% 1-50% 51-70% 71-90% 91-99% 100%
All
Enterprise

© 2018 CloudEndure 6
Workloads Primarily Covered by Disaster Recovery
Survey respondents reported a wide range
of primary workloads covered by disaster
recovery, but databases (20%) were the
most common.
The top four workloads – databases, file servers, web apps, and custom business applications – comprise half (49%) of the production servers covered by disaster recovery.
Figure 3: Workloads primarily covered by disaster recovery
20%
11%
9%
9%
8%
8%
7%
7%
7%
6%
5%
3%
0% 5% 10% 15% 20% 25%
Database
File Server
Web Apps
Custom Business Application
Directory Services
Email Collaboration
CRM
Website
Application Test/Dev
ERP
Business Analytics
eCommerce and Online Tools
© 2018 CloudEndure 7
Current Approaches to Disaster Recovery
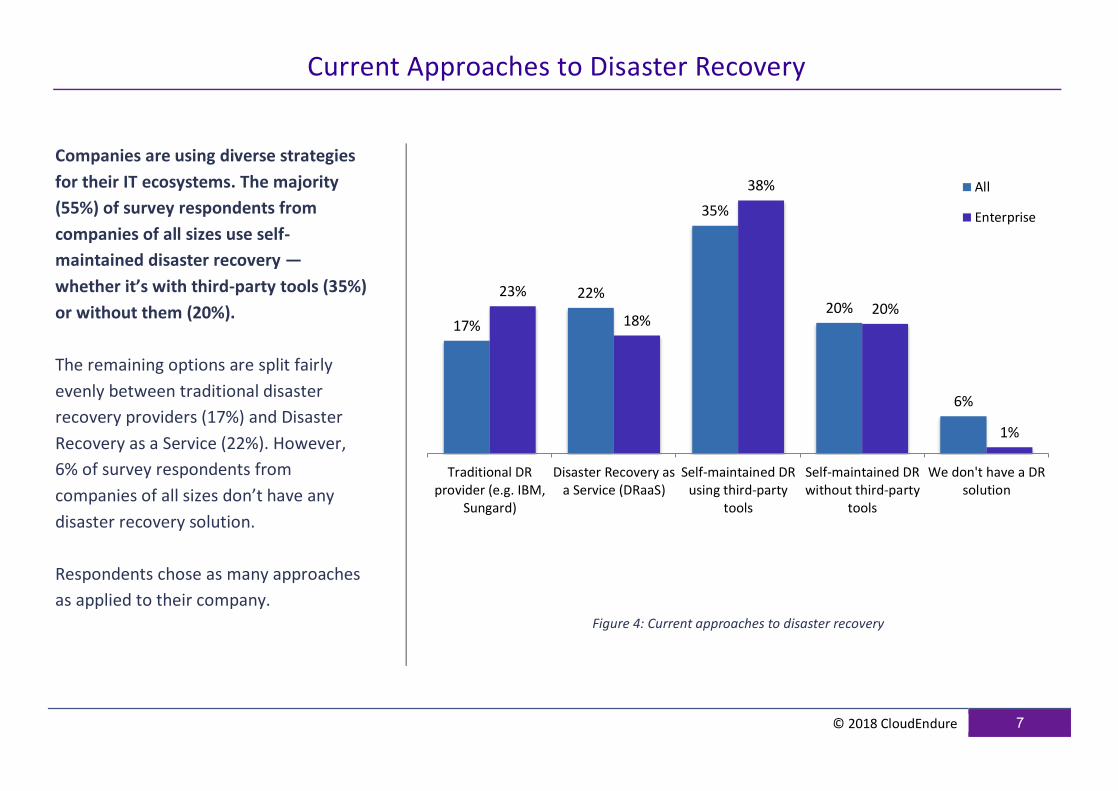
Companies are using diverse strategies
for their IT ecosystems. The majority
(55%) of survey respondents from
companies of all sizes use self-
maintained disaster recovery —
whether it’s with third-party tools (35%)
or without them (20%).
The remaining options are split fairly
evenly between traditional disaster
recovery providers (17%) and Disaster
Recovery as a Service (22%). However,
6% of survey respondents from
companies of all sizes don’t have any
disaster recovery solution.
Respondents chose as many approaches
as applied to their company.
Figure 4: Current approaches to disaster recovery
17%
22%
35%
20%
6%
23%
18%
38%
20%
1%
Traditional DRprovider (e.g. IBM,
Sungard)
Disaster Recovery asa Service (DRaaS)
Self-maintained DRusing third-party
tools
Self-maintained DRwithout third-party
tools
We don't have a DRsolution
All
Enterprise
© 2018 CloudEndure 8
Disaster Recovery Technology
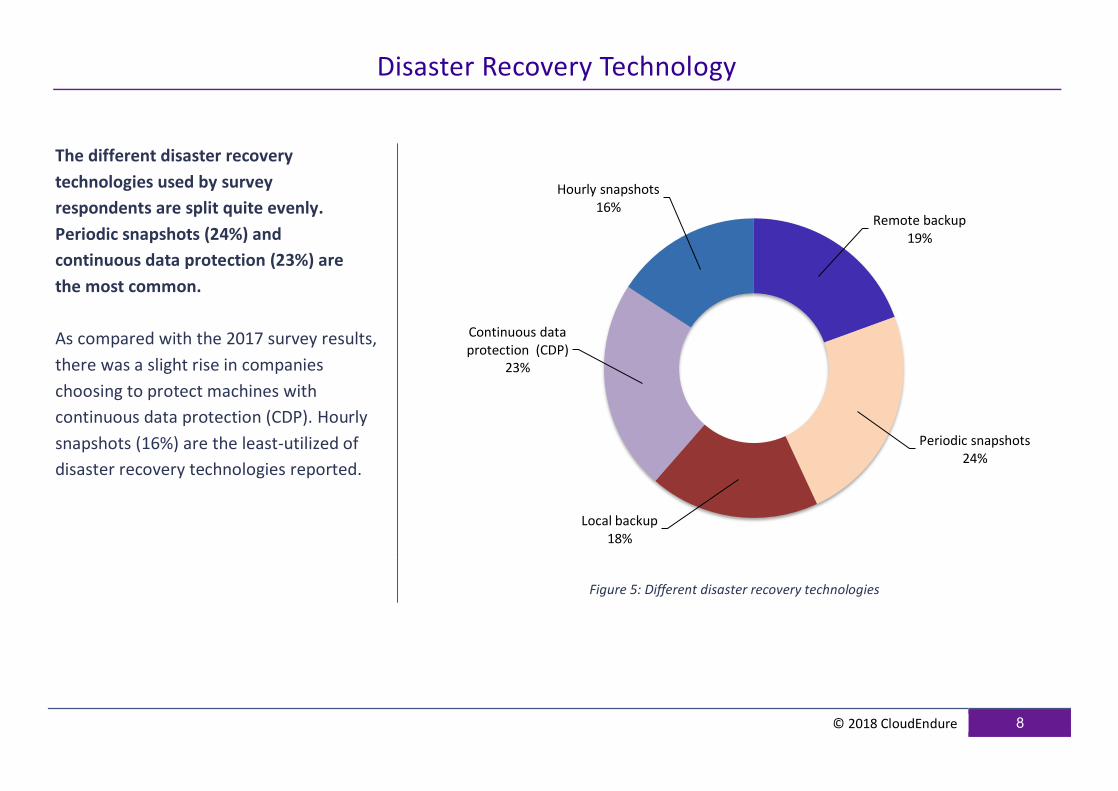
The different disaster recovery
technologies used by survey
respondents are split quite evenly.
Periodic snapshots (24%) and
continuous data protection (23%) are
the most common.
As compared with the 2017 survey results,
there was a slight rise in companies
choosing to protect machines with
continuous data protection (CDP). Hourly
snapshots (16%) are the least-utilized of
disaster recovery technologies reported.
Figure 5: Different disaster recovery technologies
Remote backup19%
Periodic snapshots24%
Local backup18%
Continuous data protection (CDP)
23%
Hourly snapshots16%

© 2018 CloudEndure 9
Disaster Recovery Site Infrastructure
The public cloud continues to be the
most popular disaster recovery site,
with 47% of companies using it. This is
followed closely by private cloud
infrastructures (39%).
Only 14% of companies use physical
machines for disaster recovery, which is a
lower percentage than reported in the
previous survey (17% physical machines
were reported in 2017).
Figure 6: Disaster recovery site infrastructures
23%
17%
14%
13%
11%
8%
8%
3%
2%
1%
Amazon Web Services
VMware vSphere
Physical Machines
VMware vCenter
Microsoft Azure
Google Cloud Platform
Microsoft Hyper-V
IBM Softlayer
VMware vCloud Air
HP Helion
Public Cloud47%Private
Cloud39%
Physical14%
© 2018 CloudEndure 10
Service Availability Goals
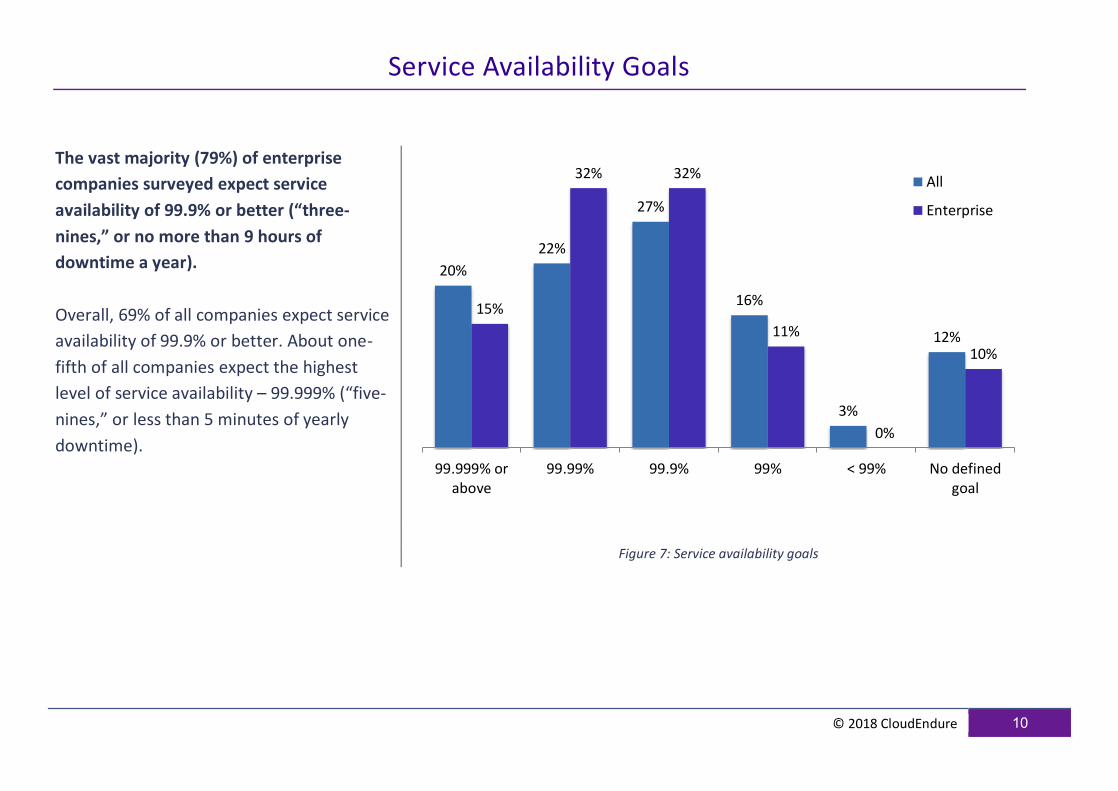
The vast majority (79%) of enterprise
companies surveyed expect service
availability of 99.9% or better (“three-
nines,” or no more than 9 hours of
downtime a year).
Overall, 69% of all companies expect service
availability of 99.9% or better. About one-
fifth of all companies expect the highest
level of service availability – 99.999% (“five-
nines,” or less than 5 minutes of yearly
downtime).
Figure 7: Service availability goals
20%
22%
27%
16%
3%
12%
15%
32% 32%
11%
0%
10%
99.999% orabove
99.99% 99.9% 99% < 99% No definedgoal
All
Enterprise
© 2018 CloudEndure 11
Meeting Service Availability Goals
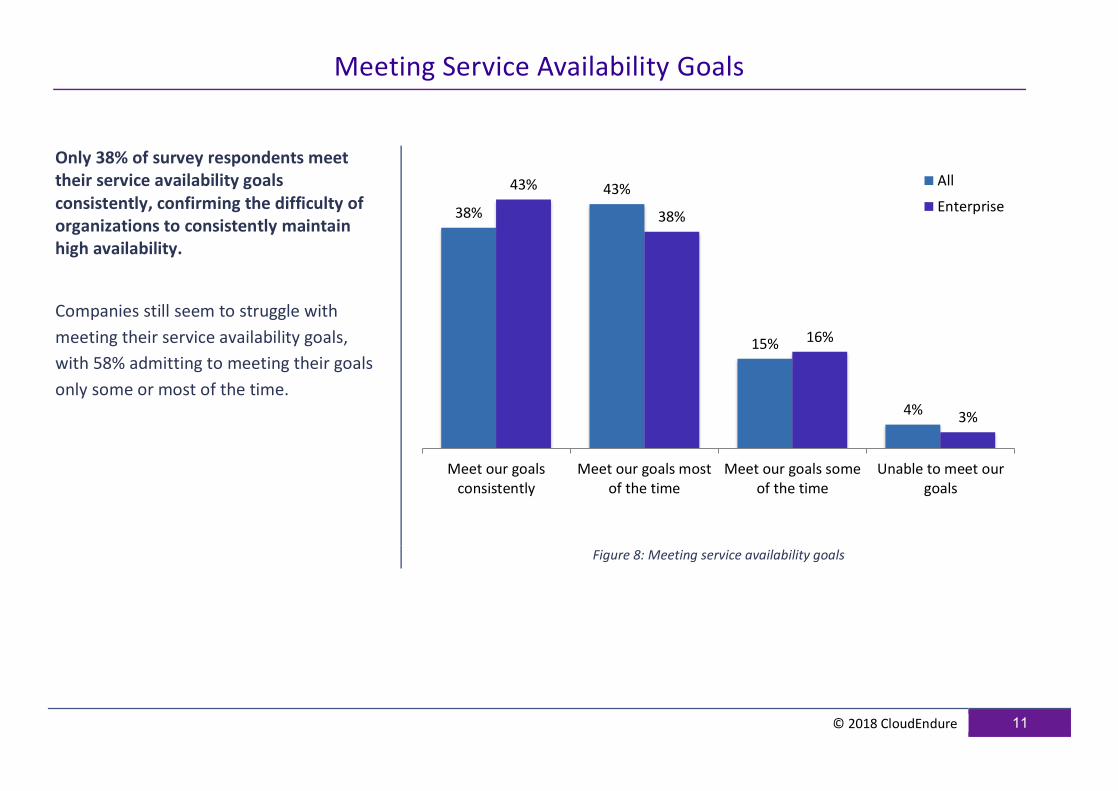
Only 38% of survey respondents meet their service availability goals consistently, confirming the difficulty of organizations to consistently maintain high availability.
Companies still seem to struggle with
meeting their service availability goals,
with 58% admitting to meeting their goals
only some or most of the time.
Figure 8: Meeting service availability goals
38%
43%
15%
4%
43%
38%
16%
3%
Meet our goalsconsistently
Meet our goals mostof the time
Meet our goals someof the time
Unable to meet ourgoals
All
Enterprise
© 2018 CloudEndure 12
Last Downtime Event
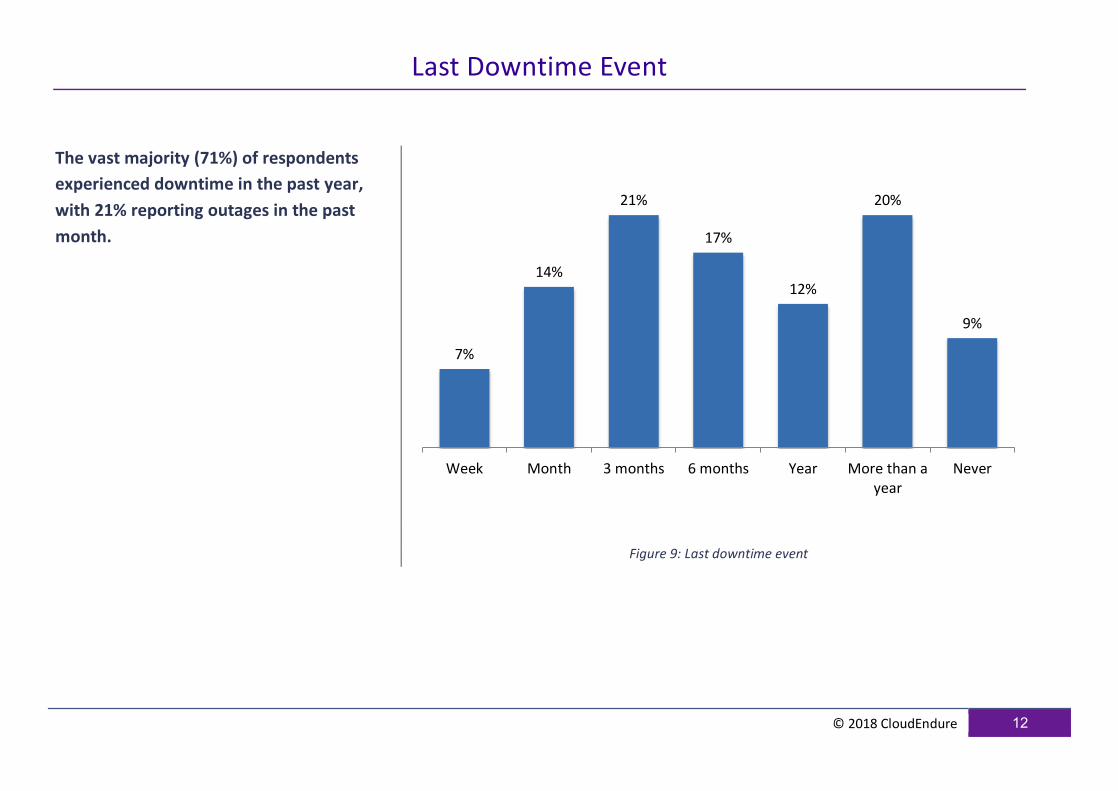
The vast majority (71%) of respondents
experienced downtime in the past year,
with 21% reporting outages in the past
month.
Figure 9: Last downtime event
7%
14%
21%
17%
12%
20%
9%
Week Month 3 months 6 months Year More than ayear
Never
© 2018 CloudEndure 13
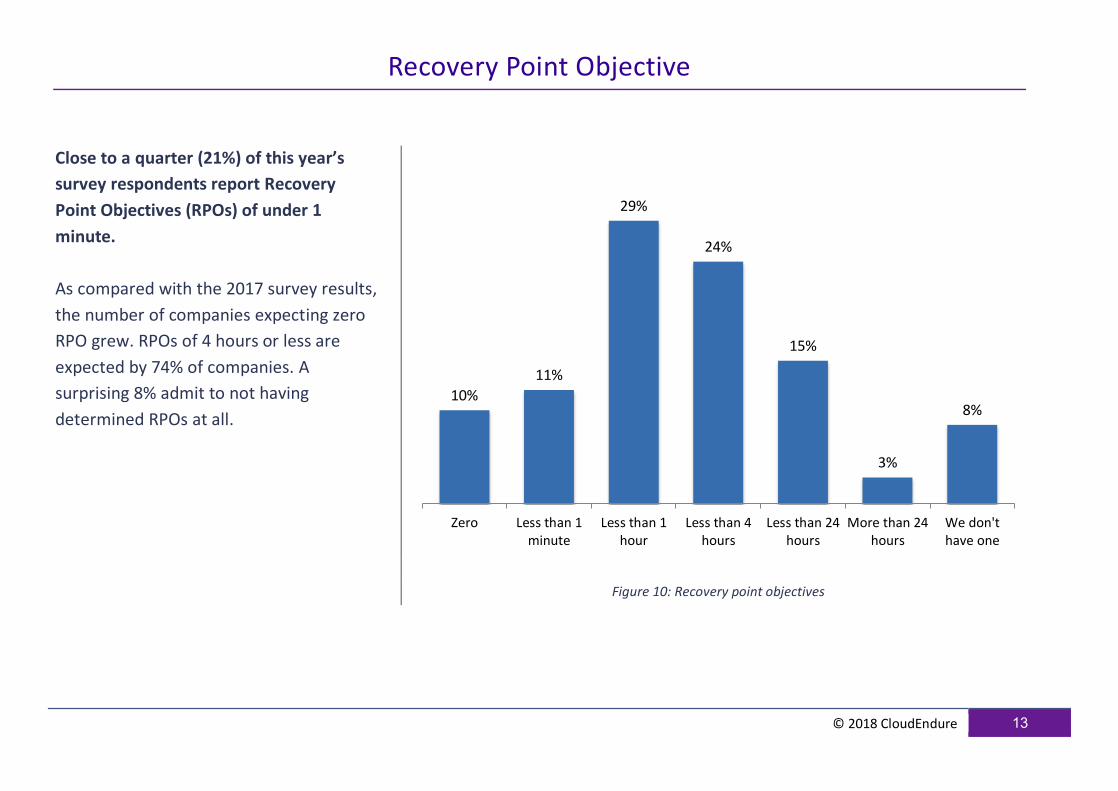
Recovery Point Objective
Close to a quarter (21%) of this year’s
survey respondents report Recovery
Point Objectives (RPOs) of under 1
minute.
As compared with the 2017 survey results,
the number of companies expecting zero
RPO grew. RPOs of 4 hours or less are
expected by 74% of companies. A
surprising 8% admit to not having
determined RPOs at all.
Figure 10: Recovery point objectives
10%
11%
29%
24%
15%
3%
8%
Zero Less than 1minute
Less than 1hour
Less than 4hours
Less than 24hours
More than 24hours
We don'thave one
© 2018 CloudEndure 14
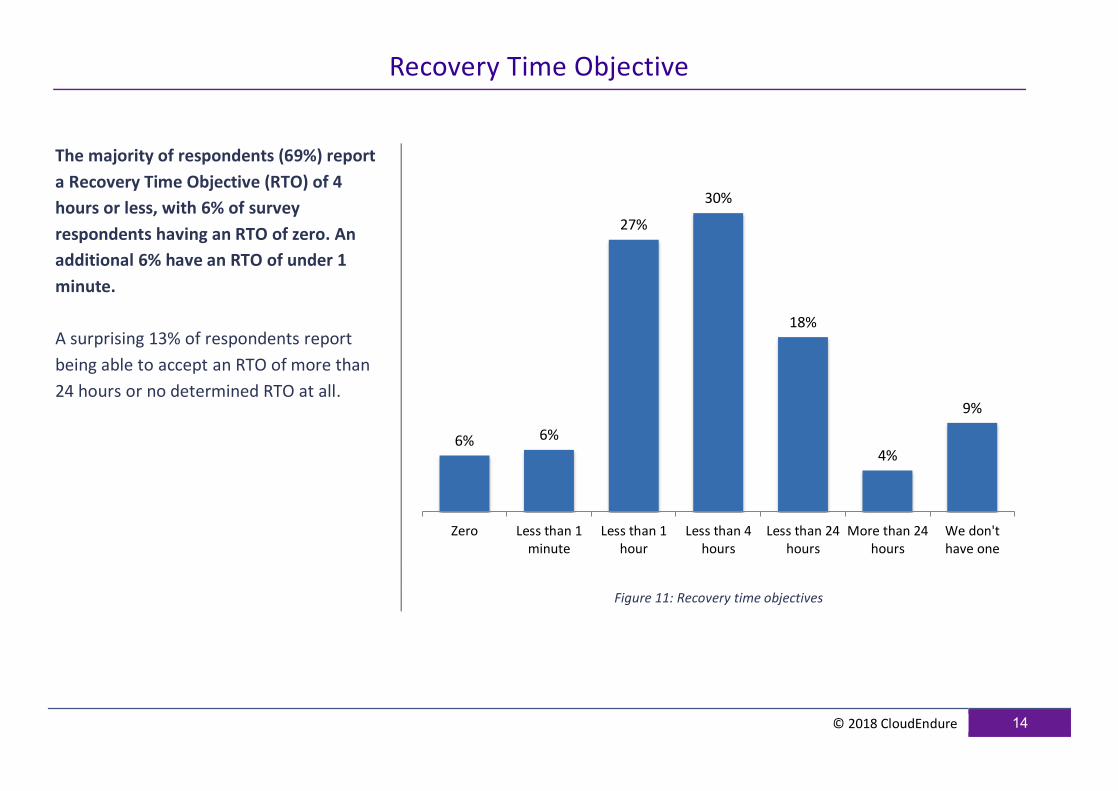
Recovery Time Objective
The majority of respondents (69%) report
a Recovery Time Objective (RTO) of 4
hours or less, with 6% of survey
respondents having an RTO of zero. An
additional 6% have an RTO of under 1
minute.
A surprising 13% of respondents report
being able to accept an RTO of more than
24 hours or no determined RTO at all.
Figure 11: Recovery time objectives
6% 6%
27%
30%
18%
4%
9%
Zero Less than 1minute
Less than 1hour
Less than 4hours
Less than 24hours
More than 24hours
We don'thave one
© 2018 CloudEndure 15
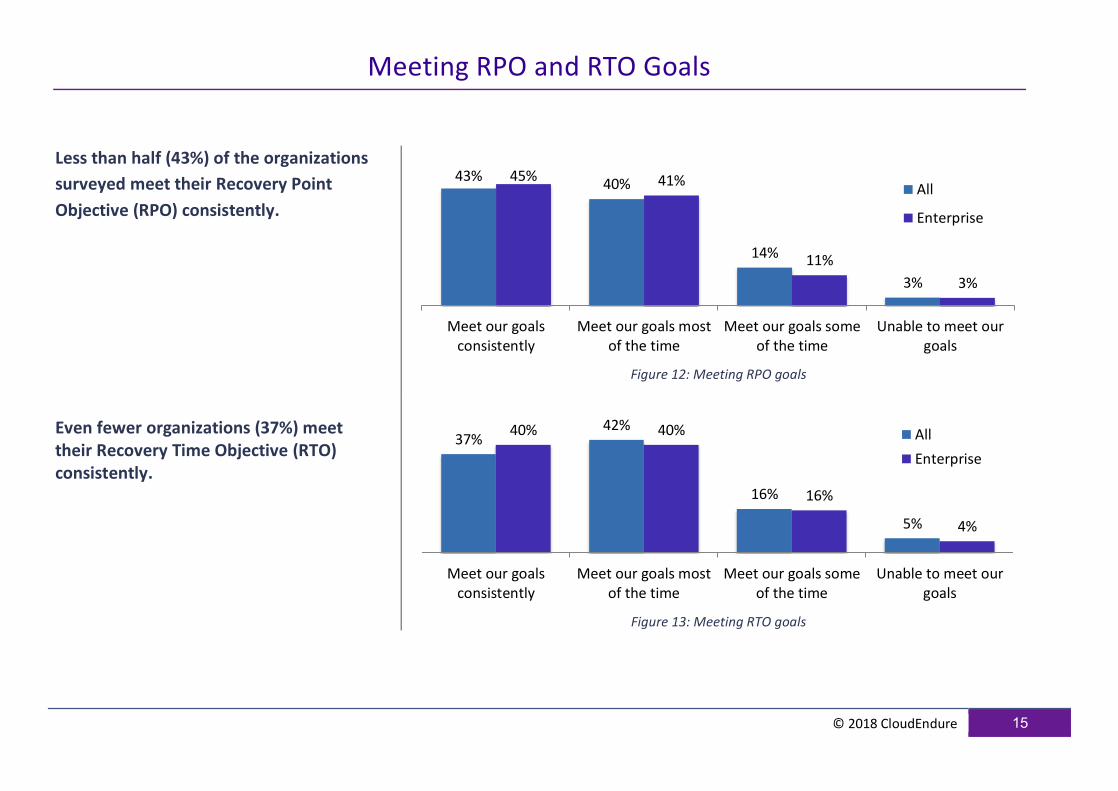
Meeting RPO and RTO Goals
Less than half (43%) of the organizations
surveyed meet their Recovery Point
Objective (RPO) consistently.
Figure 12: Meeting RPO goals
Even fewer organizations (37%) meet their Recovery Time Objective (RTO) consistently.
Figure 13: Meeting RTO goals
43%40%
14%
3%
45% 41%
11%
3%
Meet our goalsconsistently
Meet our goals mostof the time
Meet our goals someof the time
Unable to meet ourgoals
All
Enterprise
37%42%
16%
5%
40% 40%
16%
4%
Meet our goalsconsistently
Meet our goals mostof the time
Meet our goals someof the time
Unable to meet ourgoals
All
Enterprise
© 2018 CloudEndure 16
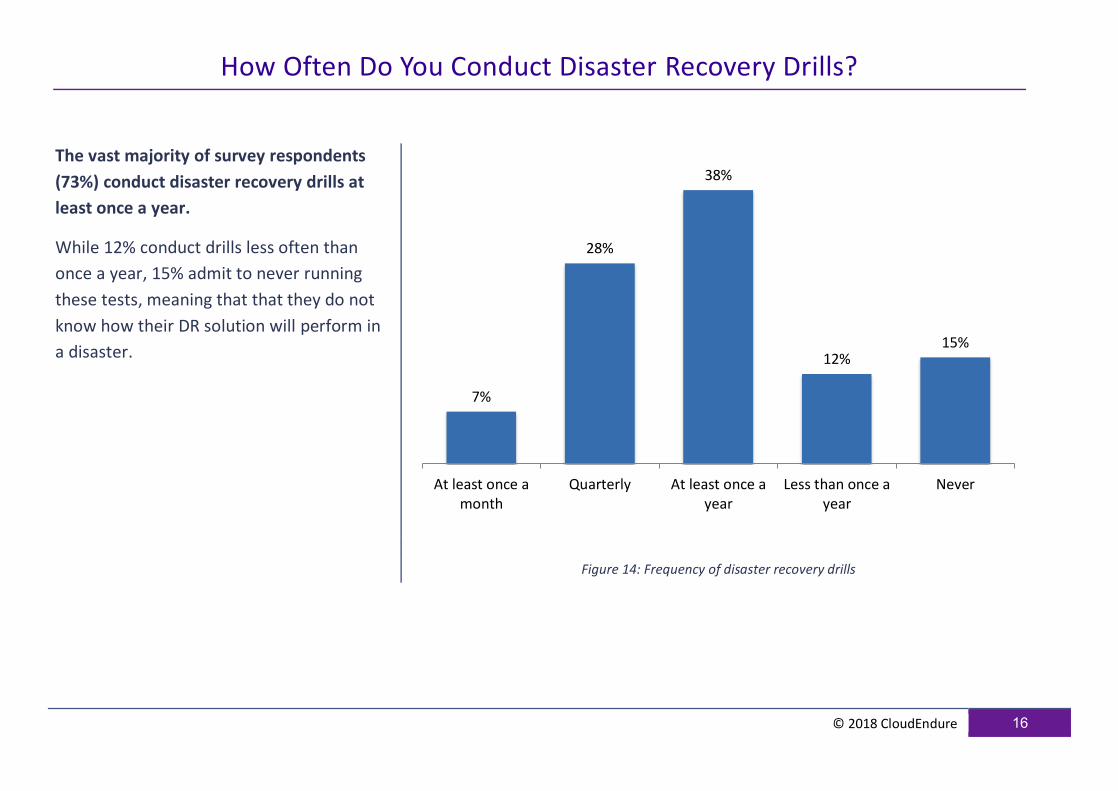
How Often Do You Conduct Disaster Recovery Drills?
The vast majority of survey respondents
(73%) conduct disaster recovery drills at
least once a year.
While 12% conduct drills less often than
once a year, 15% admit to never running
these tests, meaning that that they do not
know how their DR solution will perform in
a disaster.
Figure 14: Frequency of disaster recovery drills
7%
28%
38%
12%15%
At least once amonth
Quarterly At least once ayear
Less than once ayear
Never
© 2018 CloudEndure 17
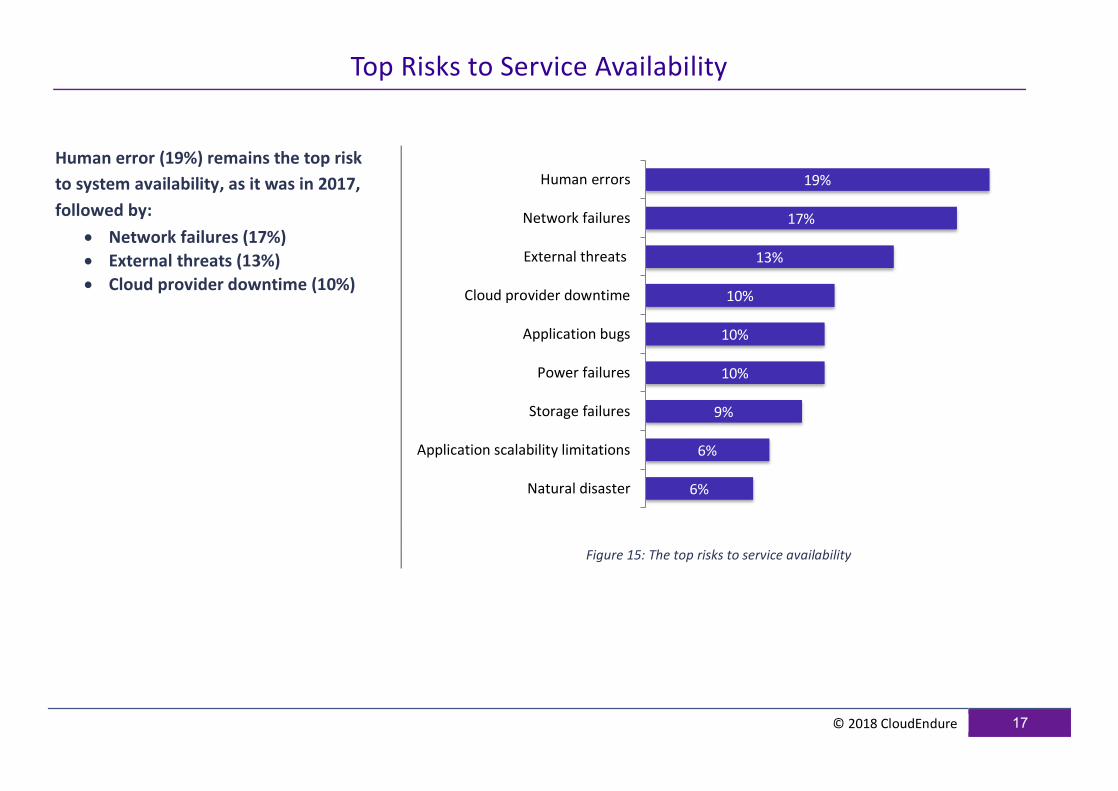
Top Risks to Service Availability
Human error (19%) remains the top risk
to system availability, as it was in 2017,
followed by:
• Network failures (17%)
• External threats (13%)
• Cloud provider downtime (10%)
Figure 15: The top risks to service availability
19%
17%
13%
10%
10%
10%
9%
6%
6%
Human errors
Network failures
External threats
Cloud provider downtime
Application bugs
Power failures
Storage failures
Application scalability limitations
Natural disaster
© 2018 CloudEndure 18
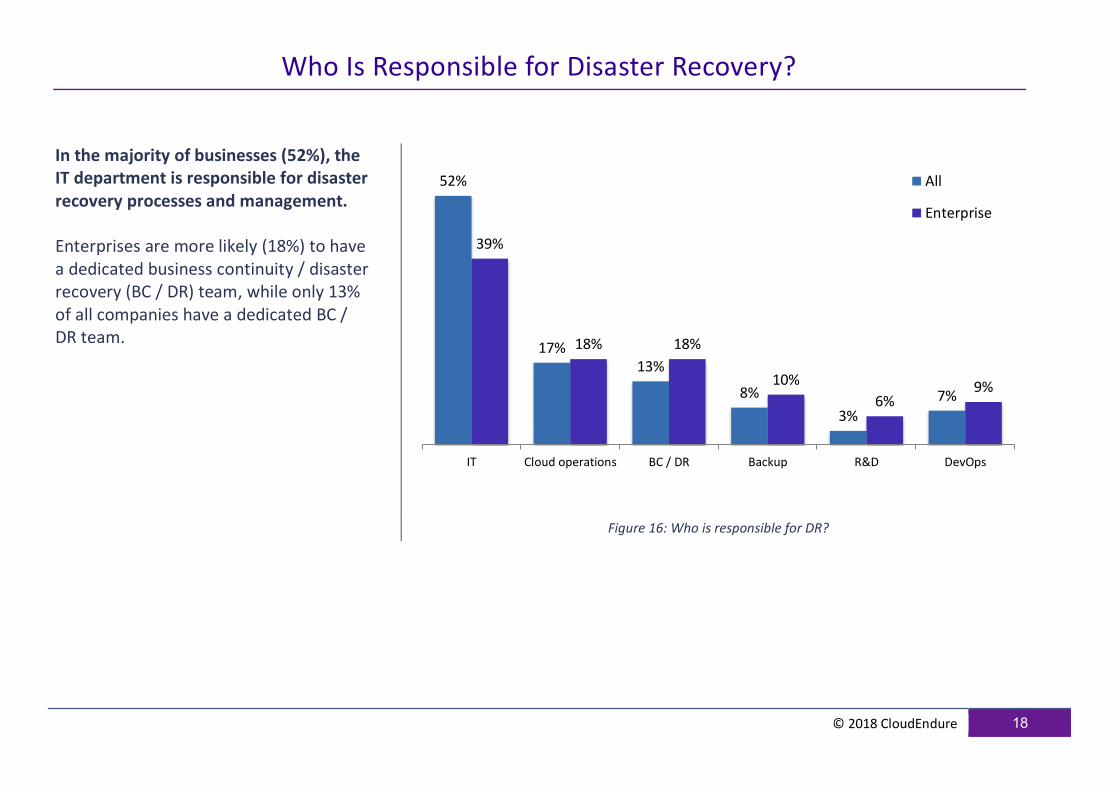
Who Is Responsible for Disaster Recovery?
In the majority of businesses (52%), the IT department is responsible for disaster recovery processes and management. Enterprises are more likely (18%) to have a dedicated business continuity / disaster recovery (BC / DR) team, while only 13% of all companies have a dedicated BC / DR team.
Figure 16: Who is responsible for DR?
52%
17%13%
8%
3%
7%
39%
18% 18%
10%
6%9%
IT Cloud operations BC / DR Backup R&D DevOps
All
Enterprise
© 2018 CloudEndure 19
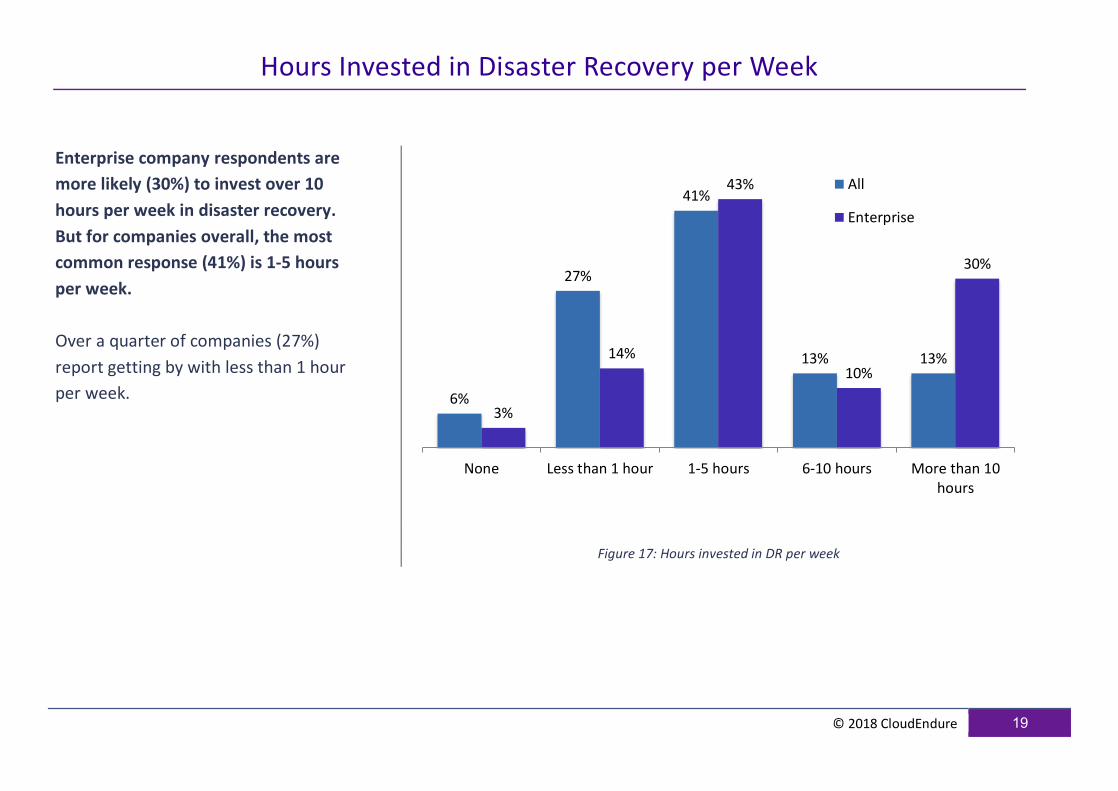
Hours Invested in Disaster Recovery per Week
Enterprise company respondents are
more likely (30%) to invest over 10
hours per week in disaster recovery.
But for companies overall, the most
common response (41%) is 1-5 hours
per week.
Over a quarter of companies (27%)
report getting by with less than 1 hour
per week.
Figure 17: Hours invested in DR per week
6%
27%
41%
13% 13%
3%
14%
43%
10%
30%
None Less than 1 hour 1-5 hours 6-10 hours More than 10hours
All
Enterprise
© 2018 CloudEndure 20
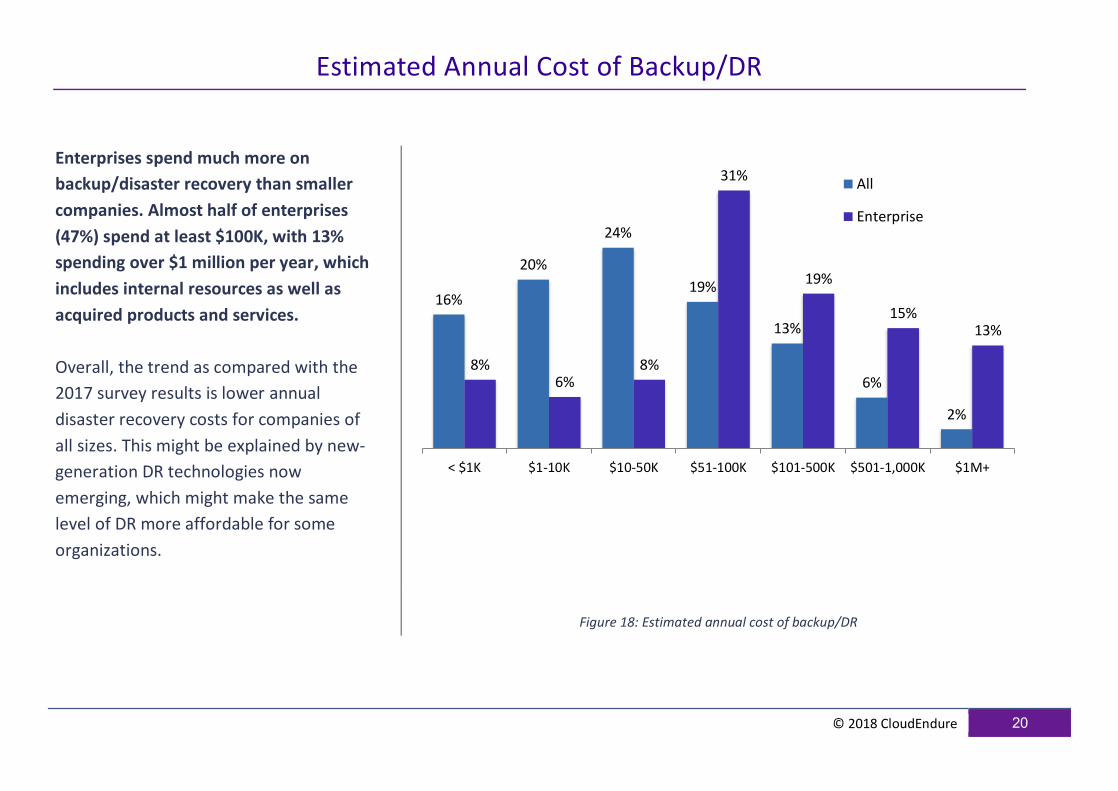
Estimated Annual Cost of Backup/DR
Enterprises spend much more on
backup/disaster recovery than smaller
companies. Almost half of enterprises
(47%) spend at least $100K, with 13%
spending over $1 million per year, which
includes internal resources as well as
acquired products and services.
Overall, the trend as compared with the
2017 survey results is lower annual
disaster recovery costs for companies of
all sizes. This might be explained by new-
generation DR technologies now
emerging, which might make the same
level of DR more affordable for some
organizations.
Figure 18: Estimated annual cost of backup/DR
16%
20%
24%
19%
13%
6%
2%
8%6%
8%
31%
19%
15%13%
< $1K $1-10K $10-50K $51-100K $101-500K $501-1,000K $1M+
All
Enterprise

© 2018 CloudEndure 21
Estimated Cost per Day of Downtime
About a quarter (26%) of enterprise
respondents estimate that a day of
downtime would cost them over $1
million. Among companies of all sizes,
31% estimate downtime costs to be
$100K or more per day.
Financial consequences of downtime
include costs associated with lost revenue
and productivity, damage to company
image, and customers moving to
competitors that are perceived as being
more stable.
Figure 19: Estimated cost per day of downtime
18%
14%
20%
17%16%
8%7%7%
10%
14%
17%
12%
14%
26%
< $1K $1-10K $10-50K $51-100K $101-500K $501-1,000K $1M+
All
Enterprise
© 2018 CloudEndure 22
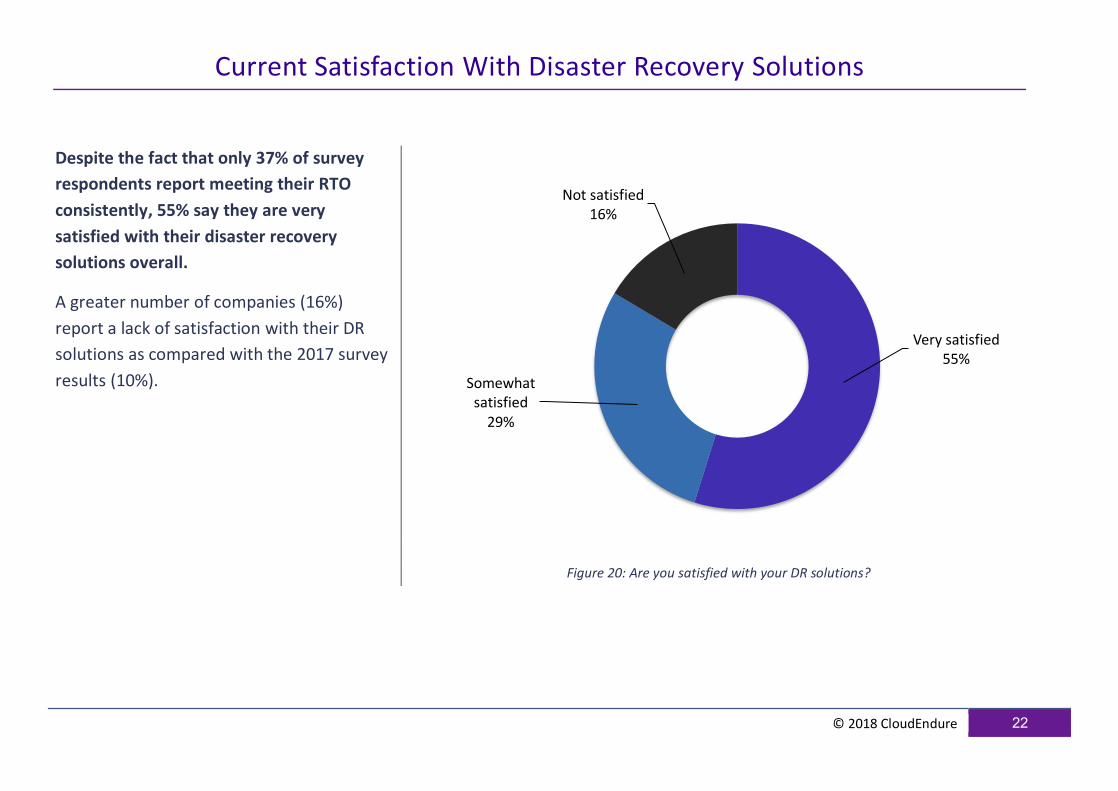
Current Satisfaction With Disaster Recovery Solutions
Despite the fact that only 37% of survey
respondents report meeting their RTO
consistently, 55% say they are very
satisfied with their disaster recovery
solutions overall.
A greater number of companies (16%)
report a lack of satisfaction with their DR
solutions as compared with the 2017 survey
results (10%).
Figure 20: Are you satisfied with your DR solutions?
Very satisfied55%
Somewhat satisfied
29%
Not satisfied16%
© 2018 CloudEndure 23
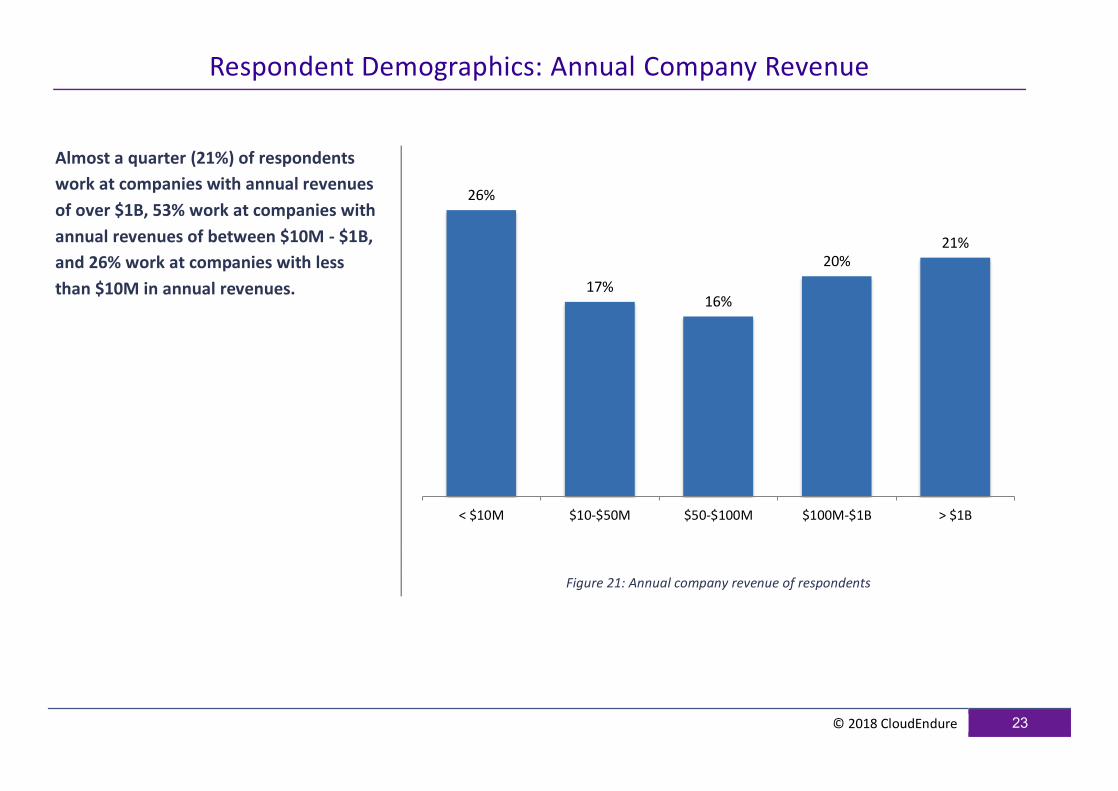
Respondent Demographics: Annual Company Revenue
Almost a quarter (21%) of respondents
work at companies with annual revenues
of over $1B, 53% work at companies with
annual revenues of between $10M - $1B,
and 26% work at companies with less
than $10M in annual revenues.
Figure 21: Annual company revenue of respondents
26%
17%16%
20%21%
< $10M $10-$50M $50-$100M $100M-$1B > $1B
© 2018 CloudEndure 24
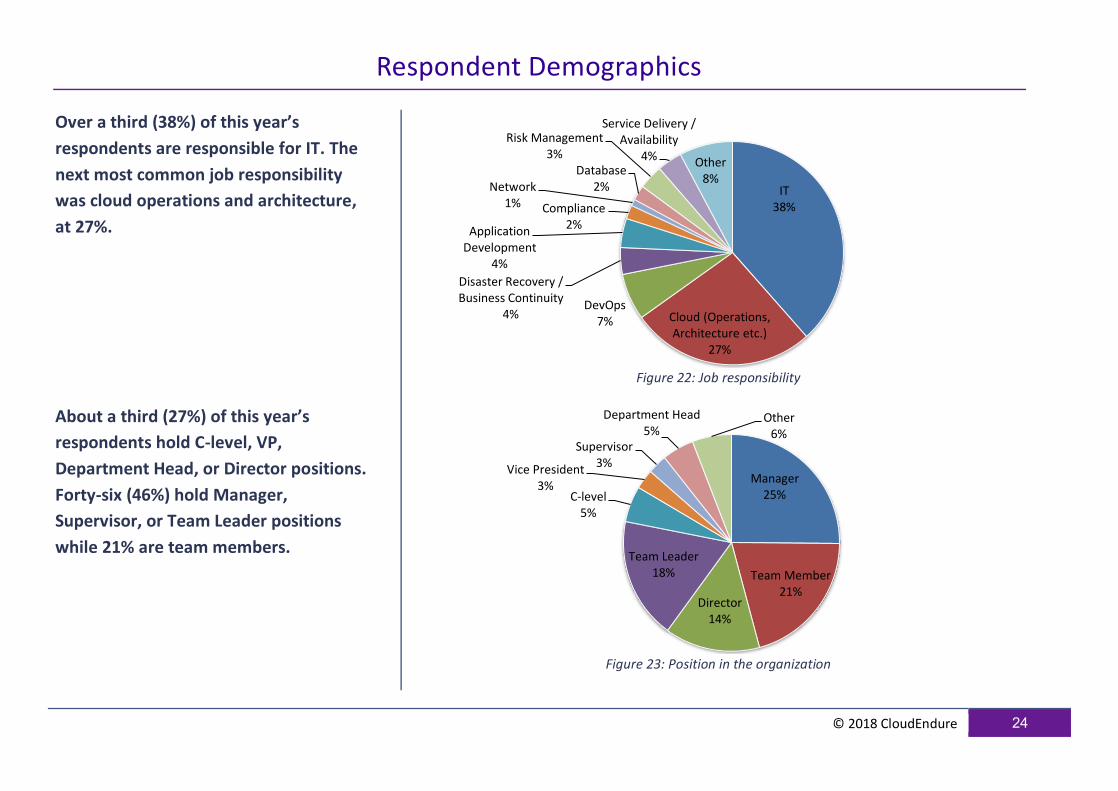
Respondent Demographics
Over a third (38%) of this year’s
respondents are responsible for IT. The
next most common job responsibility
was cloud operations and architecture,
at 27%.
Figure 22: Job responsibility
About a third (27%) of this year’s
respondents hold C-level, VP,
Department Head, or Director positions.
Forty-six (46%) hold Manager,
Supervisor, or Team Leader positions
while 21% are team members.
Figure 23: Position in the organization
IT38%
Cloud (Operations, Architecture etc.)
27%
DevOps7%
Disaster Recovery / Business Continuity
4%
Application Development
4%
Compliance2%
Network1%
Database2%
Risk Management3%
Service Delivery / Availability
4% Other8%
Manager25%
Team Member21%
Director14%
Team Leader18%
C-level5%
Vice President3%
Supervisor3%
Department Head5%
Other6%

© 2018 CloudEndure 25
Table of Figures
Figure 1: Number of production machines in the organization ................................................................................................................................................................... 4
Figure 2: Percentage of production machines using disaster recovery today ............................................................................................................................................... 5
Figure 3: Workloads primarily covered by disaster recovery ...................................................................................................................................................................... 6
Figure 4: Current approaches to disaster recovery .................................................................................................................................................................................... 7
Figure 5: Different disaster recovery technologies ..................................................................................................................................................................................... 8
Figure 6: Disaster recovery site infrastructures ......................................................................................................................................................................................... 9
Figure 7: Service availability goals ......................................................................................................................................................................................................... 10
Figure 8: Meeting service availability goals ............................................................................................................................................................................................ 11
Figure 9: Last downtime event ............................................................................................................................................................................................................... 12
Figure 10: Recovery point objectives ...................................................................................................................................................................................................... 13
Figure 11: Recovery time objectives ....................................................................................................................................................................................................... 14
Figure 12: Meeting RPO goals ............................................................................................................................................................................................................... 15
Figure 13: Meeting RTO goals ............................................................................................................................................................................................................... 15
Figure 14: Frequency of disaster recovery drills ....................................................................................................................................................................................... 16
Figure 15: The top risks to service availability ......................................................................................................................................................................................... 17
Figure 16: Who is responsible for DR? .................................................................................................................................................................................................... 18
Figure 17: Hours invested in DR per week ............................................................................................................................................................................................... 19
Figure 18: Estimated annual cost of backup/DR ...................................................................................................................................................................................... 20
Figure 19: Estimated cost per day of downtime ...................................................................................................................................................................................... 21
Figure 20: Are you satisfied with your DR solutions? ............................................................................................................................................................................... 22
Figure 21: Annual company revenue of respondents ............................................................................................................................................................................... 23
Figure 22: Job responsibility .................................................................................................................................................................................................................. 24
Figure 23: Position in the organization ................................................................................................................................................................................................... 24
About CloudEndure
Business as Usual. Always.
CloudEndure provides Disaster Recovery and Live Migration for all
applications, allowing enterprises to mobilize entire workloads to
and across clouds with near-zero downtime and no data loss. Our
Live Workload Mobility technology provides continuous, block-level
replication and application stack orchestration — at the touch of a button,
within minutes, and with the latest data.
CloudEndure supports physical, virtual, and cloud-based infrastructure as
sources and Amazon Web Services (AWS), Google Cloud Platform (GCP),
Microsoft Azure, VMware, OpenStack, Oracle Cloud, and Alibaba Cloud as
target locations. For more information, visit www.cloudendure.com.
For more information about disaster recovery and live migration:
www.cloudendure.com | [email protected] | (650) 360 0717
©2018 CloudEndure Ltd. All Rights Reserved
SCHEDULE A DEMO


![Disaster Recovery Center (Disaster Assistance … Library/Disaster Recovery Center...Disaster Recovery Center (Disaster Assistance Center) Standard Operating Guide [Appendix to: ]](https://img.dokumen.tips/doc/110x75/5b0334ba7f8b9a2d518bd9d9/disaster-recovery-center-disaster-assistance-librarydisaster-recovery-centerdisaster.jpg)