Embed Size (px)
Citation preview

Disaster Early Warning and Response Activities at RCMRD
Tesfaye Korme (Ph.D), Regional Centre for Mapping of
Resources for Development
Satellite Earth Observation & Disaster Risks

• About RCMRD:
• Established in 1975
• Intergovernmental Institution
• It is based in Nairobi-Kenya
• Currently, has 18 member States
RCMRD and its member States

RCMRD Main Activities • Training: Geoinformation and IT applications,
• Project Services: at Local, Regional and Continental levels
• Advisory Services: mainly to member States • Research and Development: both applied and fundamental
researches
• Spatial Data: acquisition, archiving and dissemination
Early warning and forecast: Disaster early warning (flood, famine, epidemic diseases, etc. )
• Engineering Services: Maintenance, repair and calibration of survey and mapping equipments

• 95% of hazards are caused by droughts and flooding.
• 70% of loss of life and 75% of economic loss is by both
Major Disasters in the Region Current Situation, (Ref. GARNET-E, 2012)
1. Droughts
2. Flooding
3. Landslides
4. Fire
5. Volcanic Hazards
6. Epidemic Diseases
7. Land Degradation
8. Tsunami

Disaster Early Warning At RCMRD
The provision of timely and effective information, through identified institutions, that allows individuals exposed to hazard to take action to avoid or reduce their risk and prepare for effective response (ISDR, 2006)
EW integrates four key elements, namely; risk knowledge,
monitoring and prediction, information dissemination, and response
Failure of any of these elements usually collapses the entire
system
Early Warning Defined As:
Disaster Early Warning At RCMRD
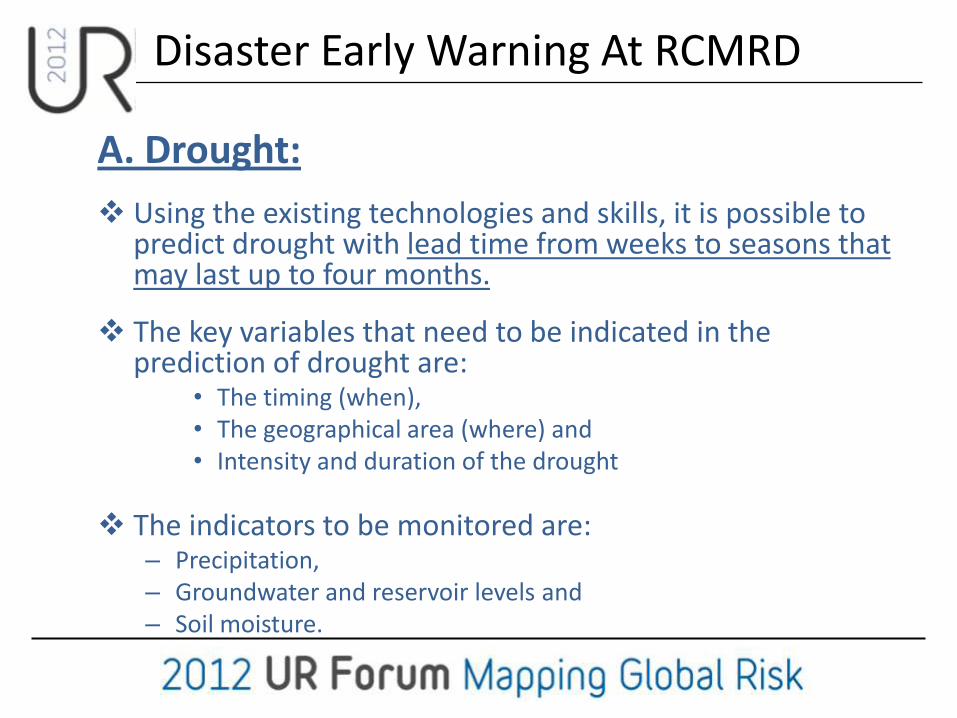
A. Drought:
Using the existing technologies and skills, it is possible to predict drought with lead time from weeks to seasons that may last up to four months.
The key variables that need to be indicated in the prediction of drought are:
• The timing (when), • The geographical area (where) and • Intensity and duration of the drought
The indicators to be monitored are: – Precipitation, – Groundwater and reservoir levels and – Soil moisture.

Drought Early Warning
Identification of Hotspots Using EO and Climate outlook data

Drought Early Warning Using NDVI Deviations
2011 Drought in the GHA

STAT LEVEL 3
Administrative Units
France - Soft W heat Yield - Area
y = 0,1409x + 4,1052 R
2 = 0,8819
y = -0,0033x
2 + 0,2222x + 3,7532
R
2 = 0,8998
3,50
4,00
4,50
5,00
5,50
6,00
6,50
7,00
7,50
8,00
1975 1976 1977 1978 1979 1980 1981 1982 1983 1984 1985 1986 1987 1988 1989 1990 1991 1992 1993 1994 1995 1996 1997 1998
YEAR
T/ha
2100,00
2600,00
3100,00
3600,00
4100,00
4600,00
5100,00
5600,00
1000 ha
Remote sensing
Pixels 0.3 -1- 5Km
CGMS LEVEL 2
Grids 50/25Km
METEO LEVEL 1
Ground Stations +
ECMWF 50/25/10km
grids
Crop Monitoring and Yield forecast Systems
QUALITATIVE INFO /
EWS Near real- time Crop
monitoring
QUANTITATIVE INFO Yield forecast
MARS Crop Growth Monitoring and Yield forecast Systems (CGMYS)
LAND COVER
SOIL
SOIL+LC LEVEL 0
Crop models

Crop Monitoring and Yield forecast Systems
Crop yeild forecast in the Horn of AFRICA, application of EO
Statistical models
combining best
predictors from
EO (NDVI, LAI,
DMP) or Agromet
model and trend.
KENYA

Drought Early Warning Using NDVI Deviations
B. Flooding:
Flooding is the second major disaster in the region.
The predictability lead time of flooding varies from minutes (flash floods) to weeks (stream floods)
The key variables that need to be indicated in the prediction of flooding are:
• The timing (when), • The geographical area (where) and • Water level, and velocity.
The indicators that are monitored for flood prediction are: • Precipitation, • Soil moisture, • River gauge level
All of these indicators are monitored both from satellite and ground observations.

Flood Early Warning and Forecasting
Model
Flood Potential Precipitation

Flood Early Warning and Forecasting
Model
Flood Potential Precipitation
Flood Event Mapping
CREST Stream Model
High resolution Model
Flood Event Mapping

Flood Early Warning and Forecasting
Ethiopia
Moderate
Severe
Ethiopia
Somalia
Moderate
Severe
May 11, 2010 flood potential
Ethiopia
Somalia
Moderate
Severe

Authorized User (AU)
On-Duty Operator (ODO)
Emergency On-Call Officer
(ECO) CSA
ESA
CNES
RADARSAT-1
ERS-2 and ENVISAT
SPOT-1, 2, 4 & 5
NOAA
ISRO
NOAA-12, 14, 15, 16 & 17, POES and GOES
IRS Project Manager
(PM)
End User (EU) Value-Added Reseller (VAR)
Disaster
CONAE SAC-C
JAXA ALOS
Response through International Disaster Charter
USGS
DMC
Landsat
DMC Constellation

Response for Flooding in Kenya
Charter Activation 309, RADARSAT Image
Flood Disaster Rapid Map

Response for Landslide Disaster in Uganda
Stereoscopic EO data provides DEM and Land Cover Information which are required for landslide vulnerability assessment and monitoring. Several historical landslide scars were mapped from Landsat Images in Kenya and Ethiopia Examples: Western Kenya, Ethiopia, Malawi
C. Landslides/ Mud flow/ Rock fall

Landslide

Response: Landslide

Most of the EWS in the GHA (and Africa in general) are project based – thus have a limited lifespan
Inadequate / inaccurate data especially in-situ data,
Need for promoting further Research and Development in EWS.
Need for awareness creation among decision makers.
Need to begin focusing more on long-term EWS
Challenges in Disaster EW for the Region

Director General RCMRD [email protected] 254-20-856-1775 254-20-856-0335 www.rcmrd.org
Contact Information:
Thank You,