Embed Size (px)
Citation preview

1
Disability Service
Annual Report
2013‐2014
This document is available in alternative format upon request and is on the College
Disability Service webpage at: http://www.tcd.ie/disability/policies/annual‐reports.php

2
Table of Contents
Introduction and Service Structure ............................................................................................
3
Executive Summary ....................................................................................................................
8
Key Statistics and figures ............................................................................................................
8
Key highlights for 2013‐14: .........................................................................................................
9
Phase 1 (Pre‐entry & First year experience) highlights .......................................................
9
Phase 2 (Progression and Retention) highlights ...............................................................
10
Phase 3 (Transition to Employment) highlights ................................................................
12
ATIC (Assistive Technology Information Centre) ...............................................................
13
Key Issues and challenges 2013‐14 ..........................................................................................
15
Appendix 1: Disability Service Key Performance Indicators .....................................................
16

3
Appendix 1a: Student Service data ..........................................................................................
19
Student registrations .........................................................................................................
19
Registration by Disability category ....................................................................................
20
Registrations by disability type and faculty .......................................................................
22
Rate of increase or decrease of first year student registrations by disability type ..........
22
New first year undergraduate registrations ......................................................................
27
New first year undergraduate registrations by entry route .............................................
27
When do students register with the Disability Service? ...................................................
28
Disclosures and LENS reports ............................................................................................
29
Examination accommodations ..........................................................................................
32
Number of withdrawn students by disability type ............................................................ 34

4
Introduction and Service Structure
Trinity College Dublin Disability Service (DS) addresses the needs of students and staff
with disabilities in College by providing advice, support, and academic/work
accommodations in partnership with service users and academic departments schools
and service areas.
The DS has two principle functions:
1. To provide supports and services to the College’s disabled community (which
comprises of students, staff, and, indirectly, visitors) and to recommend policy and
procedural changes as required.
2. To ensure College is compliant with the Disability Act 2005 and other relevant
legislation and codes of practice.
The College Disability Service Strategic Plan 2011‐2014 aims to develop clear and effective
support systems at all stages in the student journey, using a proactive strategy rather than
traditionally reactive models. This model engages students across three phases of their
Higher Education journey:
• Pre‐entry, admission and the first year experience
• Building and maintaining a college career
• Progressing through College to employment
This strategic approach enhances the student experience by engaging prospective
students, current students, and staff, with the intention of improving practice and
implementing change across the whole institution. It is an evidence‐based approach,
collecting data and evaluating supports on an ongoing basis to improve the student
journey. Each phase is aligned to:
• the Strategic Objectives of Trinity College Dublin (TCD)

5
• national targets for students with disabilities set by the Higher Education
Authority (HEA) in Ireland • recommendations from the OECD (2011) report on students with disabilities in
higher education.
Over the past twelve years the DS has undergone enormous growth and development. 64
students were registered with the service in 2000/01: by 2013/14 this had grown to 1058,
over which time a comprehensive range of supports has been developed to enable
students with disabilities to pursue degree programmes across all
faculties.
DS Budget: The core budget for 2013‐14 allocated via the HEA Access funding model
(based on the number of non‐traditional students registered in Trinity) decreased by 9%
(€111,794) from 2012 to 2014. The DS received €486,586, 40% of the total allocation of
€1,216,466, remainder allocated to the Trinity Access Programme. The DS employs 8
full‐time staff, 4 Occupational Therapist interns and approximately 40 casual
educational support workers who provide direct support to students with disabilities.
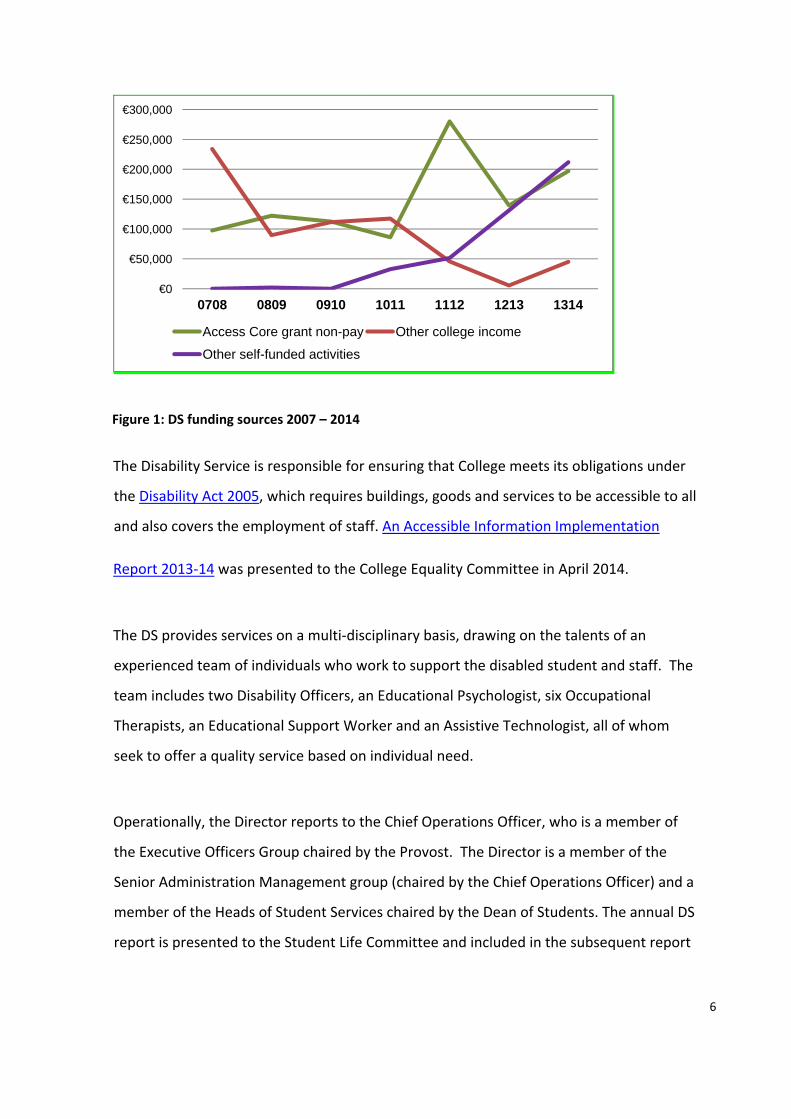
DS income streams have changed significantly over the last number of years. The HEA
access allocation, which initially rose, has fallen by 12% over the last three years. The
Fund for students with disabilities (ESF FSD) allocated to Trinity has reduced by 41% over
the last 7 years (from €936,233 in 2007‐08 to €550,000 in 2013‐14). At the same time
funds garnered from self‐financing activities have risen from 0% in 2009‐10 to 17% in
2013‐14. See Figure 1 below.
6
Figure 1: DS funding sources 2007 – 2014
The Disability Service is responsible for ensuring that College meets its obligations under
the Disability Act 2005, which requires buildings, goods and services to be accessible to all
and also covers the employment of staff. An Accessible Information Implementation
Report 2013‐14 was presented to the College Equality Committee in April 2014.
The DS provides services on a multi‐disciplinary basis, drawing on the talents of an
experienced team of individuals who work to support the disabled student and staff. The
team includes two Disability Officers, an Educational Psychologist, six Occupational
Therapists, an Educational Support Worker and an Assistive Technologist, all of whom
seek to offer a quality service based on individual need.
Operationally, the Director reports to the Chief Operations Officer, who is a member of
the Executive Officers Group chaired by the Provost. The Director is a member of the
Senior Administration Management group (chaired by the Chief Operations Officer) and a
member of the Heads of Student Services chaired by the Dean of Students. The annual DS
report is presented to the Student Life Committee and included in the subsequent report
€0
€50,000
€100,000
€150,000
€200,000
€250,000
€300,000
12130708 0809 0910 1011 1112 1314
Access Core grant non-pay Other college income
Other self-funded activities

7
from that Committee to Council and Board. The other reporting relationships in the
department are shown overleaf in Figure 3.
Figure 2: Corporate Services Structure in College

8
Figure 3: DS staff organization. Core posts are highlighted in blue
Executive Summary
This annual report covers the academic year 20‐2014. All findings are reported following
the three phase strategy used by the DS. Appendices contain financial information, key
statistics and a risk register.
Declan Treanor Director of the Disability Service
and Disability Officer
Disability
Officers
Administration
Unilink
Team
Andrew stelloC
Assistive T chnology and ityDisabi Officer
Alison Doyle
Disability Officer
Declan Reilly, Alison Doyle, Disability Officer
Andrew Costello, Assistive Technology Officer
Jennifer Maxwell
ESW Administrator
Carol Barry EO 4/5
and unfilled 1 / 5
Dr. Clodagh Nolan
Discipline ofOccupational
Therapy
Unilink ClinicalSupervision
Kieran Lewis
Senior Occupational Therapist
Claire Gleeson
Senior Occupational Therapist
Susan Madigan
Occupational Therapist
Fiona Gilmore
Occupational Therapist
Charlotte O'Connor
Occupational Therapist
Tracey Kilpatrick
Occupational Therapist

9
Key Statistics and figures
The significant increase in students registering with the DS over the past academic year has
resulted in an increased workload for the Service. This is summarised in the statistics
below:
• 1186 students (7.1% of the College total) registered with the service, up from
1098 (6.4%) in 2012‐13 – this represents a 9% increase
• 319 (down from 377 in 2012‐13) new students registered this year
• 842 (709) applications were made to the fund for students with disabilities (ESF)
• 1011 (819) students received additional exam accommodations
• 2,073 (2430) individual Unilink meetings with students were held
• 18,342 (17,078) enquires were made to the DS (phone/email/walk‐ins)
• 447 students availed of Unilink in 2013‐2014; 191 new referrals were made to Unilink
in 2013‐14.
Key highlights for 2013‐14:
Phase 1 (Pre‐entry & First year experience) highlights
Changes to TCD DARE Admissions Policy for 2014 were formally added to the
Admissions website and prospectus, in which eligible applicants with sensory and
physical disabilities will be prioritized over all other DARE applicants. In addition, the

10
waiver of the Language and Mathematics requirements has been extended to
students with sensory and communication disabilities;
The number of students with disabilities indicating Trinity as a choice on CAO form in
2013 ‐ 2014 was 1,212, with 834 (69%) applying through the DARE scheme and 581
(48%) being eligible for consideration. 174 applicants with a disability accepted a
Trinity offer and 92 students accepted a place through the DARE scheme;
DS received CSSI funding for an online version of the Pathways Transition Assessment
Tool which is currently in development;
With the Trinity Access Programme and other regional HEIs and as part of Phase 1 of
the Student Journey, the DS initiated a pilot project to investigate the effectiveness
of a collaborative outreach and recruitment strategy – the Disability Service
Outreach, Transition, Retention and Progression Plan 2014‐19.
Stage 1 of the collaboration project began in October 2013 with the Student
Ambassador Programme, partially supported via the Equality Fund. DS trained 26
ambassadors in June 2014 who have participated in TAP activities (Take 5, Summer
School), and DS orientation for DARE students.
11
Report on the three year longitudinal study 2011 – 2014 the First Year Experience
of DARE students.69% of students described the process of transition from school
to college as positive. Key factors noted in positive transition were timely and
effective pre‐entry information / programs, supports from College staff and
services, and good course choices. Students identified peers and family as key to
making the transition to college easier, and disability support providers as
instrumental to successful transition. Students highlighted the necessity of
independence in relation to learning and academic skills, and the need to be
selfaware and self‐determining. There was, however an overall improvement in
quality of support in HE across the study period;
Skills4Study Campus was re‐launched to all TCD staff and students. A summary
report was submitted to the Senior Lecturer and the Undergraduate Student
Committee in April 2014;
A poster presentation of Phase 1 activities – ‘How Ireland is performing on
equality of access to higher education and what we need to do next’ – was
exhibited at the HEA Conference in November 2013.
Phase 2 (Progression and Retention) highlights
The DS Code of Practice was updated and approved by the Student Services
Committee in February 2014. Additions included greater clarity on issues relating
to Data Protection requirements; the granting of consent for support
requirements to the student records at my.tcd.ie; disclosure of disability to

12
placement staff and funding applications to areas outside of ESF; and the inclusion
of emergency contact details;
The DS introduced a new communication structure, with DOs assigned to specific
Departments and Schools, and a bi‐annual newsletter distributed to ALOs for
dissemination to academic and administrative staff;
The DS hosted a Personal Emergency Evacuation Training event entitled ‘How do I
get out of here?’ for Access, Buildings, Disability and Safety Officers in Higher
Education Institutes in Ireland in June 2014. The purpose of this seminar was to
address the development of Personal Emergency Evacuation Plans (PEEPs) for
disabled users of buildings in the event of an emergency, and to initiate the next
steps in training required nationally and locally to ensure compliance with
regulations in regards to PEEPs. The event was supported by the Disability
Advisors Working Network (DAWN) in association with the Disability Service and
Safety Office in TCD and O’Herlihy Access Consultancy;
An article on Emergency access featuring a student of Trinity College Dublin
appeared in the spring 2014 edition of SpokeOut magazine. The article highlighted
the need for PEEPs to be taken into account in the design of any building;
Progress was made with the Accommodation Office and the Registrar of
Chambers which accepted new procedures for applications from students with
disabilities. The Supplementary form was re‐designed to provide a clearer link
with the Disability Service assessment;

13
The continued rollout of SITS during 2013/14 allowed students to declare a
disability at or after registration in College, and to indicate on a ‘support required
from Disability Service’ flag that they wished to be contacted and a meeting
arranged. This worked well and lead to an increase in the number of students
registering in the first term. A third flag on SITS indicates that the student has
registered with the Disability Service;
The Professional Placement Planning Process was formalized and integrated into
the needs assessment process for all students with disabilities on professional
programmes in College. These changes were publicized online;
The Unilink Service was awarded the tender to provide a shared Unilink Service in
University College Dublin, and Dublin Institute of Technology for the next four
years (2013‐2017) on a two day a week basis. Unilink also provided a five day a
week service to Dublin City University in 2013‐14;
The Unilink Service launched ‘Balancing the Books‐ Managing Fatigue in College‐
Staff and Students’. The book was launched by the Dean of the Faculty of Health
Science, Prof. Mary McCarron, in the TCD Global Room on 3rd April 2014;
Unilink exhibited a poster at the HEA Conference in November 2013 entitled 'TCD
Unilink: A Shared Service Model';
A review of the Dyslexia screening service was conducted. In 2013‐14 the DS
undertook 135 hours of screening and assessment of registered TCD students for
SLDs.44% of requests were made by mature students, and 22% by students
currently attending a TAP Foundation programme, or who entered TCD via a TAP

14
programme. Both groups are exempt from screening fees. The actual cost of
each dyslexia screening is €250 (each screening takes between 5‐6 hours to
complete) and includes feedback to students and advice on next steps, was
€6,750 in20‐2014, which is not a sustainable financial cost to DS.
Phase 3 (Transition to Employment) highlights
A key element of the Disability Service’s Strategic Plan 2011‐2014
http://www.tcd.ie/disability/projects/index.php is to encourage progression into
employment for students with disabilities. In 2013 a Genio Trust grant of
€181,725 was awarded over two years (http://genio.ie/genio‐trust/disability‐
mental‐health‐

15
2013, to enable the development of a model of support for students with mental
health difficulties in their transition to employment. This new support is called
‘Career Pathways’, an alliance between the DS, the Careers Advisory Service, and
the Discipline of Occupational Therapy in TCD. Career Pathways has been
providing support to students in their transition to employment since January
2014;
A Careers Adviser for Students with Disabilities was recruited to support Career
Pathways.Two part‐time Senior Occupational Therapists were also recruited to
establish and develop the Service;
A paper entitled “An exploratory study of the work‐related experiences of graduates
with disabilities and the perceptions of students with disabilities preparing for the
transition to employment” was presented at the
16th International Congress of the World Federation of Occupational Therapists in
Japan in June 2014;
Pebble Pad software was purchased to support the development of the Transition
Planning Tool. Career Pathways staff were trained in the use of the software and it
will be used by all students availing of Career Pathways in the year ahead.
ATIC (Assistive Technology Information Centre)
Research into assistive technology assessment was undertaken to develop a link for
students to enable them to transfer assistive technology use and skills to the
workplace. From this qualitative research of eight students (four current and four
past) the MET (Matching Employees and Technology) exiting assessment was
developed, via Career Pathways,to allow students highlight their positive use and
16
need for continued use of Assistive technology when transferring from education to
employment;
Discussions were held with the Procurement Office on the development of a refined
request for tender process (RFT) that will include clear questions on the accessibility
levels of goods and services under the accessible information policy;– The DS and the
Communications Office collaborated on the development of
accessibility guidelines for the TCD branding toolkit ;
The DS held the annual accessible information training event in December 2013. This
event was open to all staff and academics and was publicized to all school
administrators and academic liaison officers, as well as all executive officers within
administrative areas;
The DS has worked with the GeneSIS SITS team in 2013‐14 to identify a clear process
to allow DS staff to identify students who request supports by declaring a disability
during the online registration process that all students complete via the mytcd.ie
portal.
Key Issues and challenges 2013‐14
Disability Service Information flow in College: At present the use of a standalone DS
database to report each case is inefficient and relies heavily on manual intervention, with
associated risks. A module within SITS should be developed to allow for better
communication with students with disabilities in College.
Funding and staffing for the Disability Service: The funding required to provide disability
services to all disabled students and staff derives from a variety of sources, with the

17
majority (62%) coming from outside the College core grant. The complex funding
arrangements of the DS require considerable staff time to manage the various demands
from the funding sources. The main funding sources (HEA access allocation and ESF Fund
for students with disabilities) have decreased substantially over the last number of years,
whilst the number of students requiring support has doubled over the last five years. The
ESW Administrator, the post holder responsible for financial management in the DS, will
retire in September 2015 and is not scheduled for replacement.
Dyslexia screening services have been ceased due to the lack of resources and staff to
provide this service. The screening service offered was of a very high standard and unique
nationally. To ensure we continue to meet this need, students presenting with dyslexia
type difficulties will be offered a dyslexia consultation meeting with the DS Educational
Psychologist.
Appendix 1: Disability Service Key Performance Indicators
The Key Performance Indicators developed by the DS capture the breath of work carried
out by the service. Admissions KPIs capture entry numbers and routes; under service
delivery we record the number and types of services offered, while annual reviews in
each area allow the DS to measure activities and targets set.
Indicator 08/9 09/10 10/11 11/12 12/13 13/14 Target
Number of new UG

18
entrants with
disabilities entering
with the required
points (RP) / DARE3
RP 73
DARE
36
RP 91
DARE
32
RP 151
DARE
44
RP 94
DARE
77
RP 191
DARE
94
RP 82
DARE
92
Increase
Number of students
with disabilities
registering with DS3
244 296 311 348 377 319 Maintain
Number of students
with disabilities in
College3&4
585
(3.6%)
685
(4.2%)
818
(4.9%)
911
(5.4%)
1058
(6.4%)
1186
(7.1%) Increase
Number of needs
assessments carried
out (dis/spld)3
251
278
(Disab
158)
(SpLD
120)
292
(Disab
148)
SpLD
144)
336
(Disab
166)
(SpLD
170)
377
(Disab
241)
(SpLD
136)
331
(Disab
231)
(SpLD
100)
Maintain
Number of students
supported by ESF
student with
disability fund3
383 418 521 592 709 842 Increase
Number of student
receiving exam
accommodations3
406 503 615 688 819 1011 Maintain
Public walk‐ins,
students/staff1
1690/
1572
1726/
1506
1529/
1343
1803/
1526
1405/
1257
1463/
1224 Maintain
Email enquiries1 8765 9205 9259 10697 12101 13018 Maintain

19
Phone enquiries,
internal/external1
1648/
1513
1472/
1591
1414/
1706
1375/
1830
982/
1333
1096/
1541 Maintain
Page views on
Facebook/website2 N/A N/A N/A 7,758 15,974 13,666 Increase
Unique website
page views 2 130,085 198,358 206,918 91,720 90,813 95,565 Maintain
YouTube visits2 N/A N/A 1,386 2,919 2,547 2,335 Maintain
Number of student
appointments with
Disability Officers1
2182 1567 1285 1306 1199 1856 Maintain
Number of Dyslexia
Screenings/ positive
diagnoses5
52/34 45/29 48/29 41/28 17/13 27/19
Service
no
longer
provided
Number of learning
support
appointments1
497 260 266 64 37 84 Decrease
Number of one‐to‐
one ATIC student
training
appointments1
121 115 108 125 144 183 Maintain
Number of Unilink
appointments1 1000 1064 1477 2263 2,430 2,073 Maintain
Percentage of
Unilink staff time
20
allocated to direct
student interaction
during term time (30
weeks)6
n/a n/a n/a 98% 94% 80%* Maintain
Number of ALO and
departmental
meetings1
18 16 27 18 16 24 Maintain
1 DS Record Management System
2 Website and Facebook Unique Visitors –figure counts the number of hosts (computer/laptops)
that have made at least one hit on one page of the website during that year, equating to a single
user requesting to view one page only.
3 DS Database and Senior Lecturer Annual Report.
4 Percentage of total student population in College.
5 Dyslexia Screening: a battery of six comprehensive and professional psychometric tests is used in
each screening.
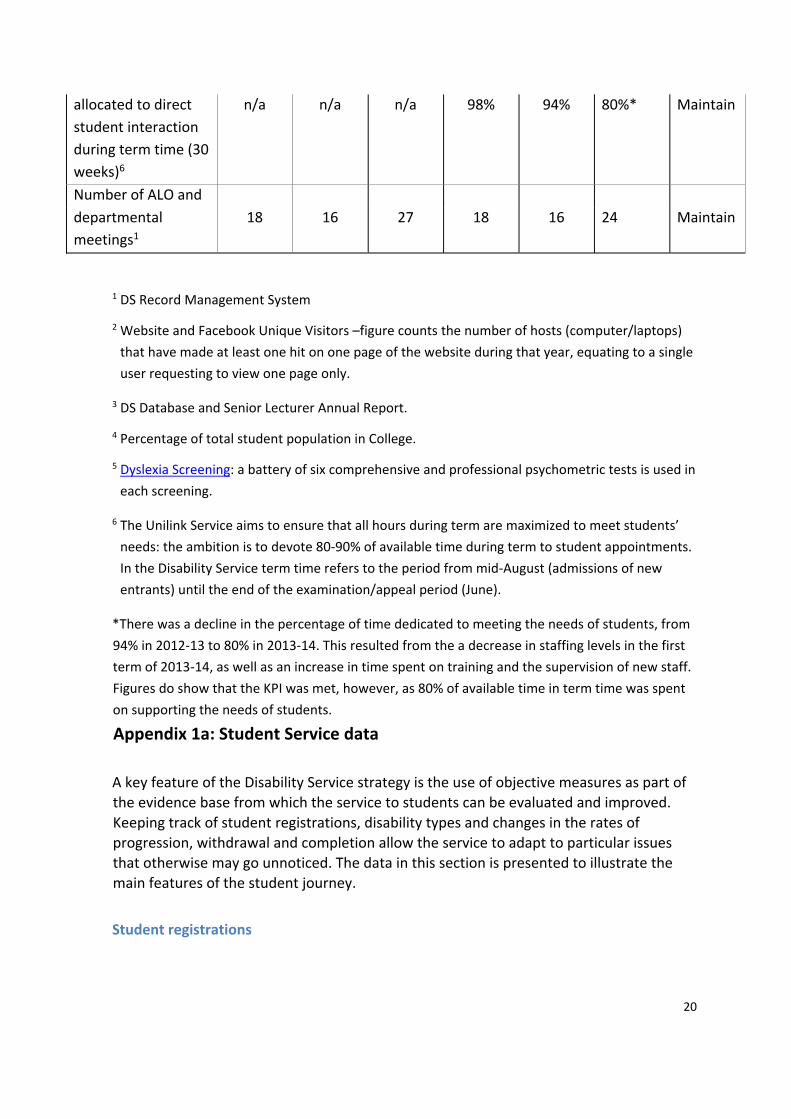
6 The Unilink Service aims to ensure that all hours during term are maximized to meet students’
needs: the ambition is to devote 80‐90% of available time during term to student appointments.
In the Disability Service term time refers to the period from mid‐August (admissions of new
entrants) until the end of the examination/appeal period (June).
*There was a decline in the percentage of time dedicated to meeting the needs of students, from
94% in 2012‐13 to 80% in 2013‐14. This resulted from the a decrease in staffing levels in the first
term of 2013‐14, as well as an increase in time spent on training and the supervision of new staff.
Figures do show that the KPI was met, however, as 80% of available time in term time was spent
on supporting the needs of students.
Appendix 1a: Student Service data
A key feature of the Disability Service strategy is the use of objective measures as part of
the evidence base from which the service to students can be evaluated and improved.
Keeping track of student registrations, disability types and changes in the rates of
progression, withdrawal and completion allow the service to adapt to particular issues
that otherwise may go unnoticed. The data in this section is presented to illustrate the
main features of the student journey.
Student registrations

21
The number of students registering with the Disability Services has risen significantly
since 2001. The graph below illustrates steady increases in the years after the Service was
established with an almost doubling of registrations over 7 years from 222 in 2001/02 to
434 in 2007/08. In contrast, the rate of increase accelerated from 2007/08, with the
numbers more than doubling in just 4 years to 911 in 2011/12.
Figure 1 DS Student registrations 2001 to 2014
While student numbers in general have increased in Trinity College since 2001, the rate of
registrations for students with disabilities has increased proportionately also. The table
below demonstrates proportionate increases approximately in line with the numbers
above. In 2001/02 the proportion of TCD students registered with DS was 1.5%, this had
doubled to 3.2% by 2006/07. By 2012/13 the proportion of students registered with DS as
a percentage of the TCD student population had doubled to 6.4%. The numbers of
postgraduates with disabilities start to be recorded in 2010‐11 and significant rise in
numbers registering are noted in 13‐14. The lower section of the table continues from
2010/11 to 2013/14 and includes data for undergraduate and postgraduate students. The
proportion of postgraduate students with disabilities has increased steadily since 2010/11
but remains less than the undergraduate level.
Year 01/02 02/03 03/04 04/05 05/06 06/07 07/08
No. 222 285 345 365 421 420 434
% 1.50% 1.9% 2.3% 2.4% 2.8% 3.2% 2.8%
Year 08/09 09/10 10/11 11/12 12/13 13/14
No. 585 685 818 911 1058 1186
% 3.6% 4.2% 4.9% 5.4% 6.4% 7.1%
22
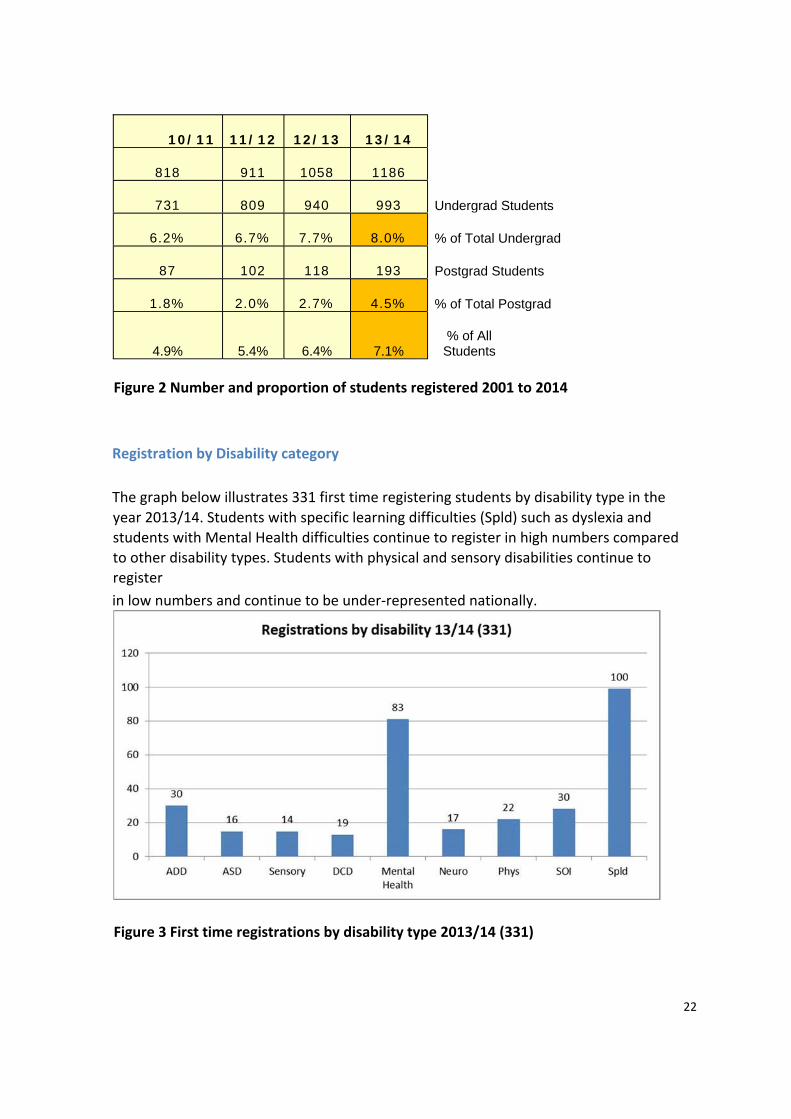
Figure 2 Number and proportion of students registered 2001 to 2014
Registration by Disability category
The graph below illustrates 331 first time registering students by disability type in the
year 2013/14. Students with specific learning difficulties (Spld) such as dyslexia and
students with Mental Health difficulties continue to register in high numbers compared
to other disability types. Students with physical and sensory disabilities continue to
register
in low numbers and continue to be under‐represented nationally.
Figure 3 First time registrations by disability type 2013/14 (331)
/11 10 /12 11 1312 / /14 13
818 911 1058 1186
731 809 940 993 Undergrad Students
% 6.2 6.7 % 7.7 % % 8.0 % of Total Undergrad
87 102 118 193 Postgrad Students
% 1.8 % 2.0 % 2.7 4.5% % of Total Postgrad
% 4.9 % 5.4 6.4 % 7.1% % of All
Students
23
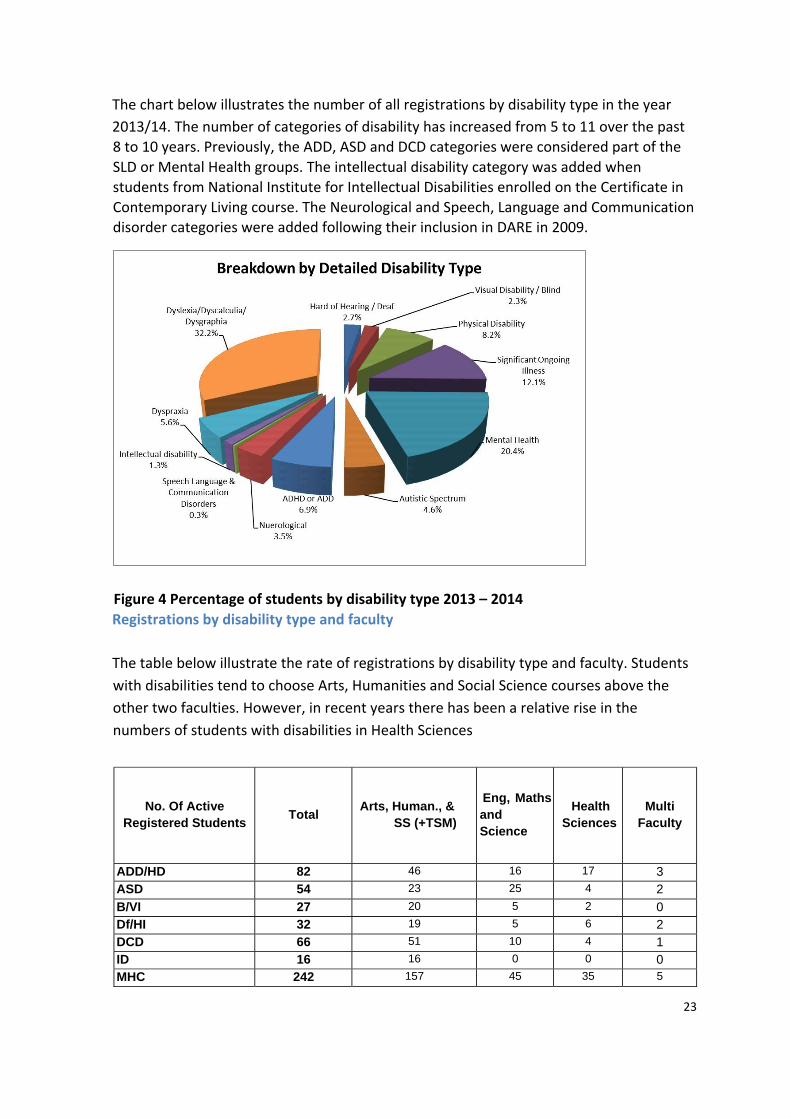
The chart below illustrates the number of all registrations by disability type in the year
2013/14. The number of categories of disability has increased from 5 to 11 over the past
8 to 10 years. Previously, the ADD, ASD and DCD categories were considered part of the
SLD or Mental Health groups. The intellectual disability category was added when
students from National Institute for Intellectual Disabilities enrolled on the Certificate in
Contemporary Living course. The Neurological and Speech, Language and Communication
disorder categories were added following their inclusion in DARE in 2009.
Figure 4 Percentage of students by disability type 2013 – 2014
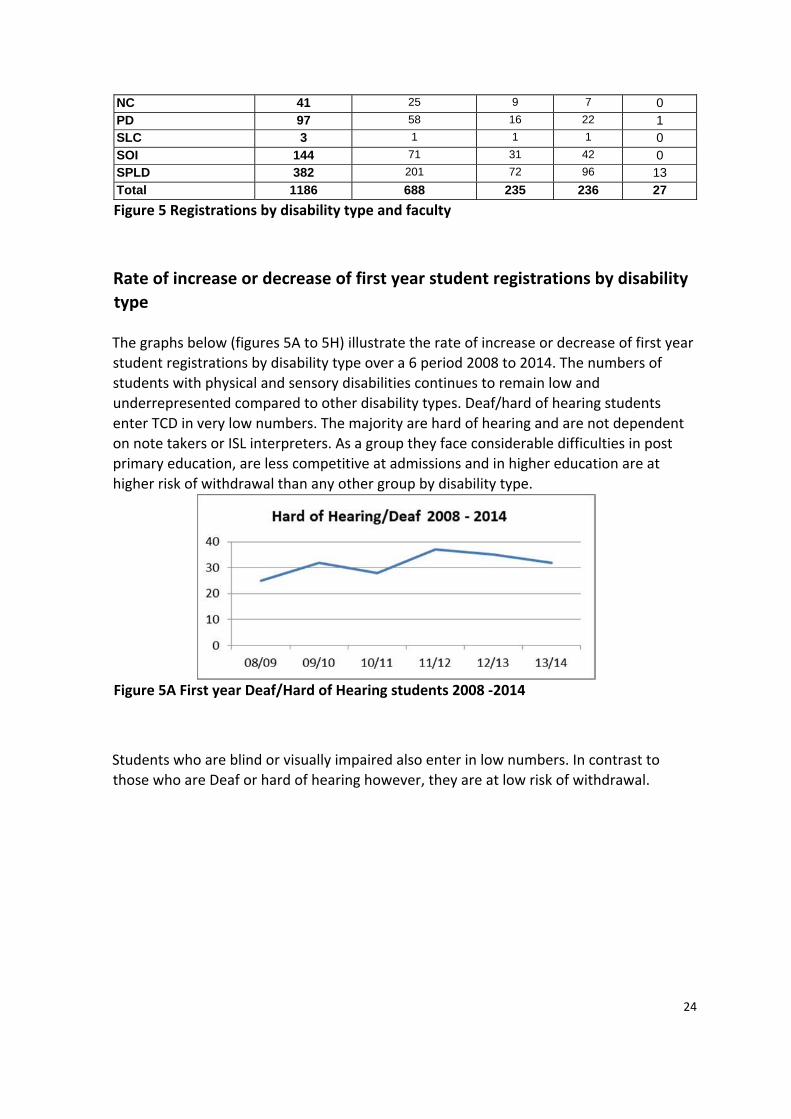
Registrations by disability type and faculty
The table below illustrate the rate of registrations by disability type and faculty. Students
with disabilities tend to choose Arts, Humanities and Social Science courses above the
other two faculties. However, in recent years there has been a relative rise in the
numbers of students with disabilities in Health Sciences
No. Of Active Registered Students
Total Arts, Human., &
SS (+TSM)
Eng, Maths and Science
Health Sciences
Multi Faculty
ADD/HD 82 46 16 17 3ASD 54 23 25 4 2
B/VI 27 20 5 2 0Df/HI 32 19 5 6 2DCD 66 51 10 4 1ID 16 16 0 0 0MHC 242 157 45 35 5
24
NC 41 25 9 7 0PD 97 58 16 22 1SLC 3 1 1 1 0SOI 144 71 31 42 0SPLD 382 201 72 96 13Total 1186 688 235 236 27
Figure 5 Registrations by disability type and faculty
Rate of increase or decrease of first year student registrations by disability
type
The graphs below (figures 5A to 5H) illustrate the rate of increase or decrease of first year
student registrations by disability type over a 6 period 2008 to 2014. The numbers of
students with physical and sensory disabilities continues to remain low and
underrepresented compared to other disability types. Deaf/hard of hearing students
enter TCD in very low numbers. The majority are hard of hearing and are not dependent
on note takers or ISL interpreters. As a group they face considerable difficulties in post
primary education, are less competitive at admissions and in higher education are at
higher risk of withdrawal than any other group by disability type.
Figure 5A First year Deaf/Hard of Hearing students 2008 ‐2014
Students who are blind or visually impaired also enter in low numbers. In contrast to
those who are Deaf or hard of hearing however, they are at low risk of withdrawal.

25
Figure 5B First year Blind/Visually Impaired students 2008 ‐2014
Students with physical disabilities are under‐represented in TCD and Higher Education
nationally compared to other disability types. However, in recent years the numbers have
increased somewhat compared to those with sensory disabilities.
Figure 5C First year students with physical disabilities 2008 ‐2014
The number of students with specific learning difficulties, predominantly dyslexia, has
decreased marginally over the past 5 years. The proportionate decrease is greater. These
decreases are due mainly for two reasons. Firstly, the increase in the diagnosis rates of
ADHD, Asperger’s Syndrome and DCD has lessened the numbers seeking a diagnosis
specifically for dyslexia (there is a high co‐morbidity among these conditions). Secondly,
the criteria for DARE ensure that only those with two or more literacy difficulties (at or
below the 10th percentile) can be eligible for a points reduction at admissions.

26
Figure 5D First year students with specific learning difficulties 2008 ‐2014
Students with significant ongoing illness (SOIs) represent the most varied disability type
as they are categorised by the broadest of criteria. There is no definitive list of all the of
medical conditions that could be considered SOIs, but the most common conditions
would be cancer, chronic fatigue syndrome, Crohn’s disease, diabetes, and multiple
sclerosis. There is also overlap between some SOIs and other categories of disability. For
example, arthritic conditions vary and can be considered a physical disability due to the
impact on mobility; epilepsy has more recently been considered a neurological condition
and mental health conditions can overlap with fatigue conditions. These discrepancies it
categorisation make it difficult to think of the SOI group in clearly defined terms.
Figure 5E First year students with significant ongoing illnesses 2008 ‐2014
Trinity College has the highest number and the highest proportion of students with
mental health difficulties of any HEI in Ireland. There are a number of factors suggested
to explain this. Firstly, mental health conditions are regarded as the most prevalent of all
disability types and therefore it is likely that they are simply under diagnosed and under
disclosed in other HEIs. In TCD, there are considerable resources available to diagnose
and support students with mental health difficulties. The Health Centre provides a
psychiatric service and the Disability Service provides Occupational Therapy support via
Unilink. There is also a College Counselling Service and tutorial service. It is suggested that
collectively these supports also attract a higher number of students with mental health
difficulties among CAO applicants.

27
Figure 5F First year students with mental health difficulties 2008 ‐2014
The increase in students with Asperger’s syndrome attending TCD is significant, albeit
from a very low base, since 2007/08. Similar to the rationale suggested above for
students with mental health difficulties, there was (and maybe still is) a legacy of under
diagnosis and under disclosure to ‘catch up on’. Also, through the work of a number of
staff and students in various departments over the past decade, TCD has gained a
reputation as being a supportive environment for students with Asperger’s syndrome.
Figure 5G First year students with Asperger’s 2008 ‐2014
Students with ADD or ADHD are an emerging group since around 2007/08. Similar to
students with Asperger’s syndrome and DCD, prior to 2007/08, as a group they would
have been more likely to have been ‘hidden’ among the general student population or
among those with Specific Learning Difficulties.

28
Figure 5H First year students with ADD or ADHD 2008 ‐2014

29
New first year undergraduate registrations
The majority of students registering in any one year are first year students. Since 2009/10
the number of students registering as first years has averaged 193. The chart below
illustrates a ‘levelling off’ of the number of 1st year students registering over the past 5
years.
Figure 6 First year (Junior Freshmen) registrations 2004 – 2014
New first year undergraduate registrations by entry route
Tracking the entry route of students is important in addressing the issue of equality of
access. Students with disabilities are considered a disadvantaged group in themselves;
however, they also transcend every student category including those that are also
considered non‐traditional or disadvantaged. The chart below compares the entry routes
of students with disabilities across 6 entry routes over the period 2007/08 to 2013/14.
Figure 7 New first year undergraduate registrations by entry route

30
When do students register with the Disability Service?
Knowing when students register with the Disability Service is useful because certain
groups tend to register early and others later. It is also useful to consider how supports
and resources are ‘front loaded’ at the start of the year. More than half the 319 students
who registered with the Disability Service in 2013/14 registered in the months of
September and October (188). The remaining 131 students registered in comparatively
Since 2005/06 the pattern of registrations by month is similar to the trend above. Some
of the monthly variations from year to year e.g. August 2009/10 are better explained by
IT and administration issues (being either ahead or behind by a few weeks) than by any
real change in student behaviour.
low numbers in the other months of the year.
Figure 8 All registrations by month 13/14 (331)

31
Figure 9 Record of registrations by month from 2005/06 to 2013/14
Disclosures and LENS reports
The following 3 tables show the number of disclosures and the issuing of Lens reports in
the year 2013/14. These are students registered with the Disability Service who agree to
disclose their disability to their school or department (primarily for exam
accommodations) and where appropriate, their Learning Education Needs Summary
(LENS). LENS tend to be produced where a student requires an academic support from
the academic area above and beyond the mainstream disability supports such as exam
accommodations.
Faculty of Arts, Humanities and Social
Science Disclosure Lens
Business (PG) 8 2
BESS 102 47
Sociology & Social Policy 4 2
Philosophy, Political Science,
Economics
and Sociology 12 8
Business and a Language 3 2
Drama, Film & Music 31 14
Education 4 3
English 57 22
History & Humanities 96 34
Languages 25 18
Law 49 25
Psychology 22 12
Religion & Theology 27 11
Linguistics 25 18
Social Sciences 85 31

32
Social Work 44 21
Faculty Total 594 269
Figure 10 Disclosures in the Faculty of Arts, Humanities and Social Science Schools
Faculty of Engineering, Maths and
Science
Disclosure Lens
Physics 11 6
Science 31 11
TR071 23 15
Maths 15 7
Genetics & Microbiology 14 6
Engineering 45 10
Computer Science 40 21
Chemistry 16 5
Biochemistry & Immunology 3 0
Faculty Total 198 81
Figure 11 Disclosures in the Faculty of Engineering Maths and Science schools
Faculty of Health Sciences Disclosure Lens
Pharmacy 20 15
Nursing 81 18
Midwifery 10 4
Medicine 41 17
Dental Science 12 6
Radiation Therapy 5 1
Physiotherapy 7 4

33
Occupational Therapy 16 9
Faculty Total 192 87
TAP 8 6
Marino 9 9
Total 1041 452
Figure 12 Disclosures in the Faculty of Health Science schools on Share Point The graph below illustrates the rate of increase in disclosures per faculty across 3 years from 2011/12 to 2013/14. In 2013/14 the significant increase in disclosures among Health Science faculty students is noteworthy. There is a proportionate increase in the number of students with disabilities entering to Health Sciences courses and the Disability Service has been active in encouraging greater disclosure due to the launch of the placement
Figure 13 Increase in disclosures to Schools 2011/12 to 2013/14
Examination accommodations
Increase in exam accommodations from 2011/12 to 2013/14
planning process.

34
The graph below illustrates the increase in the provision of exam accommodations over a
3 year period from 2011/12 to 2013/14. The rate of increase is in line with the increase in
students registering with the Disability Service over the same period.
DS Reg – All students registered with the Disability Service
All Exam Ac – All students with exam accommodations
Ex Time – All students with extra time
GV – All students who attend a Group Venue (alternative to the main venues)
PC – All students who use a computer in exams
Scribe/reader – All students who have a scribe or reader in their exams
The table below lists the changes in exam accommodations from 2013 to 2014. The
majority of students registered are accommodated with extra time of 10 minutes per
Figure 14 Increase in exam accommodations from 2011/12 to 2013/14

35
hour and group venue. Additional supports beyond this ‘baseline’ are allocated in
relatively small numbers.
May 2013 April 2014 Change up
or down
Students registered with DS 1125 1357* Up 232
Total with exam accommodations 819 1011 Up 78
Total with no exam accommodations 306 346 Up 40
10 mins per hour 778 932 Up 154
15 mins per hour 20 30 Up 10
20 mins per hour 3 7 Up 4
Low distraction venue 42 66 Up 24
Individual test centre ‐ general 38 59 Up 21
Group Test Centre 739 867 Up 128
Reader 19 21 Up 2
Scribe 11 16 Up 5
Use of computer 169 243 Up 74
Enlarged paper 5 5 -
Use of sticker 345 408 Up 63
Figure 15 Increases in exam accommodations 2011/12 to 2013/14
*The figure of 1357 is inflated somewhat by students who have graduated but have yet to
be flagged on SITS as such. They are showing up on the Disability Service database (which
is linked to SITS) as ‘registered’ and there are approx. 150 to 200 students in this
category.
Number of withdrawn students by disability type
The graph below illustrates the number of students by disability type who have
withdrawn from College since 2007. As a comparison, the current number of student by
disability type is also shown. Proportionate to the numbers registered, students with

36
mental health difficulties and Deaf/hard of hearing students are at highest risk of leaving
early. All other disability types have high retention rates in comparison with the College
Figure 16 Number of withdrawn students by disability type
Percentage of withdrawal of students with disabilities by disability type
The graph below illustrates the percentage rates of students who have withdrawn by
disability type. Students who are Deaf or hard of hearing make up 9% of all the students
with disabilities who withdraw but make up only 2.7% of all students with disabilities
registered (see figure 4 above). The average withdrawal rate for students registered with
the Disability Service is 10%.
average withdrawal rate of 14 %.

37
Figure 17 Percentage of withdrawal of students with disabilities by disability type
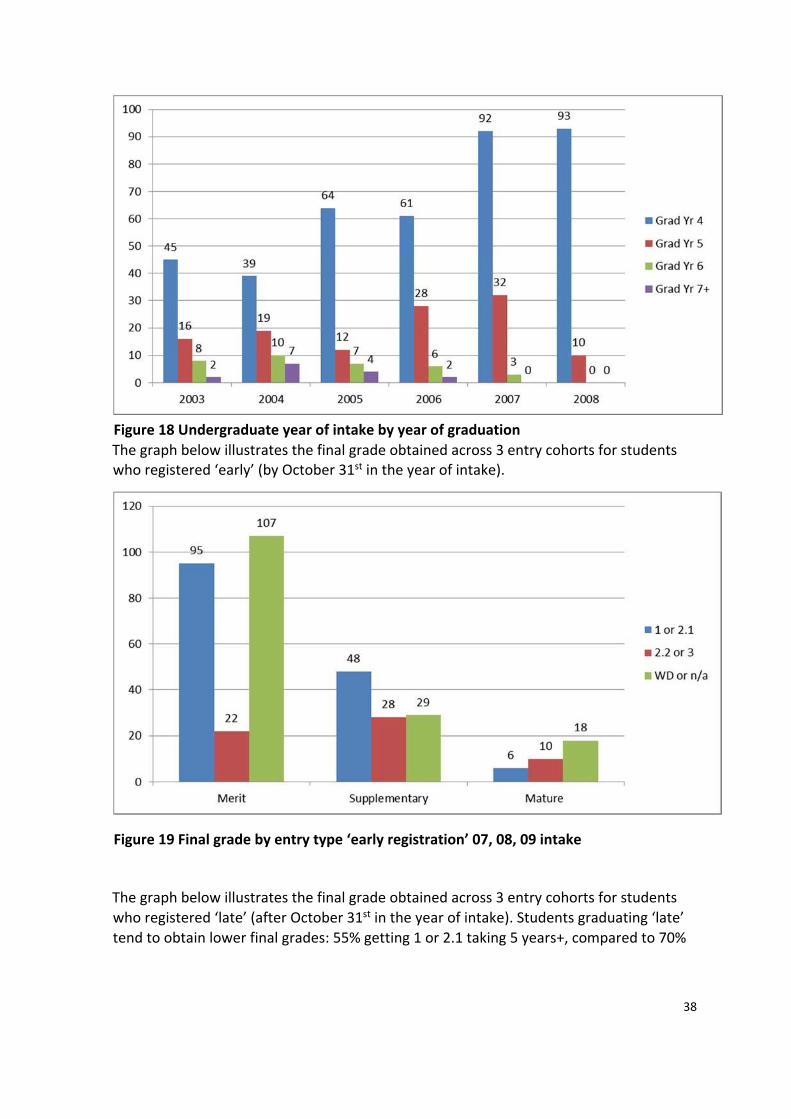
The graph below illustrates the number of students who graduate in 4 years or more by
year of intake. Students with disabilities are more likely, than their non‐disabled peers, to
take longer to complete their degrees due to periods of illness, medical repeats and time
off books.
38
Figure 18 Undergraduate year of intake by year of graduation
The graph below illustrates the final grade obtained across 3 entry cohorts for students who registered ‘early’ (by October 31st in the year of intake).
Figure 19 Final grade by entry type ‘early registration’ 07, 08, 09 intake
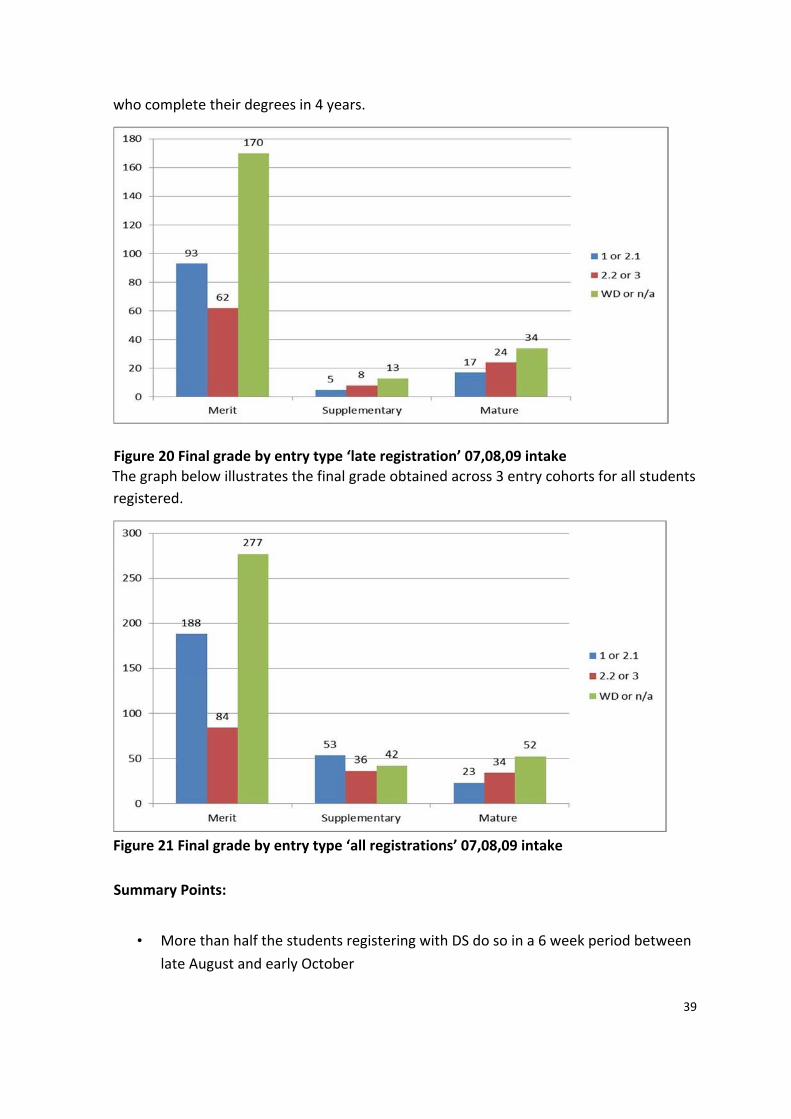
The graph below illustrates the final grade obtained across 3 entry cohorts for students
who registered ‘late’ (after October 31st in the year of intake). Students graduating ‘late’
tend to obtain lower final grades: 55% getting 1 or 2.1 taking 5 years+, compared to 70%
39
Figure 20 Final grade by entry type ‘late registration’ 07,08,09 intake
The graph below illustrates the final grade obtained across 3 entry cohorts for all students
Summary Points:
• More than half the students registering with DS do so in a 6 week period between
late August and early October
who complete their degrees in 4 years.
registered.
Figure 21 Final grade by entry type ‘all registrations’ 07,08,09 intake

40
• Students with specific learning difficulties such as dyslexia and students with
mental health difficulties continue to register in high numbers compared to other
disability types. Students with physical and sensory disabilities continue to register
in low numbers and continue to be under represented nationally.
• Mental health and Deaf students are at highest risk of leaving early, all other
disability types have high retention rates
• Mature students tend to register late: after November from the year of intake
• Students graduating ‘late’ tend to obtain lower final grades: 55% getting 1 or 2.1
taking 5 years+, compared to 70% who complete their degrees in 4 years
• Students who enter via a supplementary route also tend to obtain lower grades
than those entering on merit
• Aside from withdrawals and those still registered, final grades for 115 students are
not available