Embed Size (px)
Citation preview

DOCUMENT RESUME
ED 397 589 EC 304 919
AUTHOR Asbury, Charles A.; And OthersTITLE Disability Prevalence and Demographic Association
among Race/Ethnic Minority Populations in the UnitedStates: Implications for the 21st Century. MonographSeries Number Two.
INSTITUTION Howard Univ., Washington, DC. Research and TrainingCenter for Access to Rehabilitation and EconomicOpportunity.
SPONS AGENCY National Inst. on Disability and RehabilitationResearch (ED/OSERS) , Washington, DC.
PUB DATE 91
CONTRACT H133B80059-90NOTE 65p.
AVAILABLE FROM Howard University Research and Training Center forAccess to Rehabilitation and Economic Opportunity,2900 Van Ness St. NW., Holy Cross Building, Suite100, Washington, DC 20008.
PUB TYPE Guides Non-Classroom Use (055) ReportsDescriptive (141)
EDRS PRICEDESCRIPTORS
IDENTIFIERS
ABSTRACT
MF01/PC03 Plus Postage.*Blacks; Chronic Illness; Demography; *Disabilities;Educational Background; Employment; *Ethnic Groups;*Hispanic Americans; *Incidenc2; Income; *IndividualCharacteristics; Language impairments; Low IncomeGroups; Marital Status; Mental Retardation; MinorityGroups; Neurological Impairments; PhysicalDisabilities; Place of Residence; Racial Factors;Special Health ProblemsAfrican Americans; National Health lnterv.iei.Survey
This research report examined the distribution andincidence of disabilities among minorit;, communities. A. review ofliterature is provided including relevant statistics on theprevalence of disabilities in African Americans and HispanicAmericans. The study used data from the National Health InterviewSurvey (n=122,859) :o determine the prevalence of disability. Theassociation between -ace/ethnicity and othe, characteristics (sex,age, education, family income, marital status, employment, andgeographic region) is examined. Disability was divided into fourcategories: chronic debilitating health conditions; physical,sensory, and language impairments; mental disorders; and nervoussystem disorders. Several tables are provided to show associationbetween variables. Among the results were: the overrepresentation ofAfrican Americans ard Hispanic Americans with chronic healthconditions; African American overrepresentation for mentalretardation and other nervous system disorders; a high proportionsubjects from each of the disability categories residing in theSouth; and the generally low incomes of people with disabilities fromminority groliv, ((ontlins 10 ryfeir,nces.) (('P)

cf.00
ca.1
2 DISABILITY PREVALENCE AND DEMOGRAPHIC
ASSOCIATION AMONG RACE/ETHNIC
MINORITY POPULATIONS IN THE UNITED STATES:
IMPLICATIONS FOR THE 21ST CENTURY
U S DEPAPTMENT OF MUCATION
!?(Aiii?,A1 ViFSOURCI S iNF OHMATIONCENILHIE
oftw,,,CA100,
CHARLES A. ASBURYSYLVIA WALKW.
VALERIE MAHOLMESREGINALD RACKLEYSTERLING WHITE
ArrAL
PUBLISHED BY
HOWARD UNIVERSITYRESEARCH AND TRAINING CENTERFOR ACCESS TO REHABILITATIONAND ECONOMIC OPPORTUNITY
IIEST kilABLE
Li!

DISABILITY PREVALENCE AND DEMOGRAPHIC
ASSOCIATION AMONG RACE/ETHNIC
MINORITY POPULATIONS IN THE UNITED STATES:
IMPLICATIONS FOR THE 21ST CENTURY
CHARLES A. ASBURYSYLVIA WALKER
VALERIE MAHOLMESREGINALD RACKLEYSTERLING WHITE
PUBLISHED BYTHE HOWARD UNIVERSITY RESEARCH AND TRAINING CENTER
FOR ACCESS TO REHABILITATION AND ECONOMIC OPPORTUNITY

Monograph Series Number TwoThe Howard University Research and Training Center
for Access to Rehabilitation and Economic OpportunitySchool of Education, Howard University, Washington, D.C.
Copyright c by the Center for the Study of Handicapped Children and YouthHoward University, Washington, D.C.
All rights reserved
Printed by Richard Hoffman, Howard G. Hoffman, Inc.
This publicadon was supported in part by a grant from theU.S. Department of Education, National Institute on
Disability and Rehabilitation Research, Grant Number H133B0059-90.The opinions expressed herein are those of the authors
and should not be attributed to the U.S. Department of Education.
Copies of this monograph may be obtained by writing to:
Dr. Sylvia Walker, DirectorI Inward University Research and Training Center for Access to
Rehabilitation and Economic OpportunityI loward University
2900 Van Ness Street, N.W.I loly Cross Building, Suite 100
Washington, D.C. 20008
Library of Congress Cataloging in Publication DataMain entry under title:
Disability Prevalence and Denmgraphic Association among Race/rthnicMinorities in the linited States: Implications for the 2I't Century.
Disability-Research. RacialMmoritiesDisabilityVocationalRehabilitation. 3. RehabilitationChronic Ilea Ith. Mental andNeurologic Disorders. I. Asbury, Charles A. II. \Valker, Sylvia.Ill. Maho Valerie. IV. Rack ley, Reginald. V. White, Sterling.

CONTENTS
Contents
List of Tables iii
Preface iv
Acknowledgements vi
Dedication vi
Introduction
Rev:ew of Related Literature 3
The Problem 8
Objectives of the Study 9Research Questions 9Definition of Terms 10Criteria for Variables Selection 12
Variable T pes 13
Design and N'tethodolo* 15
Sample 15Description of the instrument and Procedures Used in
Collecting and Processing the Data 15Reliability and Types of Estimates 16Sampling Errors 17
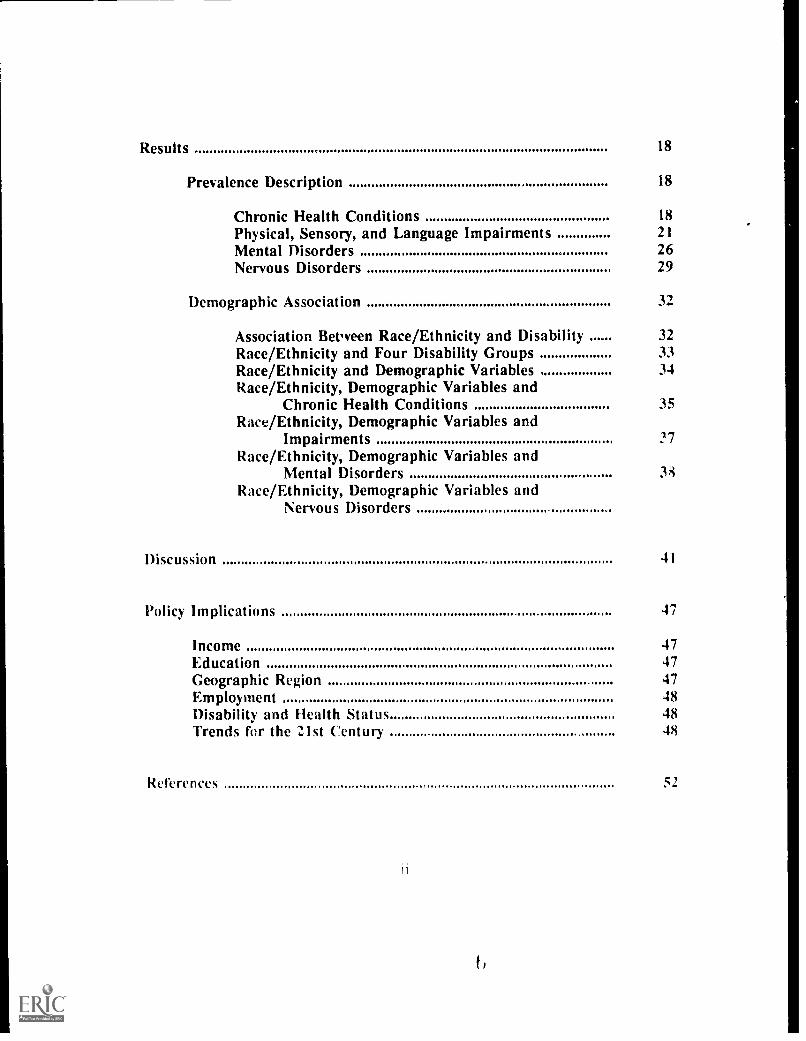
Results 18
Prevalence Description 18
Chronic Health Conditions 18
Physical, Sensory, and Language Impairments 21
Mental Disorders 26Nervous Disorders 29
Demographic Association 32
Association Between Race/Ethnicity and Disability 32Race/Ethnicity and Four Disability Groups 33Race/Ethnicity and Demographic Variables 34Race/Ethnicity, Demographic Variables and
Chronic Health Conditions 35Race/Ethnicity, Demographic Variables and
Impairments 27Race/Ethnicity, Demographic Variables and
Mental DisordersRace/Ethnicity, Demographic Variables and
Nervous Disorders
Discussion 41
Policy Implications 47
Income 47Education 47Geographic Region 47Employment 48Disability and Health Status 48Trends for the 21st Century 48
References 52

LIST OF' TABLES
Table I Values of Cramer's V for association betweenrace/ethnicity and four disability category groups
Table 2
Table 3
Table 4
Table 5
Table 6
Values of Cramer's V for measuring associationbetween race/ethnicity and selected demographicvariables among four types of populations withdisabilities in the United States
Values of Cramer's V tbr measuring associationbetween race/ethnicity and selected demographicvariables for seven types of chronic debilitatinghealth conditions
Values of Cramer's V for measuring associationbetween race/ethnicity and selected demographicvariables for six types of impairments
Values of Cramer's V for measuring associationbetween race/ethnicity and selected demographicNariables for three categories of mental disorders
VaitleS of Cramer's V for measuring associationbetween race/ethnicity and selected demographice oriablcs for six types of neivous disorders
Table 7 Nledian Family income by ethnic gnaw
34
35
36
37
39
40
4.4
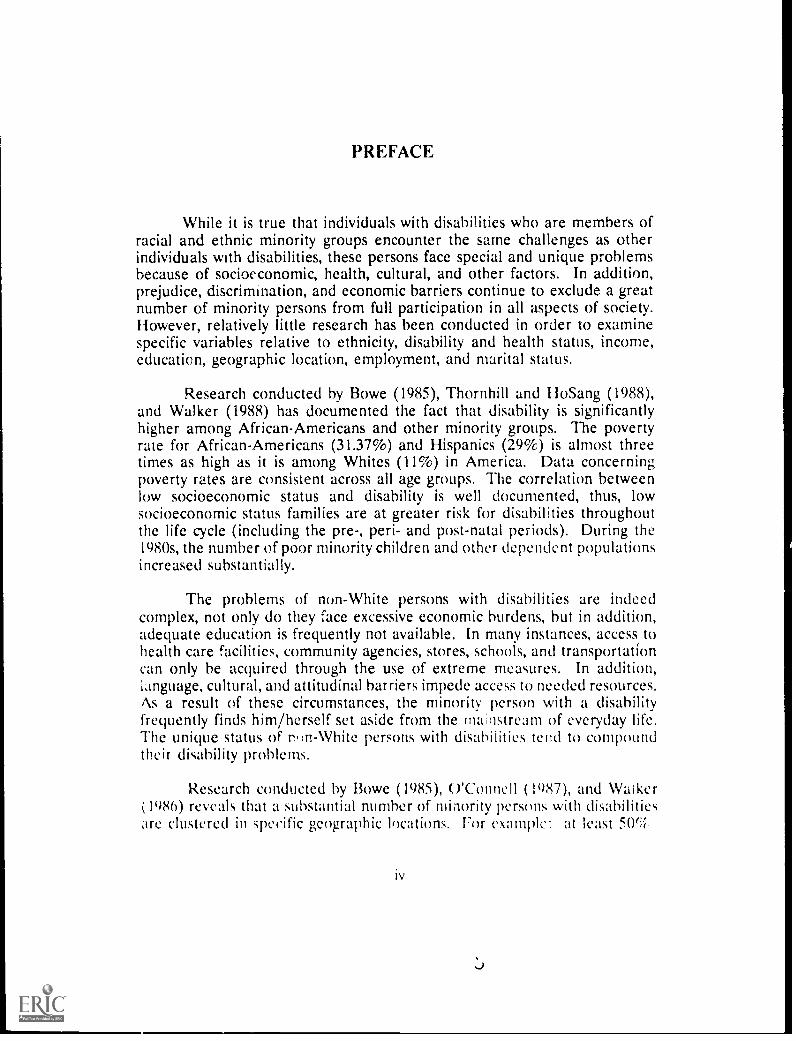
PREFACE
While it is true that individuals with disabilities who are members ofracial and ethnic minority groups encounter the sarne challenges as otherindividuals with disabilities, these persons face special and unique problemsbecause of socioeconomic, health, cultural, and other factors. In addition,prejudice, discrimination, and economic barriers continue to exclude a greatnumber of minority persons from full participation in all aspects of society.However, relatively little research has been conducted in order to examinespecific variables relative to ethnicity, disability and health status, income,education, geographic location, employment, and marital status.
Research conducted by Bowe (1985), Thornhill and Ho Sang (1988),and Walker (1988) has documented the fact that disability is significantlyhigher among African-Americans and other minority groups. The povertyrate for African-Americans (31.37%) and Hispanics (29%) is almost threetimes as high as it is among Whites (11%) in America. Data concerningpoverty rates are consistent across all age groups. The correlation betweenlow socioeconomic status and disability is well documented, thus, lowsocioeconomic status families are at greater risk for disabilities throughoutthe life cycle (including the pre-, peri- and post-natal periods). During the1980s, the number of poor minority children and other dependent populationsincreased substantially.
The problems of non-White persons with disabilities are indeedcomplex, not only do they face excessive economic burdens, but in addition,adequate education is frequently not available. In many instances, access tohealth care facilities, community agencies, stores, schools, and transportationcan only be acquired through the use of extreme measures. In addition,language, cultural, and attitudinal barriers impede access to needed resources.As a result of these circumstances, the minority person with a disabilityfrequently finds him/herself set aside from the mainstream of everyday life.The unique status of n.m-White persons with disabilities terid to compoundtheir disability proNents.
Research conducted by Bowe (1985), O'Connell (1987), and Waiker(1986) reveals that a substantial number of minority persons with disabilitiesare clustered in specific geographic locations. For example.: at least 5(Kfc
iv

of all African-Americans Ave in the south, 40% of Hispanics reside in thewest and southwestern regions of the United States, whereas, approximately46% of the American Indian population live on reservations. Geographicdistribution and available resources have significant implications relative tothe provision of health care, special education, rehabilitation, and relatedservices. The current study examines the status of ethnic/racial minoritypersons in four disability categories (chronic health conditions; physical,sensory, and language impairments; and mental and nervous disorders) froma number of perspectives.
Following the exploration of a number of reference variables(including gender, age, education, family income, marital status, einployment,and geographic region), the study concludes with a discussion of severalpolicy implications. As we approach the end of the 20th Century, peoplewith disabilities (including those who are members of minority groups) :tskfor the opportunity to be recognized as human beings who have the capacityto love, to share, to create, to work, to live fruitful lives, and to contribute tosociety. The challenge for America is to provide the environment for allpersons with disabilities to do so. The passage of the Americans withDisabilities Act, and the development and implementation of appropriate,relevant, and creative approaches to rehabilitation are good foundations forAmerica's success as we approach the 21st Century.
This report is founded on the principle that all individuals can benefitfrom the implementation of relevant research and appropriately designedspecial education, rehabilitation and related services (no matter where theyreside, their ethnic identity or the severity of their disability and/or economicstatus).
Sylvia Walker, Ed.D.

ACKNOWLEDGEMENTS
The authors would like to extend their warmest and sincereappreciation to those who have contributed to the completionof this report. Special thanks are given to Ms. Marilyn Miles,Ms. Lydia Mac Intosh, Mr. Robert Nicholls, Ms. PatriciaDavid, Ms. Anntoinette McFadden, Mrs. Ada Vincent, and Ms.Carolyn DeLoach. We are especially appreciative of thesupport which we have ieceived from the Department ofSociology at Howard University, the Division of Biostatistics,College of Medicine at Howard University, the NationalInstitute on Disability and Rehabilitation Research, theNational Center for Health Statistics, and the NationalAdvisory Committee or the Howard University Research andTraining Center.
lids publication is detlicttedto the memory of
Dr. Milton Wilson, Jr,of Xenia, Ohio
Disability Prevak nce and DemographicAssociation Among Race/ethnicMinority Populations in the U.S.:Implications for the 21st Century
Charles A. Asbury, Sylvia Walker,Valerie Maholmes, Reginald Rackley, and Sterling White,
Howard University
INTRODUCTION
There are over 40 million persons with disabilities residing in the
United States. Accordingly, one in every six American has some type of
disability. Despite the outpouring of literature reflectinF the disability status
of individuals in this society, there is a dearth of empirically based evidence
concerning the prevalence and distribution of disability among ethnic minority
populations. A critical issue to he dealt with by policy makers is the
documentation of comprehensive. unbiased studies of specific types of
Usability among ethnic minority groups in proportion to their representation
in the population. There is general consensus based on available global
evidence which suggests that disability rates laye escalated more in the
minority than in the non-minoritv population (Anderson, l988; Bcwe, 1)85;
lopkins, IWM: Thornhill & Torres, NM). In thr report, the term ethnic
minwity populations includes African-Americans, Ilispanic.Am(.ricans, and
ito' comhin, tialh...v and Amer icaw, dm) a k:alcrory cHlcd "othcr.

The specific pes of disability were chronic deblitating health conditions;
physical, sensory, and language impairments; mental disorders; and disc ders
of the nervous system.
Several factors have been suggested as contributing to higher disHbility
rates within minority populations. Among these are poor prenatal and
perinatal core, nutrition and diet, an inaccesible health care system, greater
risk for physical injury in terms of living conditions and types of employment
situation*, and finally, a lack of proper health care knowledge and education.
It is needless to say that a complet.; and comprehensive examination of the
major variables related to disabiEty among ethnic minority populations will
probably show thai the foregoing variables and other intluential factors have
all come to bear on the plight of these target groups. In particular these
factors have played a significant role in contributing to the prevalence and
impact of disability among ethnic minority groups.
Given the urgency of acquiring sufficient data to address the nature
and extent of the problem, it would appear to he fruitful to specify who are
the disabled, how many persons with disabilities we have, and ow these
individuals arc :sittiat,:d and embroidered into the lare,er social fabric ot
,ocietv. Thus, this initial attempt to study the prevalence and distribution of
disability anione ethnic minority populations is a critical start.), point in

developing initiatives geared to finding solutions to the challenges faced by
people with disabilities. Furthermore, this effort is important in laying the
groundwork for more systematic and vigorous testing of innovative and
culturally viable approaches, perspectives, and strategies relevant to the needs
of the minority populations.
RE:VIEW OF RELATED LITERATURE
Several investigators have reported that conventional types of disability
are approacl ing alarmingly high rates, and current estimates suggest that the
distribution of disability in minority populations far exc.eeds that of the non-
minority population (Anderson, l98ty, Hopkins, l)8S., Thornhill St:
1986-, Walker, 1988).
African-Americans represent a large segment of the disabled
population in America. More ecifically, African-Americans between the
ages of 16-64 constitute a proportionately larger segment of the disaNed
population than any (ither ethnic group in the country. Moreover, one Out
ot every seven African-Americans reports haying a work disability. Of this
workivage African-American wome;' with disabilities comprise
'3.o.) percent the popuhtion \Ode Ahic;in-AmLrican males const ;ite 10.1
iterient M(Re,
Vorr

It is essential to note that the Hispanic-American population is the
fastest growing segment of the disabled working-age c thnic minority
population. According to Bowe (1985b), one Out of 20 persons between the
ages of 16 and 64 in the general population is I lispanic-Arnerican and one
out of 12 Hispanic-Americans has been rep,:rted as having a work disabilit:'.
The prevalence of chronic disability related illnesses and conditions is
higher among African-Americans than other ethnic groups (Thornhill &
HoSang 1988; Thornhill & Torres, 1986). For instance, it has been reported
that (in New York City which has a high number of African-Americans and
other minority groups) the incidence of new cases of tuberculosis in 1986 was
130.4 per 100,000 in the population, the premature birth rate was 20.5 percent
of live births, and the death rate for 12 out of (3 common causes of death
was the highest in the Nation in the Borough of Manhattan in New York
City. These 1iealth related statistics have profound implications for such
disability related issues as excess prevalence, expensive rehabilitation, and a
squandering of human potential (Thornhill & I loSang, 1988).
In both public and private agencies, the percentage of persor.s with
physical, sensor y and language impairments (i.e,, amputee, blindness, hearing
im) ainnent, ortliopedic impainnent, speech impairment, and visual
impairment) ritiong African-Americans is two and sometitnes three times thc
4

proportion for the other remaining ethnic minorities. Specifically, according
to Walker, Akpati, Roberts, Palmer, and Newsome (1986), African-Americans
had the highest prevalence rates among all ethnic minority populations across
certain geographic regions (i.e., South, Northeast, Mid-Atlantic) for particular
physical, sensory and language impairments (i.e., blindness, visual impairment,
orthopedic impairment, and amputee). Moreover, African-Americans also
.iad the highest prevalence rates in the Midwest geographic region for all
physical, sensory and langu'lge impairments except visual impairment. The
exception in this reg, on applies to Ilispanic-Amt leans who had a slightly
higher prevalence rate for visual impairment than African-Americans. In the
West geographic region, I I ispanic-Americans had the highest prevalence rates
for all physical, sensory and language impairments except blindness.
It has been speculated that physical impairment is often perpetuated
as 'yell as aggravated by poverty (Thornhill & I losang, 1988). Given this
assumption, most ethnic minority persons with a disability are at high risk
given that a larger percentage of this population fall at or below the poverty
level. In Central flarlem in New York City, the most prevalent impairments
observed by the I Iarlem I lospital Center were various types of
musculoskeletal disorders. So ne examples of the musculoskeletal
impairments reported by 1h I farlem I lospital ('enter were fraetnres and a
)

large percentage of amputees. According to Thornhill and I loSang (1988),
the most prevalent causes of these types of impairments were trauma (31%),
and various types of arthritis (10%). Additionally, 6.8% of the ethnic
minority patients treated at the Harlem Hospital Center indicated a direct
connection between their disability and substance abuse involvement.
An examination of mental health status among ethnic minority
populations revealed that I lispanic-Americans had the highest prevalence of
mental disorders and experienced a higher incidence of major psychiatric
disorders than the general population (Acosta, 1977). It was also revealed
that although I lispanic-Americans were diagnosed as schizophrenic less than
African-Amcricans, the incidence of affective disorders and "other psychoses"
were more prevalent among Hispanic-Americans (Adams, Dworkin, &
Rosenberg, 1984). This report has been supported by Jones, Gray and Parson
(1983), who stated that I lispanic-American patients had a manic-depressive
illness rate three times higher than the national admission rate. However, the
Adams, Dworkin and Rosenberg (1984) study conflicted with that of other
investigators who have reported that African-Americans encounter rni ic-
depressive illness at a rate four times higher than the national average (Jones,
Gray & Parson, 1981). In addition, AfricanAinericans have a Iiiher
prevalence of schi/ophrenia (Adebimpe, 1981: Mukhcircc,

Shukla, Wood le, Rosen, & Olarte, 1983); have higher manic-depression illness
rates, and higher depression scores (Jones, Gray, & Parsons, 1981; Torks,
Paykel, & Klerman, 1970; Warheit, Holzer, & Schwab, 1973) than other racial
groups. 'These reports are questionable in that it has also been revealed that
African-Americans and Hispanic-Americans are more frequently misdiagnosed
and inappropriately treated than European-Americans (Jones, & Gray, 1986).
It has also been found that the prevalence of particular types of
nervous disorders varies considerably from one racial and ethnic group to
another. Along racial lines, African-Americans had higher age adjusted
prevalence ratios for cerebral palsy, epilepsy, stroke, and dementia than other
racial groups. In addition, more African-Americans with a functional
disability experienced persistent afebrile seizures than other ethnic ,rotips
with a functional disability. Nevertheless, proportionately more persons 1% ho
were menwers of other racial/ethnic groups and who also had a functional
disability were more often institutionalized than African-Americans (I laerer,
Anderson, & Schoenberg, 1984. 1986a, 1986h).
Not only have general attempts been made to improve the
rehabilitation of ethnic nlinoritv populations, but specific attempts have also
been made to t:trget particular ethnic groups for special programs (Ruiz,
1)81; Walker, 1988). Sink e this literature ro iew has focused rimarily or
7

African-Americans and Hispanics with disabilities, those interested in specific
information regarding the needs of Pacific Islanders, Native Americans, and
other ethnic groups with disabilities are directed to the research conducted
by Bielecki and Jones (1986), Cummings, Huntley, Kelly and Varney (1986),
Hodge (1990), Lonetree (1990), Morgan and O'Connell (1987), O'Connell
(1987), and the U.S. Bureau of the Census (1985). There is a definite need
for research which provides increased information about Asian-Americans and
other underrepresented groups.
Given that the data accumulated thus far is relatively sparse, irirther
research is needed in order to provide a more global analysis of the
prevalence and distribution of disability among all minority populations.
THE PROBLEM
The purpose of this study is to determine the prevalence of disability
and the association between race/ethnicity and other characteristics among
selected race/ethnic ni;nol ity groups who have such disability. More
specifically, this is an attempt to discover who and where these individuals
are, what disabilities they have, and to examine the demographic
characreristics t. these persons. in this report the term "disability" is used
broadly to refer to i.1) chrtwic health cHndititm, (2.) physical, selp-imv and
it

language impairments which hinder or jute: fere with normal or usual
functioning, (3) mental disorders, and (4) nervous system disorders.
Objective:: of the Study
The objectives of this study are as follows:
1. To gather prevalence data on disability rates among majorrace/ethnic groups in the United States including African-Americans, Hispanic-Americans, Native-Americans, Asian-Americans, and Pac:ific Islanders.
to gather prevalence information relative to various kinds ofdemographic distribution for selected types of disabilities amongrace/ethnic minority groups in the United States.
3. To document the extent of association between r ,ce/ethnicitvand selected demographic variables within each 1 f four typesof disability category groupings.
Research Questions
In this investigation Ow conceptual framework was operationalited
translating the objectives into the following research questions:
What are the specific disability rates among racc/etHicminority populations compared to Whites?
What are the specific disability rates for race/ethnic groups(including Whites) according to geographic region (Northeast,East, North ('entral, South, West)?
\Vhat are the specific disability rates for differCnt types otdisability among race/ethnic minority groups in the I. initedStates.
\Vhat are the relati)nship', among thc specifik: pes of disabilit,.and demorjaphic charact,'ristics such as agc,

sex, marital status, education, employment and geographiclocation?
Definition of Terms
Disability: A general term which, in this study, refers to any long- or short-term reduction of a person's activity or function as a result of acute orchronic physical or mental limitation.
Prevalence: The extent and general widespread existence of a single healthcondition or class of conditions which are known to be disabling or tocontribute to the eventual development of a disability.
Distribution: Allocation of and accounting for the occurrence of disability onthe basis of categori-al subdivision and stratification, (i.e. the frequency ofoccurrence in a designated area, class, or level).
Age: Age at last birthday.
(Thronic Conditions: Conditions that either a) were first noticed three monthsor more before the reference date of the interview, h) belong to a group ofconditions that are considered chi onic regardless of when they began or, c)are the type of conditions that obviously have a duration of more than threemonths.
Physical Sensory and I..anguage Impairments: A chwnic or permanentcondition, usually static in nature, that results from disease, injury, orcongenital malformation. It represents all absence, decrease in or loss ofability to perform various functions, particularly those of the musculoskeletalsystem and the sense organs.
Mental Disorders: A clinically signifiL Ant behavioral or psychologicalsyndrome typically a. sociated with distress or impairment of function. Themental disorders selected for inclusion in the present study are schizophrenia,affective psychosis, and "other" psychoses.
Schizophrenia: A mental disorder in which a deterioritior from a previouslevel of functioning is ohservcd. This condition is not due to an affective rnnervous disorder and onset is prior to age 35 with patients often reportinr,
hlltwinntions, or thought disturbance.

Affective Psychosis: A disorder characterized by a disturbance of mood,accompanied by a full or partial manic or depressive syndrome that is notcaused by any other physical or mental disorder.
"Othr:r" Psychoses: In the present study, this category includes Alzheimer'sDisease, senile dementia, involutional melancholia, and pure paranoia.
Nervous Disorders: Pathological chronic degenerative conditions originatingin the central nervous system. This study focused on the following nervousdisorders: mental retardation, epilepsy, cerebral palsy, Parkinson's Disease,multiple sclerosis, and "other" disorders.
Race: Racial classification is based on the respondent's description of his/herracial or ethnic background. For the purpose of this study, the population isdivided into four groups, "White", "African-American", "Ilispanic-Arnerican",and "other." "Other" includes American Indians, Asians, and Pacific Islanders.
Family _Income: The total of all income received by the respondent'shousehold during the 12-month period preceding the week of the interview.Income from all sources (wages, salaries, rents from properties, pensions, andhelp from relatives) are included.
.Employment Stitnis: Employment status is divided into three categories: notin labor force," "employed," and "unempl(iyed." Employment includes paid,,kork as an employee of someone else, self-employment in business, farming,or professional practice, and unpaid work in a family business or farm.Respondents not in the labor force are those who are a) receiving revenuefrom an enterprise, but not participating in its operaLon, b) doing houseworkor charity work for which they receive no pay, c) seasonal workers during theportion of the year they were not working, and d) not working, even thoughthey have a job or business but are on layoff. Unemployed respondents werethose not receivinL, income from sources listed previously under "employed."
Marital Status: Respondents were grouped into six categories of maritalstatus: I) married-spouse in household, 2) married-spouse not in household.3) widowed, 4) (livorced, .'",) separated, and () never married.
CwoLraphic 1 lie states under study were ir..rouped H hhitIhey are Northeast, Midwe',!, South, and \Vest.

Northeast: Maine, Vermont, New Hamps10-a, Massachusetts,Connecticut, Rhode Island, New York, New Jersey, and Pennsylvania,
Midwest: Ohio, Illinois, Indiana, Michigan, Wisconsin, Minnesota,Iowa, Missouri, North Dakota, South Dakota, Kansas, and Nebraska.
South: Delaware, Maryland, District of Columbia, West Virginia,Virginia, Kentucky, Tennessee, North Carolina, South Carolina,Georgia, Florida, Alabama, Mississippi, Louisiana, Oklahoma,Arkansas, and Texas.
West: Washington, Oregon, California, Nevada, New Mexico, Arizona,Idaho, titah, Colorado, Montana, WyomingAlaska, and I
C riteria for Variable Selection
In th:s investigation, the term "disability" was operationalized using (1)
chronic debilitating health conditions, (2) physical, sens( r\' and language
impairments which hinder or i erfere with "normal" or usual functioning, (3)
mental disorde N, and (4) nervous .,ysteni disorders. This was further iefined
lw selecting ,Ind including specific conditions, impairments, mental disorders,
and ncryous system disorders.
'Fhe criteri't for selection of conditions and impairments were as
follows:
Chronic ('ondition A health condition was included if it was chronic and its
ad\ erse effeo (H1 il(11.111di f1.11101(111 was generally presumed to he progreive
I ' II it a )11 1111H ,iko have a hiHi nddcnco
he ih caueaoly \olele 71
,., 1,,

persons having the condition are required to see a physician on a regular
basis.
Impairment - This category was based on the criterion that the existence of
the impairment must he behaviorally apparent when elicited or otherwise
observed, although not necessa ily degenerative to the point of requiring
regular care by a physician. There must also be a relatively incidence
of occurrence of the impairment in at least one or more ethnic subgroups to
the point of restricting or impeding activity on an average of 18 days per year.
All demographic variables were included primarily on the basis of their
relevance to the objectives of the study and the research questions as stated.
Variable Types
In this study, there are two sets of variables. The first set was labelled,
"Focal Group Variables," and the second was called "Reference Variables.
The focal gro ) variables were chronic health conditions, impairments,
mental disorders, and nervous disorders. The reference variables were age,
sex, income, education, employment, marital status, geographic rei.i.ion, and
race/ethnicity.
The focal group variables were tarthei sub-divided to include se\ en
types of chronic debilitating health conditions: heart dkease, ccrehrovasculir
disease, re)iratory dkcrderirthritk, in:Hvertebral di ,c diyudep,,
1 3

and high blood pressure; six types of physical, sensory and language
impairments: hearing, orthopedic, visual, paralysis, absence of extremities and
speech disorder; three types of mental disorders: schizophrenia, affective
psychosis and "other" psychoses (which included senile and presenile organic
psychosis); and six types of n disorders: mental retardation, cerebral
palsy, Parkinson's disease, epilepsy, multiple sclerosis, and other degenerative
and hereditary disorders of the central nervous system.
The reference variables were also further sub-divided to include
different categories (levels and ranges) for particular variabks. For example,
the range for "age" is from under six years to 75 years and over. The range
for the variable "income" is from under $5,000 per year through S50,000 or
more per year. Marita: status includes the categories married, spouse at
home; married, spouse not at home; widowed; divorced; separated; and never
married. Employment was divided into those current]. "employed,"
"unemployed," and "not in labor force." Race/ethnicity was categorized as
White. African-;.merican, I lispanic-American and "other," while sex w;ts
divided into male and female.
1 4

DESIGN AND METHODOLOGY
The primary data source was the National Health Intervi. y Survey
(NHIS) used to generate information for the National Center for Health
Statistics. This information covers a broad range of demographic and health
factors. Essentially, the sampling procedure was multi-stage and based on
primary sampling units selected in such a way as to insure accurate
representativeness.
Sample
The san ;fle for this study was comprised of '1_2,859 peisons who had
been interviewed from 49,569 households in 1987. The target population for
NIIIS was the resident, civilian noninstitutionaliied population residing in all
50 states and the District ot Columbia.
Pescription of the Instrument and Procedures Used in Collecting_ tmdProcessing the Data
The NI1IS questionnaire contains two major parts. The first consists
of topics that remain relatively the same from year to %.ar. Among these
topics are th incidence of acute conditions, the prevalen, c of chronic health
coi ;idol's, restrictions in activity due to inlpairme!li or IR:alth problems, and
utilization of health c;uc services involving physician care and short.stiv
hospitalilation. The second p;,t specHl Uyik added as
.,uppli...nicins each vein's oil,stionnwie.

Careful procedures were followed by the National Center to assure the
quality of data collection in the interview. Data were collected on a weekly
basis. Most hotieholds in the sample had been contacted hy mail befoi e the
interviewers arrived. II:tential respondents were informed of the importance
of the survey and assurA that all information obtained in the interview would
be held in strict confidence. Interviewers made repeated trips to a household
when a respondent was not immediately folnd.
Field operations for the survey were conducted by the U.S. P:ireau of
the Census which pa ticipates in the survey planning, se scts the sample and
condiicts the interviews. Completed ques onnaires were sent from the U.S.
Bureau of the Census field offices to NCIIS for coding, editing, and analysis.
To ensure the accuracy of coding, a five-percent sample of all questionnaires
were recorded and keyed by other coders. A 100-percent verification
procedure was used if certain error tolerances were exceeded. Staff of the
Division of Health Interview Statistics then Ld;*.ed the files to remo.'e
impossible and inconsistent codes,
Reliability and Types of Estimates
Because NI IIS estimates are bascd on a sample, they may &tier
sohiewhat trom the figures that would have been obtained if a complete
Censu, 11,:! been taken using !Ile same sInvey processhw procedures. To t He

extent possible, sampling and ni.m-sampqng errors were kept to a minimum
by methods built into the survey procedures. Although it is very difficult to
measure the extent of bias in the NIIIS, a number of studies have been
conducted to examine this problem. The results have been published in
several reports.
As noted, the sample represented the resident, civilian noninstitutiona-
lizcd population of the U-ited States.: It should be pointed out that the
sample did not include persons residing in nursing homes, memb 1-s of the
armed forces, institutionalized persons, or U.S. nationals living abroad. As
data were collected, the samples were consolidated to produce quarterly files
(each consisting of data for 13 weeks). Weights to adjust the data to
represent the I J.S. population were assigned to each of the four quarterly
files, These quarterly files were later consolidated to produce the annual file,
which is the basis of most tabulations of NI US data.
San] i niLtrror
The (liar :es are about 68 out of MO that an estimate f,orn the sample
would dift r from a complete Census estimate by less than the standard error.
Individual standard errors were not computed I )1- each estimate in this report.
Instead, standard errors were computed for a broad spectrum of estimates,
Regrs.ssion techniques were the,i applied to produce equak;ons from which a
"I 7

standard error for any estimate can be approximated. The nature of the
sampling plan made it necessary to use special weights in the data processing
and statistical analyses. These weights were provided by the National Center
for Health Statistics as an essential part of the documentation.
RESULTS
Pr!valence Description
.chropic_Health Conditions.
Sex. The percentage who are female in the population with chronic
health conditions (58%) is far in excess of the percentage for male (42c/t ).
Within this group, the disparity between the percentage of African-American
males and females is even more pt,>nounced with 36.4cIr and n3.61,7i.:
respectively. This is the largest male/fenlale percentage difference among the
four racial and ethnic gr,Aips and strongly suggests that African-American
f. males are more at risk for these conditions than any other minority sub-
group.
Al:se, The age intervals with the largest percentages of persons with
chroni health conditions are 65-74 (23.5c; ), 55-64 (22.1(,(), over 74 (l6.4f:(
and 4.`.54 (12.W" ). This .hov,s a slight tendency for the existence of
cullditions 0) lw !-,i)mewhat related to incrcasinr arc. rsocc:;!lly stiikinr is the
1 a

observation that at younger age levels in the chronic conditions groups,
Whites are underrepresented in proportion to their number in :he population
while Hispanics and African-Americans are overrepresented. This trend is
observed until old age (65 and over) when the proportion of Whites with
chronic health conditions exceeds the proportion of others in the population
and the proportion of African-Americans and Hispanics becomes less than
their population proportion. The general trend for all sub-groups appears to
be, however, that the frequency of chronic health conditions increases with
age until about the time of retirement from the work force.
Education. The chronic hea'th conditions population shows two
characteristic bulges. These occur at the one-eight years of schooling
category (25.30/c) where most of the persons presently attending school are
located, and again at the 12 years of schooling category (32.7%) where most
of the persons who are no longer attending school are located. There is a
tendency for Whites to have more education than either African Americans
or I Iispanics.
Fam Proportionately more Whites and fewer African-
Americans and Hispanics were located at the upper family income levels.
The opposite was true at the lower income levels with proportionately fewer
Whites and more of the oth,..r ethnic groups. It is of particular interest also
1 9

that the median family income for Whites was approximately $19,000 per
year, for African-Americans $10,000 per year, and for Hispanics $13,000 per
year. For the total group of persons with chronic health conditions, the
median was approximately $17,500 per year. Proportionately more African-
Americans and I lispanics appeared to be on some type of public assistance
or to be employed in low paying jobs.
Marital Status. Almost 60',T4-. of person; with a chronic health
condition were married. Almost 21% were widowed, and it was especially
interesting that a larger percentage had never been married (8.8%) than were
divorced (7.714 Although the percentage of African-Americans who were
married (44.(ci) was much smaller than the percentage of Whites who were
married (62.3% ). the percentage of African-Americans and I lispanies who
were either separated or had never been married was far in excess of the
percentage for Whites in either of these categories. Over half of all persons
with chronic health conditions were married Whites , ith the spouse living in
the household. The next largest category was widowed Whites.
Fruloyment Almost 66c/c of the chronic conditions persons were not
,n the labor force. This includes approximately 401( who v.ere at or past
retiret ent u and over who had not re.ached the legal age for
inplov!ment. I has, it appears reasorktHe P0 eonJude that at le;ist :of of the
20

chronic conditions population were probably unable to work. The proportion
of African-Americans who were not in the labor force (68.4%) was slightly
higher than it was for the other groups. The unemployment rate was highest.
however, for Hispanics than for any other group.
Geogawhic Region, The south leads the other geographic regions in
the proportion of the chronic conditions population (37.2%). It is especially
noteworthy that over 54% of all African-Americans with chronic health
conditions reside in the south. This contrasts with 35.2% of Whites with
chronic conditions in the south, and 31.3% of Hispanics wilh cLronic
conditions who reside the south. (. onsidering the preponderance of
Hispanics in the west and African-Americans in the south, the geographic
distribution of chronic coht!itions tends to reflect the distribution of the larger
population.
l'hyAcalt Sensory, and Lanvage Impairments
Sex. The percentage of the physical, se nsiir and language
Unpairments population who were female was 47.4C; . The percentage who
were male was 52.61( . This contrasts with the chronic conditions population
where the percentage of females was far in excess of the percentage for
IIMIes. Across all :Ind el hnic sub-groups, the peicernage of males and
iernalcs was almost c,..eak divided and there did not .,eeni to he any
2 1

systematic relationship bctween physical impairments and gender.
Ave. The age intervals with the largest percentages of the physical,
sensory and language impairments population are 35-44 (16.1%), 25-34
(15.2%), 55-64 (15.7%), and 65-74 (14%). Over 60% of the impairments
population is between the ages of 24 and 74. Furthermore, more than two-
thirds of impaired persons are working age. The proportion of persons with
physical, sensory, and lant4uage impairment tends to be lower at the younger
age levels and to increase with age up to about 35-44. It then drops slightly
and remains stable until after the age of 74.
I lispanics tend to have a higher proportion of physically, sensory, and
language impaired persons at the 25-34 age range while African-Americans
have their highest percentage at the 45-54 age range. Among Whites, the
percentages are about evenly dispersed across the ranges of 25-34, 35-44, 55-
64 and 65-74. For sonic obscure reason there is a drop among Whites at the
45-54 age range. This may he a reflection of the fact that, among Whites at
least, proportionatelx, fewer children were born during the years 1932 to 1942.
The increase in the percentage of persons with impairments commensurate
with increase in age shtms some interesting discrepancies. For example,
among Whites and I lispailles the increase tends to peak at the ago 25-31
,Nmong per,ons age aid older, there Wi'.s a much higher plopoition who

were White than were African-AmericanH Hispanics or "Other." This is
probably a direct result of better health care and greater longevity among
Whites in comparison to the other race/ethnic subgroups.
Education. The two characteristic bulges are again seen at the 1-8
years of schooling category (19.4%) and the 12 years of schooling category
(33.4%). The percentage at the 1-8 year level is much lower than it is for the
chronic conditions population. By far, the largest single category according
to race/ethnicity and amount of education is seen f( Whites with '2 years
of schooling (28.8c. ). Although the college graduate group is only 7.2% of
the total impairment poi Jlation, it is interesting that 90% of this gronp is
White and only 4('''( is African-American. African-Americans with physical,
sensory and language impairments are much les: likely than their White
counterparts to have the benefits of a college education. To some extent, this
is also true of ilispanics. There is a tendency for minority persons inure so
than Whites to he concentral d at the lower end of the educational spectrum
and for proportionately more Whites to he at the upper end.
1 amity jric.Qtrie. The proportion of White persons with
impairments at various income levels tends to incrtsise cOmmcnsumte with
the increase in amount of money. Among African-Americans this tendency
is n:versed with corresponding reductions in the proportions as Vs.,V IO 1,1p

through the income levels, There is also an unusually largo bulge for
African-Americans at the under $5,000 income level. This evidence suggests
that physical, sensory, and language impaired African-Americans are less well
off economically than their counterparts in other racial/ethnic groups. The
overall median family income for all impaired persons was $20,000. The
median for Whites was $22,050, for African-Americans $10,800, and for
I lispanics $16,500.
Proportionately fewer impaired African-Americans
with impairments were married than was seen for any other racial/ethnic
group. On the othcr hand, African-Americans had a higher proportion of
persons who had been widowed. African-Americans and I lispanws had the
highest percentage of "never married" persons. It may be significant that
among persons with impairments as a group, the percentage who had never
married (14 .2(7i as larger than the percentage widowed (13.5%). The
majority of the population with impairments was married with the spouse
living in the hotiseliold (60.2(4 ). African-Americans comprised the largest
percentage of the "separated" group (38.4'lt ) far out of proportion to their
numbers in the general population and in the population of persons with
impairments.

Frnployinent. Approximately 51(.7( of the population of persons with
phyiul, sensory, and language impairments were not in the labor force. This
was considerably lower than the percentage of the population of persons with
chronic health conditions (..(( )q). The percentage not in the labor force may
he taken to include approximately 6% who were helow the legal age for
employment and another 27% who were past the age of retirement. It is
noteworthy that this leaves only 181i. in the not in the labor force" group
after the other two type s. are accounted for. This net (not in the labor force)
is very clee to that which is found in the e ronic conditions population. The
percentage of Whites employed (47.3r,i() was cry close to the percentage of
Whites not in the labor for,:e (4o) 8(74 This wU.s not true for African-
Americans, however, where the percentage not in the labor force (64.( C; ) was
far in excess of the percentage employed (3 ). The unemployment rate
was, as in the case of the chronic conditions population, higher for I L panics
than for any other group.
rezion. l'he south again takes the lezidership in its
proportion ) of the total population of impaired persons. The la:-gest
percentage of Whites with impairments was `,CCI1 in the south (32.6 "( ww,
the l'arge.1 percentage ot Air ican-Americans iili impairr1ent..1,53.2r; ). The
largest percentai,c of I I i,p;riic, \kith inipiirinciit. t01 !he we.,t

(40.6c,). A high proportion of (60.1%) of minorities with disabilities in the
other category (American Indians, Asian Americans, and Pacific Islanders)
also resided in the Western Region. Generally, Hispanics and African-
Americans tended to be overrepresented in the southern and western
geographic regions. This may be a reflection of the distribution of the larger
population.
YferitAl Oisorciers
.Scx. Fifty-two percent of the mental disorders population was female
compared with 4S(...1( male. Some interesting comparisons emerged, however,
when ethnic groups were compared with eaL h other. For example, among
Whites 45% were male and 55% were female, whereas this trend was
reversed among African-Americans where 60 tc were males and only 40%
were females. Clearly there was a tendency for more males than females to
suffer with a mental disorder in the African-American group. This tendency
was also observed for the "Other" group as well. Generally speaking, there
is a clear tendency for White females to experience riieritul dkorder more
often than White males, hut for this tendency to be just the reverse arnom.
African Americans, I lispanics, and other minority groups. It should ako he
noted that the percentage of Whites with :1 mental disorder is below their
pmpm-tion in the larger population while the perct.ntage ot African-

Americans with a mental disorder is slightly in excess of their proportion in
the population.
Ax4. The age intervals with the largest percentage of persons with
mental disorders were 24-34 (23.1%) and 35-44 (24.9%). Seventy-six percent
of the mental disorders population were White and 14.5% were African-
American, showing a tendency for Whites to be underrepresented and
African-Americans to be slightly overrepresented n proportion to their
numbers in the total population. Among Ilispanics. the largest percentage of
persons with mental disorders was observed for the 17-24 age group (36.4%).
Among African-Americans, the largest percentage was seen in the 25-34 age
group (32. %) and among Whites, the largest percentage was observed for
the age group 35-44 (29.5c;:.). An important finding is the fact that the
percentage of persons with mental disorders appears to stabilize at about 8q.
after age 54. More specifically, the stabilization was observed at the age
range 55-64 (8.2°4 ), 65-74 *Mt( ), and over 74 (8.6%).
Educmion. Two characteristic bulges in the proportion of persons
distributed across the educational spectrum were again seen in the mental
disorders population. As with other types of disability, these were observed
for the 1-8 years of schooling level (14.4%) and the 12 years of schooling
group. The proport,..mal distribution of the four rak ial/ethnic groups more
2 7

nearly approximates the general population at the 12 years of schooling and
the college levels. There were considerably more Hispanics at the lower
educational levels and considerably fewer at the higher levels.
Family ingpme. There are proportionately more pen )ns at the
under $5,000 (20.9%) and $25,000 - 34,999 (19.5%) income levels than at
any place else along the family income distribution. Among Whites with
mental disorders, the largest income distribution was seen for the ilicome
category of $25,000 34,999 (22.6%). Among African-Americans with mental
disorders the largest percentage was syen at the family income levels of
$10000 14,990 (23.9%), The median family income for the total population
of persons with mental disorders was $14,120. The median for Whites was
$16,600, for African-Americans $10,500ind for Hispanics $13,500,
Marital status. The overwhelming majority of the population with
mental disorders had never been married (40q). This percentage was
followed by persons married with the spouse in the household (2K1%). The
percentage divorced (14 4(;,; ) was slightly higher than the percentage widowed
(13.4%).
Emplilyment. Over 7tV.; of the population with mental disorders was
noi in the labor force and only 21(.; were employLd. This underscorc, the
devastatitT impaet of mental illnes; or society. Among those who werc

employed the overwhelming majority (84.72' ) were Whites, ..mtrasted with
4% African-Americans and 7.8% Hispanics.
Geographic region. Unlike other types of disabiuty. the south does not
lead in the percentage of persons with a mental (1 .(,rder. The midwest had
the highest proportion of persons with mental disoiders ($2.4(:), whereas the
sonth ranked second with 30.8% Of persons in this category. The weq had
the lowest percentage (15.4%) of perstns with a mental di.order. Amom.
Whites and African-AmerLans, the largest proportions were in the south aad
midwest while for I lispanics He largest proportirms were in !he wcst and the
northeast.
.Neryo.us Diso.rders
Sex. In the population of persons with diso, ders of the nervous
systeut 53% were male and 47% were female. Thus, ftese llisorders are
slightly more prevalent among males than females. Among Whites and
I lispanic,;, nervous disorders were more evenly distributed by sex than fm
Afrf an-Americans where the percentage of males was ncr, compared to
40(:,. female. As with sonic other types of disability such as paralysis, speech
disorders, and orthopedic impail ment, it appears that African-American males
ate more susceptible than African-American females. Moreover. the African,
American representaliwi H Hs Thtln ) exc,;ed,, pmiu)rtim1 ill

the ?re,:eral population (,f the United States. In the group labeled "Other,"
however, females appeared to be more at risk (60.1%) for disorders of the
nervous system.
Az.e. The seirrh est percentage of persons with disorckrs of the
ner ius system was observed for the age group mider 6 years (2 .%). The
largest percentage was seen for the age 6-16 (22.1%). Percentages were
approximately the same and about equally distributed leross the other age
intervals. African-Americans are overrepresented in proportion to their
number in the general p yulation at every interval until the age of 65 when,
possibly due to early demise, they begin to he underrepresented.
Uducation. Once again, the 1:rgest percentage of the total
populatin of perso within this disability category s seen at the levels of
1-8 years of school age (35(;. ) and 12 years of schooling (22.)r/(). These
bulges are prohablv more an artifact of the distrihutions of numbers of
persons than of any relationship betwe 'n these disorders and education. As
we go up the education ladder, the percentage of Whites tend '. to increase
while for African-Americans and 1Ikpanics it tends to deerease. his further
substantiates the fact that Whites generally receive more educatior than other
groups in our society.
Anwng, persons vitir dkordcrs of he nervou.
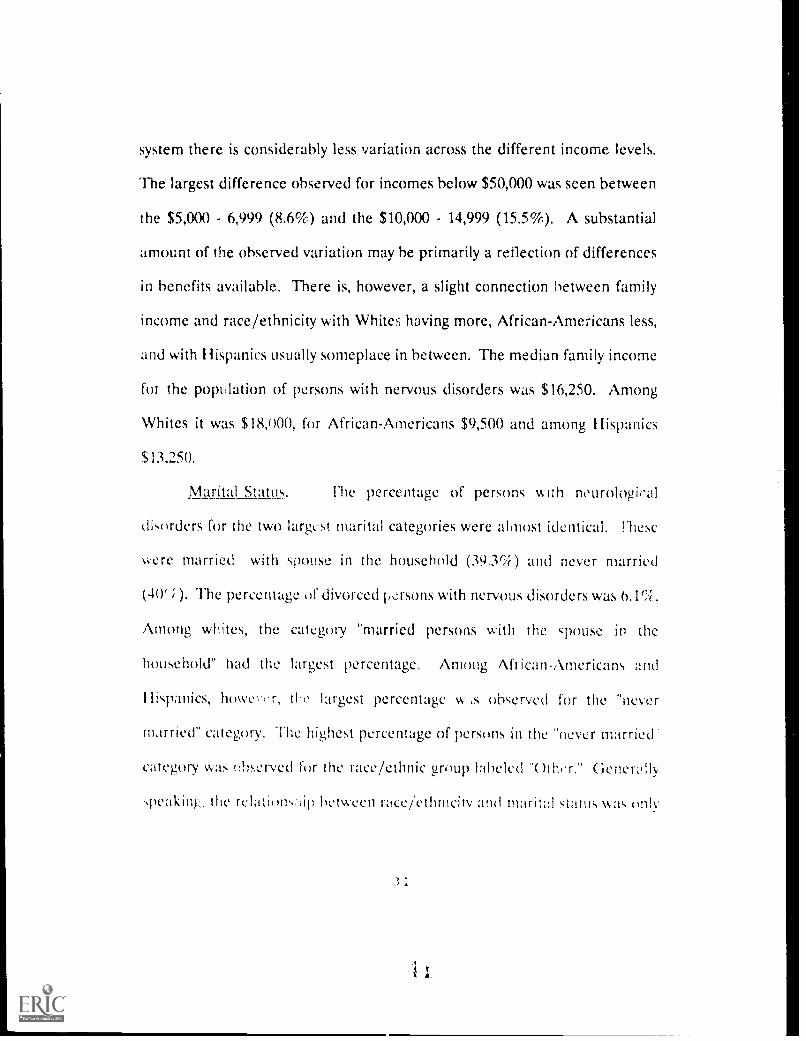
system there is considerably less variation across the different income levels.
The largest difference observed for incomes below $50,000 was seen between
the $5,000 - 6,999 (8.6%) and the $10,000 - 14,999 (15.5%). A substantial
amount of the observed variation may he primarily a reflection of differences
in benefits available. There is, however, a slight connection between family
income and race/ethnicity with Whites having more, African-Americans less,
and with Hispanics usually someplace in between. The median family income
for the population of persons with nervous disorders was $16,250. Among
Whites it was $18,000, for African-Americans $9,500 and among Ilispanics
$13,250.
Marital Statu. Ihe percentage of persons with neurological
disorders for the two largest marital categories were almost identical. Fhese
were married with spouse in the household (39.3%) and never married
(401';,). The percentage of divorced persons with nervous disorders was 6.1%.
Among whites, the category "married persons with the spouse in the
household" had the largest percentage. Among African-Americans and
Hispanics, howc,er, the largest percentage ve,s observed for the "never
married" category. The highest percentage of persons in the never married
category was eb.e.t-ved for the race/ethnic group labeled "Other." Generi:
speaking, the relabonsi.in between race/ethnicity and marital status was only
slight, however.
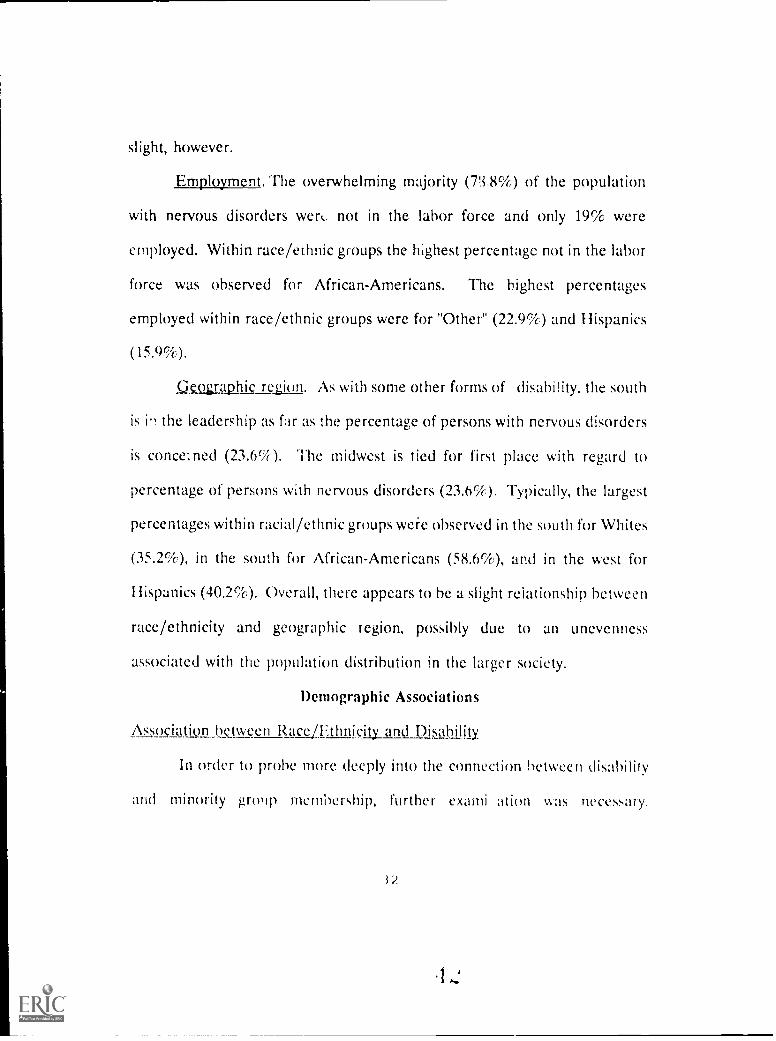
Employment. The overwhelming majority (7.i.8%) of the population
with nervous disorders were not in the labor force and only 19% were
employed. Within race/ethnic groups the highest percentage not in the labor
force was observed for African-Americans. The highest percentages
employed within race/ethnic groups were for "Other" (22.9%) and Hispanics
(15.9%).
Geographic re_gion. As with some other forms of disability, the south
is in the leadership as far as the percentage of persons with nervous disorders
is conce:ned (23.6%). The midwest is tied for first place with regard to
percentage of persons with nervous disorders (23.6%). Typically, the largest
percentages within racial/ethnic groups were observed in the south for Whites
(35.2%), in the south for African-Americans (58.6%), and in the west for
I lispanics (40.2%). Overall, there appears to be a slight relationship between
race/ethnicity and geographic legion, possibly due to an unevenness
associated with the population distribution in the larger society.
Demographic Associations
Association between RaceiFthnicity_and Disability
In order to prlibe more deeply into the connection between disability
and mirmrity gr(»ip memhership, further exami ati(m was necessary.
32

Essentially, this consisted of studying the association between race/ethnicity
and disability 1. m so/eral vantage points. The first of these involved a
determination of the association between the four types of race/ethnicity
classifications and the four disability categories under study. At a more
fundamental level, a study was also undertaken of the association between
race/ ethnicity and nine (9) demographic variables across each of the four
disability categories. This was followed by an analysis of he association
between race/ethnicity and the nine (9) demographic varilbles within each
(a) type of chronic health condition, (b) type of physical, sensory, and
language impairment, (c) type of mental disorder, ...yid d) type of nervous
disorde r.
For all analyses, the measure of association was the statistic known as
Cramer's V which ranges from .00 to 1.0 and is inte;preted directly on the
basis of its size. A low number means weak association and a high number
means strong association.
RacoLlthnicity and four disabilitwoups TaPle 1 shows that among
the four disability categories the association between race and mental
disorders (c-.19) was the strongest. The associations between race and
chronic health conditions and physical, sensory and language impairments
were low and almost negligible with values of c -.07 for both.
3 3
Ii

TABLE 1
Values of Cramer's V for association between race/ethnicity and four disability category groups
Disability Category Group Cramer's V
Chronic Health Conditions .07 <.0001Physical Impairments .07 <.0001Mental Disoruers .19 <.0001Nervous System Disorders .11 <.0001
Race/Ethnicity and Demographic Variables Table 2 shows some
interesting findings. The association between race and family income was
consistently observed to be among the strongest across all four types of
disability classifications. With the exception of mental disorders, there was
virtually no evidence of a systematic relationship between race and sex nor
between race/ethnicity and employment. When each type was examined
separately, it was seen that the strongest associations with race/ethnicity in
the chronic conditions group was observed for family income, education and
marital status. For the group with impairments, the strongest associations
with race were seen for family income, geographic region and marital status.
3 4
1

TABLE 2
Values of Cramer's V for measuring association betweenrace/ethnicity and selected demographic variables
among four types of populations with disabilities inthe United States
ChronicHealth
Impair-ments
MentalDisorders
NervousDisorders
Race by
Sex .04 .02 .12 .07Ag,! .08 .08 .30 .15Education .12 .10 .20 .11Ffimily Income .14 .13 .21 .15Gen. L.O.A. .06 .09 .16 .06Work L.O.A. .06 .09 .13 .08Marital Status .12 .11 .14 .16Employment .05 .08 .11 .11Geographic Region .13 .13 .16 .14
Race/Ethnicity. Demographic Variabks. and Chronic Health
Conditions - Table 3 shows that in this analysis associations between
race/ethnicity and other demographic variables were strongest for age,
education, family income, marital status, and geographic region. The
relationships were also more pronounced for some chronic conditions than
they were for others. For example, the association between race and age
was strongest in the heart disease (c----.12), cerchrovascular (c- .16), and
:3 5

TABLE 3
Values of Cramer's V for measuring the association betweenrace/ethnicity and selected demographic variables for seven types
of chronic debilitating health conditions
Interver-Respira- tebral
Heart Cerebro- ratory Disc Dia- Hyper- Arth-Disease Vascular Disorder Dis. betes tension ritis
Sex .08 .04 .04 .06 .06 .06 .04
Age .12 .14 .12 * .11 .09 *
Education .12 .16 .10 .10 .14 .15 .16
Family Income .16 .17 .17 .14 .12 .16 .15
Gen.L.O.A. .07 .12 .05 .08 .08 .08 .07Work L.O.A. .06 .15 .06 .09 .06 .09 .08Marital Status .13 .12 .13 .13 .13 .14 .13
Employment .08 .09 .07 .07 .04 .06 .07
Geo. Region .09 .16 .12 .10 .17 .16 .13
Row or column sum to zero - no statistic computed.
respiratory disorders (c=.12) groups. The association between race and
education was strongest for the cerebrovascular (c=.16), diabetes (c = .14),
hypertension (c = .15), and arthritis (c=.16). The association between race
and family income was strongest in the cerebrovascular (c=.17), respiratory
disorder (c= .17) and hypertension (c=.16) groups. For marital status the
asociati(m was virtually the same across all seven types of conditions, ranging
from .12 for the cardiovascular group, to .14 for the hypertension group. 1 he

association of race with geographic region was highest within the
cerebrovascular (c=.16), diabetes (c= 17), and hypertension (c=.16) groups.
Race/ Ethnicity, Demographic Variables and 1mvairments - Table 4
shows that associations between race/ethnicity, and other demographic
variables were strongest for age, education, family income, employment and
geographic region. The extent of these associations varied across impairments
from almost zero for some to relatively high values for others. For example,
the highest associations between race and age were seen for paralysis (c =.23)
TABLE 4
Values of Cramer's V for measuring the association bet'ocenr ice/ethnicity and selected demographic variables
for six types of impairments
Loss of!fearing Ortho Visually Para- Extre- SpeechImpair. Impair. Impair. lysis mulles Impaired
.Rac? by
Sex .06 .02 .02 .05 .12 .08Age .10 .06 .11 .23 .20 .16Education .10 .12 .12 .10 .20 .12Family Income .13 .13 .13 .18 .21 .1tiGtn. LOA. .08 .08 .10 .10 .16 .08Work LOA. .07 .09 .10 .1 .16 .14Marital Status ,I2 .11 .13 .17 .11Employment .10 .09 .08 .12 .21 .14Geo Region .13 .12 .14 Al .18 .20

and loss of extremities (c = .20). The association between race and education
was highest for the loss of extremities group (c=.20). For family income, the
association with race was highest in the paralysis (c=.18), loss of extremities
(c=.21) and speech impaired (c=.18) groups. For employment, the highest
association with race was seen for the loss of extremities group (c -.21).
Finally, the association between race and geographic region was highest
within the loss of extremities (c=.18) and speech impaired (c=.20) groups.
Race/Ethnicity Demographic Variables and Mental Disorders - Table
5 shows that the association between race/ethnicity and other demographic
variables were strongest for age, education, family income, and employment.
These relationships were all seen either for the schizoplirenic or "other
psychoses" groups. No relationship statistics could be computed for the
affective psychosis group due to distortions in the data configuration. Within
the schizophrenic group; the highest associations between race and (tther
demographic variables were seen for family income (c=.42) and etnployment
(c=.32). In the "other psychoses" group, the highest assoeiations were seen
for age (c=.40), education (c=.34). and family income (e---,.35).
RacejEthnicity_Dernographic Variables and Nervous Di:,orders Table
t, indicates that associations between race/ethnicity and other demographic
variables were strongest for at.e, educzttion, f'annk income, nmritil stmns,
I a

TABLE 5
Values of Cramer's V for measuring the association betweenrace/ethnicity and selected demographic variables
for three categories of mental disorders
Race by
SchizophrenicAffective OtherPsychosis Psychosis
Sex .14 .23Age .40Education .34Family Income .42 .35Gen. LOA. .25 .14Work LOA. .24 .24Marital StatusEmployment .32Geo. Region .22 .26
-_-_,+.-_-___-Row or column sum zero - no statistic computed.
and employment. Relationships were also more pronounced within some
disorder groups than they were in others. For example, the tissociation
between race and age was strongest in the cerebral palsy (c =.27) and epilepsy
(c=..21) groups. The association between race and education ',vas strongest
for mental retardation (c -.31) and multiple sclerosis (c The
associatim between race and ffamily income was relatively high for tht.'
3 9

multiple sclerosis group (c=.40) and to a somewhat lesser extent for the
mental retardation group (c=.22). Associations between race and marital
status were highest in the multiple sclerosis (c =.37) and "other disorders"
(c=.50) groups. The association between race and employment was highest
in the epilepsy group (c=.24).
TABLE 6
Values of CI% mer's V for measuring association betweenrace/ethnlcity and selected demographic variables
for six types of nervous disorders
.10ce_la
MentalRetar-dation
Cere-bradPalsy
Parkin-son's Epi-Disease lepsy
MultipleSclerosis
OtherDisorders
Sex .08 .08 . .11 .18 .22Age .15 .27 * .21 * .Education 31 .11 .16 :36Family Income 12 .20 * .19 .40 .20Gen. I.O.A. .09 .12 * .10 .15 .16Work L.O.A. .14 .12 * .15 .14 -24Marital Status .16 .19 * .17 .37 .50Employment .14 .14 * _24 * .17Geo. Region .18 .13 * .18 .21 .16
Row or column sum to 7ero - no statistic computed.

DISCUSSION
As noted above there is a significant disparity within the area of
chronic conditions relative to gender. It is unclear whether the large chronic
conditions sex disparity occurs because of the types of conditions selected for
study or because of some other factors related to health care of females,
especially African-American females. The comparison of the sexes showed
clearly that whether we see marked differences between males and females
depends on how disability is defined. For some types of classification males
may dominate while females may dominate for others. Generally, there is
not much evidence for a systematic connection between physical disability and
gender. It all depends on the specific type of disaUity being considered. It
was observed, however, that females are slightly more prone to develop a
mental disorder than males, but the specific type of disorder may vary
according to gender classification or race/ethnicity, as far as prevalence is
concerned. For whatever reasons, it was also observed that African-American
males seem especially prone to develop disorders of the central nervous
system.
The overrcpresentation of African-Americans and Hispanics with
chronic health conditions in comparison to Whites suggests that Whites are
generally more healthy than minority groups. 'Iliac waS also su,stantial
4 1

evidence thai physical, sensory and language impairments tend to increase in
number as we proceed to older age groups. The working age population
seems to he particularly susceptible to impairments of the type included in
our classification. These connections seem to be highly ubiquitous, however,
and attempt; to unravel all the various relationships between age,
socioeconomic status and other concomitant influences, is a formidable
challenge.
A good deal of furor has been generated about the overrepresentation
of African-Americans in special education classes in the public schools. In
this study the data clearly suggest that they are overrepresented foi mental
retardation and also for a number of other nervous systel disorders as well.
This could he an important concomitant of the forestated overrepresentation.
These findings are consistent with research conducted by Jones (1987),
Walker (1986), and Walker (1984). It is apparent that minority persons with
impairments are more likely to be seen at the lower educational levels.
These findings support research w'nch has been conducted by I3owe (1985)
and Walker (1988). There is more ol a connection between race/ethnicity
and disability than between education and disability.
For the most part \Oat we say ahout education can also be said about
age, in that the various influences are not so easily untangled. There does
I2

appear to be some slight but systematic connection between mei.t al disorders
and race/ethnicity and between education and race/ethnicity in the
population with mental disorders.
Among persons with disabilities, there is a dehnite cleavage between
the haves and the have-nots with those on public assistance at the I, .wer
income levels and persons who are employed at the upper level of amily
income. Moreover, there is a remarkable and corsistent tendency for
minority persons across disability groups to be at the hottom of the economic
iadder and for Whites to be at the top. In all four disability classifications
African-American income hovers around S10,000 and is uniformly low. To
a somewhat lesser extent, thi is also true of Hispanics, where income hovers
around $13,300 except for the impairments category, where it increases to
$16,500. Among Whites with disability, family income ran es from low of
Sl6,600 for the mental disorder group up to a high of S27.050 for the
impairments group. There is nothing approaching a reasonable
approximation between White ramily income and minority family income for
any of the four disability classifications. These comparisons are shown below
in Table 7.
4 3
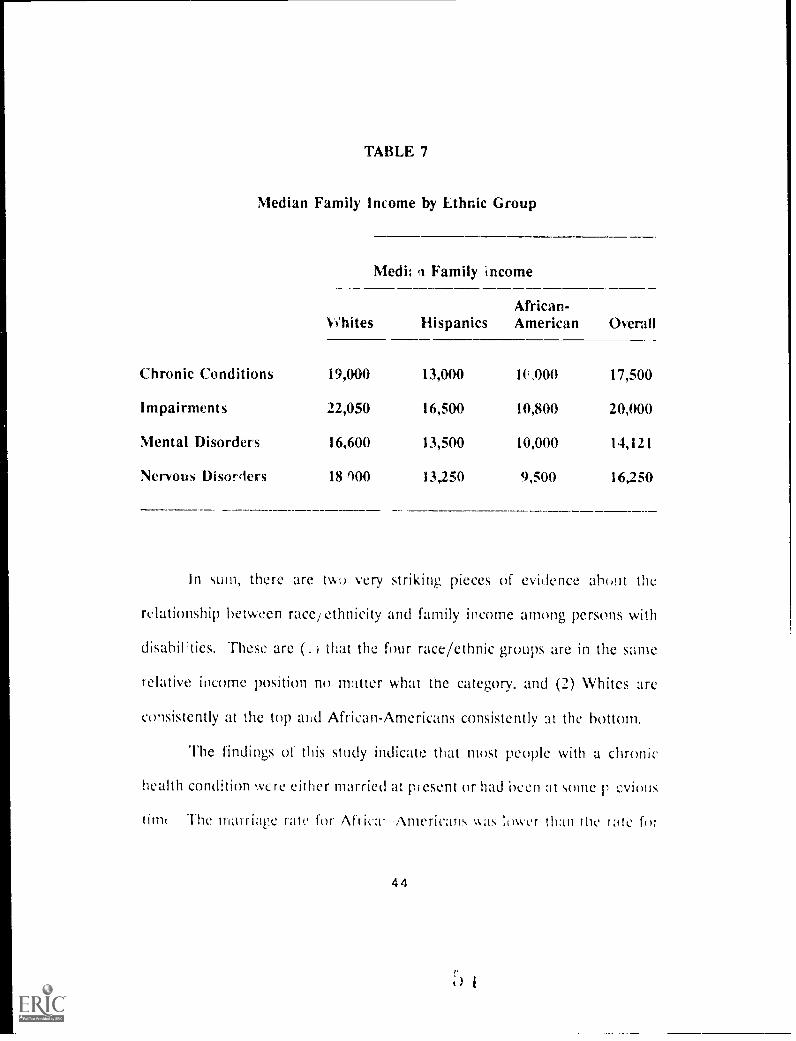
TABLE 7
Median Family Income by Ethnic Group
Medh !I Family income
%t'hites HispanicsAfrican-American Overall
Chronic Conditions 19,004) 13,000 1C,000 17,500
Impairments 22,050 16,500 10,800 20,000
Mental Disorders 16,600 13,500 10,000 14,121
Nervous Disorders 18 900 13,250 9,500 16,250
In sum, there are two very striking pieces of evidence about the
relationship between race/ethnicity and family income among persons with
disabilities. These are (. ) that the four race/ethnic groups are in the same
relative income position no matter what the category, and (2) Whites are
consistently at the top and African-Americans consistently at the bottom.
The findings of this study indicate that most people with a chronic
health condition Were either married at present or had been at some p evimis
timt The marriage rate for Africa! .Americans was sower than the tate fu7
4 4

Whites. Generally, p,. rsons with physical disabilities tended to be married
whereas African-Americans tended to be in the other marital status
categories. For example, African-Americans were more likely to be separated
from a spouse than other individuals in the sample. It was not possible in the
current study to determine whether the marital status relationships were
culturally influenced or the result of disability. The proportion of persons
who had never been married was especially high in the population with
mental disorders. This is probably due to the large number of schizophrenics
(who encounter this disability earlier in life).
Among persons with a disorder of the nervous system, marriage is a
casualty before rather than after the fact with proportionately more persons
in this category "never married."
Employing:it In the matter of employment, it seems that when people were
identified as chronically ill, a substantial number of them were beyond the
usual age for retirement. This is related to the connection between age and
health status. Were it not for the fact of advanced age, however, there would
probably be more employed people working in spite of theL chronic health
condition. Hispanics appear to be hardest hit by unemployment.
Generally, physical, sensory and language impairments were not
devasuoing in their effect on employment as chronic health ,:onditions were.
4 5

By and large, a substantial number of persons with disabilities were either
employed or were seeking employment. As far as mental illness was
concerned, it was especially devastating in its impact on employment, even
more so than for other types of disabilities.
"fo some extent, the large percentage of persons with disabilities in the
south is an artifact of the way the country is divided geographically by the
National Center for I.lealth Statistics. The densely populated east coast is
included in the south along with many large cities in the old south extending
all the way to Texas.
With regard to physical, sensory and language impairments, the south
seems particularly susceptible to these occurrences, either because of
demographics or because of peculiarities associated with the regi(m such as
life st)les and the kinds of employment available. Among the four disability
categories, the only one where the south is not in the lead is mental
disonl,'rs. This suggests that the midwest and northeast are either more
stressful or that they have a larger percentage of people prone to develop a
mental disorder. ltIshould be noft.d that the midwest was tied Vvith the south
.with regard to persons With nervous disorders.
4 6

POLICY IMPLICATIONS
Several major findings were identified in the current study with regard
to the following reference variables: income, education, geographic location,
employment, disability and health status.
Income In all four disability classificationskfrican-American incomehovered around $10,000 and was uniformly low. To a somewhatlesser extent, this is also true of Hispanics whose incomehovered around $13,300 except for the impairment categorywhere it increased to $16,500. Among Whites with disabilities,family income ranges from a low of $16,600 for the group withmental disorders to a high of $22,050 for the group withimpairments.
Education Across all four disability categories, the highest proportion ofsubjects were found in the 12 years of education category forall disability group,:
0 Chronic health conditions 32.7%0 Impairments 33.4%0 Mental disorders 14.4%o Nervous disorders 21.9%
A high proportion of subjects were also found in the 1-8 yearsof schooling citegory:
0 Chronic heilth conditions 25.3%o Impairments 19.4%o Mental disorders 14.4%
Nervous disorders 35.0%
It should also be noted that African-Americans and Hispanicsconsistently had iower levels of education than their Whitecounterparts.
GeographicLocation A high proportion of subjects from each of the four disability
categories resided in the Southern region. For example, chronic
4 7

conditions 37.2%, impairments 34%, mental disorders 30.8%.The midwestern region had the highest proportion of.personswith mental disorders (32.4%). The south and the midwestwere tied for first place with regard to the percentage ofpersons with nervous disorders (23.6%). At least 50% of theAfrican-American subjects with disabilities resided in thesouthern region. As might be expected, the west, for example,represented a very high concentration of Hispanics withdisabilities: 40.6% of Hispanics with physical, language, andsensory impairments resided in the west. In addition, 40.2%of Hispanics with nervous disorders resided in this region.
Employ-ment While a high proportion of subjects in each of the four disabAity
categories were unemployed, generally, physical, sensory, andlanguage impairments were not as devastating in their effect onemployment as were chronic health conditions, mentaldisorders, and nervous disorders. Mental and neurologicaldisorders were especially devastating for African-Americans andHispanics.
Disability andHealthStatus With regard to physical, sensory, and language impairments
among persons age 65 and older, there was a much higherproportion who were White than were African-Americans orI lispanics, or "Other." This is probably a direct result of betterhealth care and greater longevity among Whites in comparisonto the other race/ethnic subgroups. The findings show a clearneed for mental health support systems for ni les in minoritycommunities.
Trends for the 21st Century
Jacobs (1987) makes the point that the buying power of African-
Americans and many other minority persons diminished in real terms during
Ow 1980s. The high costs of care, medication and/or aids (such as
4 8

wheelchairs and hearing aids) to assist the individual with a disability to gain
any degree of independence frequently cannot be eorded. This creates the
necessity for a greater degree ,f public assistance to the family of the
minority person with a disability. The absence of supportive aids further
limits the earning power of the family of a minority individual with a
disability (Nicholls, 1986).
The African-American, Hispanic, and Native-American who becomes
disabled frequently finds that his/her job is not accessible, especially if it is
in an old section of the community where the barriers to access are the most
numerous. If this individual is the head of a household, then the entire
economic structure of the family is destroyed. Thus, this individual minority
adult is frequently unable ;o become totally integrated into community life
because his/her range of mobility in the community is restricted. The
community labels him/her as inferior and does not provide for his/her free
access to e,1ocation or ways for him/her to develop socially and culturally.
Additionally, this situation of ation has s,!rious ramifications for self-
concept and educational achievement.
Research conducted by the I ludson Institute (1987) revealed several
startling trends in regard to the American workforce as we approach the year
2000. In addition to the fact that there wiH be new changes or developments
4 9

in technology, international competition, demographic, and other factors will
change the nation's economic and social landscape. The following trends
were cited by the Hudson Institute Report (1987):
1. The population and the workforce will grow more slowly.
The average age of the workforce and the population will riseand the pool of young workers entering the labor market willshrink.
3. More women will enter the workforce.
4. Immigrants will represent the largest share of the increase inthe population and the workforce since the First World War (aprojected 600,000 legal and illegal immigrants).
Minority persons will be a larger share of new entrants into thelaborforce. It is projected that by the year 2000 this trend willescalate.
In spite of their potential for ncr,.ased employment, the current study
provides .dditional evidence that African Americans and I lispanics with
disabilities are disproportionately represented at the lower end of the
economic spectrum and among unemployed individuals with disabilities. The
I ludson Institute Report (1987) suggests that future jobs will demand much
higher skill leveis than the jobs of today. Very few jobs will he created for
those who cannot read, follow instructions, and use mathematics. These
trends will lead to both higher and lower unemployment: more joblessness
among the lcast skilled and less among the most educationally and
0

economically advantaged.
Current trends and challenges of the immediate future make it
necessary to improve the educational preparation of all present and future
workers. Furthermore, there is need to integrate persons with disabilities,
economically disadvantaged, and ethnic minority workers fully into the
economy. Given the pressing societal and economic demands including the
shrink ig number of young people, the rapid pace of industrial change, and
the evei -rising skill requirements of the emerging economy, it is essential
that America respond to the task of fully utilizing the potential of the
economically disadvantaged and minority persons with disabilities now and
in the year 2000.
Based on the findings of the current study, it is imperative that policy
makers implemeni strategies which improve the health and employment status
of African Americans, I lispanics, and other minority persons with disabilities.
5 1
t; I

REFERENCES
Acosta, F. X. (1970). Ethnic variables in psychotherapy: The MexicanAmerican. In J. L. Martinez (Ed.), Chicano psycholoa. New York:Academic Press.
Adams, B. L., Dworkin, R. J., & Rosenberg, S. D. (1984). Diagnosis andpharmacotherapy issues in the care of Hispanics in the public sector.American Journal of Psychiatry, 141(8), 970-974.
Adebimpe, V. R., Klein, H.E., & Lange, M. H. (1982). Racial andgeographic differences in the psychopathology of schizophrenia,American Journal of Psychiatry, 139, 888-891.
Anderson, E. H. (1986). Rehabilitation for the nonwhite disabled: Aformidable challenge. In S. Walker, F. Z. Belgrave, A. Banner, & R.W. Nicholls (Eds.), Equal to the challenge: Perspectives, problems and5tralegies in the rehabilitation of the nonwhite disabled (pp. 1-7).Washington, DC: Bureau of Educational Research, School ofEducation, Howard University.
Bielecki, R. A., & Jones, C. (1986). Results of the Vocational RehabilitationSurvey, Pacific Basin. Honolulu, III: Pacific Basin RehabilitationResearch and Training Center.
Bowe, F. (1985a). African-American adults with disabilities. A statisticalreport drawn from Census Bureau data.
Bowe, F. (1985b). Disabled adults of Hipanic American origin. Astatistical report drawn from Census Bureau data.
Cummings, R., I luntley, L., Kelly, S. M., & Varney, J. M. (198().Demographic data base and rehabilitation resources of Pacific Nations.Honolulu, Ill: Pacific Basin Rehabilitation Research and TrainingCenter.
laerer, A. F., Anderson, D. W., & Schoenberg, B. S. (198(a). Functionaldisability major neurologic disorders: Findings from the Capital Countystudy. Archives of Neurology, 43, 1000-1003.
`)2
Haerer, A. F., Anderson, D. W., & Schoenberg, B. S. (1986b). Prevalenceand clinical features of epilepsy in a biracial United States population.Epilepail, 22, 66-75.
Hodge, F. (1990). Disabled American: A special population requiringspecial needs. American Indian Culture and Research Journal, 12(3& 4), 83-104.
Hopkins, I. W. (1988). Public/private partnership to facilitate career successfor minority persons with disabilities. In S. Walker, J. W. Fowler, R.W. Nicholls, & K. Turner (Eds.), Building bridges to independence:Employment. successes. problems. and needs of African-Americanswith disabilities (pp. 85-88). Washington, DC: The Center for theStudy of Handicapped Children and Youth, School of Education,Howard University.
Hudson Institute. (1987). Workforce 2000: Work and workers for the 21stIndiannapolis, IN: Hudson Institute.
Jacobs, J. E (1987). An overview. In J. E. Jacobs (Ed.), Black America1987. Washington, DC: The Urban League.
Jones, B. E., & Gray, B. A. (1986). Problems in diagnosing schizophreniaand affective disorders among Blacks. Hospital and Commu nitPsychiatry, 32( 1 ), 61-63.
Jones, B. E., Gray, 13. A., & Parsons, E. B. (1983). Manic-depressive illnessamong poor urban Hispanics. American Journal of Psychiatry, 140,1208-1210.
Jones, B. E., Gray, B. A., & Parsons, E. 13. (1981). Manic-depressive illnessamong poor urban Blacks. American Journal of Psychiatry, 138, 654-657.
1 onetree, G. (1990). Service, resource and training needs of AmericanIndian vocational rehabilitation projects. American Rehabilitation,16(1), 11-15.
Morgan, J., & O'connell, J. C. ( 1987). The rehabilitation of disabled NativeAmericans. Interna onal Journal of Rehabilitation Research, 10(2),139-149.
5 3
1; ,

Mukherjee, S., Shukla, S. S., Wood le, J., Rosen, A. NI., & Olarte, S. (1983).Misdiagnosis of schizophrenia in bipolar patients: A multiethniccomparison. American Journal of Psychiatry, 140, 1571-1574.
Nicholls, R. W. (1986). New assistive technologies and the nonwhitedisabled. In S. Walker, F. Z. Belgrave, A. Banner, & R. W. Nicholls(Eds.), Equal to the challenge: Perspectives. problems. and strategiesin the rehabilitation of the nonwhite disabled (pp. 80-90). Washington,DC: Bureau of Educational Research, School of Education, HowardUniversity.
O'Connell, J. C. (Ed.). (1987). A study of the special problems and needsof American Indians with handicaps both on and off the reservations.Washington, DC: U.S. Department of Education, RehabilitationServices Administration.
Ruiz, P. (1983). Clinical care update: The minority patient. fommunityMental Health Journal, 21(3), 208-216.
Thornhill, H. L., & I loSang, D. A. (1988). Poverty, race, and disability. InS. Walker, J. E. Fowler, R. W. Nicholls, & K Turner (Eds.), Buildingbridges to independence: Employment. successes. problems. and needsof African-Americans with disabilities (pp. 148-156). Washington,DC: The Center for the Study of Handicapped Children and Youth,School of Education, Howard University.
Tho, nhill, II. L., & 'Forres, L. (1986). Some observations on African-Americans and physical disability. In S. Walker, F. Z. Belgrave, A.Banner, & R. W. Nicholls (Eds.), Equal to the challenge: Perspectives,problems. and strategies in the rehabilitation of the nonwhite disabled(pp. 51-54). Washington, DC: Bureau of Educational Research,Howard University.
Torks, C. M., Paykel, E. S., & Klerman, L. (1970). Clinical depressionamong Negroes. American Journal of Psychiatry, 122, 329-335.
U.S. Bureau of the Census. (1985, November). American Indians. Eskimos,and Aleuts on id;:ntified reservations and in the historic areas ofOklahoma Lexcluding urbanized areasi: 1980 census of the_wpulation(Subject Report PC 80-21D, Part I). Washington, DC. Departmentof ('ommerce.

Walker, S. (1984). Issues and trends in the education of the severelyhandicapped. In E. Gordon (Ed.), Annual review of research ineducation, Vol. II. Washington, DC: American Education ResearchAssociation.
Walker, S., Akpati, E., Roberts, V., Palmer, R., & Newsome, M. (1986).Frequency and distribution of disabilities among Blacks: Preliminaryfindings. In S. Walker, F. Z. Belgrave, A. Banner, & R. W. Nicholls(Eds.), Equal to the challenge: Peapectives. problems. and strategiein the rehabilitation of the nonwhite disabled (pp. 51-54).Washington, DC: Bureau of Educational Research, Howard University.
Warheit, G. T., Holzer, C. E., & Schwab, J. J. (1973). Analysis of socialclass and racial differences in depressive symptomatology: Acommunity study. Journal of Hgalth and Social Behavior, 14, 291-299.
f;;i