Embed Size (px)
Citation preview

153152
>> Director’s Report
2011 Obrascón Huarte Lain, S.A. and Subsidiaries
Director’s Report

155154
>> Director’s Report
2011 Obrascón Huarte Lain, S.A. and Subsidiaries
Translation of a report originally issued in Spanish. In the event of a discrepancy, the Spanish-language version
prevails.
1. Economic Overview
In economic terms, 2011 was a year strongly marked by:
- The sovereign debt crisis, which led to severe volatility on the markets and a high degree of fluctuation in
interest rates.
- The drop in global confidence which brought about tighter lending conditions and economic adjustments.
- The recapitalisation of the European banking system.
- An increase in investment from the emerging countries.
The world economy continued to grow at a good pace, although somewhat slower than expected due to the
adjustments made, and GDP is expected to increase 3.8% in 2011 compared with 5.2% in 2010. In the coming
years two-speed growth is set to continue, with the positive contribution being made mainly by the emerging
countries. Latin America expects to see growth of around 4.6% for 2011 (according to the IMF), to which Brazil
and Mexico will contribute 2.9% and 4.1%, respectively. Also, the US and the EU estimate growth of 1.8% and
1.6%, respectively.
In Spain budgetary cuts and the increase in the cost of sovereign debt took GDP growth in the last quarter to
-0.3% The growth prospects in the first two quarters of 2012 are negative, levelling off in the second half of the
year. In view of the foregoing, GDP growth, which stood at 0.7% in 2011, is expected to be negative in 2012.
As regards investment in construction in Spain, the difficulty in reactivating the real estate business, together
with the inevitable cutbacks in public investment in infrastructure in order to meet deficit reduction objectives,
signal a continuation in the downward trend, with rates of -7.8% and -8.2% in 2011 and 2012, respectively
(according to The Spanish Savings Banks Foundation (FUNCAS).
2. Business performance
Millions of euros
2011 % 2010 % % change
Revenue 4,869.8 100.0 4,771.4 100.0 2.1
EBITDA 1,219.3 25.0 991.0 20.8 23.0
EBIT 972.5 20.0 694.5 14.6 40.0
Profit before tax 542.9 11.1 381.7 8.0 42.2
Profit attributable to the Parent 223.3 4.6 195.6 4.1 14.2
Short-term backlog 8,896.9 10.9 5,639.4 6.9 57.8
Long-term backlog 72,455.2 89.1 76,370.9 93.1 -5.1
Total backlog 81,352.1 100.0 82,010.3 100.0 -0.8
Intangible assets and goodwill (1) 6,209.1 48.0 6,484.9 51.5 -4.3
Equity attributable to the Parent (1) 1,215.7 9.4 1,300.0 10.3 -6.5
Gross recourse borrowings (1) 1,748.8 13.5 1,693.1 13.4 3.3
Net recourse borrowings (1) 1,256.5 9.7 1,173.5 9.3 7.1
Gross non-recourse borrowings (1) 4,849.5 37.5 4,444.7 35.3 9.1
Net non-recourse borrowings (1) 3,852.7 29.8 3,246.4 25.8 18.7 (1) % of total assets.
The Group’s progress
The OHL Group ended 2011 with excellent results, which were particularly noteworthy in view of the troubled
macroeconomic backdrop. The growth obtained in the main aggregates of the income statement was as follows:
Sales: +2.1%
EBITDA: +23.0%
EBIT: +40.0%
Net attributable profit: +14.2%
For yet another year, these results were possible due to the sound performance of the Concessions Division,
which achieved growth in sales, EBITDA and EBIT of 9.1%, 24.2% and 40.8%, respectively. This growth has
meant that the Concessions business now accounts for 76.1% of the Group’s EBITDA and 81.3% of EBIT, thereby
increasing its importance within the Group.
The most noteworthy occurrence in the Construction Division in 2011 was the major success achieved in the
award of large international contracts amounting to approximately EUR 4,000 million, including most notably:
the Obskaja-Salechard-Nadym railway line in Russia, the CHUM Hospital in Montreal (Canada), the Marmaray
Tunnels in Turkey and the La Meca-Medina high-speed railway in Saudi Arabia. These major awards made it
possible to achieve an all-time-high backlog for the Group of EUR 8,741 million, 1.6 times higher than the backlog
at 2010 year-end and representing sales over a period of 36 months. The specialised segmented nature of the
backlog should be mentioned, such as railways and hospitals as well as its balanced geographical distribution,
the breakdown at 2011 year-end being as follows:

157156
>> Director’s Report
2011 Obrascón Huarte Lain, S.A. and Subsidiaries
Area % Backlog
Central and Eastern Europe 24.3
Middle East and North Africa 23.4
Spain 23.4
The US and Canada 18.8
Others 10.1
These large contracts guarantee the medium-term growth of the Construction Division as the average construction
period stands at around three years. However, construction will not start immediately since the contracts envisage
preliminary design and structuring stages of between one and one and a half years. This fact, together with the
completion of large contracts, led to a fall in Construction revenue in 2011 of 6.7%, although EBITDA increased
19.9% due to the improved margins.
The breakdown of the Group’s sales in 2011 was as follows:
Country % of Sales
Spain 29.6
Brazil 23.3
Mexico 13.6
The US 10.6
Czech Republic 9.0
Qatar 4.1
Algeria 2.8
Others 7.0
Reduction in recourse borrowings
Net recourse borrowings at 2011 year-end totalled EUR 1,256.5 million.
If the funds that will be earned on the sale of Inima (EUR 231 million) are taken into consideration, the figure
is reduced to EUR 1,025.5 million.
It is of particular importance to note the major endeavours made in 2011 to reduce indebtedness, which enabled
the achievement of the objective of reducing the Net Recourse Borrowings to EBITDA ratio from 3.5 at the end
of 2010 to 3.
This was possible primarily due to:
- The leveraged non-recourse transactions amounting to EUR 350 million at OHL Concesiones, secured by
a portion of the shares of OHL México, for the reimbursement of funds to the parent.
- The divestment of non-strategic assets (mainly Inima).
- The financial independence of the Concessions business to make its investments.
The Total Net Debt (non-recourse and recourse) to Total EBITDA ratio was also reduced from 4.4 at 2010 year-
end to 4.0 (pro forma including the sale of Inima) at the end of 2011.
Lastly, in terms of financing, mention must be made of the comfortable situation with respect to maturities
(having pre-financed the maturities for 2012 in March 2011, through a new bond issue of EUR 425 million)
and the significant and stable recourse liquidity position, which totals EUR 1,465 million including both cash
and available credit lines.
All these facts enable the OHL Group to face the future with optimism, with the assurance of being able to
continue to achieve significant growth in its main business areas and a soundness of being in a financial
position comfortable enough to undertake such growth. Specifically, sales, EBITDA and net profit are expected
to grow by more than 10% in 2012.
Performance by business area (*)
Millions of euros
2011 % 2010 % % change
Revenue
Concessions 1,646.3 34% 1,508.7 32% 9.1%
Construction 2,866.2 59% 3,070.9 64% -6.7%
Other business activities 357.3 7% 191.8 4% 86.3%
Total 4,869.8 100% 4,771.4 100% 2.1%
EBITDA
Concessions 927.7 76% 746.9 76% 24.2%
Construction 288.0 24% 240.3 24% 19.9%
Other business activities 3.6 0% 3.8 0% -5.3%
Total 1,219.3 100% 991.0 100% 23.0%
EBIT
Concessions 791.1 81% 561.7 81% 40.8%
Construction 199.1 21% 147.6 21% 34.9%
Other business activities -17.7 -2% -14.8 -2% 19.6%
Total 972.5 100% 694.5 100% 40.0%
(*) The figures on the Environmental Division for 2011 and 2010 are presented as results of a discontinued operation and, therefore,
the aggregates for 2010 were restated and do not coincide with the data originally presented..
Concessions
Concessions continued to perform well and were up significantly compared with 2010 year-end:
Sales: +9.1% (+13.6% excluding construction sales, IFRIC 12)
EBITDA: +24.2%
EBIT: +40.8%
The main factors that influenced sales and EBITDA are as follows:
- The positive trends in traffic and toll prices in our concessions, shown in the following table:

159158
>> Director’s Report
2011 Obrascón Huarte Lain, S.A. and Subsidiaries
Change in traffic Revision of charges
2011 2010 % change % revision Last revision
Argentina
Aecsa (1) 206,305 211,863 -2.6% 58.4% December 2011
Brazil
Autovias (1) 117,619 114,656 2.6% 9.7% July 2011
Centrovias (1) 130,527 80,179 62.8% 9.7% July 2011
Intervias (1) 160,364 155,778 2.9% 9.7% July 2011
Vianorte (1) 90,610 86,209 5.1% 9.7% July 2011
Autopista Planalto Sul (1) 75,330 72,006 4.6% 6.5% December 2011
Autopista Fluminense (1) 126,085 115,025 9.6% 7.7% February 2011
Autopista Fernão Dias (1) 419,389 333,749 25.7% 7.7% December 2011
Autopista Régis Bittencourt (1) 393,472 368,695 6.7% 5.9% December 2011
Autopista Litoral Sul (1) 313,912 295,032 6.4% 16.7% February 2011
Chile
Autopista del Sol (1) 84,297 80,827 4.3% 2.1% July 2011
Autopista Los Libertadores (1) 44,230 39,745 11.3% 2.9% February 2011
Autopista Los Andes (1) 17,340 14,866 16.6% 6.4% January 2011
Spain
Euroglosa M-45 (2) 77,100 78,061 -1.2% 3.6% March 2011
Autopista Eje Aeropuerto (1) 7,845 8,647 -9.3% 3.4% January 2011
Autovía de Aragón (2) 97,408 97,430 0.0% 33.2% July 2011
Metro Ligero Oeste (3) 20,508 20,475 0.2% 6.7% October 2011
Puerto de Alicante (T.M.S.) (4) 101,507 68,824 47.5% 3.0% January 2011
Mexico
Amozoc-Perote (1) 28,202 26,731 5.5% 4.4% January 2011
Concesionaria Mexiquense I (1) 215,213 153,403 40.3% 4.4% January 2011
Viaducto Bicentenario (2) 18,727 17,468 7.2% 4.4% January 2011
Peru
Autopista del Norte (1) 24,229 17,193 40.9% 0.5% November 2011
(1) No. of vehicles (equivalent average paying traffic).(2) Average daily traffic (ADT): Total km travelled by all the users of the toll road, divided by the total km in operation on the road. This measurement represents the number of users that would have travelled the total km in operation along the toll road.(3) Average daily no. of passengers.(4) Cumulative no. of TEUs shipped.(5) Average increase in toll applied at each toll plaza, obtained from the tariff revision provided for in each concession arrangement.
• The effect of the performance of the Latin American currencies against the euro compared with 2010:
Average exchange rate for the period (EUR 1)
2011 2010 Appreciation - depreciation
Brazilian real 2.33 2.32 -0.8%Mexican peso 17.40 16.70 -4.2%Chilean peso 674.27 671.41 -0.4%Argentine peso 5.79 5.17 -12.1%Peruvian new sol 3.85 3.72 -3.5%
• The twofold increase at Centrovías, Brazil, in the number of toll plazas at Brotas and Dois Corregos in July
2010 and at Itiparina and Rio Claro in November 2010.
• The opening of the Mairiporá plaza in September 2010, in Fernao Dias and, as a result, all the toll plazas
projected for the Brazilian federal toll road network were open.
• The commencement of operations, in September and November 2010, of stretches 2 and 3 of the Viaducto
Bicentenario toll road in Mexico, thereby completing phase I totalling 21.8 km. As a result, average revenue
per vehicle increased from MXN 5.86 to MXN 10.20 (+74.1%).
• The inauguration on 30 September 2010 of a 10 km stretch of phase III of Conmex, which runs between
the Lago de Guadalupe - Vialidad Mexiquense junction.
• The opening to traffic of the final stretches of road that complete phases II and III of Conmex in April 2011,
with 10 km of stretch 2 of phase III inaugurated which makes up the road axis that runs from east to west at
the northern point of the metropolitan area of Mexico City, and the 32 km stretch that completes phase II.
• The opening of these roads completed the Circuito Exterior Mexiquense project (phases I, II and III) that
allows Mexico City to be bypassed from the north west at the interconnection with the Chamapa-Lechería
highway to the South east, at the interconnection with the Mexico-Puebla highway, and also links up the
México-Querétaro, México-Pachuca and México-Texcoco highways. The fully operational Conmex will also
improve connections between 20 municipal areas in the State of Mexico, leading to a significant reduction
in journey times.
• On 11 October Controladora Vía Rápida Poetas inaugurated the collector road to connect the flow of
vehicles between Avenida Luis Cabrera and Avenida México-Contreras with the Mexico City northbound and
southbound beltway.
• The inauguration on 3 November 2011 of Stretch 0 of the Northern Urban highway, which completed the
interconnection of the second tiers between Mexico City and the State of Mexico, linking up with the Viaducto
Bicentenario toll road. On 14 December 2011, Stretch 1 came into service, thereby extending Stretch 0 up
to Avda. Ejército Nacional.
• The change in the consolidation method of the Chilean company I 2000 (Autopista del Sol and Autopista
Los Libertadores highways), from full to proportionate consolidation, from 1 January 2011 onwards, as a
result of the sale of 23.9% of the ownership interest in that company. The OHL Group currently holds 41.4%.
• The inauguration of the Monasterio plaza on 7 September 2011 at the Chilean concession operator Autopista
Los Andes.
• The opening of the Fortaleza plaza on the Autopista del Norte highway in Peru in February 2011.
• The change in method of accounting for the concession contract of Metro Ligero Oeste, S.A., from the
intangible asset model to the financial asset model.

161160
>> Director’s Report
2011 Obrascón Huarte Lain, S.A. and Subsidiaries
As a result of these factors, the changes in sales and EBITDA of the main concession operators, grouped together
by country, is as follows:
CountryRevenue EBITDA
2011 2010 % change 2011 2010 % change
Argentina 14.8 14.0 5.7% -6.0 -2.5 140.0%
Aecsa 14.8 14.0 5.7% -6.0 -2.5 140.0%
Brazil 747.6 646.4 15.7% 414.5 355.7 16.5%
Autovias 105.8 96.9 9.2% 66.6 61.5 8.3%
Centrovias 106.4 94.9 12.1% 68.7 64.5 6.5%
Intervias 120.2 109.2 10.1% 73.0 69.3 5.3%
Vianorte 95.6 86.0 11.2% 58.8 48.9 20.2%
Autopista Planalto Sul 33.5 30.2 10.9% 11.9 10.8 10.2%
Autopista Fluminense 50.4 43.9 14.8% 24.3 20.3 19.7%
Autopista Fernão Dias 78.2 53.3 46.7% 32.2 17.7 81.9%
Autopista Régis Bittencourt 95.7 80.6 18.7% 51.9 43.0 20.7%
Autopista Litoral Sul 61.8 51.4 20.2% 27.1 19.7 37.6%
Chile 35.4 67.5 -47.6% 27.7 50.2 -44.8%
Autopista del Sol 15.4 37.0 -58.4% 12.1 29.4 -58.8%
Autopista Los Libertadores 9.7 21.7 -55.3% 8.1 15.6 -48.1%
Autopista Los Andes 10.3 8.8 17.0% 7.5 5.2 44.2%
Spain 104 74.8 39.0% 68.1 25.8 164.0%
Euroglosa M-45 12.1 11.7 3.4% 10.5 10.7 -1.9%
Autopista Eje Aeropuerto 4.4 4.7 -6.4% 4.2 0.2 N/A
Autovía de Aragón 14 6.6 112.1% 12.0 5.3 126.4%
Metro Ligero Oeste 54.4 33.1 64.4% 35.5 4.6 N/A
Puerto de Alicante (T.M.S.) 19.1 18.7 2.1% 5.9 5.0 18.0%
Mexico 111.5 88.7 25.7% 400.4 283.5 41.2%
Amozoc-Perote 19.2 18.3 4.9% 13.5 13.7 -1.5%
Concesionaria Mexiquense (1) 81.9 66.6 23.0% 289.9 209 38.7%
Viaducto Bicentenario (1) 10.4 3.8 173.7% 97.0 60.8 59.5%
Peru 19.5 14.1 38.3% 12.6 7.7 63.6%
Autopista del Norte 19.5 14.1 38.3% 12.6 7.7 63.6%
Total concessions 1,032.8 905.5 14.1% 917.3 720.4 27.3%
Head Office and other 613.5 603.2 1.7% 10.4 26.5 N/A
Total 1,646.3 1,508.7 9.1% 927.7 746.9 24.2%
(1) EBITDA includes the guaranteed profitability adjustment pursuant to the concession agreements, which are classified under “Other Operating Income” and are excluded from “Revenue”: Conmex EUR 232.3 million and Viaducto Bicentenario EUR 93.1 million.
“Head Office and Other” includes the sales and costs corresponding to the Construction Division carried
on by the concession operators themselves, net of intra-Group transactions, due to the application of IFRIC
12. In accordance with the accounting principle of prudence, the OHL Group matched the sales figure of the
Construction Division from the concession operators to the costs of this construction work, which did not affect
EBITDA for these years. At 31 December 2011, this figure amounted to EUR 397.6 million (31 December 2010:
EUR 405.3 million).
Also, in application of IFRIC 12, provisions were set aside for major maintenance work scheduled over various
years amounting to EUR 85.9 million at 31 December 2011 (31 December 2010: EUR 73.3 million). Prior to the
application of IFRIC 12, the cost of this work was considered to be an addition to non-current assets at the time
of execution and depreciation was taken thereon on the basis of their useful life.
OHL Concessions manages a portfolio of 28 major concessions, which includes 23 toll road concessions, covering
a total of 4,417 km, an airport, two ports and two railway concessions, consolidating the Group as one of the
most important infrastructure operators in the world.
At 31 December 2011 the long-term backlog stood at EUR 72,012.2 million, representing a decrease of 5.5%
with respect to the accounting closing at December 2010. This decrease was due mainly to the depreciation of
certain currencies against the euro.
Construction
Sales in the Construction Division ended 2011 down 6.7% on 2010, which is an improvement onprevious
quarters due to the boost from construction activity at international level in the final quarter, which ended
the year down just 2.9%. The reason for this recovery was the start-up of several major awards in early 2011,
mainly corresponding to construction projects in Canada. The business in Spain, affected by the general election
towards the end of the year, does not include the seasonal effect which is typical in the last quarter and sales
ended the year trending downwards by 12.3%, similar to that witnessed in previous quarters.
Despite the fall in sales, both EBITDA and EBIT grew strongly, 19.9% and 34.9% respectively, due to improved
margins on certain contracts at the completion stage.
Truly notable in this business line in 2011 was the change in scale as a result of the considerable success earned
in project awards. These were contracts with a high degree of technical quality, mostly linked to specialist niches
in which OHL is particularly strong (railways and hospitals), and with an interesting geographical distribution.
The six main projects awarded, totalling approximately EUR 4,000 million, in chronological order, are as follows:
- Extension of the Toronto underground railway (Canada)
- CHUM Hospital in Montreal (Canada)
- Urban viaduct (Kuwait)
- Marmaray tunnels (Turkey)
- La Meca-Medina high-speed rail link (Saudi Arabia)
- Obskaja-Salechard-Nadym railway line (Russia)

163162
>> Director’s Report
2011 Obrascón Huarte Lain, S.A. and Subsidiaries
As result of these awards, the Construction backlog grew by 58.6% to stand at EUR 8,741 million, an all-time
high that signifies a threefold increase in sales, the geographical breakdown of which is as follows:
Area % backlog
Central and Eastern Europe 24.3
Middle East and North Africa 23.4
Spain 23.4
The US and Canada 18.8
Others 10.1
This considerable increase in the backlog guarantees strong future growth in the business although (as we
discussed earlier), it will take some time to become clearly visible in the income statement.
Other business activities
The change in the presentation of the Environmental Division in the income statement should be mentioned
which started to be accounted for as a discontinued operation following the agreement to sell Inima entered
into in November 2011. Its effect on sales, EBITDA and EBIT therefore disappears from the income statement
in both 2011 and 2010.
Other business activities accounted for sales of EUR 357.3 million net of this effect, which represents a year-
on-year increase of 86.3% in 2011 as a result of the major boost contributed by the Industrial Division that
saw a three-and-a-half fold increase in its sales.
Total EBITDA for Other Business Activities was EUR 3.6 million.
3. Financial Statements
On 16 November 2011, an agreement to sell the subsidiary OHL Medio Ambiente, S.A.U. was entered into which
will foreseeably become effective in the first few months of 2012, subject to the fulfilment of the terms and
conditions that are usual in transactions of this type. As a result of this process all the assets and liabilities of the
Environmental Division were classified as held for sale and the related gains and losses before non-controlling
interest were recognised under “Profit (Loss) For the Year from Discontinued Operations Net of Tax”.
In order to make the information comparable, the consolidated income statement for 2010 was restated and,
therefore, the amounts differ from those originally reported.
Consolidated income statement
Millions of euros
2011 % 2010 % % change
Revenue 4,869.8 100.0% 4,771.4 100.0% 2.1%
Changes in inventories of finished goods and work in progress -6.5 -0.1% -10.2 -0.2% -36.3%
In-house work on non-current assets 6.4 0.1% 12.2 0.3% -47.5%
Procurements -2,691.2 -55.3% -2,740.0 -57.4% -1.8%
Other operating income 414.3 8.5% 413.3 8.7% 0.2%
Staff costs -707.8 -14.5% -664.9 -13.9% 6.5%
Other operating expenses -674.1 -13.8% -833.6 -17.5% -19.1%
Depreciation and amortisation -252.4 -5.2% -237.5 -5.0% 6.3%
Allocation to profit or loss of grants related to non-financial non-current assets and other grants
9.9 0.2% 4.4 0.1% 125.0%
Impairment and gains or losses on disposals of non-current assets 4.1 0.1% -20.6 -0.4% -119.9%
PROFIT FROM OPERATIONS 972.5 20.0% 694.5 14.6% 40.0%
Finance income 126.2 2.6% 92.9 1.9% 35.8%
Finance costs -578.6 -11.9% -424.9 -8.9% 36.2%
Change in fair value of financial instruments -5.8 -0.1% 6.0 0.1% -196.7%
Exchange differences 21.0 0.4% 1.2 0.0% 1650%
Impairment and gains or losses on disposals of financial instruments -3.4 -0.1% -3.0 -0.1% 13.3%
FINANCIAL LOSS -440.6 -9.0% -327.8 -6.9% 34.4%
Result of companies accounted for using the equity method 11.0 0.2% 15.0 0.3% -26.7%
PROFIT BEFORE TAX 542.9 11.1% 381.7 8.0% 42.2%
Income tax -195.0 -4.0% -127.8 -2.7% 52.6%
PROFIT FOR THE YEAR FROM CONTINUING OPERATIONS 347.9 7.1% 253.9 5.3% 37.0%
Profit for the year from discontinued operations net of tax 0.9 0.0% -1.7 0.0% -152.9%
PROFIT FOR THE YEAR 348.8 7.2% 252.2 5.3% 38.3%
Profit attributable to non-controlling interests 125.5 2.6% 56.6 1.2% 121.7%
PROFIT ATTRIBUTABLE TO THE PARENT 223.3 4.6% 195.6 4.1% 14.2%
The OHL Group’s revenue for 2011 amounted to EUR 4,869.8 million, up 2.1% on 2010.
In both years revenue includes construction sales made by OHL’s concession operators relating to the
construction projects carried out by non-OHL Group companies, which in 2011 amounted to EUR 397.6 million
compared to EUR 405.3 million in 2010.
The Concessions business grew by 9.1%, driven by the increase in activity in Brazil and Mexico where both
charges and traffic volumes rose.
The Construction Division saw a decrease of 6.7% in activity due to the fall in activity in Spain as a result of
the negative performance of the industry. Activity outside Spain shrank by 2.9% with respect to 2010, owing
to the fact that the major construction contracts in the backlog have yet to commence and to the lower level of
activity undertaken primarily in Mexico and Algeria.
The other divisions saw a significant increase driven mostly by the Industrial Division which is carrying out
major projects.

165164
>> Director’s Report
2011 Obrascón Huarte Lain, S.A. and Subsidiaries
In 2011 70.4% of the Company’s revenue was earned outside Spain, at a similar level to the 70.0% earned in 2010.
The Division, which accounted for the largest percentage of total sales (58.9%) was Construction, of which
Construction abroad accounted for 33.8% and Concessions 33.8%.
Within the distribution of sales by country, Spain represents 29.6% of the total, Brazil 23.3%, Mexico 13.6%
and the US 10.6%.
EBITDA for 2011 amounted to EUR 1,219.3 million, which represents 25.0% of revenue. The year-on-year increase
of 23.0% was due mainly to the Concessions business, which accounts for 76.1% of total Group EBITDA and
was up 24.2% on 2010.
Despite the fall-off in business, the Construction Division increased by 19.9% due mainly to the improved
margins obtained abroad and the sustained margins in Spain (in percentage terms).
89.1% of total Group EBITDA comes from abroad.
38.1% of the Group’s total EBIDTA was generated in Mexico, 35.2% in Brazil and 10.9% in Spain.
EBIT amounted to EUR 972.5 million, representing 20.0% of revenue, and was also up 40.0% on 2010. Of
particular note was the 40.8% growth at Concessions with respect to 2010, which signifies that this business
area accounts for 81.3% of the Group’s total EBIT.
Net finance income and costs in 2011 amounted to EUR -452.4 million, representing an increase of EUR 120.4
million with respect to 2010, due to both the increase in total borrowings (with and without recourse) and
higher interest rates in the year.
Profit before tax amounted to EUR 542.9 million, representing 11.1% of revenue and an increase of 42.2%
with respect to 2010.
Profit for the year from discontinued operations net of tax amounting to EUR 0.9 million corresponds to the
Environmental Division. This heading includes the profit or loss after tax and before non-controlling interests
of each business activity, and is not included in revenue, EBITDA, EBIT, etc.
Profit attributable to non-controlling interests stood at EUR 125.5 million in 2011, as compared with EUR 56.6
million in 2010. This significant increase was largely due to the non-controlling shareholders in Mexico, as a
result of the admission to listing in November 2010 of OHL México, S.A.B. de C.V., a company in which the Group
has an ownership interest of 73.85%.
The consolidated profit attributable to the Parent amounted to EUR 223.3 million, accounting for 4.6 % of
revenue and up 14.2% on 2010.
Consolidated balance sheet
Millions of euros
2011 2010 % change
NON-CURRENT ASSETS 8,762.6 8,582.3 2.1%
Intangible assets 6,209.1 6,484.9 -4.3%
Property, plant and equipment 625.2 711.2 -12.1%
Investment property 104.8 98.4 6.5%
Investments accounted for using the equity method 113.2 157.7 -28.2%
Non-current financial assets 903.4 297.0 204.2%
Deferred tax assets 806.9 833.1 -3.1%
CURRENT ASSETS 4,163.5 4,020.0 3.6%
Non-current assets classified as held for sale 335.7 0.0 -
Inventories 134.2 123.6 8.6%
Trade and other receivables 2,166.6 2,129.9 1.7%
Other current financial assets 326.1 351.2 -7.1%
Other current assets 37.9 48.7 -22.2%
Cash and cash equivalents 1,163.0 1,366.6 -14.9%
TOTAL ASSETS 12,926.1 12,602.3 2.6%
EQUITY AND LIABILITIES 2011 2010 % change
EQUITY 1,977.7 2,024.8 -2.3%
EQUITY 1,555.3 1,398.4 11.2%
Share capital 59.9 59.9 -
Share premium 390.9 424.4 -7.9%
Reserves 881.2 718.5 22.6%
Profit for the year attributable to the Parent 223.3 195.6 14.2%
Valuation adjustments -339.6 -98.4 245.1%
Equity attributable to the Parent 1,215.7 1,300.0 -6.5%
Non-controlling interests 762.0 724.8 5.1%
NON-CURRENT LIABILITIES 6,956.5 6,717.5 3.6%
Grants 92.4 303.6 -69.6%
Long-term provisions 115.0 162.6 -29.3%
Non-current bank borrowings and other financial liabilities(*) 5,409.0 4,929.4 9.7%
Other non-current financial liabilities 304.6 235.3 29.5%
Deferred tax liabilities 701.6 729.0 -3.8%
Other non-current liabilities 333.9 357.6 6.6%
CURRENT LIABILITIES 3,991.9 3,860.0 3.4%Liabilities associated with non-current assets classified as held for sale 153.0 0.0 -Short-term provisions 252.1 213.5 18.1%
Current bank borrowings and other financial liabilities(*) 1,189.3 1,208.4 -1.6%
Other current financial liabilities 24.4 10.8 125.9%
Trade and other payables 1,876.4 1,975.1 -5.0%
Other current liabilities 496.7 452.2 9.8%
TOTAL EQUITY AND LIABILITIES 12,926.1 12,602.3 2.6%
(*) Including bank borrowings and bonds

167166
>> Director’s Report
2011 Obrascón Huarte Lain, S.A. and Subsidiaries
The main headings in the consolidated balance sheet at 31 December 2011 and the changes therein with
respect to 31 December 2010 are as follows:
Intangible assets: amounted to EUR 6,209.1 million, most of which (94.8%) related to concession operators.
This heading was down EUR 275.8 million, due mainly to the net effect of the following:
- The transfer from intangible assets to non-current financial assets of EUR 601.0 million corresponding
to Metro Ligero Oeste, S.A., which was classified as a financial asset since it met the conditions of the
aforementioned model.
- Net investments made during the year in infrastructure concession operators, and
- The impact of the devaluation of the currencies with which the Group operates (mainly the Mexican peso
-9.3% and the Brazilian real 8.7%).
Noteworthy due to their volume of investment at source were Concesionaria Mexiquense, S.A. de C.V., Viaducto
Bicentenario, S.A. de C.V. and the five federal toll roads in Brazil, which accounted for 60.1% of the total
intangible assets.
Non-current financial assets: have a balance at 31 December 2011 of EUR 903.4 million, of which EUR 810.8
million correspond to concession operators, which are recognised under this heading as they meet the
requirements of the financial asset model, and most notably include Metro Ligero Oeste, S.A. which accounts
for EUR 604.5 million.
Non-current assets classified as held for sale: amounted to EUR 335.7 million and related to all of the assets
of the Environmental Division, which is currently being divested.
Trade and other receivables: at 31 December 2011 the balance amounted to EUR 2,166.6 million, which
accounted for 16.8% of total assets.
Progress billings receivable and amounts to be billed for work performed represented 79.2% of the total “Trade
and Other Receivables” balance and the combined ratio of the two accounts was 4.0 months of sale, similar
to the ratio at 31 December 2010.
Other current financial assets and Cash and cash equivalents: the balances of these headings at 31 December
2011 totalled EUR 1,489.1 million, of which EUR 996.9 million related to companies without recourse and the
remaining EUR 492.2 million to companies with recourse.
Equity attributable to the Parent: amounted to EUR 1,215.7 million at 31 December 2011, representing 9.4%
of the total assets and a decrease of EUR 84.3 million with respect to 31 December 2010, due to the net effect
of the following:
- The attributable profit for 2011, which amounted to EUR 223.3 million.
- The decrease in reserves of EUR 169.3 million, arising from the translation of the financial statements
expressed in foreign currencies, due mainly to the fall in value of the Mexican peso, Brazilian real and
Chilean peso against the euro.
- A decrease of EUR 71.5 million in reserves due to the effect of the remeasurement of financial instruments.
- A reduction of EUR 48.9 million in reserves due to the dividend paid in June 2011 out of 2010 profit.
- A decrease of EUR 1.1 million in relation to treasury shares, which corresponds to 58,750 shares acquired
as a result of the share liquidity agreement entered into in February 2011.
- A decrease of EUR 16.8 million relating to other changes in reserves, due mainly to changes in the scope
of consolidation.
Minority interests stood at EUR 762.0 million at 31 December 2011 and increased by EUR 37.2 million as a
result of the net effect of:
- EUR 125.5 million of profit for the year attributable to non-controlling interests.
- A decrease of EUR 61.0 million arising in the translation of the financial statements in foreign currency.
- A decrease in reserves of EUR 10.9 million due to the effect of the remeasurement of financial instruments.
- Other decreases totalling EUR 16.4 million, due mainly to dividends paid and changes in the scope of
consolidation.
Liabilities associated with non-current assets classified as held for sale: amount to EUR 153.0 million and
relate to all of the assets of the Environmental Division, which is a business currently being divested.
Bank borrowings: The bank borrowings at 31 December 2011 compared with those at 31 December 2010 are
as follows:
Gross borrowings (1)
Millions of euros
2011 % 2010 % change (%)
Recourse borrowings 1,748.8 27% 1,693.1 28% 3.3%
Non-recourse borrowings 4,849.5 73% 4,444.7 72% 9.1%
TOTAL 6,598.3 100% 6,137.8 100% 7.5%
(1) Gross borrowings groups together non-current and current borrowings, which include bank borrowings and bonds.

169168
>> Director’s Report
2011 Obrascón Huarte Lain, S.A. and Subsidiaries
Net borrowings (1)
Millions of euros
2011 % 2010 % change (%)
Recourse borrowings 1,256.5 25% 1,173.5 27% 7.1%
Non-recourse borrowings 3,852.7 75% 3,246.4 73% 18.7%
TOTAL 5,109.2 100% 4,419.9 100% 15.6%
(1) Net borrowings comprise gross borrowings less other current financial assets and cash and cash equivalents.
Net recourse borrowings amount to EUR 1,256.5 million. Taking into account the pro forma effect of the sale
of Inima, discussed earlier, this amount is reduced to EUR 1025.5 million, representing a reduction of 13% on
the amount at the end of 2010, which signifies the achievement of the objective of reducing the Net Recourse
Borrowings to Recourse EBITDA ratio to three.
In March 2011 corporate bonds were issued amounting to EUR 425 million in order to refinance the bonds
maturing in 2012. In parallel to this transaction, a pre-cancellation offer was launched which was accepted by
56% of holders (EUR 234 million), thereby leaving just EUR 187.6 million to be settled in 2012.
Net non-recourse bank borrowings accounted for 75.4% of the total and increased by EUR 606.3 million with
respect to 31 December 2010, due to the net effect relating to the need to finance the investments made by
the concession operators, the new financing arising from the Group’s interest in OHL México S.A.B. de C.V. and
the repayments made during the period.
Other financing of particular note in 2011 was as follows:
•In April 2011 the Mexican company Grupo de Autopistas Nacionales, S.A. issued bonds amounting to MXN
1,700 million (approximately EUR 95 million) for which the date of final maturity is March 2031.
• In September 2011 OHL Concesiones, S.A. entered into a credit agreement denominated in Mexican pesos,
over a term of 3 years and for an amount equal to EUR 250.0 million. This credit is secured by the shares
that OHL Concesiones, S.A. holds in its listed subsidiary OHL México, S.A.B. de C.V., representing 51% of its
share capital. The funds arising from the transaction will be used in full by OHL Concesiones, S.A. to repay
its Parent, OHL, S.A., the existing intragroup loans.
• In September 2011 OHL Concesiones, S.A. entered into a financing agreement denominated in Mexican pesos,
over a term of 3 years and for an amount equal to EUR 100.0 million. The transaction was articulated around
an equity swap on the shares representing 6.3% of the listed subsidiary OHL México, S.A.B. de C.V., whereby
OHL Concesiones, S.A. retained both the gain on the rise in value of the shares over the term of the financing
and the option to repurchase them when the financing matures. The funds arising from the transaction will
be used in full by OHL Concesiones, S.A. to repay its Parent, OHL, S.A., the existing intragroup loans.
82.0% of the total gross bank borrowings is at long term and the remaining 18.0% at short term.
In accordance with the disclosure obligations provided for in the Parent’s bond issue agreements, in 2011
recourse EBITDA and the recourse consolidated interest expense amounted to EUR 337.0 million and EUR 129.8
million, respectively, calculated on the basis of the definitions set forth in the agreements.
CASH FLOW FROM 01/01/11 TO 31/12/11
The funds from operations (equal to profit after tax (attributable) plus depreciation and amortisation) generated
in 2011 amounted to EUR 475.7 million.
The change in current non-financial assets and liabilities amounted to EUR -64.7 million, due basically to the
reduction in the activity of the Construction Division.
The cash flow from operating activities during the period stood at EUR 411.0 million, up EUR 374.2 million on
the cash flow recognised in September 2011.
Net investment requirements amounted to EUR -1,151.2 million, due mainly to the Concessions business, as
a result of the investment commitments of the concession operators at the construction stage.
The total financing requirements for the period amounted to EUR 740.2 million, which the Group met by using
more non-recourse borrowings.
Millions of eurosCASH FLOWS 2011
EBITDA 1,219.3 Adjustments to EBITDA -743.6
Cash flows from operating activities 475.7 Changes in working capital -64.7
Cash flows from operating activities 411.0 Cash flows from investing activities -1,151.2 Changes in non-recourse borrowings 457.9 Changes in cash + non-recourse current financial assets 197.3 Changes in net non-recourse borrowings 655.2 Changes in gross recourse borrowings 77.9 Changes in cash + recourse current financial assets 7.1
Changes in net recourse borrowings 85.0 Cash flows from financing activities 740.2
171170
>> Director’s Report
2011 Obrascón Huarte Lain, S.A. and Subsidiaries
4. Backlog
At 31 December 2011, the Group’s backlog amounted to EUR 81,352.1 million.
10.9% of the total backlog related to short-term projects, with long-term projects accounting for the other 89.1%
The short-term backlog amounted to EUR 8,896.9 million, up 57.8% on the short-term backlog at 31
December 2010.
The long-term backlog amounted to EUR 72,455.2 million, down 5.1% on the long-term backlog at 31
December 2010.
Millions of euros
BACKLOG 2011 % 2010 % % changeCurrent 8,896.9 11% 5,639.4 7% 57.8%
Long term 72,455.2 89% 76,370.9 93% -5.1%
TOTAL 81,352.1 100% 82,010.3 100% -0.8%
Concessions 72,030.8 89% 76,242.4 93% -5.5%
Construction 8,740.5 11% 5,509.7 7% 58.6%
Other business activities 580.8 1% 258.2 0% 124.9%
5. Stock Market Information
Share capital and shares
At 31 December 2011, the share capital amounted to EUR 59,844,565, represented by 99,740,942 ordinary
shares of EUR 0.60 par value each, with a market price of EUR 19.380 at 31 December 2011 and a PER for 2011
of 8.7.
Share performance
In 2011 a total of 179,685,765 shares were traded on the stock markets (180.2% of the total shares admitted
for trading) with a daily average of 699,166 shares and a market depreciation of 13.2%, in line with the
performance of the Ibex 35.
Since 2008 OHL has been listed on the IBEX 35 and the FTSE4Good Ibex sustainability index. Also, since
September 2011, OHL México, S.A.B. de C.V. has been listed on the Price and Quotation Index (IPC), the principal
stock market index of the Mexican Stock Exchange (BMV).
SHARE PRICE OHL share price (euros) Annual performance
Final High Low OHL Ibex-35 I. Construction
2011 19.380 28.000 15.940 -13.2% -13.1% -6.9%
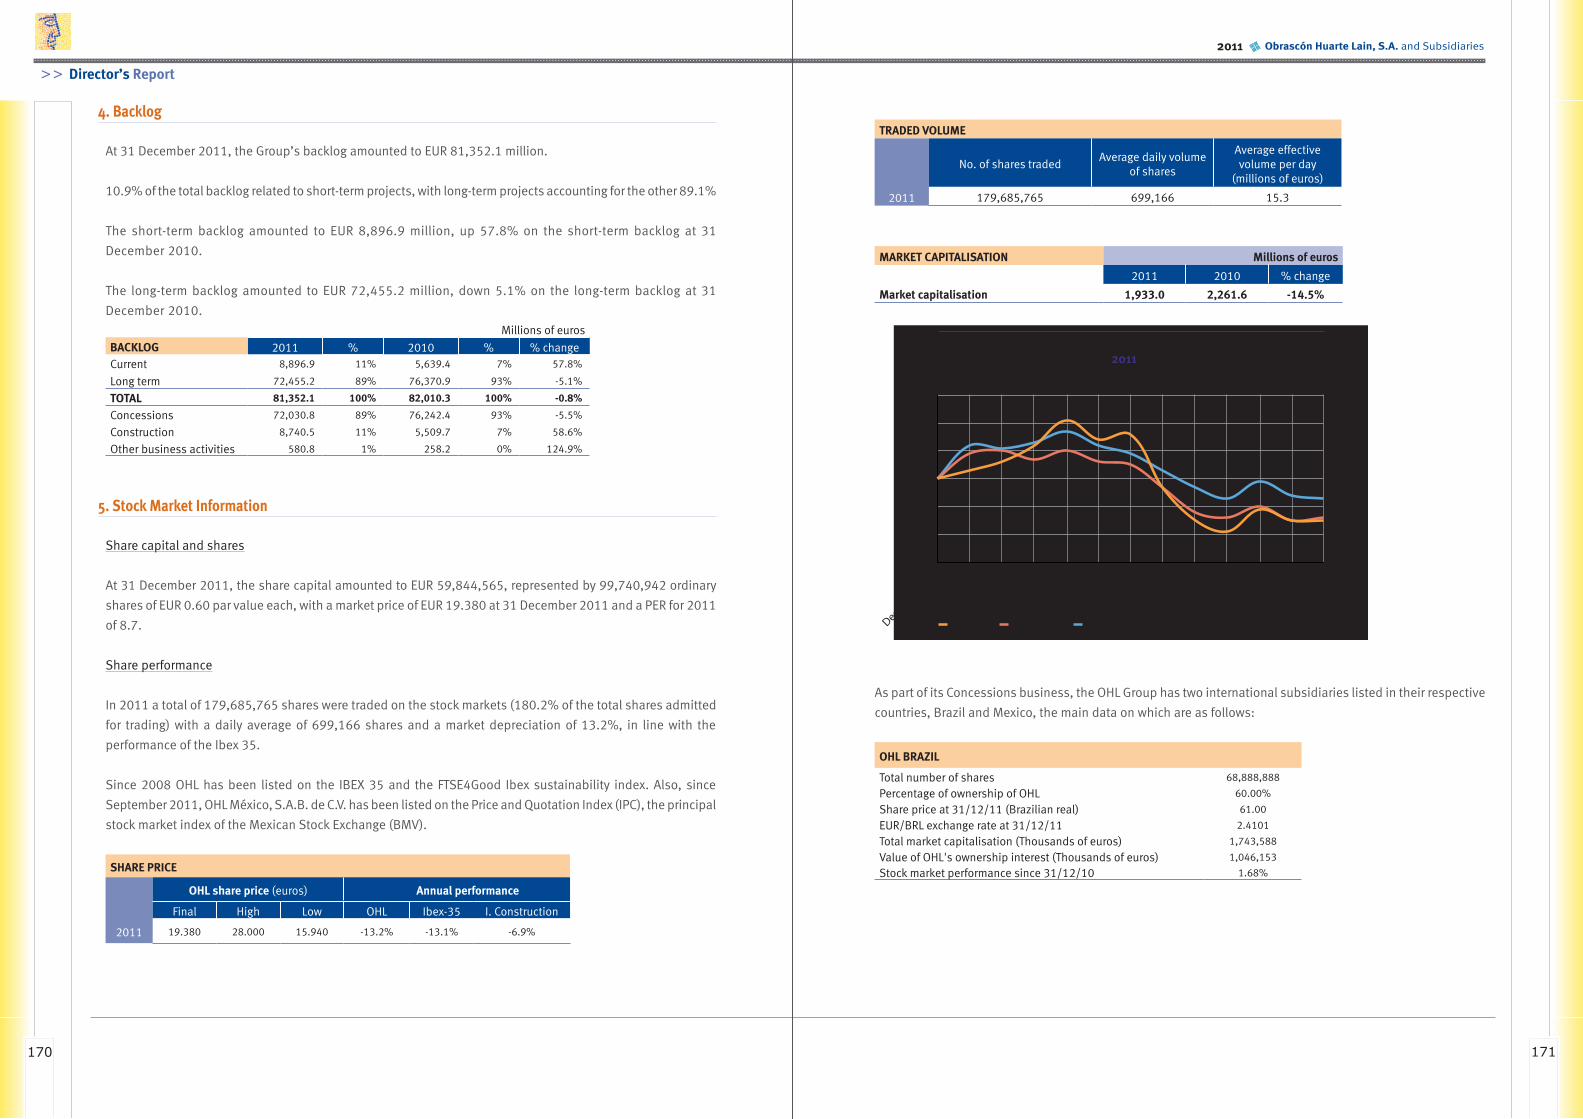
TRADED VOLUME
No. of shares tradedAverage daily volume
of shares
Average effective volume per day
(millions of euros)
2011 179,685,765 699,166 15.3
MARKET CAPITALISATION Millions of euros
2011 2010 % change
Market capitalisation 1,933.0 2,261.6 -14.5%
80
90
100
110
120
130
December 2
010
January
February
March AprilMay
June
July
August
September
October
November
December 2
011
2011
OHL Ibex 35 Construction
As part of its Concessions business, the OHL Group has two international subsidiaries listed in their respective
countries, Brazil and Mexico, the main data on which are as follows:
OHL BRAZIL
Total number of shares 68,888,888
Percentage of ownership of OHL 60.00%
Share price at 31/12/11 (Brazilian real) 61.00
EUR/BRL exchange rate at 31/12/11 2.4101
Total market capitalisation (Thousands of euros) 1,743,588
Value of OHL's ownership interest (Thousands of euros) 1,046,153
Stock market performance since 31/12/10 1.68%

173172
>> Director’s Report
2011 Obrascón Huarte Lain, S.A. and Subsidiaries
70
80
90
100
110
120
2011
OHL Brazil BovespaDecember 2
010
January
February
March AprilMay
June
July
August
September
October
November
December 2
011
OHL MEXICO
Total number of shares 1,492,788,102
Percentage of ownership of OHL 73.85%Share price at 31/12/11 (Mexican pesos) 21.62
EUR/MXN exchange rate at 31/12/11 18.0452
Total market capitalisation (Thousands of euros) 1,788,513
Value of OHL's ownership interest (Thousands of euros) 1,320,746
Stock market performance since 31/12/10 -9.08%
70
80
90
100
110
120
2011
OHL Mexico Mexican Stock ExchangeDecember 2
010
January
February
March AprilMay
June
July
August
September
October
November
December 2
011
Treasury shares
The changes in “Treasury Shares” in 2011 were as follows:
No. of shares Thousands of euros
Balance at 31 December 2010 - -Purchases 5,712,385 127,035Sales (5,653,635) (125,901)
Balance at 31 December 2011 58,750 1,134
6. Development
In 2011 the Group invested EUR 3,768 thousand in development projects and incurred expenditure of EUR
1,837 thousand. Also, EUR 21,945 thousand relating to research and development projects were capitalised
to “Other Intangible Assets” in the consolidated balance sheet at 31 December 2011.
7. Main Risks and Uncertainties
In view of its activities, the Group is exposed to various financial risks.
The financial risks mainly affect the obtainment of the necessary financing when required at a reasonable cost
and the maximisation of available funds. The most significant risks are as follows:
- Interest rate risk
- Foreign currency risk
- Credit risk
- Liquidity risk
- Risk relating to financial instruments associated with the Parent’s shares.
Interest rate risk
Interest rate fluctuations change the future flows from assets and liabilities tied to floating interest rates.
This interest rate risk is particularly important in relation to the financing of infrastructure projects and other
projects in which in which project profitability depends on possible changes in interest rates because it is
directly linked to project cash flows.
Based on the Group’s estimates of the trend in interest rates and of debt structure targets, hedging transactions
are carried out by arranging derivatives that mitigate these risks and a sensitivity analysis is conducted in this
connection.

175174
>> Director’s Report
2011 Obrascón Huarte Lain, S.A. and Subsidiaries
Foreign currency risk
The Group operates in the international market and, therefore, is exposed to foreign currency risk on the
transactions performed by it in foreign currencies.
The foreign currency risks basically arise on:
- Debt denominated in foreign currencies arranged by the Group companies.
- Payments to be made in international markets for procurements or non-current assets.
- Collections arising on projects tied to currencies other than the functional currency of the Parent or the
subsidiaries.
- Investments in foreign operations.
In order to mitigate foreign currency risk, the Group arranges foreign currency derivatives and foreign currency
hedges to hedge significant future transactions and cash flows, in keeping with the acceptable risk limits.
Also, the net assets relating to net investments in foreign operations with a functional currency other than the
euro are exposed to the risk of exchange rate fluctuations on the translation of the financial statements of these
foreign operations on consolidation.
On other occasions, non-current assets denominated in currencies other than the euro are financed in that
same currency with a view to creating a natural hedge.
Credit risk
Credit risk is the risk that a counterparty to a contract does not comply with its contractual obligations, giving
rise to a loss.
The Group has adopted a policy of only trading with solvent third parties and obtaining sufficient guarantees
to mitigate the risk of incurring losses in the event of non-compliance. The Group obtains information on its
counterparty through independent company valuation agencies, other public sources of financial information
or the information it obtains from its own relationships with customers and third parties.
The Group’s financial assets exposed to credit risk are:
- Non-current financial assets
- Hedging instruments
- Trade and other receivables
- Current financial assets
- Financial assets included in “Cash and Cash Equivalents”.
The balances of these items constitute the Group’s total exposure to credit risk.
The credit risk of hedging instruments with a positive fair value is limited by the Group, since derivatives are
arranged with highly solvent counterparties with high credit ratings and no counterparty accounts for a significant
percentage of the total credit risk.
Liquidity risk
The liquidity risk arising from the financing requirements of the divisions due to timing mismatches between
liquidity needs and the inflow of funds is managed by the Group by maintaining the appropriate level of cash
and marketable securities as well as by arranging and maintaining sufficient lines of financing.
In order to improve this liquidity position, the Group takes measures in relation to:
- Trade and other receivables, actively managing collections from customers.
- Optimisation of all its companies’ financial position through ongoing monitoring of cash projections.
- Management of the arrangement of lines of financing through capital markets.
The repayment schedule at 31 December 2011 , of which EUR 1,189,358 thousand matures in 2012, is presented
by the Group in Note 3.17.
Risk relating to financial instruments associated with the Parent’s shares
In 2007 the Group arranged an equity swap tied to the Parent’s share price in order to hedge the potential loss
that might arise from the exercise of the options under the incentive plan approved by the Parent’s Board of
Directors that year. Since the plan initially approved was amended in 2010, the Group terminated the swap
early and arranged a new swap tied to the Parent’s share price in order to hedge the potential loss that might
arise from the exercise of the options under the amended incentive plan. With respect to the equity swaps tied
to the price of the treasury shares, the Group has a commitment to pay or receive the result of the change in
the share price with respect to the reference price until the expiry date of the derivative and to pay a floating
interest rate over the term of the swap.

177176
>> Director’s Report
2011 Obrascón Huarte Lain, S.A. and Subsidiaries
8. Events After the Reporting Period
On 15 March 2012, the Parent successfully completed a straight bond issue amounting to EUR 300 million,
which matures in 2020. The bonds were issued at par and earn an annual rate of interest of 7.625% payable
every six months. The last date of issue and payment therefor took place on 27 March 2012.
EUR 176,250 thousand of the proceeds from the bond issue were used to repurchase a portion of the bonds
issued in 2010, maturing in 2015, which were the subject of the repurchase offer announced.
9. Outlook
The recovery of the Spanish economy will continue to be weak in the short and medium term and GDP is
expected to end 2011 with growth of around 0.7%. The high unemployment rate will hinder the recovery of
private consumption, and this, together with the adjustments in the property market and cutbacks in funding
of public works, will keep domestic demand down. Other factors that will limit growth must also be considered
such as dependence on external financing and higher borrowing costs.
The growth prospects for the first two quarters of 2012 are negative, levelling off in the second half of the year.
Bearing this in mind, GDP growth is expected to be negative in 2012.
10. Outlook for the Near Future
As a result of the internationalisation and diversification strategy that began in 2002, today OHL is a large
international concessions and construction group that boasts a significant position worldwide and a notable
presence in expanding markets. Of the Group’s total EBITDA generated outside Spain, Brazil and Mexico account
for 73% and 89%, respectively.
This position was achieved as a result of a process consisting of internationalisation, based at all times on
criteria of prudence, and diversification focused on construction-related businesses, and has given rise to
annual compound growth during the last 10 years of 11.9% in sales, 23.1% in EBITDA, 20.4% in net profit
and 28.2% in the total backlog. It should be noted that this growth was achieved while adhering at all times
to policies of financial discipline and security, and obtaining the support throughout the process not only from
its shareholders, but also from various players in the financial services industry.
The Concessions business is currently the Group’s main activity, accounting for 77% of EBITDA. OHL today ranks
eighth among the leading infrastructure operators worldwide (according to the Public Works Financing ranking)
and first in Latin America. The Group has a portfolio of 28 top concessions, of which 23 are motorways (4,417
km), 2 are railways, 2 are ports and 1 an airport. It also has 2 companies listed on the Brazil and Mexico stock
markets with a market value at year-end of around EUR 2,400 million. OHL Concesiones is today organically
and financially independent and capable of financing its own growth. It has a presence in Mexico, Brazil, Chile,
Peru, India and Spain and, in the future, provided the Group’s financing and contract security standards are
met, this list could include countries such as the US, Colombia and China. With respect to returns and foreign
currency hedges, the same selective policies will continue to apply, targeting a return of more than 15% in euros
for shareholders and the financing of concessions without recourse to the Group in local currency.
The Group’s construction business also ranked very highly internationally and features among the 20 leading
contractors. It is also ranked seventh in the transport segment (according to Engineering News Record). This year
was marked by the integration of the Spanish and international divisions and by the huge success in terms of the
major international contracts awarded including, inter alia, the extension of the Toronto underground railway,
the CHUM Hospital in Montreal, an urban viaduct in Kuwait, the Bosphorus tunnels in Turkey, the high-speed rail
link between Mecca and Medina in Saudi Arabia and the Urals railway line in Russia. All the major contracts are
closely linked to the Group’s specialist areas in the hospital and railway segments, which ensures significant
future growth in these businesses. However, these contracts will need time before they start to have an impact
on the income statement since they have long periods of execution (between three and five years) and most
include a design phase that can last between a year and a year and a half. As a result of all of the foregoing,
the construction backlog ended 2011 with EUR 8,741 million, which is equal to around three years of sales.
With regard to “Other Business Activities”, at the beginning of the year OHL stated its intention to sell off its
non-strategic assets, more specifically Inima, the head of its environmental business. In November 2011 a
purchase and sale agreement was entered into which will take effect in early 2012 and the company will then
be classified as a discontinued operation. Both the Industrial and Development businesses are expected to
grow in the future.
OHL also has a privileged position financially as a result of:
- Substantial presence in the capital markets, with shares listed on three stock markets (Spain, Brazil and
Mexico), with majority ownership interests in the listed entities OHL Brasil (60%) and OHL México (74%),
and three bond issues listed on the London Stock Exchange.
- Excellent reputation and unhindered access to bank, corporate and project financing as well as to the
capital markets.
- Committed to policies to maintain financial discipline. In this regard, the year ended successfully once again
with a net recourse borrowing to recourse EBITDA ratio of ≤ 3, having ended 2010 at 3.5, and the first steps
were taken to reduce this even further in 2012 to ≤ 2.
- Significant support from the principal shareholder.
- Proven capacity to capitalise on the value generated in Concessions: admission to listing of OHL Brasil
(August 2005) and OHL México (November 2010).

179178
>> Director’s Report
2011 Obrascón Huarte Lain, S.A. and Subsidiaries
Lastly, in relation to its corporate strategy, the Group continued to place special emphasis on boosting sustainable
development and fostering R&D+i activities from its privileged position in terms of the design and organisation
of its corporate governance, while bolstering its human resources and applied research policies and complying
at all times with the related rules and recommendations.
11. Proposed Distribution of Profit and Dividend
The distribution of the profit for 2011 that the directors of Obrascón Huarte Lain, S.A. will propose for approval
by the shareholders at the Annual General Meeting is as follows:
Thousands of euros
2011 profit 50,467
Distribution:
Dividends 50,467
The directors of Obrascón Huarte Lain, S.A. will propose to the shareholders at the Annual General Meeting
the payment of a maximum total gross dividend of EUR 55,825 thousand, equal to EUR 0.5597 per share, with
a charge to:
Thousands of euros
2011 profit 50,467
Share premium 5,358
Total dividend 55,825
The distribution of profit proposed by the directors does not include any appropriation to the legal reserve, since the stipulated level had been reached in prior years.


![[Ignacio Huarte] Guías de Ayuda Para Hacer Los Ej(BookZZ.org)](https://img.dokumen.tips/doc/110x75/563dbb95550346aa9aae7675/ignacio-huarte-guias-de-ayuda-para-hacer-los-ejbookzzorg.jpg)