Embed Size (px)
Citation preview


DIRECTORY
Directors
Padam R Lala - ChairmanSurendra K PatelKaliopate TavolaIowane NaiveliNouzab FareedMalakai Naiyaga
Company Secretaries
Jayesh PatelDeepak Rathod
Auditors
BDOChartered AccountantsSuva
Solicitors
Sherani & CompanyBarristers and SolicitorsSuva
Bankers
Australia & New Zealand Banking Group LimitedWestpac Banking Corporation
Registered Office
RB Patel CentrePoint BuildingRatu Dovi RoadLaucala Beach Estate,Nasinu.
CONTENTS
Page No.
Chairman’s Report 2-3
Corporate Governance 4
Directors’ Report 5-7
Statement by Directors 8
Independent Auditors’ Report 9
Statement of Profit or Lossand other Comprehensive Income 10
Statement of Financial Position 11
Statement of Changes in Equity 12
Statement of Cash Flows 13
Notes to the Financial Statements 14-40
Additional Information - SPSE Listing Rules 41-42
Graphical Analysis of Financial Data 43-44
RB PATEL GROUP LTDANNUAL REPORT 2014
2
CHAIRMAN’S REPORT
It gives me great pleasure to present the company’s Annual Report for 2014 to you the shareholders. The year has been disappointing but satisfying and it is pleasing to report to you the results for the year ended 30 June 2014
Financial Performance
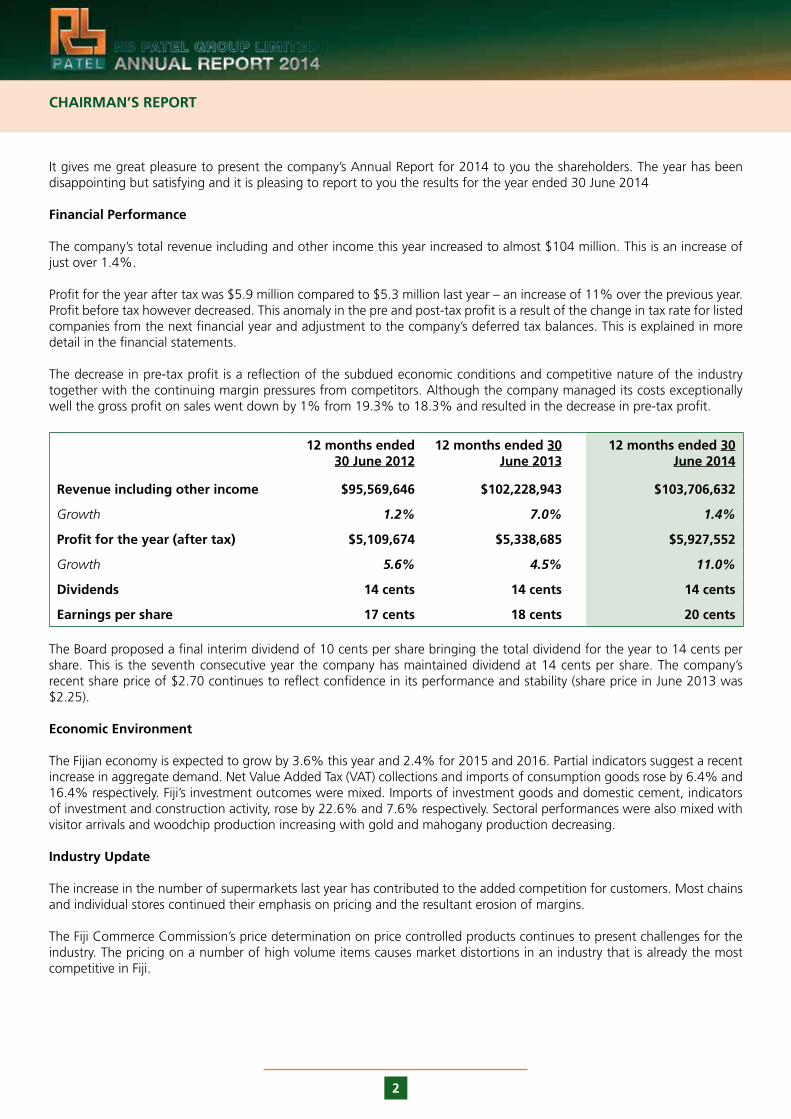
The company’s total revenue including and other income this year increased to almost $104 million. This is an increase of just over 1.4%.
Profit for the year after tax was $5.9 million compared to $5.3 million last year – an increase of 11% over the previous year. Profit before tax however decreased. This anomaly in the pre and post-tax profit is a result of the change in tax rate for listed companies from the next financial year and adjustment to the company’s deferred tax balances. This is explained in more detail in the financial statements.
The decrease in pre-tax profit is a reflection of the subdued economic conditions and competitive nature of the industry together with the continuing margin pressures from competitors. Although the company managed its costs exceptionally well the gross profit on sales went down by 1% from 19.3% to 18.3% and resulted in the decrease in pre-tax profit.
12 months ended 30 June 2012
12 months ended 30 June 2013
12 months ended 30 June 2014
Revenue including other income $95,569,646 $102,228,943 $103,706,632
Growth 1.2% 7.0% 1.4%
Profit for the year (after tax) $5,109,674 $5,338,685 $5,927,552
Growth 5.6% 4.5% 11.0%
Dividends 14 cents 14 cents 14 cents
Earnings per share 17 cents 18 cents 20 cents
The Board proposed a final interim dividend of 10 cents per share bringing the total dividend for the year to 14 cents per share. This is the seventh consecutive year the company has maintained dividend at 14 cents per share. The company’s recent share price of $2.70 continues to reflect confidence in its performance and stability (share price in June 2013 was $2.25).
Economic Environment
The Fijian economy is expected to grow by 3.6% this year and 2.4% for 2015 and 2016. Partial indicators suggest a recent increase in aggregate demand. Net Value Added Tax (VAT) collections and imports of consumption goods rose by 6.4% and 16.4% respectively. Fiji’s investment outcomes were mixed. Imports of investment goods and domestic cement, indicators of investment and construction activity, rose by 22.6% and 7.6% respectively. Sectoral performances were also mixed with visitor arrivals and woodchip production increasing with gold and mahogany production decreasing.
Industry Update
The increase in the number of supermarkets last year has contributed to the added competition for customers. Most chains and individual stores continued their emphasis on pricing and the resultant erosion of margins.
The Fiji Commerce Commission’s price determination on price controlled products continues to present challenges for the industry. The pricing on a number of high volume items causes market distortions in an industry that is already the most competitive in Fiji.
3
CHAIRMAN’S REPORT (CONT’D)
Expansion and Growth
Construction of the company’s Cinema Multiplex at its JetPoint Complex in Martintar, Nadi is progressing well although there have been some delays. The construction is expected to be completed by the end of 2014. The structure of the management company for the operation of the multiplex is also in its final stages.
During the year the company partenered with Sunergise (Fiji) Limited and installed a photovoltaic solar system at its JetPoint supermarket in Nadi. The system has to date provided a saving in carbon emission of 85.2 tonnes which is equivalent to the use of 30 tonnes of diesel!
A similar system has been installed at the WestPoint supermarket in Lautoka. The systems supply a significant amount of the daytime energy of the supermarkets.
The company closed its Waimanu Road supermarket in May 2014 due to the significant shift of customers from the store to our MarketPoint supermarket opposite the Suva municipal markets.
The search for new sites for stores continues keeping in mind that these should add value for our shareholders. Further property developments on the JetPoint and HarbourPoint sites are being considered.
Customers and Service
We continue to demonstrate that “We make it easy!” to our customers through our employees together with our core commitment to deliver “value for money” in all our stores. We also continue to seek out new products internationally that meet these aims.
Future Outlook
Your directors and management have continued to look for growth opportunities. The concerns of doing business in Fiji have increased and continue to do so due to cost structures. New legislations, new and increased licence fees and other costs together with the implementation of new OHS, NFA and health regulations continue to test our ability to maintain costs within the overall growth parameters of businesses. With the upcoming general elections promising a democratically elected government there is optimism for increased confidence in the investment environment.
Staff and Management
I take this opportunity to thank the staff and management for their efforts during the year. The results would not have been possible without their joint efforts.
Finally I would like to thank all my fellow directors for all their effort, dedication and counsel over the year.
............................................Padam Raj LalaChairman

4
CORPORATE GOVERNANCE
The RB Patel Group Limited (RBG) Board acknowledges the requirement to report on the company’s Corporate Governance Code under the principles and guidelines provided by the Capital Markets Unit of the Reserve Bank of Fiji.
In line with the 10 core principles and the best practice recommendations RB Patel Group Limited has developed policies to improve the standard of Corporate Governance in the company. These policies are reviewed periodically to incorporate new developments in good corporate governance priniciples.
Principle RBG comments
Establish clear responsibilities for board oversight
The RBG Memorandum & Articles of Association set out the powers and duties of directors in terms of managing the company effectively and efficiently. The company continuously reviews its policy guidelines to strengthen the oversight role.
Constitute an effective Board
Directors are selected for their experience and competencies and are inducted and evaluated on the basis of their suitability for the Board. The board has adequate independent directors.
Appointment of a Chief Executive Officer
RBG has a Management Agreement with FHL Retailing Limited (the holding company) under which operations of the company are managed. Executive appointments are made under this framework by the Board.
Board and Company Secretary
The Company Secretaries maintain a close link with the Board and executive officers of the company to ensure all duties and responsibilities are effectively discharged.
Timely and balanced reporting
Board meetings are held quarterly to update directors on the company’s performance and to review and provide approvals and confirmations of major aspects of the operations of the company.
Promote ethical and responsible decision-making
RBG guides its directors and other officers through its policies and code of conduct in making ethical and responsible decisions.
Register of interests Directors and officers of the company are obliged to disclose any conflicts of interest that may arise in the course of the business.
Respect the rights of shareholders
Shareholders are encouraged to participate at the Annual General Meeting of the company. The company’s Annual Report is forwarded to shareholders so as to allow adequate time to review the performance of the company and seek clarification on any aspects of the company’s performance for the year and forecasts for the future.
Accountability and audit RBG is audited annually by independent auditors who provide their report to the shareholders. Regular internal audits are also conducted and reported in line with established company procedures.
Recognise and manage risk
RBG has established risk management procedures and practices to identify and manage operational and industry risks together with appropriate controls and procedures to manage these risks.
5
DIRECTORS’ REPORT
In accordance with a resolution of the board of directors, the directors herewith submit the statement of financial position of RB Patel Group Limited (the company) as at 30 June 2014, the related statement of profit or loss and other comprehensive income, statement of changes in equity and statement of cash flows for the year then ended and report as follows:
Directors
The names of the directors in office at the date of this report are:
Padam Raj Lala - Chairman Surendra Kumar Patel Iowane Naiveli Kaliopate Tavola Nouzab Fareed Malakai Naiyaga
Principal Activities
The principal activities of the company during the year were that of retailing and wholesaling of general merchandise, owners and administrators of properties and equity investments. The company operates supermarket stores in Nausori, Nakasi, Nasinu, Suva, Sigatoka, Nadi, Lautoka, Labasa and Lami.
There were no significant changes in the nature of these activities during the financial year.
Results 2014 2013
$ $
The results of the company are summarized below:
Profit before income tax 5,919,126 6,364,222
Income tax expense before adjustment for change in future income tax rate from 18.5% to 10% (2013: 20% to 18.5%) (1,106,597) (1,211,768)
Adjustment to deferred tax balances due to change in future income tax rate from 18.5% to 10% (2013: 20% to 18.5%) 1,115,023 186,231
Income tax benefit / (expense) 8,426 (1,025,537)
Profit after income tax 5,927,552 5,338,685
Dividends
During the year, the company declared and paid an interim dividend of $1,200,000 (2013: $1,200,000). Furthermore, during June 2014, the directors proposed the payment of a final interim dividend of $3,000,000 (2013: Proposed dividends of $3,000,000) from the profits for the year ended 30 June 2014.
Total dividends declared and paid or proposed for the year ended 30 June 2014 amounted to $4,200,000 (2013: $4,200,000).
Reserves
It is proposed that no amounts be transferred to reserves within the meaning of the Seventh Schedule of the Companies Act, 1983.
6
DIRECTORS’ REPORT (CONT’D)
Bad and Doubtful Debts
Prior to the completion of the company’s financial statements, the directors took reasonable steps to ascertain that action has been taken in relation to writing off of bad debts and the making of allowance for doubtful debts. In the opinion of directors, adequate allowance has been made for doubtful debts.
As at the date of this report, the directors are not aware of any circumstances, which would render the amount written off for bad debts, or the allowance for doubtful debts in the company, inadequate to any substantial extent.
Current and Non-current Assets
Prior to the completion of the financial statements of the company, the directors took reasonable steps to ascertain whether any current and non-current assets were unlikely to realise in the ordinary course of business their values as shown in the accounting records of the company. Where necessary, these assets have been written down or adequate allowance has been made to bring the values of such assets to an amount that they might be expected to realise.
As at the date of this report, the directors are not aware of any circumstances, which would render the values attributed to current and non-current assets in the company’s financial statements misleading.
Unusual Transactions
In the opinion of the directors, the results of the operations of the company during the financial year were not substantially affected by any item, transaction or event of a material unusual nature, nor has there arisen between the end of the finan-cial year and the date of this report, any item, transaction or event of a material unusual nature, likely in the opinion of the directors, to affect substantially the results of the operations of the company in the current financial year.
Significant Events During the Year
During the year:
(i) The company commenced construction of a Cinema Multiplex at Martintar, Nadi. For this purpose, the company has obtained a loan amounting to $5 million from Australia and New Zealand Banking Corporation Limited. Refer note 15(c).
(ii) The company engaged Sunergise (Fiji) Limited to install and rent to the company a 80KW photovoltaic solar system at its JetPoint supermarket in Martintar, Nadi. The installation was completed in October 2013 and the solar system supplies a significant amount of the daytime energy of the supermarket.
(iii) The company announced the closure of its Waimanu Road supermarket store in May 2014.
Events Subsequent to Balance Date
No matter or circumstances have arisen since the end of the financial year which significantly affected or may significantly affect the operations of the company, the results of those operations, or the state of affairs of the company in future financial years.

7
DIRECTORS’ REPORT (CONT’D)
Other Circumstances
As at the date of this report:
(i) no charge on the assets of the company has been given since the end of the financial year to secure the liabilities of any other person;
(ii) no contingent liabilities have arisen since the end of the financial year for which the company could become liable; and
(iii) no contingent liabilities or other liabilities of the company has become or is likely to become enforceable within the period of twelve months after the end of the financial year which, in the opinion of the directors, will or may substantially affect the ability of the company to meet its obligations as and when they fall due.
As at the date of this report, the directors are not aware of any circumstances, which would render the amount written off for bad debts, or the allowance for doubtful debts in the company, inadequate to any substantial extent.
Directors’ Benefits
Since the end of the previous financial year, no director has received or become entitled to receive a benefit (other than those disclosed in the financial statements as emoluments) by reason of a contract made by the company or by a related corporation with the director or with a firm of which he is a member, or with a company in which he has a substantial financial interest.
For and on behalf of the board and in accordance with a resolution of the directors.
Dated this 4th day of August 2014.
............................................. .............................................Director Director

8
STATEMENT BY DIRECTORS
In accordance with a resolution of the board of directors of RB Patel Group Limited, we state that in the opinion of the directors:
(i) the accompanying statement of profit or loss and other comprehensive income of the company is drawn up so as to give a true and fair view of the results of the company for the year ended 30 June 2014;
(ii) the accompanying statement of changes in equity of the company is drawn up so as to give a true and fair view of the changes in equity of the company for the year ended 30 June 2014;
(iii) the accompanying statement of financial position of the company is drawn up so as to give a true and fair view of the state of affairs of the company as at 30 June 2014;
(iv) the accompanying statement of cash flows of the company is drawn up so as to give a true and fair view of the cash flows of the company for the year ended 30 June 2014;
(v) the financial statements have been prepared in accordance with International Financial Reporting Standards;
(vi) at the date of this statement, there are reasonable grounds to believe that the company will be able to pay its debts as and when they fall due; and
(vii) all related party transactions have been adequately recorded in the books of the company.
For and on behalf of the board and in accordance with a resolution of the directors.
Dated this 4th day of August 2014.
............................................. .............................................Director Director
Tel: +679 331 4300Fax: +679 330 1841Email: [email protected] in Suva and Lautoka
BDOChartered AccountantsLevel 10, FNPF Place343 Victoria ParadeGPO Box 855Suva, Fiji
BDO, Chartered Accountants, a Fiji Partnership, is a member firm of BDO International Limited, a UK company limited by guarantee, and forms part of theinternational BDO network of independent member firms.
BDO is the brand name for the BDO network and for each of the BDO Member Firms.
INDEPENDENT AUDITORS’ REPORT
To the members of RB Patel Group Limited
We have audited the accompanying financial statements of RB Patel Group Limited (the company), which comprise the statement of financial position as at 30 June 2014, and the statement of profit or loss and other comprehensive income, statement of changes in equity and statement of cash flows for the year then ended, and a summary of significant accounting policies and other explanatory information as set out on pages 10 to 40.
Director’s and Management’s Responsibility for the Financial Statements
Directors and management are responsible for the preparation of financial statements that give a true and fair view in accordance with International Financial Reporting Standards and with the requirements of the Companies Act, 1983, and for such internal control as the directors and management determines is necessary to enable the preparation of financial statements that are free from material misstatement, whether due to fraud or error.
Auditor’s Responsibility
Our responsibility is to express an opinion on these financial statements based on our audit. We conducted our audit in accordance with International Standards on Auditing. Those standards require that we comply with ethical requirements and plan and perform the audit to obtain reasonable assurance about whether the financial statements are free from material misstatement.
An audit involves performing procedures to obtain audit evidence about the amounts and disclosures in the financial statements. The procedures selected depend on the auditor’s judgment, including the assessment of the risks of material misstatement of the financial statements, whether due to fraud or error. In making those risk assessments, the auditor considers internal control relevant to the entity’s preparation and fair presentation of the financial statements in order to design audit procedures that are appropriate in the circumstances, but not for the purpose of expressing an opinion on the effectiveness of the entity’s internal control. An audit also includes evaluating the appropriateness of accounting policies used and the reasonableness of accounting estimates made by management, as well as evaluating the overall presentation of the financial statements.
We believe that the audit evidence we have obtained is sufficient and appropriate to provide a basis for our audit opinion.
Opinion
In our opinion, the accompanying financial statements give a true and fair view, in all material respects, of the financial position of the company as at 30 June 2014, and its financial performance, cash flows and changes in equity for the year then ended in accordance with International Financial Reporting Standards.
Report on other legal and regulatory requirements
In our opinion:
a) proper books of account have been kept by the company, so far as it appears from our examination of those books;
b) the financial statements are in agreement with the books of account; and
c) to the best of our information and according to the explanations given to us, the financial statements give the information required by the Companies Act, 1983 in the manner so required.
We have obtained all the information and explanations which, to the best of our knowledge and belief, were necessary for the purposes of our audit.
SUVA, FIJI BDO4 AUGUST 2014 CHARTERED ACCOUNTANTS
10
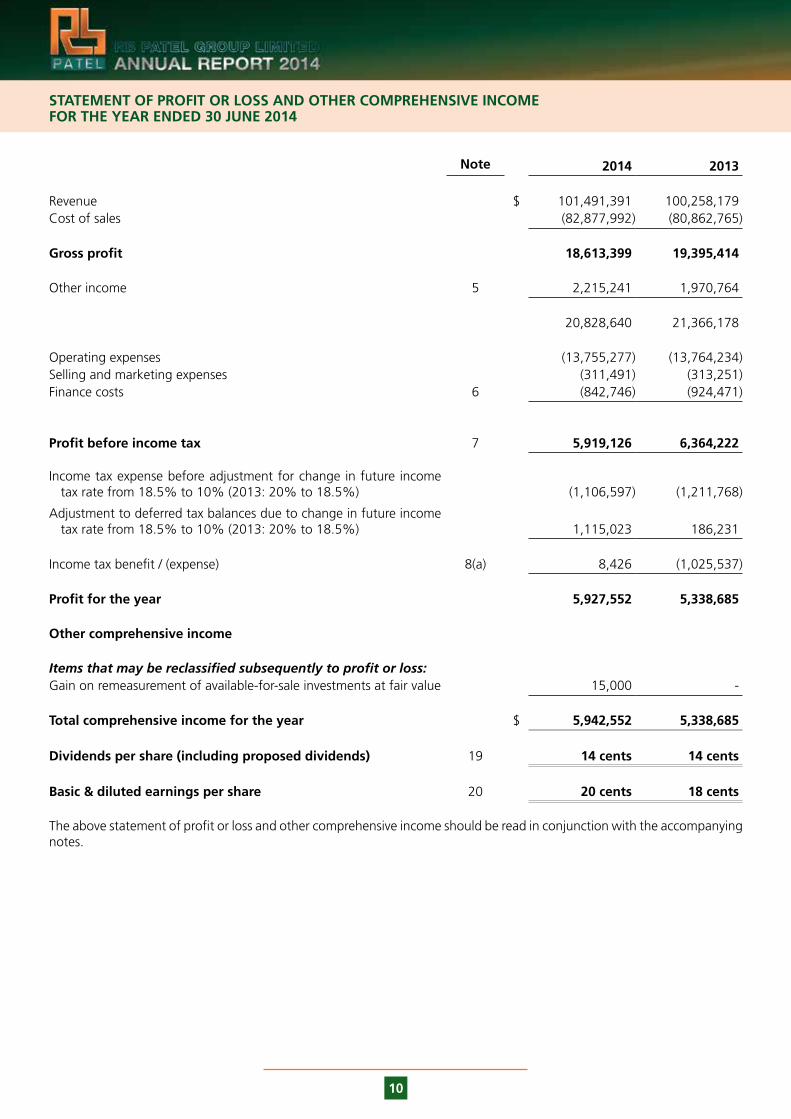
STATEMENT OF PROFIT OR LOSS AND OTHER COMPREHENSIVE INCOME FOR THE YEAR ENDED 30 JUNE 2014
Note 2014 2013
Revenue $ 101,491,391 100,258,179Cost of sales (82,877,992) (80,862,765)
Gross profit 18,613,399 19,395,414
Other income 5 2,215,241 1,970,764
20,828,640 21,366,178
Operating expenses (13,755,277) (13,764,234)Selling and marketing expenses (311,491) (313,251)Finance costs 6 (842,746) (924,471)
Profit before income tax 7 5,919,126 6,364,222
Income tax expense before adjustment for change in future income tax rate from 18.5% to 10% (2013: 20% to 18.5%) (1,106,597) (1,211,768)
Adjustment to deferred tax balances due to change in future income tax rate from 18.5% to 10% (2013: 20% to 18.5%) 1,115,023 186,231
Income tax benefit / (expense) 8(a) 8,426 (1,025,537)
Profit for the year 5,927,552 5,338,685
Other comprehensive income
Items that may be reclassified subsequently to profit or loss:Gain on remeasurement of available-for-sale investments at fair value 15,000 -
Total comprehensive income for the year $ 5,942,552 5,338,685
Dividends per share (including proposed dividends) 19 14 cents 14 cents
Basic & diluted earnings per share 20 20 cents 18 cents
The above statement of profit or loss and other comprehensive income should be read in conjunction with the accompanying notes.
11
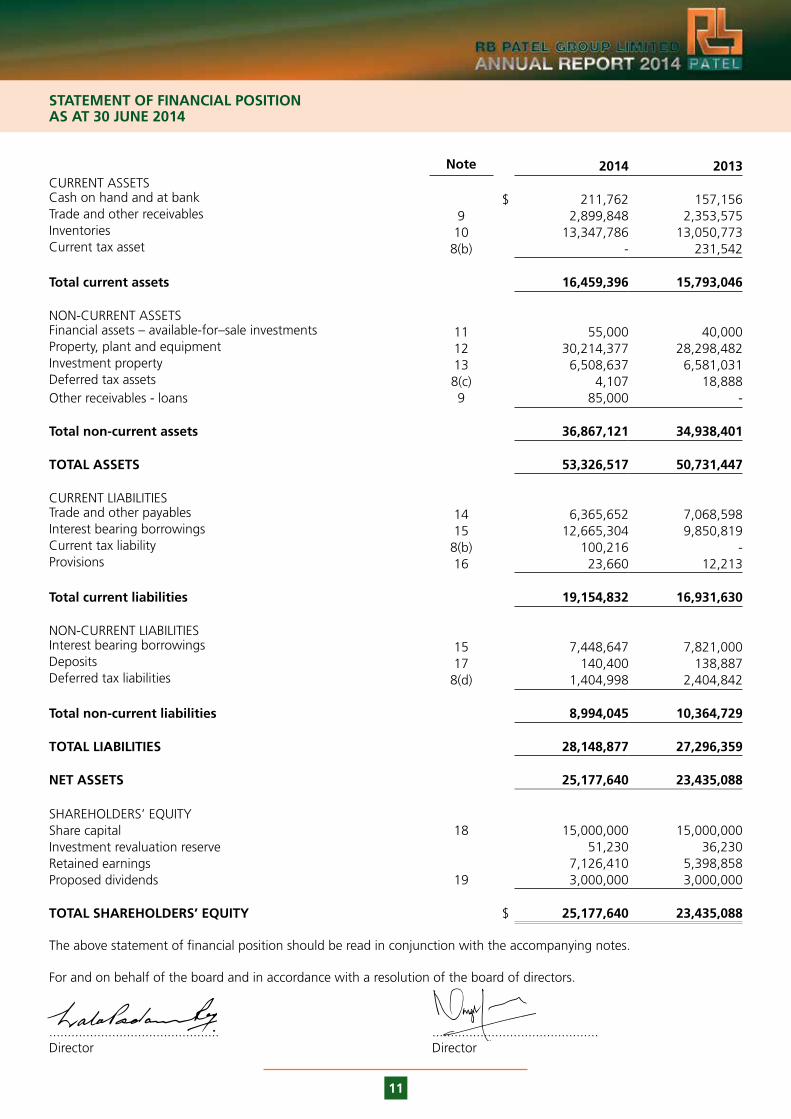
STATEMENT OF FINANCIAL POSITION AS AT 30 JUNE 2014
Note 2014 2013CURRENT ASSETSCash on hand and at bank $ 211,762 157,156Trade and other receivables 9 2,899,848 2,353,575Inventories 10 13,347,786 13,050,773Current tax asset 8(b) - 231,542
Total current assets 16,459,396 15,793,046
NON-CURRENT ASSETSFinancial assets – available-for–sale investments 11 55,000 40,000Property, plant and equipment 12 30,214,377 28,298,482Investment property 13 6,508,637 6,581,031Deferred tax assets 8(c) 4,107 18,888Other receivables - loans 9 85,000 -
Total non-current assets 36,867,121 34,938,401
TOTAL ASSETS 53,326,517 50,731,447
CURRENT LIABILITIESTrade and other payables 14 6,365,652 7,068,598Interest bearing borrowings 15 12,665,304 9,850,819Current tax liability 8(b) 100,216 -Provisions 16 23,660 12,213
Total current liabilities 19,154,832 16,931,630
NON-CURRENT LIABILITIESInterest bearing borrowings 15 7,448,647 7,821,000Deposits 17 140,400 138,887Deferred tax liabilities 8(d) 1,404,998 2,404,842
Total non-current liabilities 8,994,045 10,364,729
TOTAL LIABILITIES 28,148,877 27,296,359
NET ASSETS 25,177,640 23,435,088
SHAREHOLDERS’ EQUITYShare capital 18 15,000,000 15,000,000Investment revaluation reserve 51,230 36,230Retained earnings 7,126,410 5,398,858Proposed dividends 19 3,000,000 3,000,000
TOTAL SHAREHOLDERS’ EQUITY $ 25,177,640 23,435,088
The above statement of financial position should be read in conjunction with the accompanying notes.
For and on behalf of the board and in accordance with a resolution of the board of directors.
.............................................. .............................................Director Director

12
STATEMENT OF CHANGES IN EQUITYFOR THE YEAR ENDED 30 JUNE 2014
Share Capital
Investment Revaluation
Reserve
Retained Earnings
Proposed Dividends
Total
$ $ $ $ $
Balance at 30 June 2012 15,000,000 36,230 4,260,173 - 19,296,403
Profit for the year - - 5,338,685 - 5,338,685
Dividends paid (note 19) - - (1,200,000) - (1,200,000)
Proposed dividends (note 19) - - (3,000,000) 3,000,000 -
Other comprehensive income for the year - - - - -
Balance at 30 June 2013 15,000,000 36,230 5,398,858 3,000,000 23,435,088
Profit for the year - - 5,927,552 - 5,927,552
Dividends paid (note 19) - - (1,200,000) (3,000,000) (4,200,000)
Proposed dividends (note 19) - - (3,000,000) 3,000,000 -
Other comprehensive income for the year:
Gain on remeasurement of available-for-sale investments at fair value - 15,000 - - 15,000
Balance at 30 June 2014 15,000,000 51,230 7,126,410 3,000,000 25,177,640
The above statement of changes in equity should be read in conjunction with the accompanying notes.
13
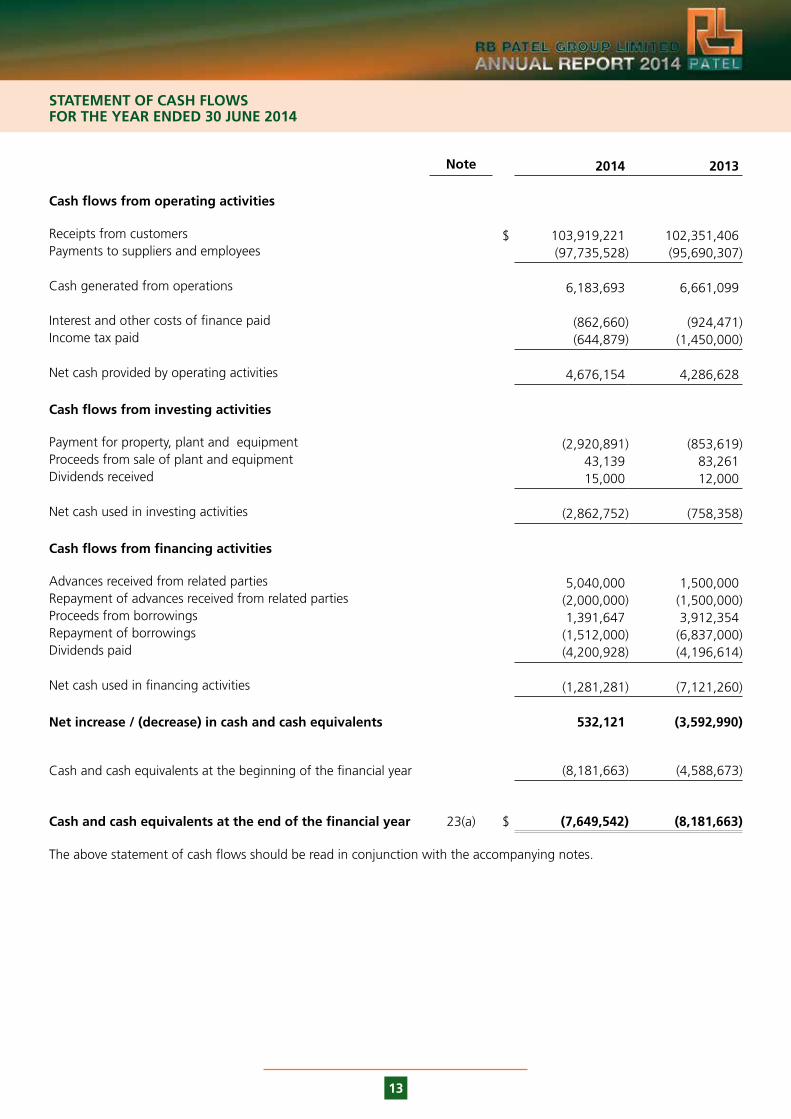
STATEMENT OF CASH FLOWSFOR THE YEAR ENDED 30 JUNE 2014
Note 2014 2013
Cash flows from operating activities
Receipts from customers $ 103,919,221 102,351,406Payments to suppliers and employees (97,735,528) (95,690,307)
Cash generated from operations 6,183,693 6,661,099
Interest and other costs of finance paid (862,660) (924,471)Income tax paid (644,879) (1,450,000)
Net cash provided by operating activities 4,676,154 4,286,628
Cash flows from investing activities
Payment for property, plant and equipment (2,920,891) (853,619)Proceeds from sale of plant and equipment 43,139 83,261Dividends received 15,000 12,000
Net cash used in investing activities (2,862,752) (758,358)
Cash flows from financing activities
Advances received from related parties 5,040,000 1,500,000Repayment of advances received from related parties (2,000,000) (1,500,000)Proceeds from borrowings 1,391,647 3,912,354Repayment of borrowings (1,512,000) (6,837,000)Dividends paid (4,200,928) (4,196,614)
Net cash used in financing activities (1,281,281) (7,121,260)
Net increase / (decrease) in cash and cash equivalents 532,121 (3,592,990)
Cash and cash equivalents at the beginning of the financial year (8,181,663) (4,588,673)
Cash and cash equivalents at the end of the financial year 23(a) $ (7,649,542) (8,181,663)
The above statement of cash flows should be read in conjunction with the accompanying notes.
14
NOTES TO THE FINANCIAL STATEMENTS FOR THE YEAR ENDED 30 JUNE 2014
NOTE 1. GENERAL INFORMATION
RB Patel Group Limited (the company) is a limited liability company incorporated and domiciled in Fiji. The address of its registered office and principal place of business is disclosed in note 27 to the financial statements. The company is listed on the South Pacific Stock Exchange.
The principal activities of the company during the year were that of retailing and wholesaling of general merchandise, owners and administrators of properties and equity investments. The company operates supermarket stores in Nausori, Nakasi, Nasinu, Suva, Sigatoka, Nadi, Lautoka, Labasa and Lami.
NOTE 2. SUMMARY OF SIGNIFICANT ACCOUNTING POLICIES
The principal accounting policies adopted in the preparation of these financial statements are set out below. These policies have been consistently applied to all the years presented, unless otherwise stated.
Statement of Compliance
The financial statements have been prepared in accordance with the Companies Act, 1983 and International Financial Reporting Standards (‘IFRS’) as required by the Fiji Institute of Accountants.
Basis of Preparation
The financial statements of RB Patel Group Limited have been prepared on the basis of historical cost convention, except for the revaluation of financial instruments and revaluation of certain non-current assets which were taken as “deemed cost” on transition to IFRS during the year ended 31 March 2007. Cost is based on the fair values of the consideration given in exchange for goods and services.
In the application of IFRS, management is required to make judgements, estimates and assumptions about carrying values of assets and liabilities that are not readily apparent from other sources. The estimates and associated assumptions are based on historical experience and various other factors that are believed to be reasonable under the circumstance, the results of which form the basis of making the judgements. Actual results may differ from these estimates.
The estimates and underlying assumptions are reviewed on an ongoing basis. Revisions to accounting estimates are recognised in the period in which the estimate is revised if the revision affects only that period or in the period of the revision and future periods if the revision affects both current and future periods. Judgements made by management in the application of IFRS that have significant effects on the financial statements and estimates with a significant risk of material adjustments in the future periods are disclosed, where applicable, in the relevant notes to the financial statements.
The areas involving a higher degree of judgement or complexity, or areas where assumptions and estimates are critical to the financial statements are disclosed in note 4.
Accounting policies are selected and applied in a manner which ensures that the resulting financial information satisfies the concepts of relevance and reliability, thereby ensuring that the substance of the underlying transactions or other events is reported.
15
NOTES TO THE FINANCIAL STATEMENTS (CONT’D) FOR THE YEAR ENDED 30 JUNE 2014
NOTE 2. SUMMARY OF SIGNIFICANT ACCOUNTING POLICIES (CONT’D)
Basis of Preparation (Cont’d)
New Standards and Amendments effective for the year ended 30 June 2014
A number of new standards and amendments effective for the first time for periods beginning on (or after) 1 January 2013, have been adopted in these financial statements. The nature and effect of each new standard and amendment adopted by the company is detailed below. Not all new standards and amendments effective for the first time for periods beginning on (or after) 1 January 2013 affect the company’s financial statements.
(i) IFRS 12 – Disclosure of Interests in Other Entities (effective for annual periods beginning on or after 1 January 2013)
IFRS 12 is a new disclosure standard that sets out what companies need to disclose in their financial statements when they have interests in subsidiaries, joint arrangements, associates or unconsolidated structured entities. IFRS 12 aims to provide users of financial statements with information that helps evaluate the nature of and risks associated with the reporting company’s interests in other entities and the effects of those interests on its financial statements. In addition, IFRS 12 requires extensive disclosures about investments in subsidiaries, joint arrangements, associates or unconsolidated structured entities.
As the new standard affects only disclosure, there is no effect on the company’s financial position or performance.
(ii) IFRS 13 - Disclosures of Fair Value Measurement (effective for annual periods beginning on or after 1 January 2013).
IFRS 13 establishes a single source of guidance for fair value measurements and disclosures about fair value measurements. IFRS 13 does not change the requirements regarding which items should be measured or disclosed at fair value. IFRS 13 defines fair value as the price that would be received to sell an asset or paid to transfer a liability in an orderly transaction in the principal market at the measurement date under current market condition regardless of whether that price is directly observable or estimated using another valuation technique. The application of IFRS 13 may result in changes in how entities determine fair values for financial reporting purposes. In addition, IFRS 13 requires extensive disclosures about fair value measurements.
IFRS 13 did not materially affect any fair value measurements of the company’s assets or liabilities, with changes being limited to presentation and disclosure, and therefore has no effect on the company’s financial position or performance.
New Standards and Amendments effective for the year ended 30 June 2014 that have no significant impact to the company
The following new standards and amendments are also effective for the first time in these financial statements. However, none have a material effect on the company.
• IFRS 7 (Amendment) – Disclosures – Offsetting Financial Assets and Financial Liabilities (effective for annual periods beginning on or after 1 January 2013).
• IAS 19 (Revised) – Employee Benefits (effective for annual periods beginning on or after 1 January 2013).
16
NOTES TO THE FINANCIAL STATEMENTS (CONT’D) FOR THE YEAR ENDED 30 JUNE 2014
NOTE 2. SUMMARY OF SIGNIFICANT ACCOUNTING POLICIES (CONT’D)
Basis of Preparation (Cont’d)
New Standards and Amendments issued but not yet effective
The following new standards and amendments which are not yet effective and have not been adopted early in these financial statements, will or may have an effect on the company’s future financial statements:
• Amendments to IFRS 9 - Financial Instruments: Classification and Measurement (effective for annual periods beginning on or after 1 January 2015).
• Amendments to IFRS 10, IFRS 12 and IAS 27 Investment Entities (effective for annual periods beginning on or after 1 January 2014).
• IAS 32 (Amendment) – Offsetting Financial Assets and Financial Liabilities (effective for annual periods beginning on or after 1 January 2014).
(a) Allowance for Doubtful Debts
The company establishes an allowance for any doubtful debts based on a review of all outstanding amounts at year end. Bad debts are written off during the period when they are identified.
(b) Borrowings
Borrowings are recognised initially at fair value, net of transaction costs incurred. Borrowings are subsequently stated at amortised cost; any difference between the proceeds (net of transaction costs) and the redemption value is recognised in the statement of profit or loss over the period of the borrowings using the effective interest method.
Borrowings are classified as current liabilities unless the company has an unconditional right to defer settlement of the liability for at least 12 months after the balance date.
(c) Borrowing Costs
Borrowing costs directly attributable to the acquisition, construction or production of qualifying assets, which are assets that necessarily take a substantial period of time to get ready for their intended use of sale, are added to the cost of those assets, until such time as the assets are substantially ready for their intended use or sale.
All other borrowing costs are recognised in the statement of profit or loss in the period in which they are incurred.
(d) Cash and Cash Equivalents
For the purpose of statement of cash flows, cash and cash equivalents comprise cash on hand and cash in banks, net of outstanding bank overdrafts. Bank overdrafts are shown within interest bearing borrowings in current liabilities in the statement of financial position.
(e) Comparatives
Where necessary, amounts relating to prior periods have been reclassified to facilitate comparison and achieve consistency in disclosure with current year amounts.
(f) Dividend Distribution
Dividend declared but not distributed is recognised as a liability in the company’s financial statements in the period in which the dividend is declared by the company’s directors.
17
NOTES TO THE FINANCIAL STATEMENTS (CONT’D) FOR THE YEAR ENDED 30 JUNE 2014
NOTE 2. SUMMARY OF SIGNIFICANT ACCOUNTING POLICIES (CONT’D)
(g) Earnings Per Share
Basic earnings per share
Basic earnings per share (EPS) is determined by dividing profit after income tax attributable to members of the company by the weighted average number of ordinary shares outstanding during the year.
Diluted earnings per share
Diluted EPS is the same as the basic EPS as there are no ordinary shares which are considered dilutive.
(h) Employee Benefits
Wages and salaries
Liabilities for wages and salaries expected to be settled within 12 months of the reporting date are accrued up to the reporting date.
Annual leave and sick leave
The liability for annual leave is recognized in the provision for employee benefits. Liabilities for annual leave are expected to be settled within 12 months of the reporting date and are measured at their nominal values using the remuneration rate expected to apply at the time of settlement.
Liabilities for non-accumulating sick leave are recognised when the leave is taken and measured at the rates prevailing at that time.
Defined contribution plans
Contributions to Fiji National Provident Fund are expensed when incurred.
(i) Financial Assets
The company classifies its financial assets in the following categories: available-for-sale assets and receivables. The classification depends on the nature and purpose for which the financial assets were acquired and is determined at the time of initial recognition.
Available-for-sale financial assets
Available-for-sale financial assets are non-derivatives that are either designated in this category or not classified in any of the other categories. They are included in non-current assets unless management intends to dispose of the investment within 12 months of the balance date.
Investments are initially recognised at fair value plus transaction costs. Financial assets are de-recognised when the rights to receive cash flows from the investments have expired or have been transferred and the company has transferred substantially all risks and rewards of ownership. Available-for-sale financial assets are subsequently carried at fair value.
Changes in the fair value of monetary and non-monetary securities classified as available-for-sale financial assets are recognised in equity. When securities classified as available for sale are sold or impaired, the accumulated fair value adjustments recognised in equity are included in the statement of profit or loss as ‘gains and losses from investment securities’.
Dividends on available-for-sale financial assets are recognised in the statement of profit or loss as part of other income when the company’s right to receive payments is established.
18
NOTES TO THE FINANCIAL STATEMENTS (CONT’D) FOR THE YEAR ENDED 30 JUNE 2014
NOTE 2. SUMMARY OF SIGNIFICANT ACCOUNTING POLICIES (CONT’D)
(i) Financial Assets (Cont’d)
Available-for-sale financial assets (Cont’d)
The company assesses at each balance date whether there is objective evidence that a financial asset or a group of financial assets is impaired. In the case of equity securities classified as available for sale, a significant or prolonged decline in the fair value of the security below its cost is considered as an indicator that the securities are impaired. If any such evidence exists for available-for-sale financial assets, the cumulative loss measured as the difference between the acquisition cost and the current fair value, less any impairment loss on that financial asset previously recognised in the statement of profit or loss is removed from equity and recognised in the statement of profit or loss.
Receivables
Receivables are non-derivative financial assets with fixed or determinable payments that are not quoted in an active market. They are included in current assets, except for maturities greater than 12 months after the balance date, which are classified as non-current assets. The company’s receivables comprise ‘trade and other receivables’ disclosed in the statement of financial position (note 9). Bad debts are written off during the period in which they are identified.
Trade receivables and other receivables are recorded at amortised cost less impairment.
(j) Foreign Currency
Functional and Presentation Currency
The company operates in Fiji and hence the financial statements are presented in Fiji dollars, which is the company’s functional and presentation currency.
Transactions and Balances
All foreign currency transactions during the financial year are brought to account using the exchange rate in effect at the date of the transaction. Foreign currency monetary items at reporting date are translated at the exchange rate existing at reporting date. Non-monetary assets and liabilities carried at fair value that are denominated in foreign currencies are translated at the rates prevailing at the date when the fair value was determined. Exchange differences are recognised in the statement of profit or loss in the period in which they arise.
(k) Impairment of Non - Financial Assets
At each reporting date, the company reviews the carrying amounts of its tangible and intangible assets to determine whether there is any indication that those assets have suffered an impairment loss. If any such indication exists, the recoverable amount of the asset is estimated in order to determine the extent of the impairment loss, if any. When it is not possible to estimate the recoverable amount of an individual asset, the company estimates the recoverable amount of the cash-generating unit to which the asset belongs.
Intangible assets with indefinite useful lives and intangible assets not yet available for use are tested for impairment annually and whenever there is an indication that the asset may be impaired.
Recoverable amount is the higher of fair value less costs to sell and value in use. In assessing value in use, the estimated future cash flows are discounted to their present value using a pre-tax discount rate that reflects current market assessments of the time value of money and the risks specific to the asset for which the estimates of future cash flows have not been adjusted.
If the recoverable amount of an asset or cash-generating unit is estimated to be less than its carrying amount, the carrying amount of the asset or cash-generating unit is reduced to its recoverable amount. An impairment loss is recognised in the statement of profit or loss immediately, unless the relevant asset is carried at a revalued amount, in which case the impairment loss is treated as a revaluation decrease.
19
NOTES TO THE FINANCIAL STATEMENTS (CONT’D) FOR THE YEAR ENDED 30 JUNE 2014
NOTE 2. SUMMARY OF SIGNIFICANT ACCOUNTING POLICIES (CONT’D)
(k) Impairment of Non - Financial Assets (Cont’d)
Where an impairment loss subsequently reverses, the carrying amount of the asset or cash-generating unit is increased to the revised estimate of its recoverable amount, but so that the increased carrying amount does not exceed the carrying amount that would have been determined had no impairment loss been recognised for the asset or cash-generating unit in prior years. A reversal of an impairment loss is recognized immediately in the statement of profit or loss, unless the relevant asset is carried at a revalued amount, in which case the reversal of the impairment loss is treated as a revaluation increase.
(l) Inventories
Inventories are valued at the lower of cost and net realisable value. Costs, including an appropriate portion of variable overhead expenses, are assigned to inventory on hand by the method most appropriate to each particular class of inventory, with the majority being valued on actual cost on first in first out basis. Net realisable value represents the estimated selling price less all estimated costs of completion and costs to be incurred in marketing, selling and distribution. Cost includes expenditure incurred in acquiring the inventories and bringing them to their existing condition and location.
Provisions for inventory obsolescence are raised based on a review of inventories. Inventories considered obsolete or un-saleable are written off in the period in which they are identified.
(m) Income Tax
Income tax expense represents the sum of the tax currently payable and deferred tax.
Current Tax
The current income tax charge is calculated on the basis of the tax laws enacted or substantively enacted at the balance date. Management periodically evaluates positions taken in tax returns with respect to situations in which applicable tax regulations is subject to interpretation and establishes provisions where appropriate on the basis of amounts expected to be paid to the tax authorities.
Deferred Tax
Deferred tax is accounted for using the balance sheet liability method in respect of temporary differences arising from differences between the carrying amount of assets and liabilities in the financial statements and the corresponding tax base of those items.
In principle, deferred tax liabilities are recognised for all taxable temporary differences. Deferred tax assets are recognised to the extent that it is probable that sufficient taxable amounts will be available against which deductible temporary differences or unused tax losses and tax offsets can be utilised. However, deferred tax assets and liabilities are not recognised if the temporary differences giving rise to them arise from the initial recognition of assets and liabilities (other than as a result of a business combination) which affects neither taxable income nor accounting profit.
Deferred tax assets and liabilities are measured at the tax rates that are expected to apply to the periods when the asset and liability giving rise to them are realised or settled, based on tax rates and tax laws that have been enacted or substantively enacted by reporting date. The measurement of deferred tax liabilities and assets reflects the tax consequences that would follow from the manner in which the company expects, at the reporting date, to recover or settle the carrying amount of its assets and liabilities.
Current and Deferred Tax for the period
Current and deferred tax is recognised as an expense or income in the statement of profit or loss, except when it relates to items credited or debited directly to equity, in which case the deferred tax is also recognised directly in equity.
20
NOTES TO THE FINANCIAL STATEMENTS (CONT’D) FOR THE YEAR ENDED 30 JUNE 2014
NOTE 2. SUMMARY OF SIGNIFICANT ACCOUNTING POLICIES (CONT’D)
(m) Income Tax (Cont’d)
Capital Gains Tax
The Capital Gains Tax (CGT) is applicable at 10% on capital gains realised on the sale or disposal of ‘capital assets’ as set out in the Capital Gains Tax Decree. Accordingly, the company provides for deferred tax liability that may arise if capital assets were to be ultimately sold or traded. The potential CGT is disclosed under deferred tax liabilities in the statement of financial position.
(n) Investment Property
Investment property principally comprising freehold land and building is held to earn rentals and/or for capital appreciation, is measured initially at its cost including transaction costs. Subsequent to initial recognition, investment property is measured at its cost less any accumulated depreciation and accumulated impairment losses.
Freehold land is not depreciated. Depreciation on other investment property is depreciated on a straight line basis over its estimated useful life using the following rate: Building 1.50% - 2.50%
Investment property is derecognised when either it has been disposed or when the investment property is permanently withdrawn from use and no future economic benefit is expected from its disposal. Any gains or losses on the retirement or disposal of an investment property is taken into consideration in determining the results for the period.
(o) Leased Assets
Leases are classified as finance leases whenever the terms of the lease transfer substantially all the risks and rewards of ownership to the lessee. All other leases are classified as operating leases.
Company as Lessor
Rental income from operating leases is recognised on a straight line basis over the term of the relevant lease.
Company as Lessee
Operating lease payments are recognised as an expense on a straight-line basis over the lease term, except where another systematic basis is more representative of the time pattern in which economic benefits from the leased asset are consumed.
(p) Property, Plant and Equipment
Property, plant and equipment are measured at cost and deemed cost less accumulated depreciation and impairment losses.
Cost includes expenditure that is directly attributable to the acquisition of the item. In the event that settlement of all or part of the purchase consideration is deferred, cost is determined by discounting the amounts payable in the future to their present value as at the date of acquisition.
Depreciation is provided on property, plant and equipment, including buildings and leasehold land but excluding freehold land. Depreciation is calculated on a straight-line basis so as to write off the net cost or other revalued amount of each asset over its expected useful life to its estimated residual value. Leasehold improvements are depreciated over the period of the lease or estimated useful life, whichever is the shorter, using the straight-line method. The estimated useful lives, residual values and depreciation method is reviewed at the end of each annual reporting period.
21
NOTES TO THE FINANCIAL STATEMENTS (CONT’D) FOR THE YEAR ENDED 30 JUNE 2014
NOTE 2. SUMMARY OF SIGNIFICANT ACCOUNTING POLICIES (CONT’D)
(p) Property, Plant and Equipment (Cont’d)
Freehold land is not depreciated. Other property, plant and equipment is depreciated on a straight-line basis over its estimated useful life using the following rates:
Leasehold lands Terms of leases Buildings 1.25% - 2.50%Furniture, fittings and office equipment 12% - 40%Motor vehicles 18%
Buildings on leasehold land are depreciated using the straight-line method over their estimated useful lives or the remaining period of the lease whichever is shorter.
Profits and losses on disposal of property, plant and equipment are taken into account in determining the results for the year.
Capital work in progress principally relates to costs incurred in respect of property construction. Capital work in progress is not depreciated.
(q) Provisions
Provisions are recognised when the company has a present obligation (legal or constructive) as a result of a past event, it is probable that the company will be required to settle the obligation, and a reliable estimate can be made of the amount of the obligation.
The amount recognised as a provision is the best estimate of the consideration required to settle the present obligation at reporting date, taking into account the risks and uncertainties surrounding the obligation. Where a provision is measured using the cash flows estimated to settle the present obligation, its carrying amount is the present value of those cash flows.
When some or all of the economic benefits required to settle a provision are expected to be recovered from a third party, the receivable is recognised as an asset if it is virtually certain that recovery will be received and the amount of the receivable can be measured reliably.
(r) Segment Reporting
Operating Segment
An operating segment is a component of the company which may earn revenue and incur expenses and the operating results are regularly reviewed by the directors of the company to make decisions about resources to be allocated to the segments and assess its performance.
The company considers itself to be operating in one operating segment as it operates predominantly in the retailing and wholesaling industry and revenue from other sources are not material for the purposes of segment reporting.
Geographic Segment
A geographical segment constitutes the provision of products or services within a particular economic environment that are subject to risks and return that are different from those of segments operating in other economic environments. The company predominantly operates in Fiji and business from outside Fiji is not material. Accordingly, the company is in one geographical area for reporting purposes.

22
NOTES TO THE FINANCIAL STATEMENTS (CONT’D) FOR THE YEAR ENDED 30 JUNE 2014
NOTE 2. SUMMARY OF SIGNIFICANT ACCOUNTING POLICIES (CONT’D)
(s) Share Capital
Ordinary shares are classified as equity. Incremental costs directly attributable to the issue of new shares or options are shown in equity as a deduction, net of tax, from the proceeds.
(t) Trade and Other Payables
Trade payables and other accounts payable are recognised when the company becomes obliged to make future payments resulting from the purchase of goods and services.
Trade payables are recognised initially at fair value and subsequently measured at amortised cost using the effective interest method.
(u) Trade Receivables
Trade receivables are recognised initially at fair value and subsequently measured at amortised cost using the effective interest method, less allowance for doubtful debts. An allowance for doubtful debts of trade receivables is established when there is objective evidence that the company will not be able to collect all amounts due according to the original terms of the receivables. Allowance is raised on a specific debtor level. Significant financial difficulties of the debtors and default or delinquency in payments are considered indicators that a specific debtor balance is impaired. Impairment assessed at a collective level is based on past experience and data in relation to actual write-offs.
Subsequent recoveries of amounts previously written off are credited in the statement of profit or loss.
(v) Revenue Recognition
Sale of goods
Revenue from the sale of goods is recognised when the company has transferred to the buyer the significant risks and rewards of ownership of the goods.
Sales revenue represent revenue earned from the sale of merchandise and is stated net of returns, trade allowances and Value Added Tax.
Rental income
Rental income is recognised on a normal accrual basis.
Rental income represents income earned from renting out of building space and is stated net of Value Added Tax.
Dividend
Dividend income from investments is recognised when the shareholder’s right to receive payment is established.
Interest income
Interest income is recognised on a time proportionate basis that takes into account the effective yield on the financial assets.
23
NOTES TO THE FINANCIAL STATEMENTS (CONT’D) FOR THE YEAR ENDED 30 JUNE 2014
NOTE 2. SUMMARY OF SIGNIFICANT ACCOUNTING POLICIES (CONT’D)
(w) Value Added Tax
Revenues, expenses and assets are recognised net of the amount of Value Added Tax (VAT), except:
i) where the amount of VAT incurred is not recoverable from the taxation authority, it is recognised as part of the cost of acquisition of an asset or as part of an item of expense; or
ii) for receivables and payables which are recognised inclusive of VAT.
The amount of VAT recoverable from, or payable to, the taxation authority is included as part of receivables or payables.
The VAT component of cash flows arising from operating and investing activities which is recoverable from or payable to, the taxation authority is classified as operating cash flows.
NOTE 3. FINANCIAL RISK MANAGEMENT
3.1 Financial risk factors
The company’s activities expose it to a variety of financial risks: market risk (foreign exchange risk, price risk and interest rate risk), regulatory risk, credit risk, liquidity risk and operational risk.
The company does not enter into or trade financial instruments, including derivative financial instruments, for speculative purposes.
The company’s overall risk management programme focuses on the unpredictability of financial markets and seeks to minimise potential adverse effects on the company’s financial performance.
Risk management is carried out by executive management. Executive management identifies, evaluates and monitors financial risks in close co-operation with the operating units. The board provides policies for overall risk management, as well as policies covering specific areas, such as foreign exchange risk, interest rate risk, credit risk and investment of excess liquidity.
(a) Market risk
Market risk is the risk that changes in the market prices, such as foreign exchange rates, interest rate, equity prices, and credit spreads will affect the company’s income or the value of its holdings of financial instruments. The objective of market risk management is to control market risk exposures within acceptable parameters while optimising the return on risk.
Unfavourable changes to duty and tax regulations may expose the company to a decline in revenues. To minimise this risk, the company implements appropriate strategies to ensure that products and prices remain attractive. The company operates in Fiji and changes to Governments and the policies they implement affect the economic situation and ultimately the revenue of the company. To address this, the company reviews its pricing and product range regularly and responds appropriately to these changes.
(i) Foreign exchange risk
The company undertakes transactions denominated in foreign currencies. Consequently, exposures to exchange rate fluctuation. Exchange rate exposures are managed within approved policy parameters. Major foreign exchange transactions relates to importation of goods of which settlement is based on spot rates. Foreign currency risk arises from recognised assets and liabilities that are denominated in a currency that is not the company’s functional currency (refer note 2(j)). As a measure, the company negotiates competitive rates with its bankers to minimise losses and maximise gains when foreign exchange receipts and payments become due.
24
NOTES TO THE FINANCIAL STATEMENTS (CONT’D) FOR THE YEAR ENDED 30 JUNE 2014
NOTE 3. FINANCIAL RISK MANAGEMENT (CONT’D)
3.1 Financial risk factors (Cont’d)
(a) Market risk (Cont’d)
(i) Foreign exchange risk (Cont’d)
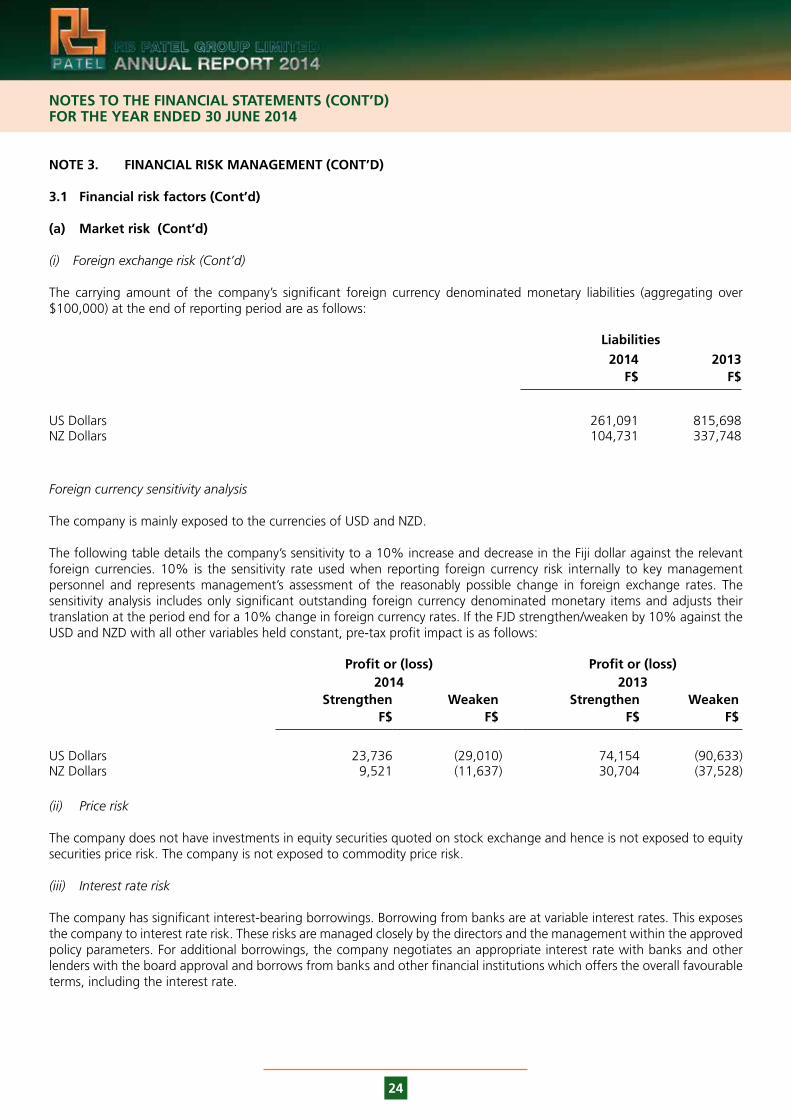
The carrying amount of the company’s significant foreign currency denominated monetary liabilities (aggregating over $100,000) at the end of reporting period are as follows:
Liabilities
2014 2013F$ F$
US Dollars 261,091 815,698NZ Dollars 104,731 337,748
Foreign currency sensitivity analysis
The company is mainly exposed to the currencies of USD and NZD.
The following table details the company’s sensitivity to a 10% increase and decrease in the Fiji dollar against the relevant foreign currencies. 10% is the sensitivity rate used when reporting foreign currency risk internally to key management personnel and represents management’s assessment of the reasonably possible change in foreign exchange rates. The sensitivity analysis includes only significant outstanding foreign currency denominated monetary items and adjusts their translation at the period end for a 10% change in foreign currency rates. If the FJD strengthen/weaken by 10% against the USD and NZD with all other variables held constant, pre-tax profit impact is as follows:
Profit or (loss) Profit or (loss)2014 2013
Strengthen Weaken Strengthen WeakenF$ F$ F$ F$
US Dollars 23,736 (29,010) 74,154 (90,633)NZ Dollars 9,521 (11,637) 30,704 (37,528)
(ii) Price risk
The company does not have investments in equity securities quoted on stock exchange and hence is not exposed to equity securities price risk. The company is not exposed to commodity price risk.
(iii) Interest rate risk
The company has significant interest-bearing borrowings. Borrowing from banks are at variable interest rates. This exposes the company to interest rate risk. These risks are managed closely by the directors and the management within the approved policy parameters. For additional borrowings, the company negotiates an appropriate interest rate with banks and other lenders with the board approval and borrows from banks and other financial institutions which offers the overall favourable terms, including the interest rate.
25
NOTES TO THE FINANCIAL STATEMENTS (CONT’D) FOR THE YEAR ENDED 30 JUNE 2014
NOTE 3. FINANCIAL RISK MANAGEMENT (CONT’D)
3.1 Financial risk factors (Cont’d)
(a) Market risk (Cont’d)
(iii) Interest rate risk (Cont’d)
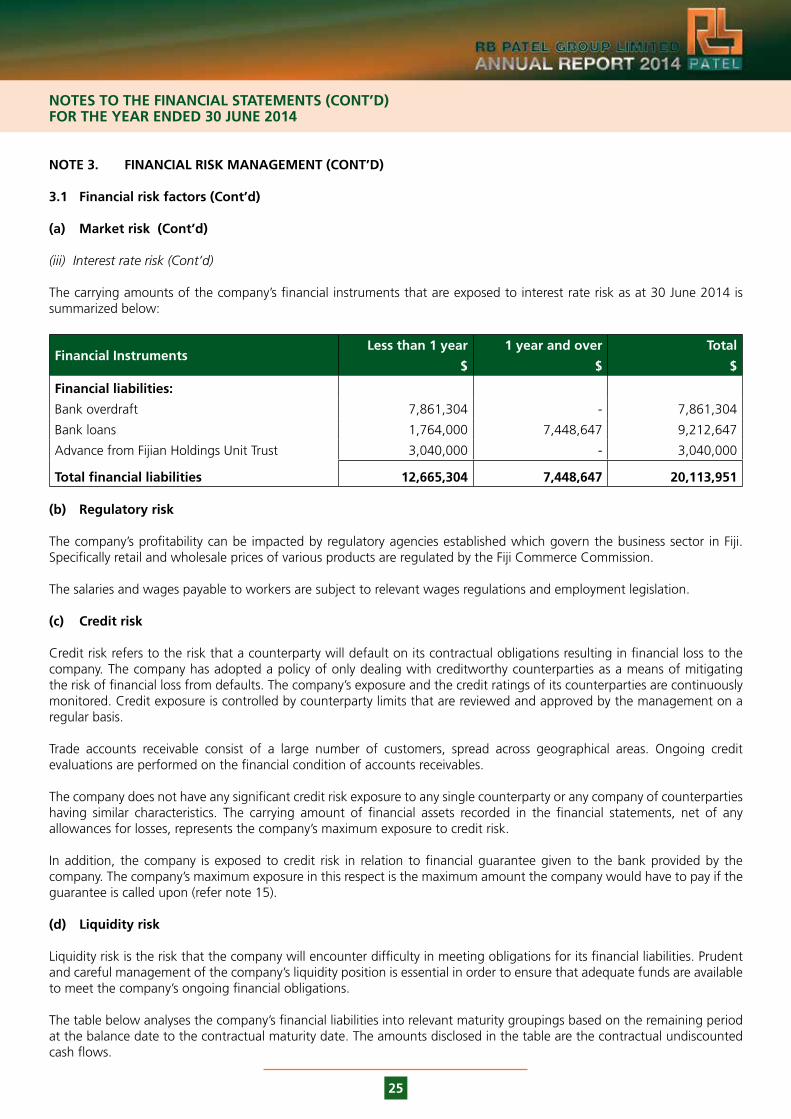
The carrying amounts of the company’s financial instruments that are exposed to interest rate risk as at 30 June 2014 is summarized below:
Financial InstrumentsLess than 1 year 1 year and over Total
$ $ $
Financial liabilities:
Bank overdraft 7,861,304 - 7,861,304
Bank loans 1,764,000 7,448,647 9,212,647
Advance from Fijian Holdings Unit Trust 3,040,000 - 3,040,000
Total financial liabilities 12,665,304 7,448,647 20,113,951
(b) Regulatory risk
The company’s profitability can be impacted by regulatory agencies established which govern the business sector in Fiji. Specifically retail and wholesale prices of various products are regulated by the Fiji Commerce Commission.
The salaries and wages payable to workers are subject to relevant wages regulations and employment legislation.
(c) Credit risk
Credit risk refers to the risk that a counterparty will default on its contractual obligations resulting in financial loss to the company. The company has adopted a policy of only dealing with creditworthy counterparties as a means of mitigating the risk of financial loss from defaults. The company’s exposure and the credit ratings of its counterparties are continuously monitored. Credit exposure is controlled by counterparty limits that are reviewed and approved by the management on a regular basis.
Trade accounts receivable consist of a large number of customers, spread across geographical areas. Ongoing credit evaluations are performed on the financial condition of accounts receivables.
The company does not have any significant credit risk exposure to any single counterparty or any company of counterparties having similar characteristics. The carrying amount of financial assets recorded in the financial statements, net of any allowances for losses, represents the company’s maximum exposure to credit risk.
In addition, the company is exposed to credit risk in relation to financial guarantee given to the bank provided by the company. The company’s maximum exposure in this respect is the maximum amount the company would have to pay if the guarantee is called upon (refer note 15).
(d) Liquidity risk
Liquidity risk is the risk that the company will encounter difficulty in meeting obligations for its financial liabilities. Prudent and careful management of the company’s liquidity position is essential in order to ensure that adequate funds are available to meet the company’s ongoing financial obligations.
The table below analyses the company’s financial liabilities into relevant maturity groupings based on the remaining period at the balance date to the contractual maturity date. The amounts disclosed in the table are the contractual undiscounted cash flows.
26
NOTES TO THE FINANCIAL STATEMENTS (CONT’D) FOR THE YEAR ENDED 30 JUNE 2014
NOTE 3. FINANCIAL RISK MANAGEMENT (CONT’D)
3.1 Financial risk factors (Cont’d)
(d) Liquidity risk (Cont’d)
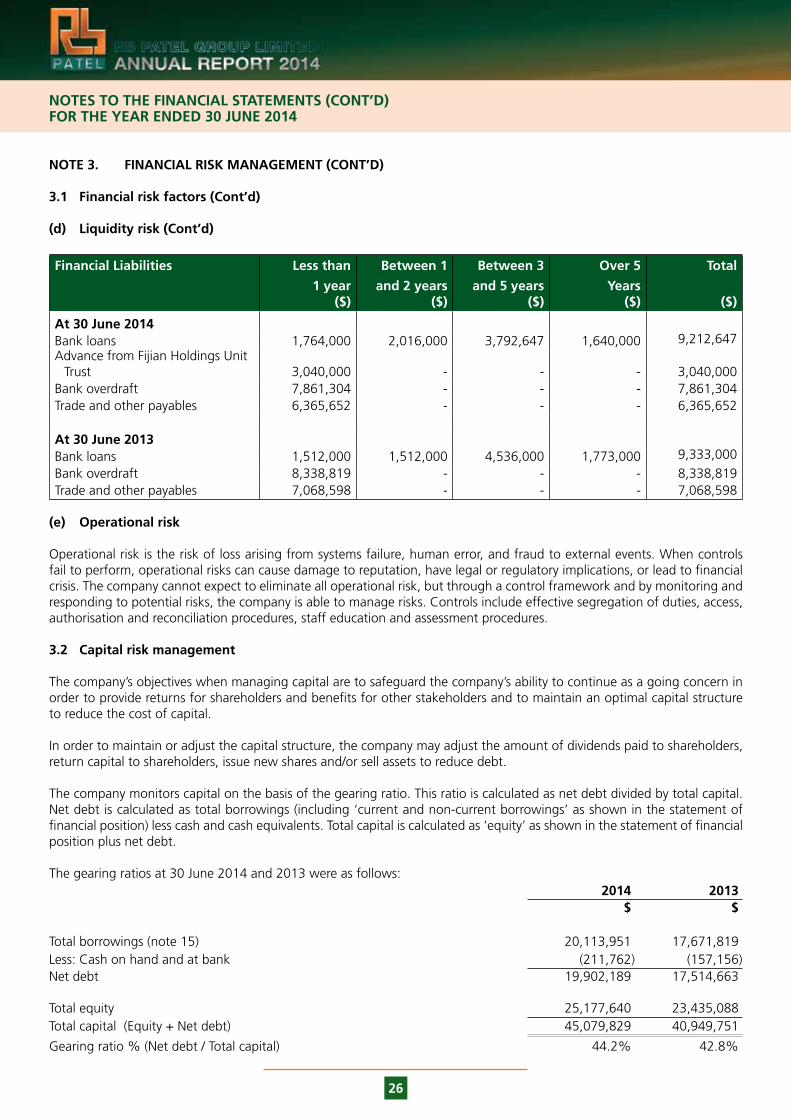
Financial Liabilities Less than Between 1 Between 3 Over 5 Total
1 year($)
and 2 years($)
and 5 years ($)
Years($) ($)
At 30 June 2014Bank loans 1,764,000 2,016,000 3,792,647 1,640,000 9,212,647Advance from Fijian Holdings Unit
Trust 3,040,000 - - - 3,040,000Bank overdraft 7,861,304 - - - 7,861,304Trade and other payables 6,365,652 - - - 6,365,652
At 30 June 2013Bank loans 1,512,000 1,512,000 4,536,000 1,773,000 9,333,000Bank overdraft 8,338,819 - - - 8,338,819Trade and other payables 7,068,598 - - - 7,068,598
(e) Operational risk
Operational risk is the risk of loss arising from systems failure, human error, and fraud to external events. When controls fail to perform, operational risks can cause damage to reputation, have legal or regulatory implications, or lead to financial crisis. The company cannot expect to eliminate all operational risk, but through a control framework and by monitoring and responding to potential risks, the company is able to manage risks. Controls include effective segregation of duties, access, authorisation and reconciliation procedures, staff education and assessment procedures.
3.2 Capital risk management
The company’s objectives when managing capital are to safeguard the company’s ability to continue as a going concern in order to provide returns for shareholders and benefits for other stakeholders and to maintain an optimal capital structure to reduce the cost of capital.
In order to maintain or adjust the capital structure, the company may adjust the amount of dividends paid to shareholders, return capital to shareholders, issue new shares and/or sell assets to reduce debt.
The company monitors capital on the basis of the gearing ratio. This ratio is calculated as net debt divided by total capital. Net debt is calculated as total borrowings (including ‘current and non-current borrowings’ as shown in the statement of financial position) less cash and cash equivalents. Total capital is calculated as ‘equity’ as shown in the statement of financial position plus net debt.
The gearing ratios at 30 June 2014 and 2013 were as follows:2014 2013
$ $
Total borrowings (note 15) 20,113,951 17,671,819Less: Cash on hand and at bank (211,762) (157,156)Net debt 19,902,189 17,514,663
Total equity 25,177,640 23,435,088Total capital (Equity + Net debt) 45,079,829 40,949,751
Gearing ratio % (Net debt / Total capital) 44.2% 42.8%
27
NOTES TO THE FINANCIAL STATEMENTS (CONT’D) FOR THE YEAR ENDED 30 JUNE 2014
NOTE 3. FINANCIAL RISK MANAGEMENT (CONT’D)
3.3 Fair value estimation
The carrying value less impairment provision of trade receivables and payables are assumed to approximate their fair values. The carrying values of financial liabilities are estimated to approximate their fair values.
NOTE 4. CRITICAL ACCOUNTING ESTIMATES AND JUDGEMENTS
In application of the company’s accounting policies, which are described in note 2, the directors are required to make judgements, estimates and assumptions about the carrying amounts of assets and liabilities that are not readily apparent from other sources. The estimates and associated assumptions are based on historical experience and other factors that are considered to be relevant. Actual results may differ from these estimates.
Estimates and judgements are continually evaluated and are based on historical experience and other factors, including expectations of future events that are believed to be reasonable under the circumstances. Revisions to accounting estimates are recognized in the period in which the estimate is revised if the revision affects only that period or in the period of revision and future periods if the revision affects both current and future periods.
The company makes estimates and assumptions concerning the future. The resulting accounting estimates will, by definition, seldom equal the related actual results. The estimates and assumptions that have a significant risk of causing material adjustment to the carrying amounts of assets and liabilities within the next financial year and in future are discussed below.
Critical Judgements in Applying the Entity’s Accounting Policies
(a) Provision for stock obsolescence
Provision for stock obsolescence is assessed and raised on a specific basis based on a review of inventories. Inventory balances are reviewed continuously and inventories considered obsolete or non-saleable are written off in the period in which they are identified. The management’s decision in maintaining provision for stock obsolescence requires judgment and estimates of future realisable values in relation to slow moving and old inventories.
(b) Deferred tax liabilities
Deferred tax liability is recognized on taxable temporary differences over accounting and tax carrying amounts in respect of company properties and is measured at the tax rates that are expected to apply in the period in which the liability is expected to be settled. The management’s decision in recording its deferred tax liability requires significant judgment and estimates of future tax rates and future tax payables. Accordingly, subsequent events may result in outcomes that may be different from the judgments and estimates applied.
(c) Impairment of accounts receivable
Impairment of accounts receivable balances is assessed at an individual level. All debtors in the 90+ days category are considered impaired and provided for on a specific basis after detailed review of individual account balances. Receivables considered uncollectable are written off in the year in which they are identified.
28
NOTES TO THE FINANCIAL STATEMENTS (CONT’D) FOR THE YEAR ENDED 30 JUNE 2014
NOTE 4. CRITICAL ACCOUNTING ESTIMATES AND JUDGEMENTS (CONT’D)
Critical Judgements in Applying the Entity’s Accounting Policies (Cont’d)
(d) Depreciation of property, plant and equipment
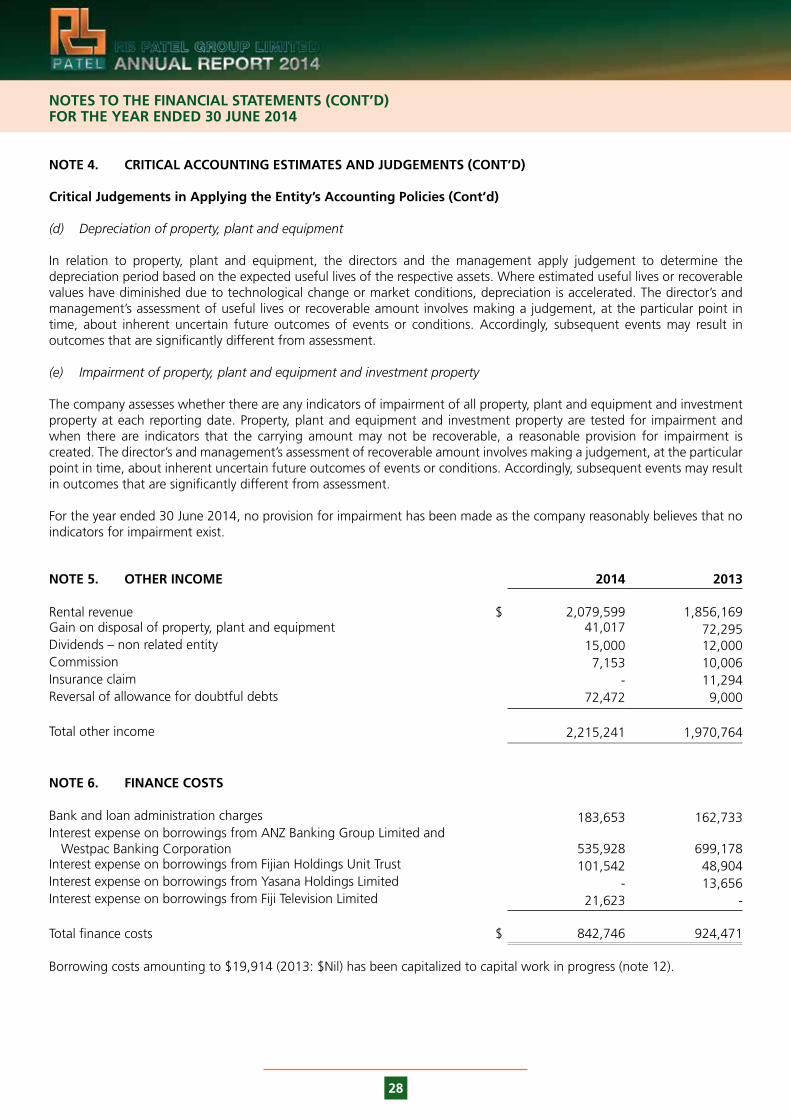
In relation to property, plant and equipment, the directors and the management apply judgement to determine the depreciation period based on the expected useful lives of the respective assets. Where estimated useful lives or recoverable values have diminished due to technological change or market conditions, depreciation is accelerated. The director’s and management’s assessment of useful lives or recoverable amount involves making a judgement, at the particular point in time, about inherent uncertain future outcomes of events or conditions. Accordingly, subsequent events may result in outcomes that are significantly different from assessment.
(e) Impairment of property, plant and equipment and investment property
The company assesses whether there are any indicators of impairment of all property, plant and equipment and investment property at each reporting date. Property, plant and equipment and investment property are tested for impairment and when there are indicators that the carrying amount may not be recoverable, a reasonable provision for impairment is created. The director’s and management’s assessment of recoverable amount involves making a judgement, at the particular point in time, about inherent uncertain future outcomes of events or conditions. Accordingly, subsequent events may result in outcomes that are significantly different from assessment.
For the year ended 30 June 2014, no provision for impairment has been made as the company reasonably believes that no indicators for impairment exist.
NOTE 5. OTHER INCOME 2014 2013
Rental revenue $ 2,079,599 1,856,169Gain on disposal of property, plant and equipment 41,017 72,295Dividends – non related entity 15,000 12,000Commission 7,153 10,006Insurance claim - 11,294Reversal of allowance for doubtful debts 72,472 9,000
Total other income 2,215,241 1,970,764
NOTE 6. FINANCE COSTS
Bank and loan administration charges 183,653 162,733Interest expense on borrowings from ANZ Banking Group Limited and
Westpac Banking Corporation 535,928 699,178Interest expense on borrowings from Fijian Holdings Unit Trust 101,542 48,904Interest expense on borrowings from Yasana Holdings Limited - 13,656Interest expense on borrowings from Fiji Television Limited 21,623 -
Total finance costs $ 842,746 924,471
Borrowing costs amounting to $19,914 (2013: $Nil) has been capitalized to capital work in progress (note 12).

29
NOTES TO THE FINANCIAL STATEMENTS (CONT’D) FOR THE YEAR ENDED 30 JUNE 2014
NOTE 7. PROFIT BEFORE INCOME TAX 2014 2013
Profit before income tax has been arrived at after charging the following expenses:
Auditors’ remuneration for: - Audit fees $ 42,000 41,000 - Other services 5,155 4,370Directors fees 30,000 30,000Management fees 2,945,636 3,021,554Depreciation of property, plant and equipment 1,022,788 992,162Depreciation of investment property 72,394 72,395Operating lease rental expenses 992,605 995,482Personnel costs: - Salaries, wages, and training levy 4,875,891 4,692,610 - FNPF contribution 363,870 351,522
NOTE 8. INCOME TAX
(a) Income Tax (Benefit) / Expense
The prima facie tax payable on profit is reconciled to the income tax (benefit) / expense as follows:
Profit before income tax 5,919,126 6,364,222
Prima facie tax thereon at 18.5% (2013: 20%) 1,095,038 1,272,844
Tax effect of permanent differences:Non-deductible expenses 59,742 87,181Non-taxable income – dividend income (2,775) (2,400)Income tax deductions and concessions (43,925) (52,706)Under/ (over) provision for income tax in prior year (1,483) (93,151)
1,106,597 1,211,768Adjustment to deferred tax balances due to change in future income tax rate
from 18.5% to 10% (2013: 20% to 18.5%) (1,115,023) (186,231)
Income tax (benefit) / expense attributable to profit (8,426) 1,025,537
Income tax (benefit) / expense comprises movements in:
Current tax liabilities 976,637 787,164Deferred tax liabilities (999,844) 236,402Deferred tax assets 14,781 1,971
(8,426) 1,025,537
(b) Current Tax Liability / (Asset)
Balance at the beginning of the year (231,542) 431,294Income tax paid (644,879) (1,450,000)Under / (over) provision of income tax in prior year (1,483) (93,151)Income tax liability for the current year 978,120 880,315
Balance at the end of the year $ 100,216 (231,542)
30
NOTES TO THE FINANCIAL STATEMENTS (CONT’D) FOR THE YEAR ENDED 30 JUNE 2014
NOTE 8. INCOME TAX (CONT’D) 2014 2013
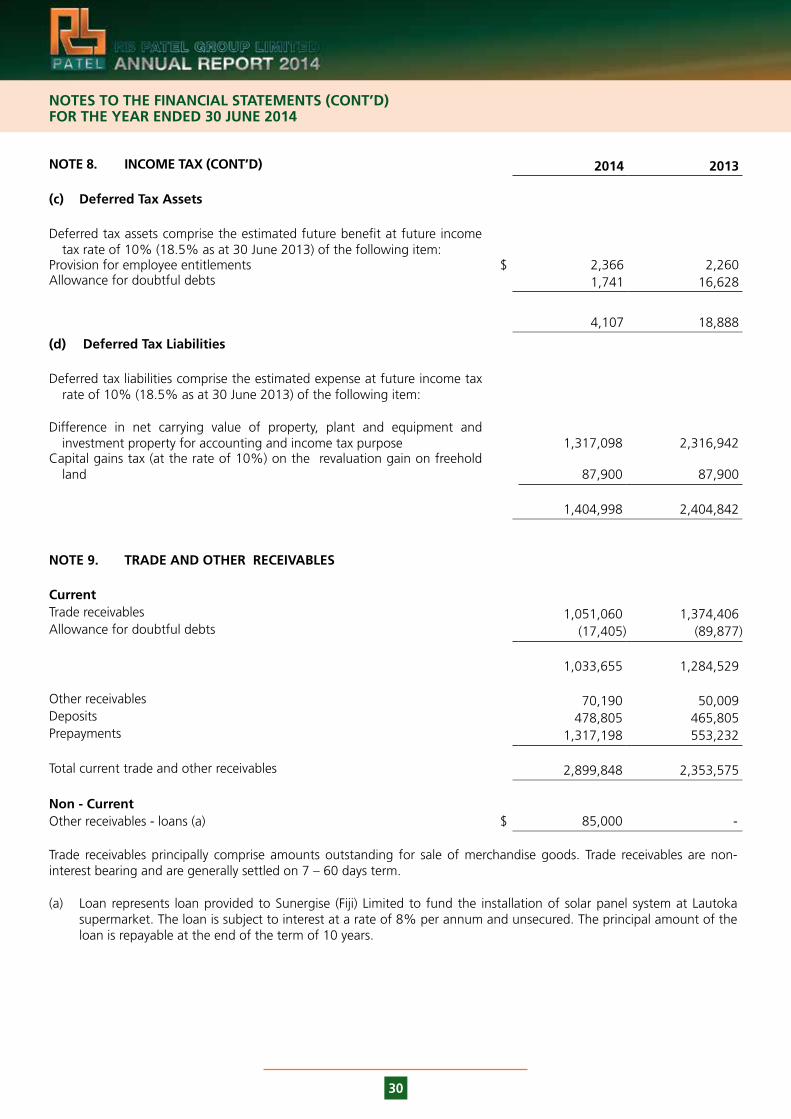
(c) Deferred Tax Assets
Deferred tax assets comprise the estimated future benefit at future income tax rate of 10% (18.5% as at 30 June 2013) of the following item:
Provision for employee entitlements $ 2,366 2,260Allowance for doubtful debts 1,741 16,628
4,107 18,888
(d) Deferred Tax Liabilities
Deferred tax liabilities comprise the estimated expense at future income tax rate of 10% (18.5% as at 30 June 2013) of the following item:
Difference in net carrying value of property, plant and equipment and investment property for accounting and income tax purpose 1,317,098 2,316,942
Capital gains tax (at the rate of 10%) on the revaluation gain on freehold land 87,900 87,900
1,404,998 2,404,842
NOTE 9. TRADE AND OTHER RECEIVABLES
CurrentTrade receivables 1,051,060 1,374,406Allowance for doubtful debts (17,405) (89,877)
1,033,655 1,284,529
Other receivables 70,190 50,009Deposits 478,805 465,805Prepayments 1,317,198 553,232
Total current trade and other receivables 2,899,848 2,353,575
Non - CurrentOther receivables - loans (a) $ 85,000 -
Trade receivables principally comprise amounts outstanding for sale of merchandise goods. Trade receivables are non-interest bearing and are generally settled on 7 – 60 days term.
(a) Loan represents loan provided to Sunergise (Fiji) Limited to fund the installation of solar panel system at Lautoka supermarket. The loan is subject to interest at a rate of 8% per annum and unsecured. The principal amount of the loan is repayable at the end of the term of 10 years.
31
NOTES TO THE FINANCIAL STATEMENTS (CONT’D) FOR THE YEAR ENDED 30 JUNE 2014
NOTE 9. TRADE AND OTHER RECEIVABLES (CONT’D)
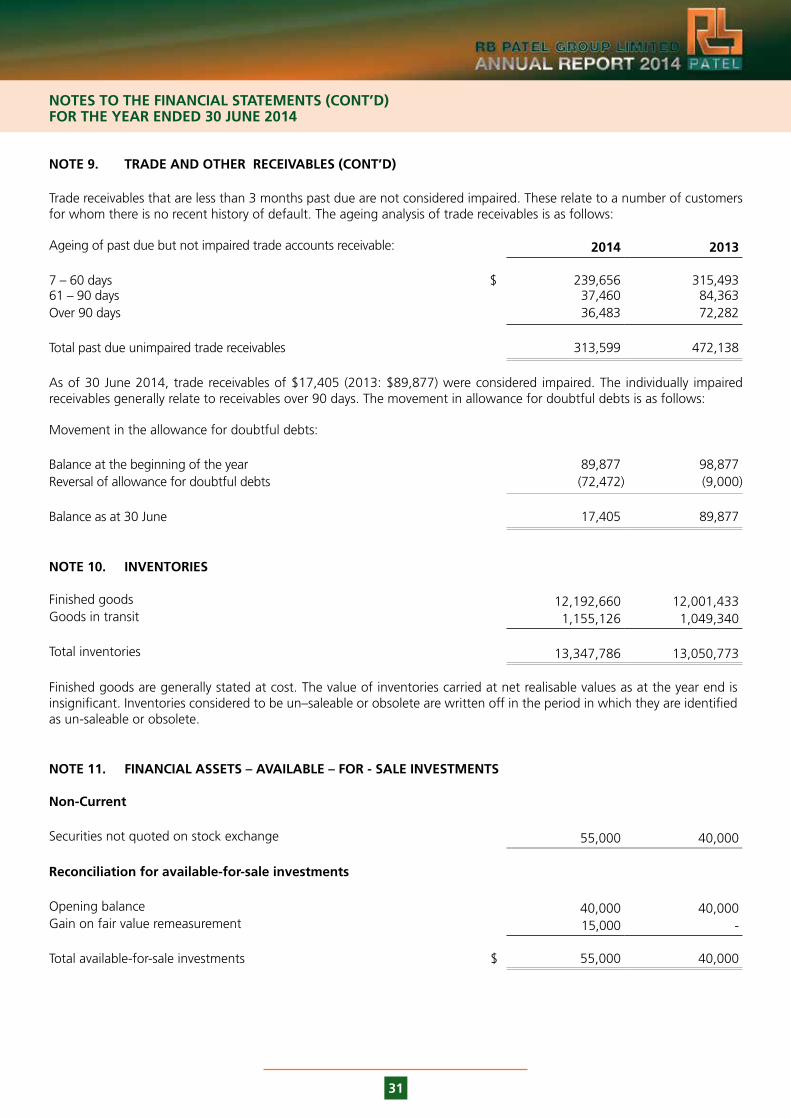
Trade receivables that are less than 3 months past due are not considered impaired. These relate to a number of customers for whom there is no recent history of default. The ageing analysis of trade receivables is as follows:
Ageing of past due but not impaired trade accounts receivable: 2014 2013
7 – 60 days $ 239,656 315,49361 – 90 days 37,460 84,363Over 90 days 36,483 72,282
Total past due unimpaired trade receivables 313,599 472,138
As of 30 June 2014, trade receivables of $17,405 (2013: $89,877) were considered impaired. The individually impaired receivables generally relate to receivables over 90 days. The movement in allowance for doubtful debts is as follows:
Movement in the allowance for doubtful debts:
Balance at the beginning of the year 89,877 98,877Reversal of allowance for doubtful debts (72,472) (9,000)
Balance as at 30 June 17,405 89,877
NOTE 10. INVENTORIES
Finished goods 12,192,660 12,001,433Goods in transit 1,155,126 1,049,340
Total inventories 13,347,786 13,050,773
Finished goods are generally stated at cost. The value of inventories carried at net realisable values as at the year end is insignificant. Inventories considered to be un–saleable or obsolete are written off in the period in which they are identified as un-saleable or obsolete.
NOTE 11. FINANCIAL ASSETS – AVAILABLE – FOR - SALE INVESTMENTS
Non-Current
Securities not quoted on stock exchange 55,000 40,000
Reconciliation for available-for-sale investments
Opening balance 40,000 40,000Gain on fair value remeasurement 15,000 -
Total available-for-sale investments $ 55,000 40,000

32
NOTES TO THE FINANCIAL STATEMENTS (CONT’D)FOR THE YEAR ENDED 30 JUNE 2014
NOTE 12. PROPERTY, PLANT AND EQUIPMENT
Freehold land at
deemedcost
Leasehold land at
deemed cost
Buildings at deemed
cost
Office equipment
at cost
Motor vehicles at
cost
Capital Work in
progress
Total
$ $ $ $ $ $ $
Gross carrying amount
Balance at 30 June 2012 6,250,409 2,056,199 20,340,016 5,137,217 909,623 285,805 34,979,269
Additions - - - 276,507 457,410 119,702 853,619
Disposals - - - - (100,478) - (100,478)
Balance at 30 June 2013 6,250,409 2,056,199 20,340,016 5,413,724 1,266,555 405,507 35,732,410
Additions - - 349,239 516,310 99,566 1,975,690 2,940,805
Disposals - - - (99,484) (79,387) - (178,871)
Transfers - - 76,136 43,566 - (119,702) -
Balance at 30 June 2014 6,250,409 2,056,199 20,765,391 5,874,116 1,286,734 2,261,495 38,494,344
Accumulated depreciation/ amortisation and impairment
Balance at 30 June 2012 - 407,921 2,064,628 3,288,068 770,661 - 6,531,278
Depreciation expense - 35,701 296,912 558,821 100,728 - 992,162
Disposals - - - - (89,512) - (89,512)
Balance at 30 June 2013 - 443,622 2,361,540 3,846,889 781,877 - 7,433,928
Depreciation expense - 35,701 299,574 563,317 124,196 - 1,022,788
Disposals - - - (97,365) (79,384) - (176,749)
Balance at 30 June 2014 - 479,323 2,661,114 4,312,841 826,689 - 8,279,967
Net book value
As at 30 June 2014 6,250,409 1,576,876 18,104,277 1,561,275 460,045 2,261,495 30,214,377
As at 30 June 2013 6,250,409 1,612,577 17,978,476 1,566,835 484,678 405,507 28,298,482
Prior to April 2006, land and buildings were revalued by the directors based on independent valuation. Upon adoption of IFRS (effectively from, April 2006), the company had elected the option provided under IFRS 1 to apply the cost model (deemed cost) for land and buildings previously re-valued, and accordingly, the cost value of land and buildings include revaluation increments amounting to $2,890,471 (2013: $2,890,471).
During the year, borrowing costs amounting to $19,914 (2013: $Nil) in relation to the construction of the Cinema Multiplex at JetPoint complex in Martintar, Nadi was capitalized to capital work in progress.

33
NOTES TO THE FINANCIAL STATEMENTS (CONT’D)FOR THE YEAR ENDED 30 JUNE 2014
NOTE 13. INVESTMENT PROPERTY 2014 2013
Freehold land – at cost $ 2,169,211 2,169,211Building – at cost 4,738,148 4,738,148Less: accumulated depreciation (398,722) (326,328)
Balance at end of financial year 6,508,637 6,581,031
In July 2013, an independent valuation was carried out by Rolle Associates for the company’s property at Martintar, Nadi. The property at Martintar, Nadi is apportioned between property, plant and equipment and investment property.
The property had been valued above its carrying value in books. The excess of market value over book value has not been brought to accounts.
In accordance with the security arrangements for borrowings from the bank, this investment property has been pledged as security (refer note 15).
NOTE 14. TRADE AND OTHER PAYABLES
Trade payables 5,229,186 5,687,951Other payables (a) 1,060,938 1,290,112VAT payable 64,258 78,337Dividends payable 11,270 12,198
6,365,652 7,068,598
Trade payables principally comprise amounts outstanding for trade purchases and on-going costs. Trade payables are non-interest bearing and are normally settled on 30 – 60 days term.
(a) Other payables includes $553,328 (2013: $683,186) payable to the holding company and $Nil (2013: $12,752) payable to ultimate holding company.
NOTE 15. INTEREST BEARING BORROWINGS
Secured
Current
Bank overdrafts 7,861,304 8,338,819Bank Loan – ANZ Banking Group Limited (a) 1,032,000 1,032,000Bank Loan – ANZ Banking Group Limited (b) 480,000 480,000Bank Loan – ANZ Banking Group Limited (c) 252,000 -Advance from Fijian Holdings Unit Trust (d) 3,040,000 -
Total current secured borrowings 12,665,304 9,850,819
Non-Current
Bank Loan – ANZ Banking Group Limited (a) 2,749,000 3,781,000Bank Loan – ANZ Banking Group Limited (b) 3,560,000 4,040,000Bank Loan – ANZ Banking Group Limited (c) 1,139,647 -
Total non-current secured borrowings $ 7,448,647 7,821,000

34
NOTES TO THE FINANCIAL STATEMENTS (CONT’D)FOR THE YEAR ENDED 30 JUNE 2014
NOTE 15. INTEREST BEARING BORROWINGS (CONT’D)
(a) The loan has been taken for construction of RB Patel JetPoint complex and purchase of land in Nadi. The loan is subject to variable interest rate. Bank loan is payable at monthly repayments of $86,000 plus interest.
(b) The loan has been taken for construction of RB Patel HarbourPoint complex in Lami. The loan is subject to variable interest rate. Bank loan is payable at monthly principal repayments of $40,000 plus interest.
(c) During the year, the company obtained loan for the construction of Cinema Multiplex at JetPoint complex in Martintar, Nadi. The loan is subject to variable interest rate. Only monthly interest is payable for the development period. Thereafter, bank loan is payable at monthly repayments of $42,000 plus interest.
(d) Advance from Fijian Holdings Unit Trust, managed by fellow subsidiary company, Fijian Holdings Trust Management Limited, is subject to interest at the rate of 3.5% per annum, unsecured and is repayable on demand.
Particulars relating to secured borrowings:
(a) The bank overdraft facility and bank loan (together with letter of credit and guarantee facilities) from ANZ Banking Group Limited is secured by:
(i) First registered mortgage debenture given by the company over all its present and future assets and undertakings and its uncalled and unpaid capital.
(ii) First registered mortgage over properties (CT No. 23400) situated at corner of Dovi Road and Ratu Mara Road, Laucala Beach Estate, Nasinu, (CT No. 7082) situated at Martintar, Nadi, (CT No. 34330) situated at Tavewa Avenue, Lautoka, (CL No. 53120) situated at Tavewa Avenue, Lautoka and (CT No. 39150) situated at Queens Road, Lami.
(iii) A Deed of Pari Passu between the ANZ Banking Group Limited, Westpac Banking Corporation and the company, regarding sharing of securities in the ratio 50/50 with maximum debt of $7 million each.
(b) The bank overdraft facility (together with letter of credit and guarantee facilities) from Westpac Banking Corporation is secured by:
(i) Registered equitable mortgage debenture given by the company over all its assets and undertakings including its uncalled and called but unpaid capital.
(ii) A Deed of Pari Passu between Westpac Banking Corporation, ANZ Banking Group Limited and the company, regarding sharing of securities in the ratio 50/50 with maximum debt of $7 million each.
(iii) Registered first mortgage over properties (CL No. 718652) situated at the corner of Kings & Adi Davila Roads, Nakasi, Nausori and (NL No. 15761) situated at Labasa.
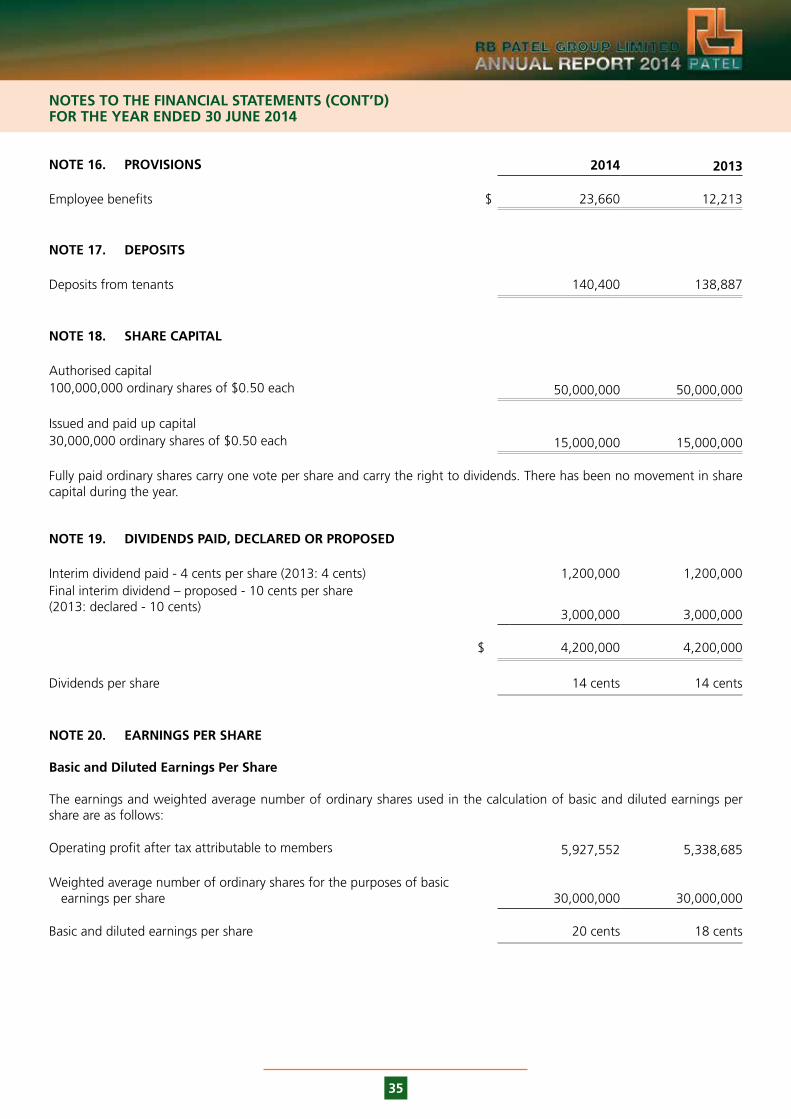
35
NOTES TO THE FINANCIAL STATEMENTS (CONT’D)FOR THE YEAR ENDED 30 JUNE 2014
NOTE 16. PROVISIONS 2014 2013
Employee benefits $ 23,660 12,213
NOTE 17. DEPOSITS
Deposits from tenants 140,400 138,887
NOTE 18. SHARE CAPITAL
Authorised capital100,000,000 ordinary shares of $0.50 each 50,000,000 50,000,000
Issued and paid up capital30,000,000 ordinary shares of $0.50 each 15,000,000 15,000,000
Fully paid ordinary shares carry one vote per share and carry the right to dividends. There has been no movement in share capital during the year.
NOTE 19. DIVIDENDS PAID, DECLARED OR PROPOSED
Interim dividend paid - 4 cents per share (2013: 4 cents) 1,200,000 1,200,000Final interim dividend – proposed - 10 cents per share (2013: declared - 10 cents)
3,000,000 3,000,000
$ 4,200,000 4,200,000
Dividends per share 14 cents 14 cents
NOTE 20. EARNINGS PER SHARE Basic and Diluted Earnings Per Share
The earnings and weighted average number of ordinary shares used in the calculation of basic and diluted earnings per share are as follows:
Operating profit after tax attributable to members 5,927,552 5,338,685
Weighted average number of ordinary shares for the purposes of basic earnings per share 30,000,000 30,000,000
Basic and diluted earnings per share 20 cents 18 cents
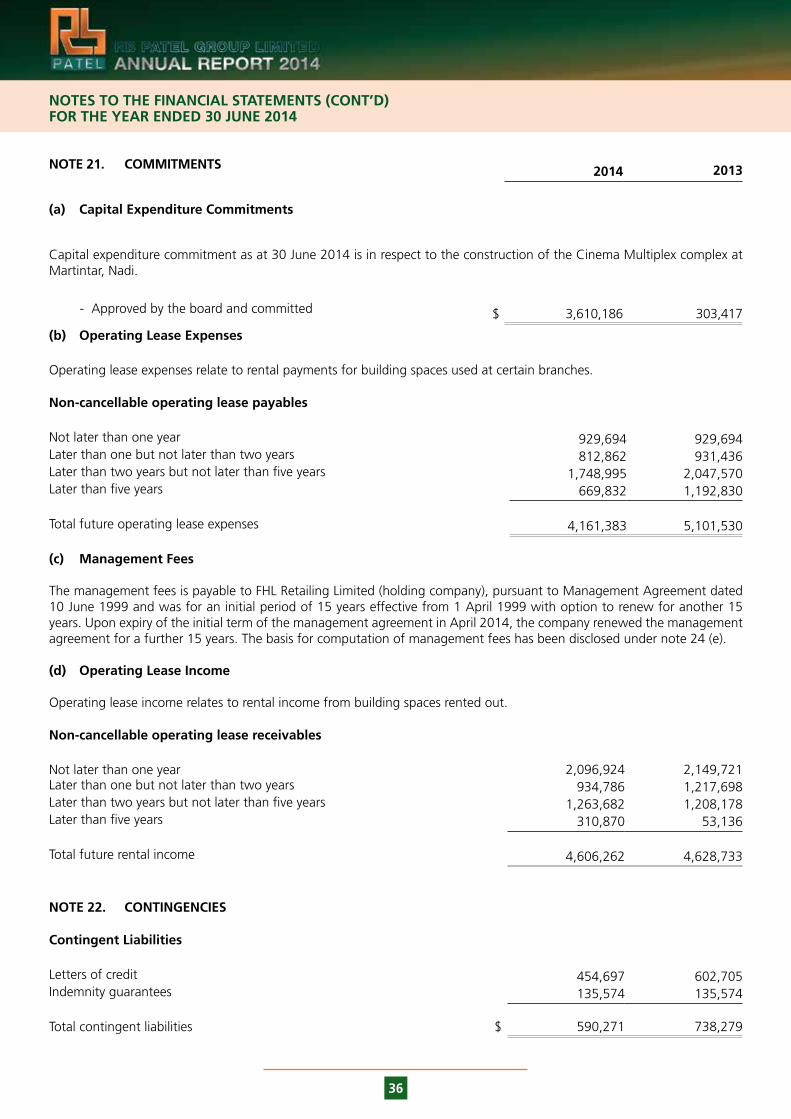
36
NOTES TO THE FINANCIAL STATEMENTS (CONT’D)FOR THE YEAR ENDED 30 JUNE 2014
NOTE 21. COMMITMENTS 2014 2013
(a) Capital Expenditure Commitments
Capital expenditure commitment as at 30 June 2014 is in respect to the construction of the Cinema Multiplex complex at Martintar, Nadi.
- Approved by the board and committed $ 3,610,186 303,417
(b) Operating Lease Expenses
Operating lease expenses relate to rental payments for building spaces used at certain branches.
Non-cancellable operating lease payables
Not later than one year 929,694 929,694Later than one but not later than two years 812,862 931,436Later than two years but not later than five years 1,748,995 2,047,570Later than five years 669,832 1,192,830
Total future operating lease expenses 4,161,383 5,101,530 (c) Management Fees
The management fees is payable to FHL Retailing Limited (holding company), pursuant to Management Agreement dated 10 June 1999 and was for an initial period of 15 years effective from 1 April 1999 with option to renew for another 15 years. Upon expiry of the initial term of the management agreement in April 2014, the company renewed the management agreement for a further 15 years. The basis for computation of management fees has been disclosed under note 24 (e). (d) Operating Lease Income Operating lease income relates to rental income from building spaces rented out.
Non-cancellable operating lease receivables
Not later than one year 2,096,924 2,149,721Later than one but not later than two years 934,786 1,217,698Later than two years but not later than five years 1,263,682 1,208,178Later than five years 310,870 53,136
Total future rental income 4,606,262 4,628,733
NOTE 22. CONTINGENCIES
Contingent Liabilities
Letters of credit 454,697 602,705Indemnity guarantees 135,574 135,574
Total contingent liabilities $ 590,271 738,279

37
NOTES TO THE FINANCIAL STATEMENTS (CONT’D)FOR THE YEAR ENDED 30 JUNE 2014
NOTE 23. NOTES TO THE STATEMENT OF CASH FLOWS
(a) Reconciliation of Cash and Cash Equivalents For the purposes of the statement of cash flows, cash and cash equivalents includes cash on hand and in banks and investments in money market instruments, net of outstanding bank overdrafts. Cash and cash equivalents at the end of the financial year as shown in the statement of cash flows is reconciled to the related items in the statement of financial position as follows:
2014 2013
Cash on hand and at bank $ 211,762 157,156Bank overdraft (7,861,304) (8,338,819)
Total cash and cash equivalents (7,649,542) (8,181,663)
(b) Financing Facilities
Fully committed bank overdraft financing facilities available to the company at year end were as follows:
• Bank overdraft – utilised 7,861,304 8,338,819• Bank overdraft – unutilised 3,440,696 1,963,181
$ 11,302,000 10,302,000
NOTE 24. RELATED PARTY DISCLOSURES
(a) Holding Company and Ultimate Holding Company The holding company is FHL Retailing Limited, a company incorporated in Fiji. The ultimate holding company is Fijian Holdings Limited, a company incorporated in Fiji and listed on the South Pacific Stock Exchange.
(b) Directors
The names of persons who were directors of the company at any time during the year are as follows: Padam Raj Lala – Chairman Surendra K PatelNouzab Fareed Iowane Naiveli Kaliopate Tavola Malakai Naiyaga
(c) Amounts due to and Receivable from Related Parties
Appropriate disclosure of these amounts is contained in the respective notes to the financial statements.
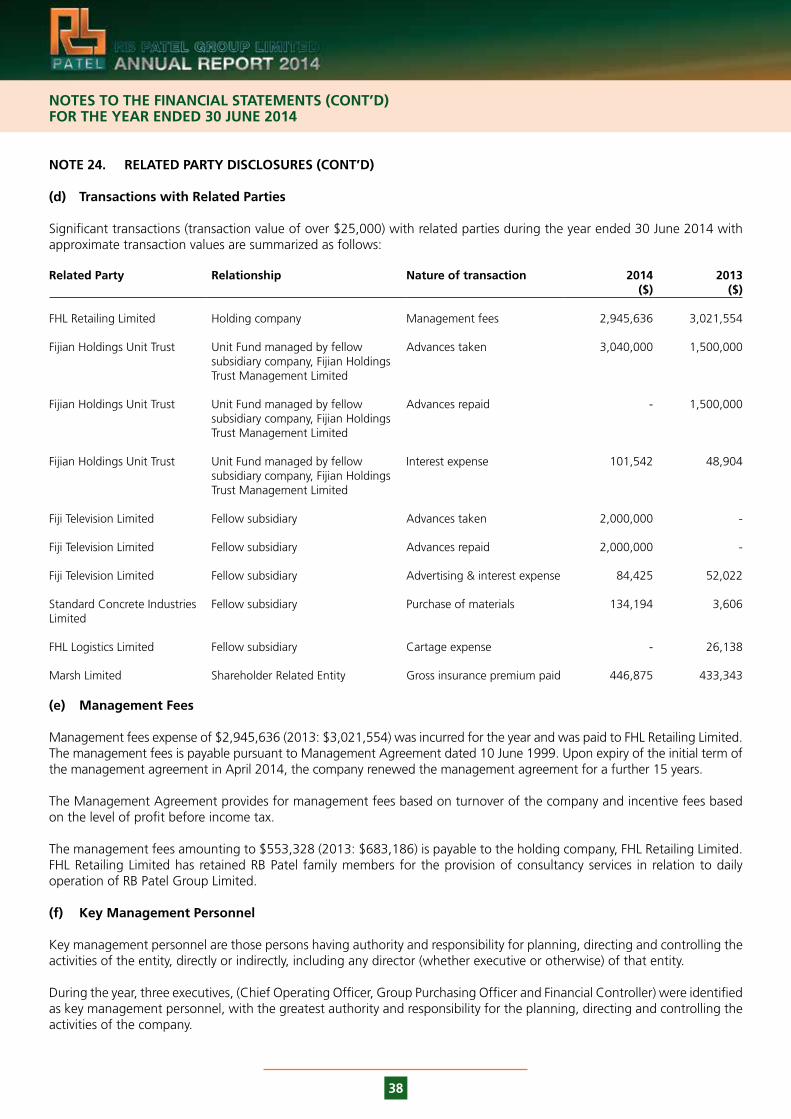
38
NOTES TO THE FINANCIAL STATEMENTS (CONT’D)FOR THE YEAR ENDED 30 JUNE 2014
NOTE 24. RELATED PARTY DISCLOSURES (CONT’D) (d) Transactions with Related Parties
Significant transactions (transaction value of over $25,000) with related parties during the year ended 30 June 2014 with approximate transaction values are summarized as follows:
Related Party Relationship Nature of transaction 2014($)
2013($)
FHL Retailing Limited Holding company Management fees 2,945,636 3,021,554
Fijian Holdings Unit Trust Unit Fund managed by fellow subsidiary company, Fijian Holdings Trust Management Limited
Advances taken 3,040,000 1,500,000
Fijian Holdings Unit Trust Unit Fund managed by fellow subsidiary company, Fijian Holdings Trust Management Limited
Advances repaid - 1,500,000
Fijian Holdings Unit Trust Unit Fund managed by fellow subsidiary company, Fijian Holdings Trust Management Limited
Interest expense 101,542 48,904
Fiji Television Limited Fellow subsidiary Advances taken 2,000,000 -
Fiji Television Limited Fellow subsidiary Advances repaid 2,000,000 -
Fiji Television Limited Fellow subsidiary Advertising & interest expense 84,425 52,022
Standard Concrete Industries Limited
Fellow subsidiary Purchase of materials 134,194 3,606
FHL Logistics Limited Fellow subsidiary Cartage expense - 26,138
Marsh Limited Shareholder Related Entity Gross insurance premium paid 446,875 433,343
(e) Management Fees
Management fees expense of $2,945,636 (2013: $3,021,554) was incurred for the year and was paid to FHL Retailing Limited. The management fees is payable pursuant to Management Agreement dated 10 June 1999. Upon expiry of the initial term of the management agreement in April 2014, the company renewed the management agreement for a further 15 years.
The Management Agreement provides for management fees based on turnover of the company and incentive fees based on the level of profit before income tax.
The management fees amounting to $553,328 (2013: $683,186) is payable to the holding company, FHL Retailing Limited. FHL Retailing Limited has retained RB Patel family members for the provision of consultancy services in relation to daily operation of RB Patel Group Limited.
(f) Key Management Personnel
Key management personnel are those persons having authority and responsibility for planning, directing and controlling the activities of the entity, directly or indirectly, including any director (whether executive or otherwise) of that entity.
During the year, three executives, (Chief Operating Officer, Group Purchasing Officer and Financial Controller) were identified as key management personnel, with the greatest authority and responsibility for the planning, directing and controlling the activities of the company.
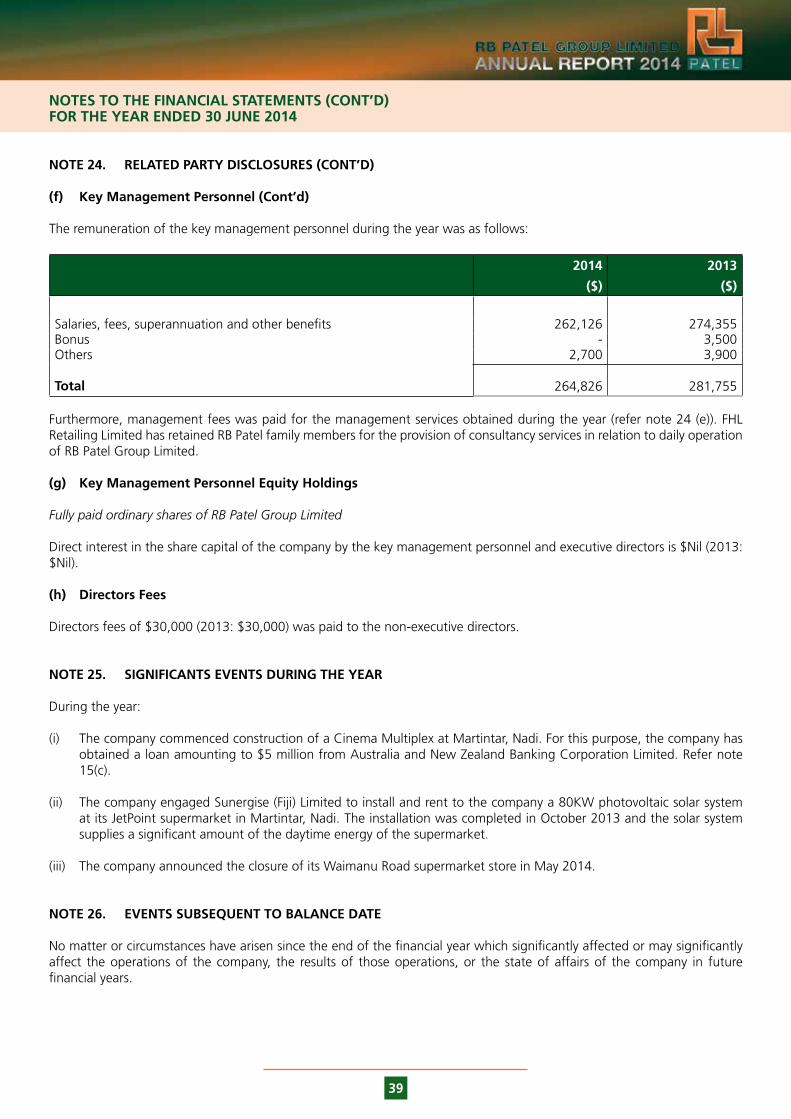
39
NOTES TO THE FINANCIAL STATEMENTS (CONT’D)FOR THE YEAR ENDED 30 JUNE 2014
NOTE 24. RELATED PARTY DISCLOSURES (CONT’D)
(f) Key Management Personnel (Cont’d)
The remuneration of the key management personnel during the year was as follows:
2014 2013
($) ($)
Salaries, fees, superannuation and other benefits 262,126 274,355Bonus - 3,500Others 2,700 3,900
Total 264,826 281,755
Furthermore, management fees was paid for the management services obtained during the year (refer note 24 (e)). FHL Retailing Limited has retained RB Patel family members for the provision of consultancy services in relation to daily operation of RB Patel Group Limited.
(g) Key Management Personnel Equity Holdings
Fully paid ordinary shares of RB Patel Group Limited
Direct interest in the share capital of the company by the key management personnel and executive directors is $Nil (2013: $Nil).
(h) Directors Fees
Directors fees of $30,000 (2013: $30,000) was paid to the non-executive directors.
NOTE 25. SIGNIFICANTS EVENTS DURING THE YEAR
During the year:
(i) The company commenced construction of a Cinema Multiplex at Martintar, Nadi. For this purpose, the company has obtained a loan amounting to $5 million from Australia and New Zealand Banking Corporation Limited. Refer note 15(c).
(ii) The company engaged Sunergise (Fiji) Limited to install and rent to the company a 80KW photovoltaic solar system at its JetPoint supermarket in Martintar, Nadi. The installation was completed in October 2013 and the solar system supplies a significant amount of the daytime energy of the supermarket.
(iii) The company announced the closure of its Waimanu Road supermarket store in May 2014.
NOTE 26. EVENTS SUBSEQUENT TO BALANCE DATE
No matter or circumstances have arisen since the end of the financial year which significantly affected or may significantly affect the operations of the company, the results of those operations, or the state of affairs of the company in future financial years.

40
NOTES TO THE FINANCIAL STATEMENTS (CONT’D)FOR THE YEAR ENDED 30 JUNE 2014
NOTE 27. COMPANY DETAILS
Company Incorporation
The company is incorporated in Fiji under the Companies Act, 1983. The company is listed on the South Pacific Stock Exchange.
Registered Office and Principal Place of Business
The registered office and principal place of business of the company is located at RB Patel CentrePoint Building, Ratu Dovi Road, Laucala Beach Estate, Nasinu.
NOTE 28. APPROVAL OF FINANCIAL STATEMENTS
The financial statements were approved by the board of directors and authorised for issue on 4 August 2014.

41
ADDITIONAL INFORMATION – SPSE LISTING RULES INFORMATION(NOT INCLUDED ELSEWHERE IN THE ANNUAL REPORT)
1. Shareholding:
a. As at 30 June 2014, no director has interest (direct and indirect) in the share capital of the company.
b. Distribution of shareholding:
Holding No. of Holders Total % Holding
Less than 500 shares 20 0.02%
500 to 5,000 shares 222 1.39%
5,001 to 10,000 shares 34 0.96%
10,001 to 20,000 shares 13 0.63%
20,001 to 30,000 shares 7 0.60%
30,001 to 40,000 shares - -
40,001 to 50,000 shares 2 0.33%
50,001 to 100,000 shares 4 1.03%
100,001 to 1,000,000 shares 9 10.49%
Over 1,000,000 shares 5 84.55%
Total 316 100%
c. Top 20 shareholders
Name No. of shares
1. FHL Retailing Limited 15,223,796
2. iTaukei Trust Fund Board 4,000,000
3. Fiji National Provident Fund 2,847,835
4. BSP Life (Fiji) Limited 2,164,681
5. Unit Trust of Fiji (Trustee Co) Limited 1,125,343
6. FHL Media Limited 817,702
7. FHL Trustees Ltd ATF Fijian Holdings Unit Trust 500,000
8. Kalidas Kasabia Memorial Trust 500,000
9. Kirit Patel 400,000
10. Mahendra Patel 220,000
11. Kanu Patel 200,000
12. Kishori Patel 200,000
13. Vinod Patel 200,000
14. J.P Bayly Trust 110,665
15. Moala Tikina Council 100,000
16. Chiman Bhai 96,500
17. FijiCare Insurance Limited 62,500
18. Pushpa Wati Kapadia 51,357
19. Punja & Sons Limited 50,000
20. Vikram Patel 50,000

42
ADDITIONAL INFORMATION – SPSE LISTING RULES INFORMATION(NOT INCLUDED ELSEWHERE IN THE ANNUAL REPORT)
2. Share Price details:
Highest share price during year was $2.58. Lowest share price during year was $2.26. Share price at year end was $2.58.
3. Attendance at Board Meetings:
Name No of Meeting No attended
Surendra K Patel 4 4
Padam Raj Lala 4 3
Iowane Naiveli 4 3
Nouzab Fareed 4 4
Kaliopate Tavola 4 3
Malakai Naiyaga 4 4
4. Share Register
RB Patel Group LimitedRB Patel CentrePoint BuildingRatu Dovi Road Laucala Beach EstateNASINU

43
ADDITIONAL INFORMATION – SPSE LISTING RULES INFORMATION(NOT INCLUDED ELSEWHERE IN THE ANNUAL REPORT)
12 months ended
30 June
12 months ended
30 June
12 months ended
30 June
12 months ended
30 June
12 months ended
30 June
2014 2013 2012 2011 2010
$ $ $ $ $
Revenue – Sales and Other Income 103,706,632 102,228,943 95,569,646 94,386,212 89,695,337
Profit before Depreciation and Tax 7,014,308 7,428,779 6,662,768 7,232,173 7,807,557
Depreciation 1,095,182 1,064,557 991,593 968,620 900,175
Income Tax Expense / (Benefit) (8,426) 1,025,537 561,501 1,427,105 1,924,812
Profit after Tax 5,927,552 5,338,685 5,109,674 4,836,448 4,982,570
Earnings per Share 0.20 0.18 0.17 0.16 0.17
Dividends per Share (including proposed dividends for year ended 30 June 2014) 0.14 0.14 0.14 0.14 0.14
Total Liabilities 28,148,877 27,296,359 29,504,691 27,547,556 25,999,642
Total Assets 53,326,517 50,731,447 48,801,094 45,934,285 43,749,923
Net Asset backing per Share 0.84 0.78 0.64 0.61 0.59
Shareholders’ Funds 25,177,640 23,435,088 19,296,403 18,386,729 17,750,281

44
0%
10%
20%
30%
40%
50%
60%
70%
80%
90%
100%
2010 2011 2012 2013 2014
Profits distributed as dividends (%)
30%
32%
34%
36%
38%
40%
42%
44%
46%
48%
2010 2011 2012 2013 2014
Gearing Ratio (%)
40
50
60
70
80
90
100
110
2010 2011 2012 2013 2014
Revenue (including other income)
Mill
ions
($)
0
4
8
12
16
20
24
2010 2011 2012 2013 2014
Earnings Per Share
Cent
s
$1.70
$1.90
$2.10
$2.30
$2.50
$2.70
Q12011
Q22011
Q32011
Q42011
Q12012
Q22012
Q32012
Q42012
Q12013
Q22013
Q32013
Q42013
Q12014
Q22014
Share Price Movements
Pric
e
0
1
2
3
4
5
6
7
2010 2011 2012 2013 2014
Profit after Tax
Mill
ions
($)
GRAPHICAL ANALYSIS OF FINANCIAL DATA
1. Revenue – comparison of revenue over the last five years.
2. Profit after Tax – the trend in Profit after Tax for the last five years.
3. Percentage of Profit Distributed – the percentage of Profit after tax distributed to shareholders as dividends for the last five years.
4. Earnings per Share – company’s Profit after tax divided by the total shares of the company.
5. Gearing Ratio – is the company’s total borrowings as a percentage of shareholders’ equity. Indicates the company’s ability to continue as a going concern and provide returns to shareholders while maintaining an optimal capital structure.
6. Share price movements – the trend for the company’s quarterly share price on the South Pacific Stock Exchange from 2011 to 2014.

0%
10%
20%
30%
40%
50%
60%
70%
80%
90%
100%
2010 2011 2012 2013 2014
Profits distributed as dividends (%)
30%
32%
34%
36%
38%
40%
42%
44%
46%
48%
2010 2011 2012 2013 2014
Gearing Ratio (%)
40
50
60
70
80
90
100
110
2010 2011 2012 2013 2014
Revenue (including other income)
Mill
ions
($)
0
4
8
12
16
20
24
2010 2011 2012 2013 2014
Earnings Per Share
Cent
s
$1.70
$1.90
$2.10
$2.30
$2.50
$2.70
Q12011
Q22011
Q32011
Q42011
Q12012
Q22012
Q32012
Q42012
Q12013
Q22013
Q32013
Q42013
Q12014
Q22014
Share Price Movements
Pric
e
0
1
2
3
4
5
6
7
2010 2011 2012 2013 2014
Profit after Tax
Mill
ions
($)

RB PATEL GROUP LIMITEDP.O. Box 943, Suva, FijiPhone: (679) 339 1899
Fax: (679) 334 0087Email: [email protected]