Embed Size (px)
Citation preview
Page 1
Directorate for Biological SciencesDivision of Environmental Biology
Phylogenetic SystematicsProposal Classification Form
PI: O'Meara, BrianCATEGORY I: INVESTIGATOR STATUS (Select ONE)
Beginning Investigator - No previous Federal support as PI or Co-PI, excluding fellowships, dissertations, planning grants, etc. Prior Federal support only Current Federal support only Current & prior Federal support
CATEGORY II: FIELDS OF SCIENCE OTHER THAN BIOLOGY INVOLVED IN THIS RESEARCH (Select 1 to 3)
Astronomy Chemistry Computer Science Geosciences
Engineering Mathematics Physics
Psychology Social Sciences None of the Above
CATEGORY III: SUBSTANTIVE AREA (Select 1 to 4) BIOGEOGRAPHY Island Biogeography Historical/ Evolutionary Biogeography Phylogeography Methods/Theory CHROMOSOME STUDIES Chromosome Evolution Chromosome Number Mutation Mitosis and Meiosis COMMUNITY ECOLOGY Community Analysis Community Structure Community Stability Succession Experimental Microcosms/ MesocosmsDisturbance Patch Dynamics Food Webs/ Trophic Structure Keystone Species COMPUTATIONAL BIOLOGY CONSERVATION & RESTORATION BIOLOGY DATABASES ECOSYSTEMS LEVEL Physical Structure
Decomposition Biogeochemistry Limnology/Hydrology Climate/Microclimate Whole-System Analysis Productivity/Biomass System Energetics Landscape Dynamics Chemical & Biochemical Control Global Change Climate Change Regional Studies Global Studies Forestry Resource Management (Wildlife, Fisheries, Range, Other) Agricultural Ecology EXTREMOPHILES GENOMICS (Genome sequence, organization, function)
Viral Microbial Fungal Plant Animal
MARINE MAMMALS MOLECULAR APPROACHES
Molecular Evolution Methodology/Theory Isozymes/ Electrophoresis Nucleic Acid Analysis (general)
Restriction Enzymes Nucleotide Sequencing Nuclear DNA Mitochondrial DNA Chloroplast DNA RNA Analysis DNA Hybridization Recombinant DNA
Amino Acid Sequencing Gene/Genome Mapping Natural Products Serology/Immunology PALEONTOLOGY Floristic Faunistic Paleoecology Biostratigraphy Palynology Micropaleontology Paleoclimatology Archeozoic Paleozoic Mesozoic

Page 2
Cenozoic POPULATION DYNAMICS & LIFE HISTORY Demography/ Life History Population Cycles Distribution/Patchiness/ Marginal Populations Population Regulation Intraspecific Competition Reproductive Strategies Gender Allocation Metapopulations Extinction POPULATION GENETICS & BREEDING SYSTEMS Variation Microevolution Speciation Hybridization Inbreeding/Outbreeding Gene Flow Measurement Inheritance/Heritability
Quantitative Genetics/ QTL Analysis Ecological Genetics Gender Ratios Apomixis/ Parthenogenesis Vegetative Reproduction SPECIES INTERACTIONS Predation Herbivory Omnivory Interspecific Competition Niche Relationships/ Resource Partititioning Pollination/ Seed Dispersal Parasitism Mutualism/ Commensalism Plant/Fungal/ Microbial Interactions Mimicry Animal Pathology Plant Pathology
Coevolution Biological Control STATISTICS & MODELING Methods/ Instrumentation/ Software Modeling (general) Statistics (general)
Multivariate Methods Spatial Statistics & Spatial Modeling Sampling Design & Analysis Experimental Design & Analysis
SYSTEMATICS Taxonomy/Classification Nomenclature Monograph/Revision Phylogenetics Phenetics/Cladistics/ Numerical Taxonomy Macroevolution NONE OF THE ABOVE
CATEGORY IV: INFRASTRUCTURE (Select 1 to 3) COLLECTIONS/STOCK CULTURES Natural History Collections DATABASES FACILITIES Controlled Environment Facilities
Field Stations Field Facility Structure Field Facility Equipment
LTER Site INDUSTRY PARTICIPATION
Technique Development TRACKING SYSTEMS Geographic Information Systems Remote Sensing NONE OF THE ABOVE
CATEGORY V: HABITAT (Select 1 to 2) TERRESTRIAL HABITATS
GENERAL TERRESTRIAL TUNDRA BOREAL FOREST TEMPERATE
Deciduous Forest Coniferous Forest Rain Forest Mixed Forest Prairie/Grasslands Desert
SUBTROPICAL Rain Forest Seasonal Forest
Savanna Thornwoods Deciduous Forest Coniferous Forest Desert
TROPICAL Rain Forest Seasonal Forest Savanna Thornwoods Deciduous Forest Coniferous Forest Desert
CHAPPARAL/ SCLEROPHYLL/ SHRUBLANDS ALPINE MONTANE CLOUD FOREST RIPARIAN ZONES ISLANDS (except Barrier Islands) BEACHES/ DUNES/ SHORES/ BARRIER ISLANDS CAVES/ ROCK OUTCROPS/ CLIFFS CROPLANDS/ FALLOW FIELDS/ PASTURES URBAN/SUBURBAN SUBTERRANEAN/ SOIL/ SEDIMENTS EXTREME TERRESTRIAL ENVIRONMENT AERIAL

Page 3
AQUATIC HABITATS GENERAL AQUATIC FRESHWATER
Wetlands/Bogs/Swamps Lakes/Ponds Rivers/Streams Reservoirs
MARINE
Open Ocean/Continental Shelf Bathyal Abyssal Estuarine Intertidal/Tidal/Coastal Coral Reef HYPERSALINE
EXTREME AQUATIC ENVIRONMENTCAVES/ ROCK OUTCROPS/ CLIFFS MANGROVES SUBSURFACE WATERS/ SPRINGS EPHEMERAL POOLS & STREAMS MICROPOOLS (Pitcher Plants, Tree Holes, Other)
MAN-MADE ENVIRONMENTS LABORATORY THEORETICAL SYSTEMS OTHER ARTIFICIAL SYSTEMS
NOT APPLICABLE NOT APPLICABLE
CATEGORY VI: GEOGRAPHIC AREA OF THE RESEARCH (Select 1 to 2) WORLDWIDE NORTH AMERICA
United States Northeast US (CT, MA, ME, NH, NJ, NY, PA, RI, VT) Northcentral US (IA, IL, IN, MI, MN, ND, NE, OH, SD, WI) Northwest US (ID, MT, OR, WA, WY) Southeast US (DC, DE, FL, GA, MD, NC, SC, WV, VA) Southcentral US (AL, AR, KS, KY, LA, MO,MS, OK, TN, TX) Southwest US (AZ, CA, CO, NM, NV, UT) Alaska Hawaii Puerto Rico
Canada Mexico
CENTRAL AMERICA (Mainland) Caribbean Islands Bermuda/Bahamas
SOUTH AMERICA
Eastern South America (Guyana, Fr. Guiana, Suriname, Brazil) Northern South America (Colombia, Venezuela) Southern South America (Chile, Argentina, Uruguay, Paraguay) Western South America (Ecuador, Peru, Bolivia)
EUROPE Eastern Europe Russia Scandinavia Western Europe
ASIA Central Asia Far East Middle East Siberia South Asia Southeast Asia
AFRICA
North Africa African South of the Sahara
East Africa Madagascar South Africa West Africa
AUSTRALASIA Australia New Zealand Pacific Islands
ANTARCTICA ARCTIC ATLANTIC OCEAN PACIFIC OCEAN INDIAN OCEAN OTHER REGIONS (Not defined) NOT APPLICABLE
CATEGORY VII: CLASSIFICATION OF ORGANISMS (Select 1 to 4) VIRUSES
Bacterial Plant Animal
PROKARYOTES Archaea Cyanobacteria Bacteria Noncultured Organisms
PROTISTA (PROTOZOA) Amoebae Apicomplexa Ciliophora Flagellates Foraminifera
Microspora Radiolaria
FUNGI Ascomycota Basidiomycota Chytridiomycota Mitosporic Fungi Oomycota Zygomycota
LICHENS SLIME MOLDS ALGAE
Bacillariophyta (Diatoms) Charophyta Chlorophyta
Chrysophyta Dinoflagellata Euglenoids Phaeophyta Rhodophyta
PLANTS NON-VASCULAR PLANTS
BRYOPHYTA Anthocerotae (Hornworts) Hepaticae (Liverworts) Musci (Mosses)
VASCULAR PLANTS FERNS & FERN ALLIES GYMNOSPERMS
Coniferales (Conifers)

Page 4
Cycadales (Cycads) Ginkgoales (Ginkgo) Gnetales (Gnetophytes)
ANGIOSPERMS Monocots
Arecaceae (Palmae) Cyperaceae Liliaceae Orchidaceae Poaceae (Graminae)
Dicots Apiaceae (Umbelliferae) Asteraceae (Compositae) Brassicaceae (Cruciferae) Fabaceae (Leguminosae) Lamiaceae (Labiatae) Rosaceae Solanaceae
ANIMALS INVERTEBRATES
MESOZOA/PLACOZOA PORIFERA (Sponges) CNIDARIA
Hydrozoa (Hydra, etc.) Scyphozoa (Jellyfish) Anthozoa (Corals, Sea Anemones)
CTENOPHORA (Comb Jellies) PLATYHELMINTHES (Flatworms)
Turbellaria (Planarians) Trematoda (Flukes) Cestoda (Tapeworms) Monogenea (Flukes)
GNATHOSTOMULIDA NEMERTINEA (Rynchocoela) (Ribbon Worms) ENTOPROCTA (Bryozoa) (Plant-like Animals) ASCHELMINTHES
Gastrotricha Kinorhyncha Loricifera Nematoda (Roundworms) Nematomorpha (Horsehair Worms) Rotifera (Rotatoria)
ACANTHOCEPHALA (Spiny-headed Worms) PRIAPULOIDEA BRYOZOA (Ectoprocta) (Plant-like Animals) PHORONIDEA (Lophophorates) BRACHIOPODA (Lamp Shells) MOLLUSCA
Monoplacophora Aplacophora (Solenogasters)
Polyplacophora (Chitons) Scaphopoda (Tooth Shells) Gastropoda (Snails, Slugs, Limpets) Pelecypoda (Bivalvia) (Clams, Mussels, Oysters, Scallops) Cephalopoda (Squid, Octopus, Nautilus)
ANNELIDA (Segmented Worms) Polychaeta (Parapodial Worms) Oligochaeta (Earthworms) Hirudinida (Leeches)
POGONOPHORA (Beard Worms) SIPUNCULOIDEA (Peanut Worms) ECHIUROIDEA (Spoon Worms) ARTHROPODA
Cheliceriformes Merostomata (Horseshoe Crabs) Pycnogonida (Sea Spiders) Scorpionida (Scorpions) Araneae (True Spiders) Pseudoscorpionida (Pseudoscorpions) Acarina (Free-living Mites) Parasitiformes (Parasitic Ticks & Mites)
Crustacea Branchiopoda (Fairy Shrimp, Water Flea) Ostracoda (Sea Lice) Copepoda Cirripedia (Barnacles) Amphipoda (Skeleton Shrimp, Whale Lice, Freshwater Shrimp) Isopoda (Wood Lice, Pillbugs) Decapoda (Lobster, Crayfish, Crabs, Shrimp)
Hexapoda (Insecta) (Insects) Apterygota (Springtails, Silverfish, etc.) Odonata (Dragonflies, Damselflies) Ephemeroptera (Mayflies) Orthoptera (Grasshoppers, Crickets)Dictyoptera (Cockroaches, Mantids, Phasmids) Isoptera (Termites) Plecoptera (Stoneflies) Phthiraptera (Mallophaga & Anoplura) (Lice) Hemiptera (including Heteroptera) (True Bugs) Homoptera (Cicadas, Scale Insects,Leafhoppers) Thysanoptera (Thrips) Neuroptera (Lacewings, Dobsonflies, Snakeflies) Trichoptera (Caddisflies) Lepidoptera (Moths, Butterflies) Diptera (Flies, Mosquitoes) Siphonaptera (Fleas)
Coleoptera (Beetles) Hymenoptera (Ants, Bees, Wasps, Sawflies)
Chilopoda (Centipedes) Diplopoda (Millipedes) Pauropoda Symphyta (Symphyla)
PENTASTOMIDA (Linguatulida) (Tongue Worms) TARDIGRADA (Tardigrades, Water Bears) ONYCHOPHORA (Peripatus) CHAETOGNATHA (Arrow Worms) ECHINODERMATA
Crinoidea (Sea Lilies, Feather Stars) Asteroidea (Starfish, Sea Stars) Ophiuroidea (Brittle Stars, Serpent Stars) Echinoidea (Sea Urchins, Sand Dollars) Holothuroidea (Sea Cucumbers)
HEMICHORDATA (Acorn Worms, Pterobranchs) UROCHORDATA (Tunicata) (Tunicates, Sea Squirts, Salps, Ascideans) CEPHALOCHORDATA (Amphioxus/Lancelet)
VERTEBRATES AGNATHA (Hagfish, Lamprey) FISHES
Chondrichthyes (Cartilaginous Fishes) (Sharks, Rays, Ratfish) Osteichthyes (Bony Fishes)
AMPHIBIA Anura (Frogs, Toads) Urodela (Salamanders, Newts) Gymnophiona (Apoda) (Caecilians)
REPTILIA Chelonia (Turtles, Tortoises) Serpentes (Snakes) Sauria (Lizards) Crocodylia (Crocodilians)
AVES (Birds) Passeriformes (Passerines)
MAMMALIA Monotremata (Platypus, Echidna) Marsupalia (Marsupials) Eutheria (Placentals)
Insectivora (Hedgehogs, Moles, Shrews, Tenrec, etc.) Chiroptera (Bats) Primates
Humans Rodentia Lagomorphs (Rabbits, Hares, Pikas)Carnivora (Bears, Canids, Felids, Mustelids, Viverrids, Hyena, Procyonids)
Perissodactyla (Odd-toed Ungulates) (Horses, Rhinos, Tapirs, etc.)

Page 5
Artiodactyla (Even-toed Ungulates) (Cattle, Sheep, Deer, Pigs, etc.)
Marine Mammals (Seals, Walrus, Whales, Otters, Dolphins, Porpoises)
TRANSGENIC ORGANISMS FOSSIL OR EXTINCT ORGANISMS
NO ORGANISMS
CATEGORY VIII: MODEL ORGANISM (Select ONE) NO MODEL ORGANISM MODEL ORGANISM (Choose from the list)
Escherichia coli Mouse-Ear Cress (Arabidopsis thaliana)
Fruitfly (Drosophila melanogaster)

PROJECT SUMMARYOverview:
Page A
Addressing many intriguing biological questions depends on having appropriate comparativemethods created and available in software, but the pace of this development is slow. On theother hand, the rise of scripting as an approach to doing biology has made a pool of scientistswith skills to create their own methods. This project combines new approaches for approximateBayesian computation (ABC) for comparative methods as a way to implement new models with meetingsto have new and experienced coders work together on projects (hackathons) as well as a newopen phylogenetics course. Together, this will speed up methods development, broaden the pool(in number and diversity) of people who can create new approaches to answer their questions,and strengthen phylogenetic training in general.
Intellectual Merit :This proposal will bring cutting-edge computational approaches into comparative methods withthe goal of making development of new models and thus addressing of biological questions fareasier. Models can be created (and have been for example datasets) that allow for interactionsbetween species as well as explicit modeling of processes occurring per generation. Advancedusers can develop their own or tweak those published by others.
Broader Impacts :A series of hackathons will be held to help peers who are transitioning from using tools todeveloping tools acquire the necessary skills. Many participants in these hackathons willbe from underrepresented groups, as in past hackathons I have planned. There will also bean open phylogenetics course taught every year with online videos, lectures, and exercises.This will also support the career of someone already pursuing broader impacts through evolutioneducation (as advisor to Darwin Day Tennessee), organization of several scientific meetings,and numerous women in science activities.

TABLE OF CONTENTSFor font size and page formatting specifications, see GPG section II.B.2.
Total No. of Page No.*Pages (Optional)*
Cover Sheet for Proposal to the National Science Foundation
Project Summary (not to exceed 1 page)
Table of Contents
Project Description (Including Results from PriorNSF Support) (not to exceed 15 pages) (Exceed only if allowed by aspecific program announcement/solicitation or if approved inadvance by the appropriate NSF Assistant Director or designee)
References Cited
Biographical Sketches (Not to exceed 2 pages each)
Budget (Plus up to 3 pages of budget justification)
Current and Pending Support
Facilities, Equipment and Other Resources
Special Information/Supplementary Documents(Data Management Plan, Mentoring Plan and Other Supplementary Documents)
Appendix (List below. )(Include only if allowed by a specific program announcement/solicitation or if approved in advance by the appropriate NSFAssistant Director or designee)
Appendix Items:
*Proposers may select any numbering mechanism for the proposal. The entire proposal however, must be paginated.Complete both columns only if the proposal is numbered consecutively.
1
1
13
3
2
8
1
1
4

1
CAREER: Reducing barriers for comparative methods
For decades, biologists have addressed evolutionary and ecological questions using measurements of species traits, phylogenies, and an assortment of comparative methods. Unfortunately, while there is a large assortment of these methods, they are still fairly limited and development of new methods is slow. It took seven years between the introduction of using a simple Brownian motion model for looking at trait evolution (Felsenstein 1985) and the use of this same model for looking at rates of trait evolution (Garland 1992), and an additional 14 years to more powerful tests using a small modification of the basic model (O'Meara et al. 2006; Thomas et al. 2006). Once this tool was available, it quickly spurred empirical research (Collar et al. 2005; Davis et al. 2007; Barkman et al. 2008; Edwards and Still 2008). A basic model of trait correlation (Pagel 1994) has been available for 16 years, and although available in multiple software packages, its use was limited to two binary traits until Beaulieu and Donoghue (2013), who extended it to just three binary traits. Empiricists seeking to look at correlation must still shoehorn their characters into two-state characters. Still other promising methods (Huelsenbeck and Rannala 2003; Huelsenbeck et al. 2003) are described and even tested but remain unavailable to empiricists because they are not put into software. As a result, the questions empiricists can ask about the world are limited by the research productivity of the few dozen scientists who develop and implement new methods in phylogenetics.
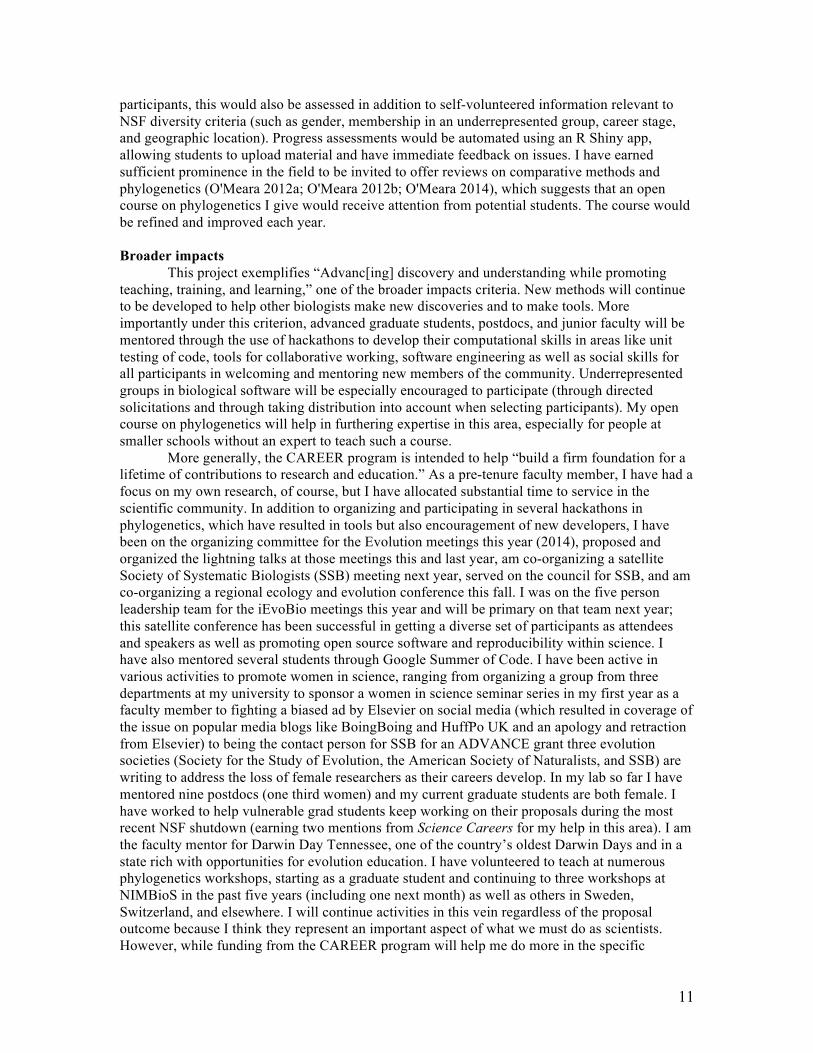
There are signs of hope, however. First, the rise of scripting languages like R and python means that rather than developers working with source code and users working in graphical interfaces or simple command line programs receiving arguments, as was common with C and Java, everyone works in the same environment, creating scripts consisting of a set of functions (Figure 1). This makes a more gradual entry into coding possible: rather than having to learn something completely different from what is used by empiricists, biologists can add knowledge gradually. For example, rather than copying and pasting the same command for each tree, they can put it in a loop by adding two lines; later they can put this loop into a function by adding two more lines, and so on. I curate the official description of all packages in R (equivalent to small software programs) for comparative methods and phylogenetics (O'Meara 2014), and I have seen the growth of numbers of developers who would once have been advanced users of approaches but now, due to the lower bar to entry, are becoming more common. However, this is a key group where key investments in education can dramatically pay off, in terms of enabling better science for all, better professional outcomes for these researchers, and a more representative scientific workforce.
I thus propose to merge development of new methods with training of junior scientists at the stage of beginning to develop tools for the scientific community, along with additional efforts to make training in phylogenetic methods more available. This will build
Java: Mesquite�
R: ape �
User� Developer�
User� Developer�
Figure 1: Comparison of user interfaces. Note the differences between the graphical interface of a typical Java program and the underlying view for a developer with the very similar interfaces for a user and a developer of R (or similar scripting languages)

2
on my existing outreach efforts and training in this area and my ongoing work on developing and implementing comparative methods.
With phylogenetic methods, I have developed some key approaches for looking at different rates of evolution (O'Meara et al. 2006), different evolutionary optima, rates, and strengths of pulls (Beaulieu et al. 2012), looking at heterogeneity in discrete trait evolution (O'Meara 2007; Beaulieu et al. 2013), and estimating evolutionary pathways (Zanne et al. 2014). Ongoing work in the lab includes development of diversification models (funded by support to a NIMBioS postdoc, Jeremy Beaulieu), multivariate extension of trait plus diversification models (O’Meara et al., in review in PNAS), an equivalent of ModelTest (Posada and Crandall 1998) for phylogeography (funded by an NSF grant to me, with Bryan Carstens as Co-PI) based on my earlier work (O'Meara 2010) on species delimitation, a model for comparative methods for hybrid networks (Jhwueng and O’Meara, in revision), and a population genetics based model for amino acid and codon usage evolution on phylogenies (funded by an NSF grant to me, with Mike Gilchrist as Co-PI). In my career, my goal is to eliminate barriers to answering key evolutionary questions by developing, testing, and applying novel techniques. I see the next step forward as more flexible models allowing creation of richer approaches through the use of forward-in-time simulations of a process. For example, to date no one has developed and implemented a likelihood equation for a model of character displacement (a difficult task, as most work in this domain assumes lineages are independent post-speciation, something this model could not assume). Developing a simulation of such a process is relatively straightforward: at a given moment of time, each species moves its trait value away from its nearest neighbor’s trait value, with some variance (so one just has to pick a number from a normal distribution with mean affected by current state and nearest neighbor state as the new trait value). Writing simulations of this sort to gain insight into biological processes has a moderately long history in biology/paleontology, but actually using simulations to estimate evolutionary parameters is not generally done, with rare specialized exceptions (Weir and Schluter 2007; Rabosky 2009). With the recent development of methods of approximate Bayesian computation (ABC), especially in genetics (Beaumont et al. 2002; Marjoram et al. 2003; Sisson et al. 2007), this should be possible to do for comparative methods. In collaboration with a postdoc (Barb Banbury), I have created such an approach. It needs to be made more general, faster, and additional examples developed, but it is already useful. A given model in this approach will be much slower to use than one with a dedicated equation (hours versus seconds in the case of a simple Brownian motion model, for example). Where equations exist and are implemented, biologists will use those tools. In the many areas where biologists want a method to model a process that is not available in software, however, the new approaches change the waiting time for such methods from decades (depending on theoretician and developer interest) to minutes to hours of basic coding and a few days to weeks of computer analysis. Moreover, once one biologist publishes using a novel model, others may also use that same model. This will tie in with hackathons (described more fully below; they are meetings where developers and others with expertise gather to create and extend software), as they will include researchers developing models for this framework as well as researchers developing their own methods.
Background
To understand approximate Bayesian computation, it can be helpful to use a toy example. Imagine having a coin that has the probability of getting heads, denoted by p. Flip it twenty times and get a string of 11111011101111100100, where 1 represents heads and 0 represents tails. The probability of getting a particular result for a given flip i is pxi (1� p)1�x i . Thus, the probability of
observing these twenty results is pxi (1� p)1� x ii=1
20
� . Using this likelihood function, one could
develop an estimate of p using likelihood or Bayesian approaches. However, what if this

3
likelihood function were unknown or at least difficult to create? Even for this simple example, many biologists would turn to an introduction to statistics to get this function and might have trouble if one were not available.
A different way to estimate p would be simulating twenty tosses under a variety of potential values for p and seeing which value of p most frequently gets results matching the observed results. If three billion simulations are done for each of a set of values of p, getting 11111011101111100100 exactly would occur in approximately two of the simulations using p = 0.25, and in over 13,000 of the simulations using p = 0.75, suggesting that the likelihood of p = 0.75 is approximately 6,500 times higher than p = 0.25 (a log-likelihood difference of 8.8). This can be programmed very simply: simulate coin flipping twenty times, repeat this subroutine many times, and record how frequently the string of twenty simulated flips matches the observed string of flips for various values of p. By doing many simulations over all possible values of p, an approximation of the likelihood equation can be achieved.
This approach has a few deficiencies. First, it is remarkably inefficient. Using the analytical likelihood function quickly gives the likelihood: plug in the observed string of flips and p, and simple arithmetic returns even very small likelihoods. The simulation approach, however, may take billions of simulations to estimate this same probability with any precision. Second, it also fails completely when the observations are continuous rather than discrete, as the probability of getting exactly the same value in the simulated and observed datasets is vanishingly small (depending on numerical precision). Third, it may spend a lot of time getting estimates of likelihoods for parameter values that are far from what are optimal.
Tavare et al. (1997) developed a somewhat more sophisticated approach that used a summary statistic rather than the raw data (i.e., in the coin example, one could use the proportion of heads rather than the actual sequence of heads and tails) and returned a posterior probability rather than just a likelihood surface. Later work introduced ideas of acceptance of some simulated results not identical to observed data (making analyses more efficient), simulating from a specified prior, use of multiple summary statistics, and other ways to make searches more efficient (Beaumont et al. 2002). Sisson et al. (2007) introduced an efficient algorithm that uses multiple generations of simulations seeded from the results of earlier generations to estimate a posterior distribution. This is the approach used in the preliminary work described below.
Preliminary work
We have created a basic R package, TreEvo, that implements the essentials of this method and made it publicly available; the analyses and visualizations which follow were made with this package. The basic simulation design is simple. An input tree is divided into many small discrete time intervals. Evolution starts at the root. At each time interval, the species existing at that time develop new states. They do this according to two functions: the “intrinsic function”, which generates new states based only on each species’ own current states (and perhaps the time interval) and the “extrinsic function”, which generates new states based on both their own states and the states of other species existing at that time. This movement is split into two different functions to make it easier to code the effect of different mechanisms, i.e., drift moving states in the “intrinsic” function and character displacement moving states in the “extrinsic” function, though using just one of the functions is an option. Empiricists can use existing intrinsic or extrinsic functions or create their own. For example, an intrinsic function for Brownian motion (which can be caused by tracking local adaptive peaks, genetic drift, or many other mechanisms (Hansen and Martins 1996)), as coded in R, is:
brownianIntrinsic<-function(params, states, timefrompresent) { newdisplacement<-rnorm(n=length(states),mean=0,sd=params) return(newdisplacement) }

4
which just means generate new displacements for states from a normal distribution (“rnorm()”) with standard deviations based on values fixed in the simulation (“sd=params”). If someone wanted to use a different distribution, say a lognormal distribution, all she or he would do is copy the function, rename it, and replace rnorm with rlnorm or some other distribution. Coding is only slightly more complex for extrinsic functions (as the states of the other taxa also enter into the calculation).
Once the model functions for the simulations are defined, or selected from those already available in the package, the user must include prior distributions for the values of the parameters. We have implemented uniform, normal, lognormal, exponential, and gamma priors, as well as the ability assign fixed values. The user also loads the tree and trait data (in the same format used by Geiger (Harmon et al. 2008) and several other phylogenetics packages).
The actual approximate Bayesian computation (ABC) approach developed here combines an algorithm based on the ABC-PRC method of Sisson et al. (2007) with ideas about threshold determination and transformations of statistics from Wegmann et al. (2009). Parameter values are first pulled at random from the prior (one such combination is termed a “particle”) and trait data is simulated given the tree and selected values. The Euclidian distance between transformed summary statistics for the simulated and actual trait values (more on this below) is calculated, and “particles” with distances below some threshold are saved. After enough particles have been saved, a new generation of particles is generated by mutating the saved particles. Particles with small enough distances from this generation are used to seed another generation, and this continues up to a fixed number of generations. Parameter values of particles in the last generation, weighted by particle weights, can be used to estimate the posterior probabilities of parameter values and thus estimate the true values of the parameters for the observed data.
Two main practical problems in running ABC analyses is selecting appropriate summary statistics and choosing a distance threshold. A summary statistic is simply a way of summarizing a set of data (examples include the mean and the variance). In a coin-flipping example, the raw data is the sequence of results (HHHTHTTHHH) while summary statistics could be the proportion of heads (0.7) or the longest string of tails (2). In classical statistics, the idea of a “sufficient statistic” is often used, which is a summary statistic that has as much information about the value of a parameter as does the original data, but these are often unknown in problems appropriate for ABC. Also, one wants to choose summary statistics that are informative for the variety of models users might try to use in this program. Thus, in the initial implementation, a variety of summary
Figure 2: Distance between summary value of simulated particles and observed particle (y-axis). The true parameter used to create the observed particle is the red line; various values (along x-axis) are tried and the distance between the particles resulting and the observed particle using particular summary statistics (here, the raw mean of the tip states in the first column and the Brownian motion rate parameter under a continuous time model in the second column) are plotted. For the root state (top row), the simple mean of the tip taxa is a much better estimate than the rate under a continuous time BM model, while for a discrete time BM rate (bottom row), the continuous time BM rate summary statistic works better. The software automatically decides which parameter or parameters work best as summary statistics.
5
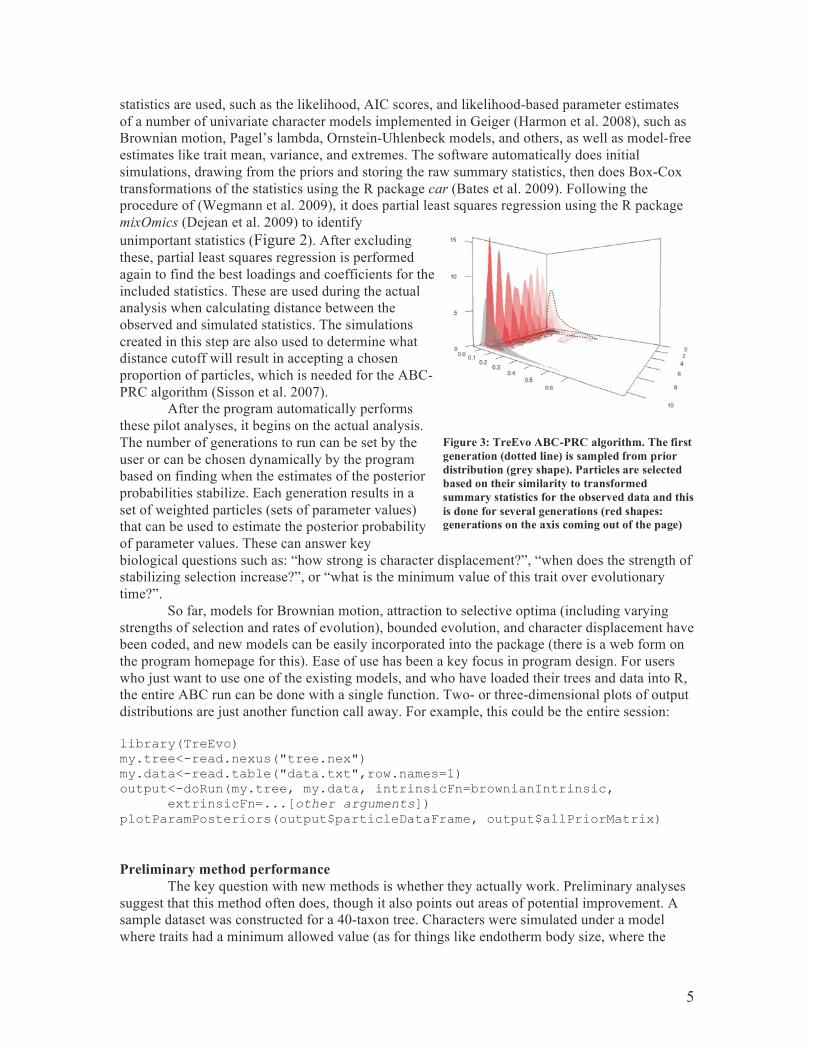
statistics are used, such as the likelihood, AIC scores, and likelihood-based parameter estimates of a number of univariate character models implemented in Geiger (Harmon et al. 2008), such as Brownian motion, Pagel’s lambda, Ornstein-Uhlenbeck models, and others, as well as model-free estimates like trait mean, variance, and extremes. The software automatically does initial simulations, drawing from the priors and storing the raw summary statistics, then does Box-Cox transformations of the statistics using the R package car (Bates et al. 2009). Following the procedure of (Wegmann et al. 2009), it does partial least squares regression using the R package mixOmics (Dejean et al. 2009) to identify unimportant statistics (Figure 2). After excluding these, partial least squares regression is performed again to find the best loadings and coefficients for the included statistics. These are used during the actual analysis when calculating distance between the observed and simulated statistics. The simulations created in this step are also used to determine what distance cutoff will result in accepting a chosen proportion of particles, which is needed for the ABC-PRC algorithm (Sisson et al. 2007).
After the program automatically performs these pilot analyses, it begins on the actual analysis. The number of generations to run can be set by the user or can be chosen dynamically by the program based on finding when the estimates of the posterior probabilities stabilize. Each generation results in a set of weighted particles (sets of parameter values) that can be used to estimate the posterior probability of parameter values. These can answer key biological questions such as: “how strong is character displacement?”, “when does the strength of stabilizing selection increase?”, or “what is the minimum value of this trait over evolutionary time?”.
So far, models for Brownian motion, attraction to selective optima (including varying strengths of selection and rates of evolution), bounded evolution, and character displacement have been coded, and new models can be easily incorporated into the package (there is a web form on the program homepage for this). Ease of use has been a key focus in program design. For users who just want to use one of the existing models, and who have loaded their trees and data into R, the entire ABC run can be done with a single function. Two- or three-dimensional plots of output distributions are just another function call away. For example, this could be the entire session:
library(TreEvo) my.tree<-read.nexus("tree.nex") my.data<-read.table("data.txt",row.names=1) output<-doRun(my.tree, my.data, intrinsicFn=brownianIntrinsic,
extrinsicFn=...[other arguments]) plotParamPosteriors(output$particleDataFrame, output$allPriorMatrix)
Preliminary method performance The key question with new methods is whether they actually work. Preliminary analyses
suggest that this method often does, though it also points out areas of potential improvement. A sample dataset was constructed for a 40-taxon tree. Characters were simulated under a model where traits had a minimum allowed value (as for things like endotherm body size, where the
Figure 3: TreEvo ABC-PRC algorithm. The first generation (dotted line) is sampled from prior distribution (grey shape). Particles are selectedbased on their similarity to transformed summary statistics for the observed data and this is done for several generations (red shapes: generations on the axis coming out of the page)
6
allometry of area and volume suggest there are small (but nonzero) sizes that require too much energy to be viable) and where species repelled each other (suggesting character displacement). Two runs were performed, each taking less than 24 hours on a single processor. Posterior probabilities for the rate of evolution and two character displacement variables included the true values, though the rate of evolution was generally underestimated. Estimates for the minimum value generally did not perform well, but this may be due to the particular parameter values for this model. Character displacement was high enough that some species were forced against the minimum values. The prior on the minimum value was based partly on data (the theoretical minimum must be no larger than the empirical minimum), which in this case meant that the prior was bounded at the true value and so the posterior could not include the true value. However, in one of the simulations, the posterior was still rather distant from the true value.
Another key question is method speed. Simulating evolution thousands of times on a tree can be costly. By breaking the tree up into discrete time slices, rather than simulating states at internal and terminal nodes, makes models easier to construct but requires many more simulation steps. R, as an interpreted language, is not necessarily fast, though it is possible to have it call compiled C or C++ code, and many packages do this (including two existing packages (Bolker et al. 2011; Stack et al. 2011) co-authored by the PI). Many aspects of the existing prototype code can be optimized for speed but have yet to be done. For example, in an era when even cell phones have multiple core processors, multi-threading is a valuable option for speeding execution. The R package doMC (Revoluton_Analytics 2011) for example, can be used to automatically split parallelizable tasks (like the many particle simulations per generation) into separate threads that run on all the available cores. There are further areas to optimize speed in vectorizing operations and even porting some code to C or C++. However, even in its current non-optimized state, the code is fast enough to be practical for use on moderate-sized trees. On a single core, a tree of 50 taxa takes less than 15 hours to run, while a tree of 100 taxa takes less than 2.5 days (trivial, in comparison to the typical time need to acquire data for a comparative analysis). However, preliminary analyses show that run time increases exponentially with tree size, so very large trees cannot yet be analyzed using this approach. This still does not yet impact the majority of current analyses, but will be an issue in the future. Speeding up the method will thus be one of the main focuses for this work.
Finally, preliminary work has shown areas where there still may be problems with the current implementation. In cases where the data are uninformative about a parameter, the posterior generally closely resembles the prior, which is appropriate. However, with at least one empirical dataset (centrarchid fishes), for one parameter, I have noted that different TreEvo runs, using the same dataset and same parameters, will return narrow posteriors but with no overlap between runs. This suggests that in this case, parameter space is not being explored well, but further investigation is needed. It has rarely occurred in other datasets, simulated or empirical, but represents a concern.
Empirical example 1: Cuban Anolis
Anolis lizards are one of the most conspicuous examples of an adaptive radiation. This is especially true in the Greater Antilles (Cuba, Hispaniola, Jamaica, and Puerto Rico) where anoles are the most abundant vertebrates and often live in sympatry with many other ecologically and morphologically distinct species (Losos 2009). The Greater Antillean anoles radiated in an iterative process with speciation occurring independently on each island. I focused a case study on anoles from the largest island, Cuba, to determine whether there was any signal of character displacement. Specifically, the model I tried to fit had exponentially-decaying evolutionary “push”: two species with identical traits would be pushed apart with a force that declined exponentially as they grew further apart in parameter space. This force could be negative, however, which then becomes a model of attraction of species towards each other in trait value (due to mimicry or some other process). Free parameters in this model are maximum

7
displacement force (for two identical species, their displacement is some finite value), the rate at which this decays with morphological distance (parameterized as the morphological distance at which the force is half the maximum force), root state, and how stochastic trait evolution is (a Brownian motion “wiggle”, which can reflect factors such as genetic drift or following selective optima). Our data set (kindly provided by Dr. Rich Glor, U. Kansas) consisted of an Anolis phylogeny and data on snout-vent length, a standard body size measure for Anolis. While other traits are implicated in Anolis character displacement (Losos 1990), I chose to focus on this readily-understandable trait for an example dataset. The dataset was pruned from 80 original species to just 25 Cuban species: if there is character displacement, it will appear between species that may theoretically interact in nature. Figure 4 shows the tree with a simulated character under this model (with simulation parameter values based on the ABC results, below).
Analyses were run in two ways. One was using a simple ABC-rejection algorithm, under which we simulated 40,000 replicates from a user-set prior distribution (for example, a normal prior for root state using raw species mean and standard deviation) and then used the R package abc (Csillery 2011) with a tolerance of 0.01 to estimate posterior probabilities. The second was using the ABC-PRC algorithm implemented in TreEvo, starting with 3,000 simulations to automatically infer which summary statistics were most useful and estimate parameters for a partial least squares regression between the summary statistic values and the known simulation parameters. Then, up to fifteen generations of 300 particles each were used to generate a posterior sample of particles. The ABC-PRC approach was run four times so the variation across runs could be evaluated (these runs took 41.3 ± 3.1 hours each, using just a single core per run). ABC-rejection and ABC-PRC gave overall similar results (see Figure 5, next page). The most interesting difference is in the estimation of the sign of the maximum force: the ABC-rejection method gives a posterior probability of 0.80 of it being positive (suggesting some evidence displacement) whereas the ABC-PRC method gives a posterior probability of 0.52 of it being positive. The weak support for positive direction of displacement supports the idea of Losos (1990) that body size alone is not a major axis of competitive variation.
Empirical example 2: Aquilegia Columbines (Aquilegia spp.) are a notable example of coevolution between pollinators
and flowers, shown by nectar spur length correlating with pollinator tongue length, as well as similar correlations for color, position, and other traits (Kramer and Hodges 2010). Whittall and Hodges (2007) published a notable study where they investigated the idea that pollinator shifts drove spur length: flowers that switched to hummingbirds had longer spurs than those that used bees, and those that used hawkmoths had longer spurs than either. They used an Ornstein-Uhlebeck model (Butler and King 2004) to find that the best model was one of three distinct peaks, with different pollinator regimes getting their own peak, as well as using a contrasts-based analysis (Felsenstein 1985) to show a correlation between shifts in pollinators and increases in spur length. Though useful approaches, these are just proxies for the unidirectional shift model they were trying to investigate. With our approach, it is possible to directly model the process, which strengthens their conclusion. Unlike the Anolis example, all that matters in this process is
Figure 4: Single simulation of snout-vent length evolution on a Cuban Anolis tree using mean posterior estimates for parameter values. Note the general, but not complete, lack of crossing histories.

8
change within species, not interactions between species. The process is modeled with just a few lines of code:
pollinatorShiftIntrinsic <-function(params, states, timefrompresent){ if (runif(1, 0, 1) < params[4]) {
background.process<-FALSE } if (background.process) {
newdisplacement <- rnorm(n=length(states), mean=0, sd=params[1]) return(newdisplacement)
} else { newdisplacement <- rnorm(n=length(states), mean=params[3],
sd=params[2]) return(newdisplacement)
} }
which models the whole process using just four parameters: the amount of change of spur length along branches under normal conditions, the amount of change when there is a pollinator shift, mean direction of the size change with a shift, and the frequency with which a pollinator shift happens. All the parameters come in understandable units: log(mm) for lengths, frequency per generation for rates, and so forth. Using this model, we found that there was little information in the data about frequency of the pollinator shift (posterior distribution tended to match a uniform distribution with a uniform prior, and an exponential distribution with an exponential prior), but that there was information about the direction of the shift, with a posterior probability of 77% for a positive change parameter. While there are new approaches that allow fitting of regimes (Ingram and Mahler 2013), from which one could reconstruct the history of changes (say, six increases and one decrease) it is much more informative to directly model the envisioned process happening in each generation and estimate the parameters of that process, something that is possible with this approach. This also shows how relatively straightforward this approach would be to extend: if someone thinks that a trait evolves with a mixture of a normal distribution process sometimes and an exponential distribution other times, she or he would just need to change the second “rnorm” line to “rexp” and a single exponential parameter rather than two (mean and sd)
Figure 5: Comparison of the ABC-rejection results (top row) and ABC-PRC results (bottom row) for Anolis. Note that the ABC-PRC results show posteriors from four runs overlapping (most noticeable in the last plot)
9
normal distribution parameters to create such a model. This is essentially no harder than choosing a different prior in Beast (Drummond et al. 2012) or MrBayes (Ronquist et al. 2012) for tree inference, something thousands of biologists do, but allows them to create new approaches. Of course, more complex models will require more work and skill to create, but the key is to provide a gentle ramp to allow biologists to acquire this expertise, in the same way people start running software using defaults only and only later start adjusting to better suit their needs.
Education plan: Traditionally in biology we consider education as applying to students: usually undergraduate or graduate students, but sometimes in an outreach component to pre-college students. However, despite the laudable requirement of postdoc mentoring plans in NSF proposals, we still do not focus on people at the postdoc level or early career level, even though this is where we lose much of the diversity in science (Pell 1996; Sheltzer and Smith 2014). This grant will include two educational components: one is a series of hackathons: gatherings where programmers and others with relevant expertise gather to solve particular problems. This is a form of active learning where peers learn from each other, but the expected participants are advanced graduate students, postdocs, and some faculty. The second is a graduate-level course in phylogenetic methods that will also be run as an online open course; this will primarily benefit graduate students at my current institution as well as others who will have access to course materials and me as an instructor.
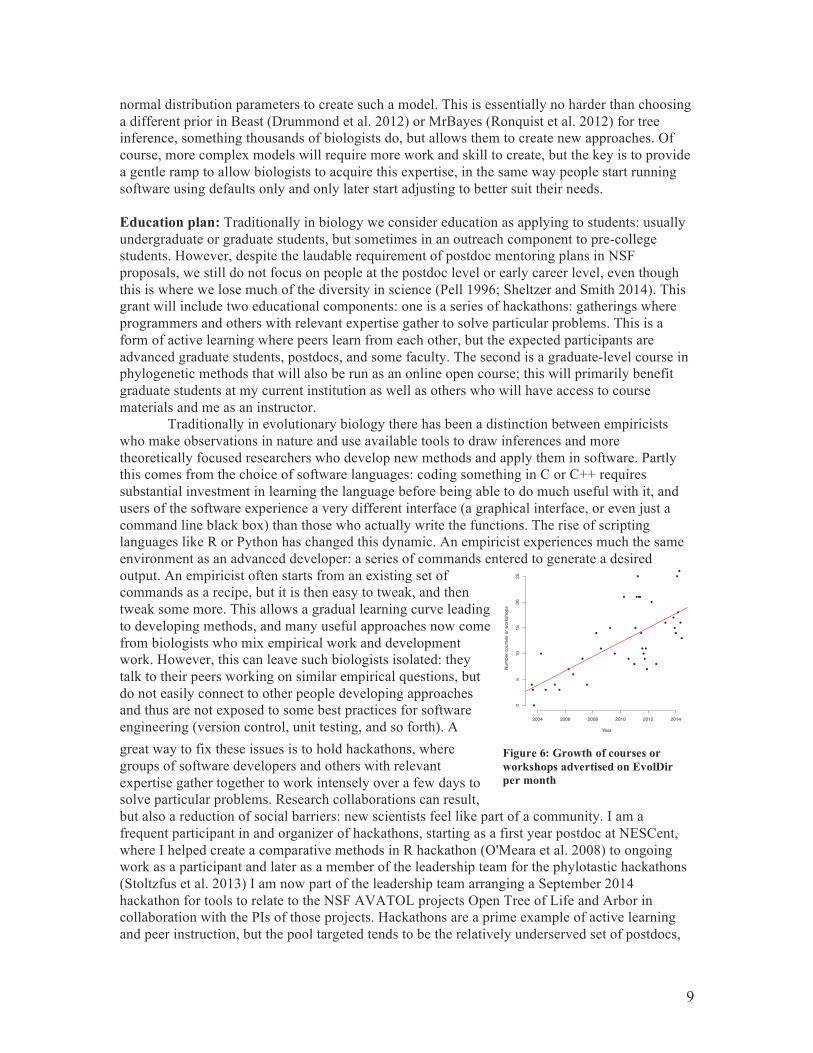
Traditionally in evolutionary biology there has been a distinction between empiricists who make observations in nature and use available tools to draw inferences and more theoretically focused researchers who develop new methods and apply them in software. Partly this comes from the choice of software languages: coding something in C or C++ requires substantial investment in learning the language before being able to do much useful with it, and users of the software experience a very different interface (a graphical interface, or even just a command line black box) than those who actually write the functions. The rise of scripting languages like R or Python has changed this dynamic. An empiricist experiences much the same environment as an advanced developer: a series of commands entered to generate a desired output. An empiricist often starts from an existing set of commands as a recipe, but it is then easy to tweak, and then tweak some more. This allows a gradual learning curve leading to developing methods, and many useful approaches now come from biologists who mix empirical work and development work. However, this can leave such biologists isolated: they talk to their peers working on similar empirical questions, but do not easily connect to other people developing approaches and thus are not exposed to some best practices for software engineering (version control, unit testing, and so forth). A great way to fix these issues is to hold hackathons, where groups of software developers and others with relevant expertise gather together to work intensely over a few days to solve particular problems. Research collaborations can result, but also a reduction of social barriers: new scientists feel like part of a community. I am a frequent participant in and organizer of hackathons, starting as a first year postdoc at NESCent, where I helped create a comparative methods in R hackathon (O'Meara et al. 2008) to ongoing work as a participant and later as a member of the leadership team for the phylotastic hackathons (Stoltzfus et al. 2013) I am now part of the leadership team arranging a September 2014 hackathon for tools to relate to the NSF AVATOL projects Open Tree of Life and Arbor in collaboration with the PIs of those projects. Hackathons are a prime example of active learning and peer instruction, but the pool targeted tends to be the relatively underserved set of postdocs,
�
�
�
�
�
�
�
�
�
�
�
�
�
�
�
�
�
�
�
�
�
��
�
�
�
�
�
�
�
�
�
�
�
�
�
�
�
�
�
2004 2006 2008 2010 2012 2014
05
1015
2025
Year
Num
ber c
ours
es o
r wor
ksho
ps
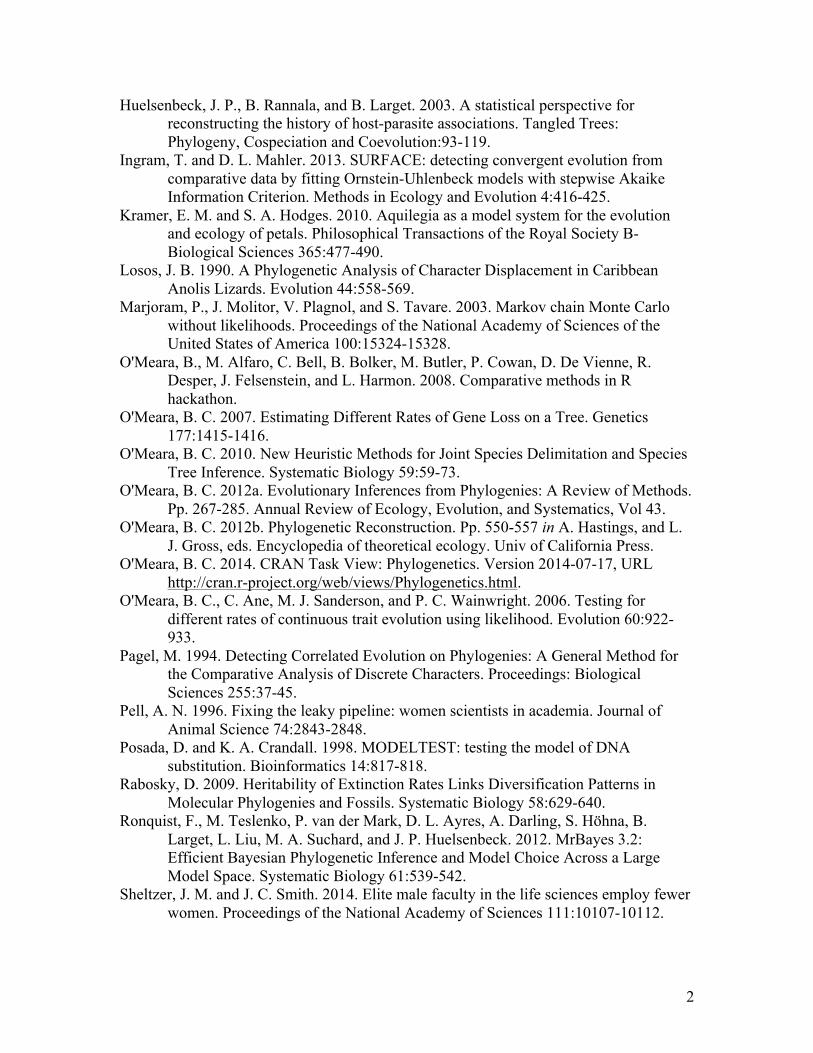
Figure 6: Growth of courses or workshops advertised on EvolDir per month

10
relatively senior graduate students, and to a lesser degree early career faculty. This is a pool for which there are many and a growing number of workshops, including ones I have taught in (Arnold & Felsenstein’s Evolutionary Genetics workshop at NESCent, Bodega Bay Workshop in Applied Phylogenetics Methods, the phrapl workshop organized by Bryan Carstens and me, etc.) as well as many others (see ��������) but these miss those who have started going from being users to being creators.
One key element to having a successful hackathon with an educational outcome is ensuring a diverse pool of participants, both in terms of career stage or experience as well as gender balance and other NSF diversity criteria. We have had moderate balance in hackathons we have planned (with still some room for improvement) by addressing this at two stages. The first is, in addition to having an open call for participants, to directly solicit applications from scientists who have useful skills to offer but who may be hesitant to push themselves forward for various reasons, including the frequent and accurate reports of discrimination or hostile environments at many events focused on programming. The second step is to monitor diversity criteria while deciding on the final list of invitees for a hackathon and adjust as necessary, though recent hackathons have already had moderate diversity in the pool of applicants (for example, for the Sept. 2014 hackathon, 30% of applicants specifying a gender were female (15/50), which rose to 33% of applicants invited to attend the hackathon (13/39)). For hackathons under this grant, a key objective will be to use them for teaching, so I will include a mixture of experienced developers who can exemplify best practices and serve as informal mentors and more junior (in terms of experience) developers who bring in new ideas but who can benefit from interactions with others to learn best practices, pitfalls, and so forth. Participants will be surveyed before and after the hackathons, with an emphasis on what they learned that should be passed on to others, what did not work, any issues that made parts of the community feel unwelcome, and general suggestions for future hackathons.
The hackathon topics will be chosen to address pressing needs in evolutionary biology. This shifts through time as technology develops; a hackathon to connect approaches to dealing with nextgen data would be useful now, for example, but would not have been as useful ten years ago. The first hackathon will be on comparative methods at large scales and will invite participants who will extend the models involved in TreEvo as well as other biologists working in comparative methods. Through NSF initiatives like the AToL and OpenTree programs, biologists have been developing phylogenies at larger scales, up to tens of thousands of taxa. Many questions may be better addressed at smaller scales (evolution of tool use in primates, for example, probably does not require a phylogeny of metazoa), but for some questions such a tree is imperative. Thus, this first hackathon will be intended to scale methods to large trees. Future hackathon topics will be decided based on community involvement plus decisions by me as to scope. We have adopted this model in planning past hackathons as well as topics for the iEvoBio meetings, where we have an overall goal but let the community drive details: perhaps there needs to be a push for more methods in python, or methods to deal with reticulate phylogenies, or other areas where improvements are necessary and there is a good pool of developers with sufficient career and other diversity to make it appropriate as part of the grant.
I currently co-teach a one-semester evolutionary biology core course for all incoming graduate students in our ecology and evolutionary biology program; my areas of instruction are building and using phylogenetic trees to answer questions. As part of this grant, I will stop teaching in this and instead develop a full semester graduate course on addressing questions using phylogenies. This is something in demand by students here across departments. I will also informally offer this online: that is, release all slides, videos, and exercises online as a dedicated open site, as well as maintain an online forum for the course, but not formally offer credit for completion. I now use pre-course and post-course assessment of content understanding for all my courses, using standard assessment tools (such as Baum et al. (2005)) as well as questions to address other content, in addition to traditionally required student feedback forms. For online
11
participants, this would also be assessed in addition to self-volunteered information relevant to NSF diversity criteria (such as gender, membership in an underrepresented group, career stage, and geographic location). Progress assessments would be automated using an R Shiny app, allowing students to upload material and have immediate feedback on issues. I have earned sufficient prominence in the field to be invited to offer reviews on comparative methods and phylogenetics (O'Meara 2012a; O'Meara 2012b; O'Meara 2014), which suggests that an open course on phylogenetics I give would receive attention from potential students. The course would be refined and improved each year.
Broader impacts
This project exemplifies “Advanc[ing] discovery and understanding while promoting teaching, training, and learning,” one of the broader impacts criteria. New methods will continue to be developed to help other biologists make new discoveries and to make tools. More importantly under this criterion, advanced graduate students, postdocs, and junior faculty will be mentored through the use of hackathons to develop their computational skills in areas like unit testing of code, tools for collaborative working, software engineering as well as social skills for all participants in welcoming and mentoring new members of the community. Underrepresented groups in biological software will be especially encouraged to participate (through directed solicitations and through taking distribution into account when selecting participants). My open course on phylogenetics will help in furthering expertise in this area, especially for people at smaller schools without an expert to teach such a course.
More generally, the CAREER program is intended to help “build a firm foundation for a lifetime of contributions to research and education.” As a pre-tenure faculty member, I have had a focus on my own research, of course, but I have allocated substantial time to service in the scientific community. In addition to organizing and participating in several hackathons in phylogenetics, which have resulted in tools but also encouragement of new developers, I have been on the organizing committee for the Evolution meetings this year (2014), proposed and organized the lightning talks at those meetings this and last year, am co-organizing a satellite Society of Systematic Biologists (SSB) meeting next year, served on the council for SSB, and am co-organizing a regional ecology and evolution conference this fall. I was on the five person leadership team for the iEvoBio meetings this year and will be primary on that team next year; this satellite conference has been successful in getting a diverse set of participants as attendees and speakers as well as promoting open source software and reproducibility within science. I have also mentored several students through Google Summer of Code. I have been active in various activities to promote women in science, ranging from organizing a group from three departments at my university to sponsor a women in science seminar series in my first year as a faculty member to fighting a biased ad by Elsevier on social media (which resulted in coverage of the issue on popular media blogs like BoingBoing and HuffPo UK and an apology and retraction from Elsevier) to being the contact person for SSB for an ADVANCE grant three evolution societies (Society for the Study of Evolution, the American Society of Naturalists, and SSB) are writing to address the loss of female researchers as their careers develop. In my lab so far I have mentored nine postdocs (one third women) and my current graduate students are both female. I have worked to help vulnerable grad students keep working on their proposals during the most recent NSF shutdown (earning two mentions from Science Careers for my help in this area). I am the faculty mentor for Darwin Day Tennessee, one of the country’s oldest Darwin Days and in a state rich with opportunities for evolution education. I have volunteered to teach at numerous phylogenetics workshops, starting as a graduate student and continuing to three workshops at NIMBioS in the past five years (including one next month) as well as others in Sweden, Switzerland, and elsewhere. I will continue activities in this vein regardless of the proposal outcome because I think they represent an important aspect of what we must do as scientists. However, while funding from the CAREER program will help me do more in the specific

12
proposal objectives highlighted above, it will also serve to enhance my career, and thus foster the wider variety of broader impacts activities I already undertake.
Results from previous NSF funding: I have been funded for work on DEB1144974, “Historical naming traditions and cryptic speciation bias biodiversity estimates in transatlantic agaric fungi” as a Co-PI, PI on DEB1257669, “Collaborative Research: Phylogeographic Inference Using Approximated Likelihoods”, and recently recommended for funding (but no funds awarded yet) PI of DEB1355033 “Population genetics-based codon models”. The fungal work is mostly empirical sequencing of fungi around the world; my contribution to it is to apply modern sequence-based delimitation approaches to it to complement traditional approaches. The empirical data arrived this month; I have done preliminary analyses using Brownie (O'Meara 2010) but will be performing analyses using other software shortly, and a publication will be submitted next month. For the phylogeographic work, we have given a talk on it at Evolution, ran a workshop earlier this year to teach students how to use it (which was recorded and is now available on YouTube), hired a postdoc and a grad student to work on code and user manuals, respectively, and are planning to submit our first publication at the end of the month to PNAS. For the codon models grant, we have identified a postdoc who will be starting shortly on the project, and I have been committing code to an open github repository to implement a full codon model with selection in addition to the amino acid model used as preliminary data in that grant. I am also refactoring the code to be more robust (i.e., to not depend on internal functions of other packages) and to incorporate unit testing to allow for better validation in the future.
Postdoc role: The mentoring activities are discussed in a separate document, but it is more appropriate here to describe the role of the postdoc in the overall project. First, given that this is a five year grant, I expect more than one postdoc to be hired. Of the nine postdocs I have mentored as an assistant professor, six have completed their postdoc position and three are still in their position. Of that six, four have gone directly to a tenure track job, usually within two years of starting their postdoc. Such turnover is to be expected and encouraged if I am doing a good job as a mentor, though it could introduce continuity issues unless this is taken into account. As shown on the research plan (next page), the research and programming part of this grant is set up as discrete modules. I could have one postdoc work on adding discrete traits and then have her replacement work on dealing with multivariate characters. Modern software engineering principles of modularity, automated tests implemented at the same time as initial coding, well commented code, and all open source programming with version control make it easier to bring new people into the project. Rather than inheriting a tangle of code with hard coded paths or similar encumbrances, new members would encounter code that they could check out on their computers and quickly run a series of tests to make sure it is all working well. I have established a culture of frank discussions about authorship early in a project as well as at important milestones (onset of writing, completion of simulations, and so forth) within the lab so new and existing postdocs will have their roles clearly delineated. The postdoc(s) involved in this project will participate in the hackathons while they are here (and could apply as participants once they have moved on) but are not expected to participate in the planning of the hackathon itself. Similarly, for the open phylogenetics course, I will do most to all of the teaching, with an opportunity for a postdoc to opt in to teach one or two individual class sessions if this would help her or his overall career development.

13
Timeline for proposal
Year Activity Assessment/Goals 1 2 3 4 5
• Application of TreEvo to empirical datasets
Two peer-reviewed publications, postdoc as lead author
• • • Hackathons. First year is comparative
methods, especially for large trees; future years based on community suggestions
Pre and post-event surveys of key concept knowledge; volunteered
demographic data; long term career tracking (proportion still in
science, proportion still writing code, etc.); participant feedback.
As with some of the other hackathons I have participated in
or organized (O'Meara et al. 2008; Stoltzfus et al. 2013), a publication
describing them, especially information useful for later
hackathons, would be appropriate.
• • • • • Open course in phylogenetic methods. Recorded lectures, available activities
and slides, online forum
Pre and post-course tests of phylogenetic knowledge using
standard assessment tools (Baum et al. 2005) as well as additional
questions; volunteered demographic data of participants;
participant feedback; tracking information of accessions of material. Eventual paper on
lessons learned from this approach to education.
•
Discrete trait models: extension of existing software to properly deal with discrete rather than continuous traits
(requires different summary statistics and generating models)
New deployment of package and associated paper
• Multivariate models: looping over traits
with the same model is easy, but true multivariate models requires more work
New deployment of package and associated paper
• •
Microevolutionary models: already the TreEvo models allow modeling of
processes per generation, but like most of comparative methods, they are
phenomenological: we speak about “modeling stabilizing selection” but we are actually modeling how species mean shift. By creating an explicit population genetics model, one could investigate
processes at lower scales
New deployment of package and associated paper
1
Barkman, T. J., M. Bendiksby, S. H. Lim, K. M. Salleh, J. Nais, D. Madulid, and T.
Schumacher. 2008. Accelerated rates of floral evolution at the upper size limit for flowers. Current Biology.
Bates, J. F. I. a. g. t. D., D. Firth, M. Friendly, G. Gorjanc, S. Graves, R. Heiberger, G. Monette, H. Nilsson, D. Ogle, B. Ripley, S. Weisberg, suggestions, v. Achim Zeileis for, and contributions. 2009. car: Companion to Applied Regression.
Baum, D. A., S. D. Smith, and S. S. S. Donovan. 2005. The Tree-Thinking Challenge. Science 310:979.
Beaulieu, J. M. and M. J. Donoghue. 2013. Fruit evolution and diversification in Campanulid angiosperms. Evolution 67:3132-3144.
Beaulieu, J. M., D.-C. Jhwueng, C. Boettiger, and B. C. O'Meara. 2012. Modeling Stabilizing Selection: Expanding the Ornstein-Uhlenbeck Model of Adaptive Evolution. Evolution 66:2369-2383.
Beaulieu, J. M., B. C. O'Meara, and M. J. Donoghue. 2013. Identifying hidden rate changes in the evolution of a binary morphological character: the evolution of plant habit in campanulid angiosperms. Systematic biology.
Beaumont, M. A., W. Zhang, and D. J. Balding. 2002. Approximate Bayesian Computation in population genetics. Genetics 162.
Bolker, B., M. Butler, P. Cowan, D. d. Vienne, D. Eddelbuettel, M. Holder, T. Jombart, S. Kembel, F. Michonneau, D. Orme, B. O'Meara, E. Paradis, J. Regetz, and D. Zwickl. 2011. Phylobase.
Butler, M. A. and A. A. King. 2004. Phylogenetic comparative analysis: A modeling approach for adaptive evolution. American Naturalist 164:683-695.
Collar, D. C., T. J. Near, and P. C. Wainwright. 2005. Comparative analysis of morphological diversity: Does disparity accumulate at the same rate in two lineages of centrarchid fishes? Evolution 59:1783-1794.
Davis, C. C., M. Latvis, D. L. Nickrent, K. J. Wurdack, and D. A. Baum. 2007. Floral Gigantism in Rafflesiaceae. Science 315:1812-.
Dejean, S., I. Gonzalez, and K.-A. L. Cao. 2009. integrOmics: Integrate Omics data project.
Drummond, A. J., M. A. Suchard, D. Xie, and A. Rambaut. 2012. Bayesian Phylogenetics with BEAUti and the BEAST 1.7. Molecular Biology and Evolution 29:1969-1973.
Edwards, E. J. and C. J. Still. 2008. Climate, phylogeny and the ecological distribution of C4 grasses. Ecology Letters 11:266-276.
Felsenstein, J. 1985. Phylogenies and the Comparative Method. American Naturalist 125:1-15.
Garland, T. 1992. Rate Tests for Phenotypic Evolution Using Phylogenetically Independent Contrasts. American Naturalist 140:509-519.
Hansen, T. F. and E. P. Martins. 1996. Translating between microevolutionary process and macroevolutionary patterns: The correlation structure of interspecific data. Evolution 50:1404-1417.
Harmon, L. J., J. T. Weir, C. D. Brock, R. E. Glor, and W. Challenger. 2008. GEIGER: investigating evolutionary radiations. Bioinformatics 24:129-131.
Huelsenbeck, J. P. and B. Rannala. 2003. Detecting correlation between characters in a comparative analysis with uncertain phylogeny. Evolution 57:1237-1247.
2
Huelsenbeck, J. P., B. Rannala, and B. Larget. 2003. A statistical perspective for reconstructing the history of host-parasite associations. Tangled Trees: Phylogeny, Cospeciation and Coevolution:93-119.
Ingram, T. and D. L. Mahler. 2013. SURFACE: detecting convergent evolution from comparative data by fitting Ornstein-Uhlenbeck models with stepwise Akaike Information Criterion. Methods in Ecology and Evolution 4:416-425.
Kramer, E. M. and S. A. Hodges. 2010. Aquilegia as a model system for the evolution and ecology of petals. Philosophical Transactions of the Royal Society B-Biological Sciences 365:477-490.
Losos, J. B. 1990. A Phylogenetic Analysis of Character Displacement in Caribbean Anolis Lizards. Evolution 44:558-569.
Marjoram, P., J. Molitor, V. Plagnol, and S. Tavare. 2003. Markov chain Monte Carlo without likelihoods. Proceedings of the National Academy of Sciences of the United States of America 100:15324-15328.
O'Meara, B., M. Alfaro, C. Bell, B. Bolker, M. Butler, P. Cowan, D. De Vienne, R. Desper, J. Felsenstein, and L. Harmon. 2008. Comparative methods in R hackathon.
O'Meara, B. C. 2007. Estimating Different Rates of Gene Loss on a Tree. Genetics 177:1415-1416.
O'Meara, B. C. 2010. New Heuristic Methods for Joint Species Delimitation and Species Tree Inference. Systematic Biology 59:59-73.
O'Meara, B. C. 2012a. Evolutionary Inferences from Phylogenies: A Review of Methods. Pp. 267-285. Annual Review of Ecology, Evolution, and Systematics, Vol 43.
O'Meara, B. C. 2012b. Phylogenetic Reconstruction. Pp. 550-557 in A. Hastings, and L. J. Gross, eds. Encyclopedia of theoretical ecology. Univ of California Press.
O'Meara, B. C. 2014. CRAN Task View: Phylogenetics. Version 2014-07-17, URL http://cran.r-project.org/web/views/Phylogenetics.html.
O'Meara, B. C., C. Ane, M. J. Sanderson, and P. C. Wainwright. 2006. Testing for different rates of continuous trait evolution using likelihood. Evolution 60:922-933.
Pagel, M. 1994. Detecting Correlated Evolution on Phylogenies: A General Method for the Comparative Analysis of Discrete Characters. Proceedings: Biological Sciences 255:37-45.
Pell, A. N. 1996. Fixing the leaky pipeline: women scientists in academia. Journal of Animal Science 74:2843-2848.
Posada, D. and K. A. Crandall. 1998. MODELTEST: testing the model of DNA substitution. Bioinformatics 14:817-818.
Rabosky, D. 2009. Heritability of Extinction Rates Links Diversification Patterns in Molecular Phylogenies and Fossils. Systematic Biology 58:629-640.
Ronquist, F., M. Teslenko, P. van der Mark, D. L. Ayres, A. Darling, S. Höhna, B. Larget, L. Liu, M. A. Suchard, and J. P. Huelsenbeck. 2012. MrBayes 3.2: Efficient Bayesian Phylogenetic Inference and Model Choice Across a Large Model Space. Systematic Biology 61:539-542.
Sheltzer, J. M. and J. C. Smith. 2014. Elite male faculty in the life sciences employ fewer women. Proceedings of the National Academy of Sciences 111:10107-10112.

3
Sisson, S. A., Y. Fan, and M. M. Tanaka. 2007. Sequential Monte Carlo without likelihoods. Proceedings of the National Academy of Sciences of the United States of America 104:1760-1765.
Stack, J. C., L. J. Harmon, and B. O'Meara. 2011. RBrownie: an R package for testing hypotheses about rates of evolutionary change. Methods in Ecology and Evolution 2:660-662.
Stoltzfus, A., H. Lapp, N. Matasci, H. Deus, B. Sidlauskas, C. Zmasek, G. Vaidya, E. Pontelli, K. Cranston, R. Vos, C. Webb, L. Harmon, M. Pirrung, B. O’Meara, M. Pennell, S. Mirarab, M. Rosenberg, J. Balhoff, H. Bik, T. Heath, P. Midford, J. Brown, E. McTavish, J. Sukumaran, M. Westneat, M. Alfaro, A. Steele, and G. Jordan. 2013. Phylotastic! Making tree-of-life knowledge accessible, reusable and convenient. BMC Bioinformatics 14:1-17.
Tavare, S., D. J. Balding, R. C. Griffiths, and P. Donnelly. 1997. Inferring coalescence times from DNA sequence data. Genetics 145:505-518.
Thomas, G. H., R. P. Freckleton, and T. Sz�©kely. 2006. Comparative analyses of the influence of developmental mode on phenotypic diversification rates in shorebirds. Proceedings of the Royal Society B: Biological Sciences 273:1619-1624.
Wegmann, D., C. Leuenberger, and L. Excoffier. 2009. Efficient Approximate Bayesian Computation Coupled With Markov Chain Monte Carlo Without Likelihood. Genetics 182:1207-1218.
Weir, J. T. and D. Schluter. 2007. The Latitudinal Gradient in Recent Speciation and Extinction Rates of Birds and Mammals. Science 315:1574-1576.
Whittall, J. B. and S. A. Hodges. 2007. Pollinator shifts drive increasingly long nectar spurs in columbine flowers. Nature 447:706-U712.
Zanne, A. E., D. C. Tank, W. K. Cornwell, J. M. Eastman, S. A. Smith, R. G. FitzJohn, D. J. McGlinn, B. C. O/'Meara, A. T. Moles, P. B. Reich, D. L. Royer, D. E. Soltis, P. F. Stevens, M. Westoby, I. J. Wright, L. Aarssen, R. I. Bertin, A. Calaminus, R. Govaerts, F. Hemmings, M. R. Leishman, J. Oleksyn, P. S. Soltis, N. G. Swenson, L. Warman, and J. M. Beaulieu. 2014. Three keys to the radiation of angiosperms into freezing environments. Nature 506:89-92.

1
Biographical Sketch Brian C. O’Meara
Department of Ecology and Evolution Phone: 865-408-8733 University of Tennessee Fax: 865-974-3067 Knoxville, Tennessee email: [email protected] Professional Preparation Harvard University Biology B.A., 2001 University of California, Davis Population Biology Ph.D., 2008 Appointments August 2009 Assistant Professor, Department of Ecology and Evolution University of Tennessee, Knoxville TN Nov. 2007-2009 Postdoctoral Fellow, National Evolutionary Synthesis Center Five Most Relevant Products Zanne, A. E., D. C. Tank, W. K. Cornwell, J. M. Eastman, S. A. Smith, R. G. FitzJohn, D. J.
McGlinn, B. C. O'Meara, A. T. Moles, P. B. Reich, D. L. Royer, D. E. Soltis, P. F. Stevens, M. Westoby, I. J. Wright, L. Aarssen, R. I. Bertin, A. Calaminus, R. Govaerts, F. Hemmings, M. R. Leishman, J. Oleksyn, P. S. Soltis, N. G. Swenson, L. Warman, and J. M. Beaulieu. 2014. Three keys to the radiation of angiosperms into freezing environments. Nature. 506(7486): 89-92
O’Meara, B.C. 2012. Evolutionary inferences from phylogenies: A review of methods. Annual Review of Ecology, Evolution, and Systematics. 43(1)
Beaulieu, J. M., D.-C. Jhwueng, C. Boettiger, and B. C. O’Meara. 2012. Modeling Stabilizing Selection: Expanding The Ornstein-Uhlenbeck Model Of Adaptive Evolution. Evolution 66: 2369-2383.
Smith, S.A., and B.C. O'Meara. 2009. Morphogenera, monophyly, and macroevolution. PNAS: 106:E97-E98
O'Meara, B.C., C. Ané, M.J. Sanderson, and P.C. Wainwright. 2006. Testing for different rates of continuous trait evolution using likelihood. Evolution 60: 922-933.
Up to Five Other Products Stoltzfus, A., H. Lapp, N. Matasci, H. Deus, B. Sidlauskas, C. Zmasek, G. Vaidya, E. Pontelli, K.
Cranston, R. Vos, C. Webb, L. Harmon, M. Pirrung, B. O’Meara, M. Pennell, S. Mirarab, M. Rosenberg, J. Balhoff, H. Bik, T. Heath, P. Midford, J. Brown, E. McTavish, J. Sukumaran, M. Westneat, M. Alfaro, A. Steele, and G. Jordan. 2013. Phylotastic! Making tree-of-life knowledge accessible, reusable and convenient. BMC Bioinformatics 14:1-17
Stotzfus, A, B.C. O’Meara, J. Whitacre, R. Mounce, E. Gillespie, S. Kumar, D. Rosauer, R. Vos. 2012. Sharing and re-use of phylogenetic trees (and associated data) to facilitate synthesis. BMC Research Notes 5(1): 574
Smith, S.A. and B.C. O’Meara. 2012. “treePL: Divergence time estimation using penalized likelihood for large phylogenies. Bioinformatics.
O'Meara, B. C. 2010. New Heuristic Methods for Joint Species Delimitation and Species Tree Inference. Systematic Biology 59:59-73.
Driskell, A. C., C. Ané, J. G. Burleigh, M. M. McMahon, B. C. O'Meara, and M. J. Sanderson. 2004. Phylogenetic utility of large sequence databases for building the tree of life. Science 306: 1172-1174

2
Synergistic Activities 1. Darwin Day Tennessee advisor 2. Curator of Phylogenetics task view for R 3. Organizer in Women in Science seminar series at UT Knoxville 4. Organizer of multiple hackathons 5. Developer of multiple software packages in R Collaborators: Lonnie Aarssen (Queen's University (Ontario, Canada)), Robert Bertin (College of the Holy Cross), Carl Boettiger (UC Davis), Gordon Burghardt (U Tennessee, Knoxville), Gordon Burleigh (U Florida), Andre Calaminus (U Florida), Bryan Carstens (Ohio State U), David Collar (UC Santa Cruz), William Cornwell (U New South Wales), Karen Cranston (NESCent), Rafael de Casas (Duke), Helena Deus (DERI), Pam Diggle (U Colorado), Michael Donoghue (Yale), Jonathan Eastman (U Washington), Charlie Fenster (U Maryland), Richard FitzJohn (Macquarie ), Damian Gessler (iPlant), Michael Gilchrist (U Tennessee, Knoxville), Emily Gillespie (Marshall U), Stephen Goff (iPlant), Rafael Govaerts (Royal Botanic Gardens, Kew), Matthew Hanlon (TACC), Luke Harmon (U Washington), Frank Hemmings (U New South Wales), Darrin Hulsey (U Tennessee, Knoxville), Benjamin Keck (U Tennessee, Knoxville), Sudhir Kumar (Arizona State), Hilmar Lapp (NESCent), Maribeth Latvis (U Florida), Michelle Leishman (Macquarie U), Andrew Lenards (iPlant), Jonathan Losos (Harvard), Eric Lyons (iPlant), Naim Matasci (iPlant), Evgeny Mavrodiev (U Florida), Daniel McGlinn (Utah State), Sheldon McKay (iPlant), Andrew Moffatt (U Tennessee, Knoxville), Angela Moles (U New South Wales), Mark Mort (U Kansas), Ross Mounce (U of Bath), Thomas Near (Yale), Jacek Oleksyn (U of Minnesota), Enrico Pontelli (New Mexico State), Peter Reich (U of Minnesota), Dan Rosauer (Australian National U), Dana Royer (Wesleyan University), James Schulte (Clarkson), Brian Sidlauskas (Oregon State), Stephen Smith (U Michigan), Stacey Smith (U Colorado), Douglas Soltis (U Florida), Pamela Soltis (U Florida), Conrad Stack (State College PA), Ann Stapleton (iPlant), Peter Stevens (U of MIssouri), Arlin Stoltzfus (NIST), Nathan Swenson (Michigan State U), David Tank (U Washington), Gaurav Vaidya (U Colorado Boulder), Matthew Vaughn (iPlant), Rutger Vos (NCB Naturalis), Peter Wainwright (UC Davis), Liya Wang (iPlant), Laura Warman (USDA Forest Service), Mark Westoby (Macquarie U), Jamie Whitacre (Smithsonian), Joseph Williams (U Tennessee, Knoxville), Ian Wright (Macquarie U), Amy Zanne (George Washington), Christian Zmasek (Sanford-Burnham Medical Research Institute) Graduate Advisors and Postdoctoral Sponsors: Michael Sanderson (U Arizona), Michael Turelli (UC Davis), Phil Ward (UC Davis), Todd Vision (U North Carolina) Thesis advisor (2) and Postgraduate-Scholar Sponsor (9) Hugo Alamillo (North Seattle Community College), Barb Banbury (U Washington), Jeremy Beaulieu (NIMBioS), Jenn Bosco (U Tennessee, Knoxville), JJ Chai (Oak Ridge National Lab), Nathan Jackson (U Tennessee, Knoxville), Tony Jhwueng (Feng-Chia University), Michelle Lawing (Texas A&M), Ryan Martin (NIMBioS), Katie Massana (U Tennessee, Knoxville), Nick Matzke (NIMBioS)

SUMMARYPROPOSAL BUDGET
FundsRequested By
proposer
Fundsgranted by NSF
(if different)
Date Checked Date Of Rate Sheet Initials - ORG
NSF FundedPerson-months
fm1030rs-07
FOR NSF USE ONLYORGANIZATION PROPOSAL NO. DURATION (months)
Proposed GrantedPRINCIPAL INVESTIGATOR / PROJECT DIRECTOR AWARD NO.
A. SENIOR PERSONNEL: PI/PD, Co-PI’s, Faculty and Other Senior Associates (List each separately with title, A.7. show number in brackets) CAL ACAD SUMR
1.2.3.4.5.6. ( ) OTHERS (LIST INDIVIDUALLY ON BUDGET JUSTIFICATION PAGE)7. ( ) TOTAL SENIOR PERSONNEL (1 - 6)
B. OTHER PERSONNEL (SHOW NUMBERS IN BRACKETS)1. ( ) POST DOCTORAL SCHOLARS2. ( ) OTHER PROFESSIONALS (TECHNICIAN, PROGRAMMER, ETC.)3. ( ) GRADUATE STUDENTS4. ( ) UNDERGRADUATE STUDENTS5. ( ) SECRETARIAL - CLERICAL (IF CHARGED DIRECTLY)6. ( ) OTHER TOTAL SALARIES AND WAGES (A + B)
C. FRINGE BENEFITS (IF CHARGED AS DIRECT COSTS) TOTAL SALARIES, WAGES AND FRINGE BENEFITS (A + B + C)
D. EQUIPMENT (LIST ITEM AND DOLLAR AMOUNT FOR EACH ITEM EXCEEDING $5,000.)
TOTAL EQUIPMENTE. TRAVEL 1. DOMESTIC (INCL. CANADA, MEXICO AND U.S. POSSESSIONS)
2. FOREIGN
F. PARTICIPANT SUPPORT COSTS1. STIPENDS $2. TRAVEL3. SUBSISTENCE4. OTHER TOTAL NUMBER OF PARTICIPANTS ( ) TOTAL PARTICIPANT COSTSG. OTHER DIRECT COSTS1. MATERIALS AND SUPPLIES2. PUBLICATION COSTS/DOCUMENTATION/DISSEMINATION3. CONSULTANT SERVICES4. COMPUTER SERVICES5. SUBAWARDS6. OTHER TOTAL OTHER DIRECT COSTS
H. TOTAL DIRECT COSTS (A THROUGH G)I. INDIRECT COSTS (F&A)(SPECIFY RATE AND BASE)
TOTAL INDIRECT COSTS (F&A)J. TOTAL DIRECT AND INDIRECT COSTS (H + I)K. RESIDUAL FUNDS L. AMOUNT OF THIS REQUEST (J) OR (J MINUS K)M. COST SHARING PROPOSED LEVEL $ AGREED LEVEL IF DIFFERENT $PI/PD NAME FOR NSF USE ONLY
INDIRECT COST RATE VERIFICATIONORG. REP. NAME*
*ELECTRONIC SIGNATURES REQUIRED FOR REVISED BUDGET
1YEAR
1
University of Tennessee Knoxville
Brian
BrianBrian
O’Meara
O’Meara O’Meara
BrianBrianBrian C C C O’Meara O’Meara O’Meara - Assistant Professor 0.00 0.00 1.00 8,879
0 0.00 0.00 0.00 01 0.00 0.00 1.00 8,879
1 12.00 0.00 0.00 50,0000 0.00 0.00 0.00 00 00 00 00 0
58,87927,017
85,896
01,500
0
06,0001,6803,440
10 11,120
01,000
0000
1,000 99,516
43,315Salary, travel, benefits, publication (Rate: 49.0000, Base: 88398)
142,8310
142,8310

SUMMARYPROPOSAL BUDGET
FundsRequested By
proposer
Fundsgranted by NSF
(if different)
Date Checked Date Of Rate Sheet Initials - ORG
NSF FundedPerson-months
fm1030rs-07
FOR NSF USE ONLYORGANIZATION PROPOSAL NO. DURATION (months)
Proposed GrantedPRINCIPAL INVESTIGATOR / PROJECT DIRECTOR AWARD NO.
A. SENIOR PERSONNEL: PI/PD, Co-PI’s, Faculty and Other Senior Associates (List each separately with title, A.7. show number in brackets) CAL ACAD SUMR
1.2.3.4.5.6. ( ) OTHERS (LIST INDIVIDUALLY ON BUDGET JUSTIFICATION PAGE)7. ( ) TOTAL SENIOR PERSONNEL (1 - 6)
B. OTHER PERSONNEL (SHOW NUMBERS IN BRACKETS)1. ( ) POST DOCTORAL SCHOLARS2. ( ) OTHER PROFESSIONALS (TECHNICIAN, PROGRAMMER, ETC.)3. ( ) GRADUATE STUDENTS4. ( ) UNDERGRADUATE STUDENTS5. ( ) SECRETARIAL - CLERICAL (IF CHARGED DIRECTLY)6. ( ) OTHER TOTAL SALARIES AND WAGES (A + B)
C. FRINGE BENEFITS (IF CHARGED AS DIRECT COSTS) TOTAL SALARIES, WAGES AND FRINGE BENEFITS (A + B + C)
D. EQUIPMENT (LIST ITEM AND DOLLAR AMOUNT FOR EACH ITEM EXCEEDING $5,000.)
TOTAL EQUIPMENTE. TRAVEL 1. DOMESTIC (INCL. CANADA, MEXICO AND U.S. POSSESSIONS)
2. FOREIGN
F. PARTICIPANT SUPPORT COSTS1. STIPENDS $2. TRAVEL3. SUBSISTENCE4. OTHER TOTAL NUMBER OF PARTICIPANTS ( ) TOTAL PARTICIPANT COSTSG. OTHER DIRECT COSTS1. MATERIALS AND SUPPLIES2. PUBLICATION COSTS/DOCUMENTATION/DISSEMINATION3. CONSULTANT SERVICES4. COMPUTER SERVICES5. SUBAWARDS6. OTHER TOTAL OTHER DIRECT COSTS
H. TOTAL DIRECT COSTS (A THROUGH G)I. INDIRECT COSTS (F&A)(SPECIFY RATE AND BASE)
TOTAL INDIRECT COSTS (F&A)J. TOTAL DIRECT AND INDIRECT COSTS (H + I)K. RESIDUAL FUNDS L. AMOUNT OF THIS REQUEST (J) OR (J MINUS K)M. COST SHARING PROPOSED LEVEL $ AGREED LEVEL IF DIFFERENT $PI/PD NAME FOR NSF USE ONLY
INDIRECT COST RATE VERIFICATIONORG. REP. NAME*
*ELECTRONIC SIGNATURES REQUIRED FOR REVISED BUDGET
2YEAR
2
University of Tennessee Knoxville
Brian
BrianBrian
O’Meara
O’Meara O’Meara
BrianBrianBrian C C C O’Meara O’Meara O’Meara - Assistant Professor 0.00 0.00 1.00 9,189
0 0.00 0.00 0.00 01 0.00 0.00 1.00 9,189
1 12.00 0.00 0.00 51,7500 0.00 0.00 0.00 00 00 00 00 0
60,93927,963
88,902
01,500
0
0000
0 0
01,000
0000
1,000 91,402
44,787Salary, travel, benefits, publication (Rate: 49.0000, Base: 91402)
136,1890
136,1890

SUMMARYPROPOSAL BUDGET
FundsRequested By
proposer
Fundsgranted by NSF
(if different)
Date Checked Date Of Rate Sheet Initials - ORG
NSF FundedPerson-months
fm1030rs-07
FOR NSF USE ONLYORGANIZATION PROPOSAL NO. DURATION (months)
Proposed GrantedPRINCIPAL INVESTIGATOR / PROJECT DIRECTOR AWARD NO.
A. SENIOR PERSONNEL: PI/PD, Co-PI’s, Faculty and Other Senior Associates (List each separately with title, A.7. show number in brackets) CAL ACAD SUMR
1.2.3.4.5.6. ( ) OTHERS (LIST INDIVIDUALLY ON BUDGET JUSTIFICATION PAGE)7. ( ) TOTAL SENIOR PERSONNEL (1 - 6)
B. OTHER PERSONNEL (SHOW NUMBERS IN BRACKETS)1. ( ) POST DOCTORAL SCHOLARS2. ( ) OTHER PROFESSIONALS (TECHNICIAN, PROGRAMMER, ETC.)3. ( ) GRADUATE STUDENTS4. ( ) UNDERGRADUATE STUDENTS5. ( ) SECRETARIAL - CLERICAL (IF CHARGED DIRECTLY)6. ( ) OTHER TOTAL SALARIES AND WAGES (A + B)
C. FRINGE BENEFITS (IF CHARGED AS DIRECT COSTS) TOTAL SALARIES, WAGES AND FRINGE BENEFITS (A + B + C)
D. EQUIPMENT (LIST ITEM AND DOLLAR AMOUNT FOR EACH ITEM EXCEEDING $5,000.)
TOTAL EQUIPMENTE. TRAVEL 1. DOMESTIC (INCL. CANADA, MEXICO AND U.S. POSSESSIONS)
2. FOREIGN
F. PARTICIPANT SUPPORT COSTS1. STIPENDS $2. TRAVEL3. SUBSISTENCE4. OTHER TOTAL NUMBER OF PARTICIPANTS ( ) TOTAL PARTICIPANT COSTSG. OTHER DIRECT COSTS1. MATERIALS AND SUPPLIES2. PUBLICATION COSTS/DOCUMENTATION/DISSEMINATION3. CONSULTANT SERVICES4. COMPUTER SERVICES5. SUBAWARDS6. OTHER TOTAL OTHER DIRECT COSTS
H. TOTAL DIRECT COSTS (A THROUGH G)I. INDIRECT COSTS (F&A)(SPECIFY RATE AND BASE)
TOTAL INDIRECT COSTS (F&A)J. TOTAL DIRECT AND INDIRECT COSTS (H + I)K. RESIDUAL FUNDS L. AMOUNT OF THIS REQUEST (J) OR (J MINUS K)M. COST SHARING PROPOSED LEVEL $ AGREED LEVEL IF DIFFERENT $PI/PD NAME FOR NSF USE ONLY
INDIRECT COST RATE VERIFICATIONORG. REP. NAME*
*ELECTRONIC SIGNATURES REQUIRED FOR REVISED BUDGET
3YEAR
3
University of Tennessee Knoxville
Brian
BrianBrian
O’Meara
O’Meara O’Meara
BrianBrianBrian C C C O’Meara O’Meara O’Meara - Assistant Professor 0.00 0.00 1.00 9,511
0 0.00 0.00 0.00 01 0.00 0.00 1.00 9,511
1 12.00 0.00 0.00 53,5610 0.00 0.00 0.00 00 00 00 00 0
63,07228,941
92,013
01,500
0
06,0001,6803,440
10 11,120
01,000
0000
1,000 105,633
46,311Salary, travel, benefits, publication (Rate: 49.0000, Base: 94513)
151,9440
151,9440

SUMMARYPROPOSAL BUDGET
FundsRequested By
proposer
Fundsgranted by NSF
(if different)
Date Checked Date Of Rate Sheet Initials - ORG
NSF FundedPerson-months
fm1030rs-07
FOR NSF USE ONLYORGANIZATION PROPOSAL NO. DURATION (months)
Proposed GrantedPRINCIPAL INVESTIGATOR / PROJECT DIRECTOR AWARD NO.
A. SENIOR PERSONNEL: PI/PD, Co-PI’s, Faculty and Other Senior Associates (List each separately with title, A.7. show number in brackets) CAL ACAD SUMR
1.2.3.4.5.6. ( ) OTHERS (LIST INDIVIDUALLY ON BUDGET JUSTIFICATION PAGE)7. ( ) TOTAL SENIOR PERSONNEL (1 - 6)
B. OTHER PERSONNEL (SHOW NUMBERS IN BRACKETS)1. ( ) POST DOCTORAL SCHOLARS2. ( ) OTHER PROFESSIONALS (TECHNICIAN, PROGRAMMER, ETC.)3. ( ) GRADUATE STUDENTS4. ( ) UNDERGRADUATE STUDENTS5. ( ) SECRETARIAL - CLERICAL (IF CHARGED DIRECTLY)6. ( ) OTHER TOTAL SALARIES AND WAGES (A + B)
C. FRINGE BENEFITS (IF CHARGED AS DIRECT COSTS) TOTAL SALARIES, WAGES AND FRINGE BENEFITS (A + B + C)
D. EQUIPMENT (LIST ITEM AND DOLLAR AMOUNT FOR EACH ITEM EXCEEDING $5,000.)
TOTAL EQUIPMENTE. TRAVEL 1. DOMESTIC (INCL. CANADA, MEXICO AND U.S. POSSESSIONS)
2. FOREIGN
F. PARTICIPANT SUPPORT COSTS1. STIPENDS $2. TRAVEL3. SUBSISTENCE4. OTHER TOTAL NUMBER OF PARTICIPANTS ( ) TOTAL PARTICIPANT COSTSG. OTHER DIRECT COSTS1. MATERIALS AND SUPPLIES2. PUBLICATION COSTS/DOCUMENTATION/DISSEMINATION3. CONSULTANT SERVICES4. COMPUTER SERVICES5. SUBAWARDS6. OTHER TOTAL OTHER DIRECT COSTS
H. TOTAL DIRECT COSTS (A THROUGH G)I. INDIRECT COSTS (F&A)(SPECIFY RATE AND BASE)
TOTAL INDIRECT COSTS (F&A)J. TOTAL DIRECT AND INDIRECT COSTS (H + I)K. RESIDUAL FUNDS L. AMOUNT OF THIS REQUEST (J) OR (J MINUS K)M. COST SHARING PROPOSED LEVEL $ AGREED LEVEL IF DIFFERENT $PI/PD NAME FOR NSF USE ONLY
INDIRECT COST RATE VERIFICATIONORG. REP. NAME*
*ELECTRONIC SIGNATURES REQUIRED FOR REVISED BUDGET
4YEAR
4
University of Tennessee Knoxville
Brian
BrianBrian
O’Meara
O’Meara O’Meara
BrianBrianBrian C C C O’Meara O’Meara O’Meara - Assistant Professor 0.00 0.00 1.00 9,844
0 0.00 0.00 0.00 01 0.00 0.00 1.00 9,844
1 12.00 0.00 0.00 55,4360 0.00 0.00 0.00 00 00 00 00 0
65,28029,954
95,234
01,500
0
0000
0 0
01,000
0000
1,000 97,734
47,890Salary, travel, benefits, publication (Rate: 49.0000, Base: 97734)
145,6240
145,6240

SUMMARYPROPOSAL BUDGET
FundsRequested By
proposer
Fundsgranted by NSF
(if different)
Date Checked Date Of Rate Sheet Initials - ORG
NSF FundedPerson-months
fm1030rs-07
FOR NSF USE ONLYORGANIZATION PROPOSAL NO. DURATION (months)
Proposed GrantedPRINCIPAL INVESTIGATOR / PROJECT DIRECTOR AWARD NO.
A. SENIOR PERSONNEL: PI/PD, Co-PI’s, Faculty and Other Senior Associates (List each separately with title, A.7. show number in brackets) CAL ACAD SUMR
1.2.3.4.5.6. ( ) OTHERS (LIST INDIVIDUALLY ON BUDGET JUSTIFICATION PAGE)7. ( ) TOTAL SENIOR PERSONNEL (1 - 6)
B. OTHER PERSONNEL (SHOW NUMBERS IN BRACKETS)1. ( ) POST DOCTORAL SCHOLARS2. ( ) OTHER PROFESSIONALS (TECHNICIAN, PROGRAMMER, ETC.)3. ( ) GRADUATE STUDENTS4. ( ) UNDERGRADUATE STUDENTS5. ( ) SECRETARIAL - CLERICAL (IF CHARGED DIRECTLY)6. ( ) OTHER TOTAL SALARIES AND WAGES (A + B)
C. FRINGE BENEFITS (IF CHARGED AS DIRECT COSTS) TOTAL SALARIES, WAGES AND FRINGE BENEFITS (A + B + C)
D. EQUIPMENT (LIST ITEM AND DOLLAR AMOUNT FOR EACH ITEM EXCEEDING $5,000.)
TOTAL EQUIPMENTE. TRAVEL 1. DOMESTIC (INCL. CANADA, MEXICO AND U.S. POSSESSIONS)
2. FOREIGN
F. PARTICIPANT SUPPORT COSTS1. STIPENDS $2. TRAVEL3. SUBSISTENCE4. OTHER TOTAL NUMBER OF PARTICIPANTS ( ) TOTAL PARTICIPANT COSTSG. OTHER DIRECT COSTS1. MATERIALS AND SUPPLIES2. PUBLICATION COSTS/DOCUMENTATION/DISSEMINATION3. CONSULTANT SERVICES4. COMPUTER SERVICES5. SUBAWARDS6. OTHER TOTAL OTHER DIRECT COSTS
H. TOTAL DIRECT COSTS (A THROUGH G)I. INDIRECT COSTS (F&A)(SPECIFY RATE AND BASE)
TOTAL INDIRECT COSTS (F&A)J. TOTAL DIRECT AND INDIRECT COSTS (H + I)K. RESIDUAL FUNDS L. AMOUNT OF THIS REQUEST (J) OR (J MINUS K)M. COST SHARING PROPOSED LEVEL $ AGREED LEVEL IF DIFFERENT $PI/PD NAME FOR NSF USE ONLY
INDIRECT COST RATE VERIFICATIONORG. REP. NAME*
*ELECTRONIC SIGNATURES REQUIRED FOR REVISED BUDGET
5YEAR
5
University of Tennessee Knoxville
Brian
BrianBrian
O’Meara
O’Meara O’Meara
BrianBrianBrian C C C O’Meara O’Meara O’Meara - Assistant Professor 0.00 0.00 1.00 10,188
0 0.00 0.00 0.00 01 0.00 0.00 1.00 10,188
1 12.00 0.00 0.00 57,3760 0.00 0.00 0.00 00 00 00 00 0
67,56431,003
98,567
01,500
0
06,0001,6803,440
10 11,120
01,000
0000
1,000 112,187
49,523Salary, travel, benefits, publication (Rate: 49.0000, Base: 101067)
161,7100
161,7100

SUMMARYPROPOSAL BUDGET
FundsRequested By
proposer
Fundsgranted by NSF
(if different)
Date Checked Date Of Rate Sheet Initials - ORG
NSF FundedPerson-months
fm1030rs-07
FOR NSF USE ONLYORGANIZATION PROPOSAL NO. DURATION (months)
Proposed GrantedPRINCIPAL INVESTIGATOR / PROJECT DIRECTOR AWARD NO.
A. SENIOR PERSONNEL: PI/PD, Co-PI’s, Faculty and Other Senior Associates (List each separately with title, A.7. show number in brackets) CAL ACAD SUMR
1.2.3.4.5.6. ( ) OTHERS (LIST INDIVIDUALLY ON BUDGET JUSTIFICATION PAGE)7. ( ) TOTAL SENIOR PERSONNEL (1 - 6)
B. OTHER PERSONNEL (SHOW NUMBERS IN BRACKETS)1. ( ) POST DOCTORAL SCHOLARS2. ( ) OTHER PROFESSIONALS (TECHNICIAN, PROGRAMMER, ETC.)3. ( ) GRADUATE STUDENTS4. ( ) UNDERGRADUATE STUDENTS5. ( ) SECRETARIAL - CLERICAL (IF CHARGED DIRECTLY)6. ( ) OTHER TOTAL SALARIES AND WAGES (A + B)
C. FRINGE BENEFITS (IF CHARGED AS DIRECT COSTS) TOTAL SALARIES, WAGES AND FRINGE BENEFITS (A + B + C)
D. EQUIPMENT (LIST ITEM AND DOLLAR AMOUNT FOR EACH ITEM EXCEEDING $5,000.)
TOTAL EQUIPMENTE. TRAVEL 1. DOMESTIC (INCL. CANADA, MEXICO AND U.S. POSSESSIONS)
2. FOREIGN
F. PARTICIPANT SUPPORT COSTS1. STIPENDS $2. TRAVEL3. SUBSISTENCE4. OTHER TOTAL NUMBER OF PARTICIPANTS ( ) TOTAL PARTICIPANT COSTSG. OTHER DIRECT COSTS1. MATERIALS AND SUPPLIES2. PUBLICATION COSTS/DOCUMENTATION/DISSEMINATION3. CONSULTANT SERVICES4. COMPUTER SERVICES5. SUBAWARDS6. OTHER TOTAL OTHER DIRECT COSTS
H. TOTAL DIRECT COSTS (A THROUGH G)I. INDIRECT COSTS (F&A)(SPECIFY RATE AND BASE)
TOTAL INDIRECT COSTS (F&A)J. TOTAL DIRECT AND INDIRECT COSTS (H + I)K. RESIDUAL FUNDS L. AMOUNT OF THIS REQUEST (J) OR (J MINUS K)M. COST SHARING PROPOSED LEVEL $ AGREED LEVEL IF DIFFERENT $PI/PD NAME FOR NSF USE ONLY
INDIRECT COST RATE VERIFICATIONORG. REP. NAME*
*ELECTRONIC SIGNATURES REQUIRED FOR REVISED BUDGET
Cumulative
C
University of Tennessee Knoxville
Brian
BrianBrian
O’Meara
O’Meara O’Meara
BrianBrianBrian C C C O’Meara O’Meara O’Meara - Assistant Professor 0.00 0.00 5.00 47,611
0.00 0.00 0.00 01 0.00 0.00 5.00 47,611
5 60.00 0.00 0.00 268,1230 0.00 0.00 0.00 00 00 00 00 0
315,734144,878
460,612
07,500
0
018,0005,040
10,320
30 33,360
05,000
0000
5,000 506,472
231,826
738,2980
738,2980

Budget Justification A. Senior Personnel The senior personnel for this project consists of Dr. Brian O’Meara. Dr. O’Meara is requesting one month of summer support per year at $8,879 in the first year (based on a nine month salary of $79,907), increasing by 3.5% per year for a total of $47,611. B. Other Personnel The other personnel includes one postdoc researcher position at $50,000 per year, increasing by 3.5% per year. Note that the individual occupying that position is expected to change at least once over the project, as the first postdoc is likely to be hired in a permanent position before the end of the grant. The total request for the postdoc position is $268,123. C. Fringe Benefits Fringe benefits for summer salary are 19%. Fringe Benefits requested for the postdoc are 50.66%; this is the rate for postdocs supporting a spouse and multiple children, which is the rate that one-third of my postdocs have required. D. Equipment None E. Travel Domestic travel: $1500 per year for $7500 in total. The travel funds will be used by both personnel to attend conferences to present papers and the results of the proposed research. F. Participant Support Costs There are three hackathons included in the project. These are gatherings of developers to work together on improving and creating new software. I anticipate 10 non-local developers staying for three days for each hackathon. Hotels cost $86/night, so this would be 4 x 10 x $86 = $3440 for hotel, 10 x $600 x 10 = $6000 for travel costs, and 3 x 10 x $56 = $1680 for food costs for three days (hotel and food costs based on US GSA per diem rates), for total participant cost of $11,120 per hackathon, for $33,360 in total. G. Other Direct Costs Publication costs of $1000 per year. H. Total Direct Costs - $506,472. I: Indirect Costs (F&A)

The University of Tennessee's federally approved indirect cost rate requested at 49% MTDC (total direct costs, minus equipment, subcontracts in excess of $25,000 and tuition). The indirect cost base is $473,112 and the requested amount for F&A is $231,825 J: Total Direct and Indirect Costs The total direct and indirect costs requested for the project period is $738,297.

Current and Pending Support(See GPG Section II.C.2.h for guidance on information to include on this form.)
The following information should be provided for each investigator and other senior personnel. Failure to provide this information may delay consideration of this proposal.
Investigator:Other agencies (including NSF) to which this proposal has been/will be submitted.
Support: Current Pending Submission Planned in Near Future *Transfer of SupportProject/Proposal Title:
Source of Support:Total Award Amount: $ Total Award Period Covered:Location of Project:Person-Months Per Year Committed to the Project. Cal: Acad: Sumr:
Support: Current Pending Submission Planned in Near Future *Transfer of SupportProject/Proposal Title:
Source of Support:Total Award Amount: $ Total Award Period Covered:Location of Project:Person-Months Per Year Committed to the Project. Cal: Acad: Sumr:
Support: Current Pending Submission Planned in Near Future *Transfer of SupportProject/Proposal Title:
Source of Support:Total Award Amount: $ Total Award Period Covered:Location of Project:Person-Months Per Year Committed to the Project. Cal: Acad: Sumr:
Support: Current Pending Submission Planned in Near Future *Transfer of SupportProject/Proposal Title:
Source of Support:Total Award Amount: $ Total Award Period Covered:Location of Project:Person-Months Per Year Committed to the Project. Cal: Acad: Sumr:
Support: Current Pending Submission Planned in Near Future *Transfer of SupportProject/Proposal Title:
Source of Support:Total Award Amount: $ Total Award Period Covered:Location of Project:Person-Months Per Year Committed to the Project. Cal: Acad: Summ:*If this project has previously been funded by another agency, please list and furnish information for immediately preceding funding period.
USE ADDITIONAL SHEETS AS NECESSARYPage G-
Brian O’Meara
Population genetics-based codon models
NSF520,000 09/15/14 - 09/15/17
Knoxville, TN0.00 0.00 1.00
Collaborative Research: Phylogeographic Inference UsingApproximated Likelihoods
NSF340,000 03/01/13 - 03/01/16
Knoxville, TN0.00 0.00 1.00
Historical naming traditions and cryptic speciation biasbiodiversity estimates in transatlantic agaric fungi
NSF393,074 01/01/12 - 01/01/15
Knoxville, TN0.00 0.00 1.00
CAREER: Reducing Barriers for Comparative Methods (thisproposal)
NSF738,298 08/01/15 - 07/31/20
University of Tennessee0.00 0.00 1.00
11

Facilities University of Tennessee, Knoxville: The O'Meara lab maintains a Condor cluster of 18
Mac Pros. Fourteen have 12 processing cores (24 virtual cores), 64 GB of RAM, and one
terabyte of storage each; the remainder are typically 6 core machines, also with large
amounts of RAM and storage. They are configured to allow multiple single core jobs to
run but also to allow multicore jobs to take over entire machines. The head node is
continually backed up to cloud storage. Current bioinformatics software is installed and,
as we have complete control, other software can be installed as needed. We have two OS
X servers used to host websites and databases. We have the office space needed to house
the postdoc. There are also numerous rooms on campus capable of supporting a
hackathon.

DATA MANAGEMENT PLAN. I have long been an advocate, and beneficiary, of open data
and open software, and so robust procedures to ensure availability of reuse of the data
will be established. First, software will be developed in the open on github, which allows
for version control and the opportunity for others to freely download and modify the
software (it will be placed under a the GNU General Public License). Major versions will
be uploaded to CRAN, which is mirrored across 96 different sites on six continents.
Simulations and analyses will be tracked using git on within lab repositories, as public
software repositories are not typically amenable to storing large numbers of binary files.
With publications, all relevant data will be deposited in the repositories currently
representing the best practices for this: at the moment, this is Dryad for all data and
TreeBase for any phylogenies, but this is an active area of growth and so new repositories
may become the standard (such as OpenTree’s treestore instead of TreeBase, for
example). Repositories used will be external (rather than just a lab-hosted repository) and
deposited data will be released under a CC0 license to foster reuse.
Data must also be maintained and backed up during the project as well. All software and
analyses will be wrapped into the existing lab backup protocols, which include doing all
the following for all the relevant data and code: storing versions in the cloud using
CrashPlan, storing Apple TimeMachine versions, and rotating short term storage of disk
images off site on lab-owned media.

Postdoctoral Mentoring Plan The main objective in crafting a postdoc mentoring plan is to help the postdoc achieve
her or his professional and scientific goals. This must begin with a frank self-assessment by the postdoc: what goals do they want to achieve, what skills do they bring to the table, what skills do they still need. For example, one past O’Meara lab postdoc desired more experience teaching to supplement her existing TA experience, as her career goals are tending towards a teaching college. She thus co-organized a seminar on adaptive radiation in Anolis, during which she received mentoring in course development, course management, and organizing discussions from a senior faculty member.
Besides the high-level view of long-term goals, it is important to think about deliverables. A concrete timeline will be developed jointly with the postdoctoral researcher to give more detail than the proposal timeline; this will include large tasks, milestones in manuscript preparation as well as other important events. This timeline defines the scope and goals of the project and clearly communicates expectations of the work the postdoc and the advisor will perform. Further, it opens discussions about authorship.
The postdoctoral researcher will receive two types of training. First, she or he will be trained in the necessary computational and statistical tools to complete the proposed work. Second, she or he will receive vocational training (i.e., how to write a teaching statement, how to prepare for an interview, and so forth). My lab, which has historically had between two and four postdocs, as new postdocs arrive and others leave (so far, ending up in tenure-track positions), has as-needed meetings with all the postdocs to go over vocational issues, such as peer-editing of job applications. Over the past five years I have mentored nine postdocs, including three currently. Of the six who have left, four went directly to tenure-track jobs; the remaining ones went on to a second postdoc position.
One important aspect of postdoc mentoring is making sure that barriers that tend to reduce the diversity of researchers as they move upward are reduced. We have made concrete steps to achieve this. For example, I wrote and received an in-house grant to co-organize a multi-department seminar and discussion series on women in science that was recently held at UTK. Postdocs are encouraged to set their own schedules and work locations, as long as adequate progress is being made; this has been important for postdocs returning from maternity leave or with other life events. At my request, there is now a department-wide postdoc mailing list so that postdocs may form connections across labs as well.