Embed Size (px)
Citation preview

Direct photons and jet correlations in heavy ion
collisions
Andrew AdareUniversity of Colorado
For the PHENIX CollaborationWWND, February 2007

Andrew Adare - WWND 2007
2Outline
• Motivation: how direct photon-jet correlations could improve knowledge of energy loss over RAA
• Expectations• Analysis techniques
– correlations and per-trigger yields– calculating decay-h from 0-h– subtraction method
• cross-checks and refinements• results

Andrew Adare - WWND 2007
3The QGP is opaque to hadrons
RHIC measurements indicate that the quark-gluon plasma
Is strongly interacting and flows like an ideal fluid, not a gas of hadrons.
Suppresses jet yields and modifies their shapes
Suppression/energy loss depends on the path length traversed. Particles produced near the surface have lower energy loss probabilities.

Andrew Adare - WWND 2007
4Measuring suppressed yields
0, from quark and gluon jets
High-pT hadrons are suppressed by a factor of 5 relative to scaled-up p-p collisions.
But photons are unaffected!
Nuclear modification factor RAA:
Yield (nuclear collisions)
Yield (binary scaled pp collisions)
=

Andrew Adare - WWND 2007
5Shortcomings of RAA
Measurement of RAA is impressive, and is an important step towards quantifying QGP properties.
However, single-particle suppression does not effectively constrain detailed energy-loss pictures.
T. Renk
Need a tool to measure energy loss in the medium with more discriminating power than RAA.
Andrew Adare - WWND 2007
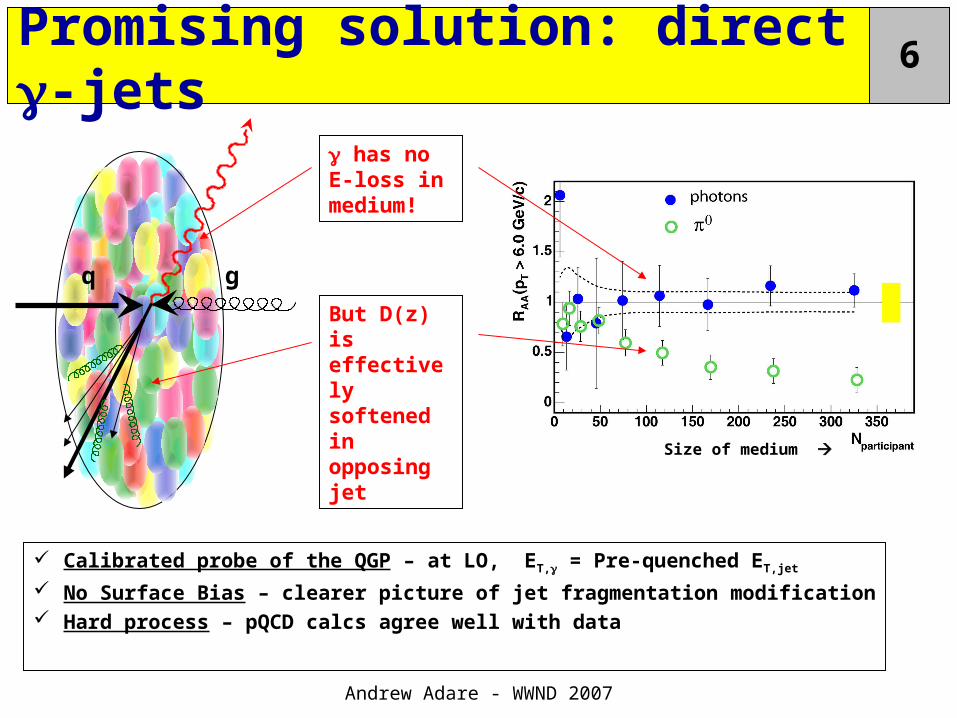
6Promising solution: direct -jets
q g
Calibrated probe of the QGP – at LO, ET, = Pre-quenched ET,jet
No Surface Bias – clearer picture of jet fragmentation modification Hard process – pQCD calcs agree well with data
has no E-loss in medium!
Size of medium
But D(z) is effectively softened in opposing jet

Andrew Adare - WWND 2007
7
Assume two photon sources, ( = # photons in data sample):
directdecayincl
Measuring direct -jet yields (I)
pT=5-7 GeV/c
pT=9-12 GeV/c
decaydirect
decay direct
Direct photons:
-- LO pQCD (compton, annihilation,…)
-- NLO pQCD (bremsstrahlung, fragmentation)
-- Jet-thermal photons
(See Takao’s talk…)
Hadronic decay photons:
2
2
each’decay
0
Cu+Cu:

Andrew Adare - WWND 2007
8Expectations:direct-h± in PYTHIA
High pT direct -h:
On near side, only NLO s contribute.
But at high pT, NLO contribution is small.
Expectation: The near-side peak in direct -jet correlations should be small!
In p+p, away side yield ~ half that of -h.
pT = 9-12 GeV/c, pT
h =3-5 GeV/c
• from – h+/-
• direct – h+/-
PYTHIA 6.205, 200 GeV p+p, <kT> = 2.5 GeV/c

Andrew Adare - WWND 2007
9
Assume two photon sources, ( = # photons in data sample):
Let Y = per-trigger conditional jet pair yield (1/Ntrig)dNpairs/d():
Write in terms of R
decaydirectincl
decayincl
decaydir
incl
dirincl YYY
decay
dir
decay
incl
simdecay
measincl
R
1)/(
)/(0
0
Measuring direct -jet yields (II)
)1(
1)
11(
R
YYRYY
RY
RY decayincl
dirdecaydirincl
Requires 3 components

Andrew Adare - WWND 2007
10Component 1 of 3: incl-h+/-
Angular correlation technique:
ID a high-pT “trigger” particle in an event
Measure distribution of angles between trigger and h+/- associated particles in same event
Measure for mixed events. Ratio is C():
)]2cos(21[)(
/
/
22
at
mix
real
vvJ
ddN
ddNC
correlation functions:

Andrew Adare - WWND 2007
11Component 1 of 3: incl-h+/-
per-trigger jet pair yields:

Andrew Adare - WWND 2007
12
We expect that the proportion of direct photons is enhanced as the size of the medium increases.
If two different systems (e.g. Central Cu+Cu and mid-central Au+Au) suppress 0s (and s) by the same amount, then they should have comparable R values.
Component 2 of 3: “double ratio” R
decay
dir
decay
incl
R
1Recall
0 RAA in Au+Au and Cu+Cu

Andrew Adare - WWND 2007
13Component 2 of 3: “double ratio” R
%200%5030 partpart NCuCuNAuAu
Double ratio R measured in AuAu, but not yet in CuCu…
Use <Npart> scaling to map AuAu R CuCu.
We will refer to the quantity “(direct/decay)Au+Au interp.”
%4020%6050 partpart NCuCuNAuAu

Andrew Adare - WWND 2007
14Component 3 of 3: decay-h+/-
correlation functions: Note: assuming decay here

Andrew Adare - WWND 2007
15Component 3 of 3: decay-h+/-
per-trigger jet pair yields:

Andrew Adare - WWND 2007
16
Each 0 has some probability to decay into a photon in a pT
range.
prob. to decay a 0 into a 9-12 GeV/c as a function of 0 pT.
decay-jet yields from 0 jets
Prob(), 9<pT<12
kine
mat
ical
ly
forb
idde
n
Tp
1
Tp
cGeV /91
Each measured 0 – h pair is weighted by this 0 decay probability to give the decay – h correlations.

Andrew Adare - WWND 2007
17Weighted 0 vs. from in PYTHIA
Black: PYTHIA “true” decay -h PTY
Red: PYTHIA pair-weighted -h PTY
Trigger pT: 5-7 7-9 9-12
h p
T : 1-2 3-5
The weighting method closely reproduces the true -h+/- correlations:

Andrew Adare - WWND 2007
18
We can test principles of the analysis method with Monte Carlo:
Does the subtraction formula work?
Calculating decay-h jet correlations from 0-h: what effects must be accounted for?
Cross-checking with simulations
)1(
R
YYRY decayincldir
energy smearing
perfect detector
EMCal energy resolution
and other decays decay angle smearing
• from – h+/-
• decay – h+/-
9-12 x 2-5

Andrew Adare - WWND 2007
19Full test of method in PYTHIA
Black: correlations with “true” direct photon triggers (ID’ed in event record)
Blue: direct photon correlations produced by subtraction method
The bias toward a low jet yield is worse for lower pT photon triggers, where R is smaller.
If one increases R by ~10%, the “true” correlation is roughly recovered. We use this 10% to gauge the systematic error from the subtraction method.
Magenta: direct -jet per-trigger yield, subtraction method as above, but with R scaled up by 10%
R = 1.90
R = 1.1*1.90 *Please note: This bias is due to the method, not uncertainty in R!
We are currently working hard to reduce this systematic error.
Dir
ect -
h p
airs
/tri
gg
er

Andrew Adare - WWND 2007
20Preliminary Cu+Cu Results: direct -h+/-
per-trigger jet pair yields: systematic from R
systematic from subtraction method

Andrew Adare - WWND 2007
21Cu+Cudirect-h+/- vs. -h+/- jet yields
per-trigger jet pair yields: systematic from R
systematic from subtraction method

Andrew Adare - WWND 2007
22200 GeV p+p direct -jet results
Near side consistent with expectations
Away side peak visible, but systematics are probably underestimated.

Andrew Adare - WWND 2007
23200 GeV Au+Au direct -jet results
Both near and away side yields appear consistent with 0
But again, systematic errors need improvement….

Andrew Adare - WWND 2007
24Summary
• Correlations involving direct photons are an important probe of energy loss and fragmentation function modification in the QGP.
• Subtraction method shows promise, but current measurements don’t yet deliver good resolution.
• Expectations seem to be matched on the near side, where we see ~no signal compared to 0-h for example.
• These are early results: reduction in systematic errors still needed to make strong statements about away-side jet yields. Stay tuned!

Andrew Adare - WWND 2007
25Backups

Andrew Adare - WWND 2007
2602 phase space is flat
Consider sample of many 0s, all with the same pT:
pT
decay prob.density (proportional to dN/dpT
)
pT
2/pT
Normalization requirement of prob. density fn. means prob. to get a photon at pT drops like 2/pT
as pT increases.
Therefore, dN/dpT= 2/pT
In reality, dN/dEis what is truly flat, but we assume dN/dpT
is also flat at midrapidity.
*A more mathematical way to get dN/dpT
= 2/pT
is to boost isotropic decay into lab frame.

Andrew Adare - WWND 2007
27Photons from 0s
Number of photons in bin p1<pT<p2 from the 0 bin:
Two cases:1. 0s are in same pT bin as photons
2. 0s are in higher pT bin than photons
2
1
2
1
2p
p
TT
p
p
TT
dpp
dpdp
dNN
2
1
1
12
2,12
22
21,1
122
p
p
TT
TT
p
p
TT
TT
in
ppp
ppdp
p
pppp
pdp
p
N
T

Andrew Adare - WWND 2007
28Weighting curves for pi0 decay probability
Using analytic form:
Decay probabilities above are combined with falling pi0 spectrum to give the decay photon “spectra”.
The decay gamma-h PTY is independent of the normalization, since both the pairs and triggers are applied the same weight.
Each pi0-h pair gets weighted by these 3 curves to produce the decay gamma-h correlation for the appropriate photon pT bin.
5<pT<7
7<pT<9
9<pT<12
2
1
1
12
2,12
22
21,1
122
p
p
TT
TT
p
p
TT
TT
in
ppp
ppdp
p
pppp
pdp
p
N
T
measured pi0 spectrum, centrality 0-20%
“spectra”.
Integral = # triggers