Embed Size (px)
Citation preview
Direct numerical inversion method for kineticellipsometric data. II. Implementation andexperimental verification
Alfred Hofrichter, Dmitri Kouznetsov, Pavel Bulkin, and Bernard Drevillon
A direct numerical inversion method is applied to the monitoring of thin-film growth. Several improve-ments of the method, including a correction for weakly absorbing materials, are presented. The methodhas been successfully applied to the inversion of the growth of constant-refractive-index layers and usedfor the process calibration of plasma-enhanced chemical vapor deposition of silicon oxynitrides. Thevalidity of this calibration has been successfully tested on a linear index gradient and quintic matchinglayer between a polycarbonate substrate and a scratch-resistant coating. © 2002 Optical Society ofAmerica
OCIS codes: 120.2130, 160.4760, 200.3050, 310.3840, 310.6860, 310.1860.
1. Introduction
In Part I of this study1 we presented a direct numer-ical inversion method for determining the thicknessand refractive index of a thin layer on top of a mul-tilayer stack. Because of its low computation bur-den �direct inversion and therefore no fitting�, thismethod can easily be adapted to the real-time moni-toring and control of multilayer deposition. The va-lidity of this method was checked in Part I of thispaper for the inversion of simulated data with andwithout noise of the growth of constant layers, lineargradients, and Bragg-reflector filters. This secondpart of the paper focuses on several details of theimplementation, introduces useful extensions of themethod, and deals with the experimental verificationof the inversion algorithm. For this purpose we ap-ply the method to the characterization of the opticalproperties during the deposition of thin films grownby plasma-enhanced chemical vapor deposition�PECVD�.
When this research was performed, the authors were with theLaboratoire de Physique des Interfaces et des Couches Minces,Ecole Polytechnique, Palaiseau, France. A. Hofrichter �[email protected]� is now with the Department of ThinFilms, Central Research Labs�Automotive, Saint-Gobain SekuritDeutschland GmbH and Co. KG, Glasstrasse 1, D-52134 Herzo-genrath, Germany.
Received 5 April 2001; revised manuscript received 15 October2001.
0003-6935�02�224519-07$15.00�0© 2002 Optical Society of America
After a brief description of the experimentalequipment �Section 2� we first discuss several im-provements of the method �Section 3� helpful toincreasing the stability and the precision of theinversion algorithm. These improvements arecentered on two issues. First, the algorithm is tobe adapted to use the available information in anoptimal way by introduction of a second-order ex-pansion, when the changes of one of the two ellip-sometric quantities are of the order of theexperimental noise �Subsection 3.A� and by intro-duction of a dynamic inversion step size �Subsection3.B�. Second, we have to address the case in whichthe inversion algorithm does not give a correct so-lution. Subsection 3.C deals with the presence ofweak absorption in the layer. Such absorption isoften present at high photon energies �where theellipsometric signal is most sensitive� for materialsnormally transparent in the visible region of theelectromagnetic spectrum. Finally �Subsection3.D�, we address the problem that, for physical ornumerical reasons, the inversion algorithm some-times gives no solution at all. Section 4 focuses onthe inversion of experimentally recorded target tra-jectories. First, we investigate the growth ofconstant-index films �Subsection 4.A�. We thenuse the inversion algorithm for process calibration�Subsection 4.B� in order to grow linear gradientcoatings on glass �Subsection 4.C� and an indexmatching between a polycarbonate �PC� substrate
and a scratch-resistance coating �Subsection 4.D�.1 August 2002 � Vol. 41, No. 22 � APPLIED OPTICS 4519
2. Experiment
A. Plasma Reactor
The thin-film depositions were carried out in an in-tegrated distributed electron cyclotron resonance mi-crowave plasma reactor described elsewhere.2Silane, oxygen, and nitrogen were used as precursors.Oxygen and nitrogen were injected through the mostintense electron cyclotron resonance regions; silanewas injected in the vicinity of the substrate holder.All depositions were performed at a pressure of �0.1Pa and with a microwave power of 500 W. Duringdeposition the substrates were kept at floating poten-tial, the substrates were not heated intentionally,and the substrate temperature stayed below 100 °C.By simply changing the ratio of the oxygen flow rateto the total flow rate, we obtained the whole range ofsilicon oxynitrides, with refractive indices from 1.46to 1.9. The gas flows are controlled by Tylan mass-flow controllers, by means of an Advantech PC DAC�ADC add-on card �digital–analog conversion card forpersonal computer�. The films were deposited onCorning 7059 glass and General Electric Lexan PC.
B. Ellipsometry
A commercial phase-modulated spectroscopic ellip-someter UVISEL from Jobin Yvon Horiba wasadapted in situ at an incidence angle of 56.8° on thechamber. Spectroscopic measurements from 1.5- to5-eV steps were performed before and after deposi-tion to characterize the refractive index and thick-ness of the substrate and the deposited materials.The measurements were made in the configurationanalyzer 45°; modulator 0°, where the recorded in-tensities Is, Ic are related to the ellipsometric angles�, � and the complex Fresnel reflection coefficients rsand rp �for the directions normal and parallel to theplane of incidence, respectively� through the follow-ing equations3:
IS � sin 2� sin � � 2 Im� rs*rp
rs rs* � rp rp*� ,
IC � sin 2� cos � � 2 Re� rs*rp
rs rs* � rp rp*� . (1)
The ellipsometer is equipped with a multiwavelengthacquisition unit, which allows the simultaneous ac-quisition at 16 different wavelengths evenly spacedbetween 1.5 and 5.05 eV, with typical integrationtimes of 200 ms. To minimize the influence of theplasma emission on the ellipsometric measurement,the plasma background was measured at every singleacquisition, giving typical acquisition times of 1.2 sfor a complete spectrum. The ellipsometer is linkedby means of a Transfer Protocol�Internet Protocol�TCP�IP� connection to the control computer, whichcontrol’s the acquisition parameters and adapts thevoltage of the photomultipliers to optimize the signalintensity during the filter growth. The control soft-ware was implemented in Delphi software on a 450-MHz Pentium computer.
3. Implementation Details and Improvements of theMethod
A. Second-Order Expansion
The direct numerical inversion method, as explainedin Part I of this study,1 is based on the expansion ofthe changes of the measured signal dIc,s as a polyno-mial function of the dielectric constant �, and thethickness dx of the newly grown layer:
dIc � Ac���2�dx2 � Bc��
�1�dx, (2)
dIs � As���2�dx2 � Bs��
�1�dx, (3)
where A���2� and B���1� are polynomials of � of theform
B���1� � C1B� � C0
B � C�1B��, (4)
A���2� � C2A�2 � C1
A� � C0A � �C�1
A��� � �C�2A��2�,
(5)
whose complex coefficients have been determined nu-merically from the reconstruction of the underlyinglayers. The changes dIc, dIs, induced by the newlygrown layer, are determined by the measurement; wecan eliminate dx from Eq. �4� and �5� and solve theresulting equation, which is of the eighth order in �.
Looking more closely at Eqs. �2� and �3�, we observethat Is and Ic are expanded only to the first order �dIs,dIc�, whereas the dependency of dx includes second-order terms. This can be used when, owing to thepresence of experimental noise, only one of the twoellipsometric quantities provides useful information.In the region close to a local maximum, the changesof Is or Ic can become insensitive to thickness changesand of the order of magnitude of the experimentalnoise for large thickness. But since the maxima of Isand Ic are frequently evolving out of phase �especiallyin the case of homogeneous layers�, we can usesecond-order time dependency of the other ellipso-metric quantity to gain additional information. Ex-panding dIs,c to the second order with respect of t, weobtain
dIc,s�t� � Ac,st dt2 � Bc,s
tdt. (6)
Assuming a constant growth rate dx�dt, we canwrite
dIc,s�t� �Ac,s
t
2 dx2 �Bc,s
t
dx. (7)
The coefficients of this second-order polynomial in dxcan be identified with Eq. �6�:
Ac,s���2� �
Ac,st
2 ,
Bc,s���1� �
Bc,st
. (8)
4520 APPLIED OPTICS � Vol. 41, No. 22 � 1 August 2002
The growth rate can be easily eliminated from theseequations, and we get a new master function:
P���2� � Ac,st�Bc,s��
�1��2 � Ac,s���2��Bc,s
t�2 � 0. (9)
Multiplying this function by �2, we get a polynomial ofthe order 4, whose roots give the refractive index ofthe newly grown layer.
B. Dynamic Step-Size Adjustment
In Part I of this study1 we observed that an optimalstep size is a crucial factor for the quality of thereconstruction. Indeed, if the step size is too small,the presence of experimental noise introduces recon-struction errors, and if the step size is too large, thepolynomial approximation is no longer valid. Fur-thermore, it is well known that the sensitivity of theellipsometric signal for the outermost layer dependsheavily on the optical properties of the underlyingstack. In addition, the growth rate of the film is notnecessarily known at the beginning of the depositionand can change during the deposition process. Toachieve an optimal reconstruction, it is therefore use-ful to adapt the step size during the inversion.
To choose an optimal step size, we implemented adynamic step-size procedure based on comparison ofthe measured changes of Is and Ic with respect to theexperimental noise �Ie and the theoretical calibrationuncertainties �It. As soon as the changes dI be-tween the last point used for inversion and the new-est recorded point are greater than
dI � Max��Ie, �It�, (10)
the corresponding wavelength is set to be ready forinversion. is an experimentally determined scal-ing parameter whose values are between 1.5 and 2.These criteria are verified independently for each ofthe two recorded intensities Is and Ic. As soon as acertain fraction of the acquisition wavelength is setready for inversion �typically 80%�, the inversion al-gorithm itself is started. The time between two suc-cessive inversions therefore changes during theinversion, and the step size of the reconstructionchanges accordingly.
Because additional points may have been recordedin the meantime for acquisition channels for whichthe reconstruction is already possible, it is checkedagain for each wavelength if Is and Ic verify the cri-teria of relation �10�. If for both recorded ellipsomet-ric intensities relation �10� is valid, the normalinversion is undertaken. If the above criterion isvalid for only one of the recorded intensities, it mustbe checked if we are in the presence of a local maxi-mum for the complementary ellipsometric intensity�see Subsection 3.A� or if the signal-to-noise ratio istoo low to allow for a successful inversion. This isverified by means of computing the ratio dIs�dIc. Ifthis ratio is close to 1, the corresponding wavelengthis discarded for this inversion step; if it is not, theinversion is done according to the second-order ex-pansion presented in Subsection 3.A.
C. Weak Absorption Correction
In presence of weak absorption in the film the recon-struction result I�1 Ic�1 � iIs�1 obtained by the inver-sion method is usually not identical to the targetvalue I1 Ic1 � iIs1. In this case it is necessary toinclude a correction procedure in order to avoid theaccumulation of the reconstruction errors during thesubsequent inversions. Introducing the differencedI I�1 �I1 between these values, we can write in thevicinity of the correct solution:
dI ��I�1
� Re �d Re � �
I�1� Im �
d Im � ��I�1� x
dx. (11)
Setting dx 0 �the thickness is well known� andsplitting the above equation into real and imaginaryparts, we can write
dIc � Re� �I�1� Re ��d Re � � Re� �I�1
� Im ��d Im �,
dIs � Im� �I�1� Re ��d Re � � Im� �I�1
� Im ��d Im �. (12)
With dIs and dIc known, it is now possible to computethe corrections d Re � and d Im �. Using these cor-rections of the dielectric function, we obtain a new I�1,and, if necessary, the procedure can be restarted sev-eral times until dI is minimized.
D. Polynomial Interpolation
Finally, we have to address the case in which theinversion algorithm gives no correct solution at all.As was been pointed out above, this can happen whenthe signal-to-noise ratio for a particular wavelengthis too high at certain points of the reconstruction, orwhen, for physical or numerical reasons, the inver-sion algorithm gives erroneous results. In the caseof a constant layer with a refractive index nL this canhappen when calibration errors amplify the alreadycritical inversion problem near points where theoptical-phase thickness � 2�d��nL cos �L is closedto multiples of 2�. Here d is the thickness of thelayer, � is the wavelength, and �L is the angle of thelight beam with respect to the normal incidence. Itis nevertheless necessary to find a reasonable valuefor the refractive index in these cases, since it isotherwise impossible to continue the reconstructionin the subsequent steps. In this case we use thespectroscopic information gained during the inver-sion. If the deposited materials permit such an ap-proximation, we can fit the calculated refractive-index values by a dispersion law and substitute thethus obtained value for the missing refractive-indexvalue. In the case of the oxynitrides used in thisstudy the Cauchy dispersion law is well adapted andhas the additional benefit that it can be presented asa polynomial function of the photon energy expressedin electron volts. It is therefore possible to calculatethe best polynomial fitting the refractive-index val-ues analytically by use of the appropriate formulas.
1 August 2002 � Vol. 41, No. 22 � APPLIED OPTICS 4521
4. Results and Discussion
A. Single-Layer Deposition
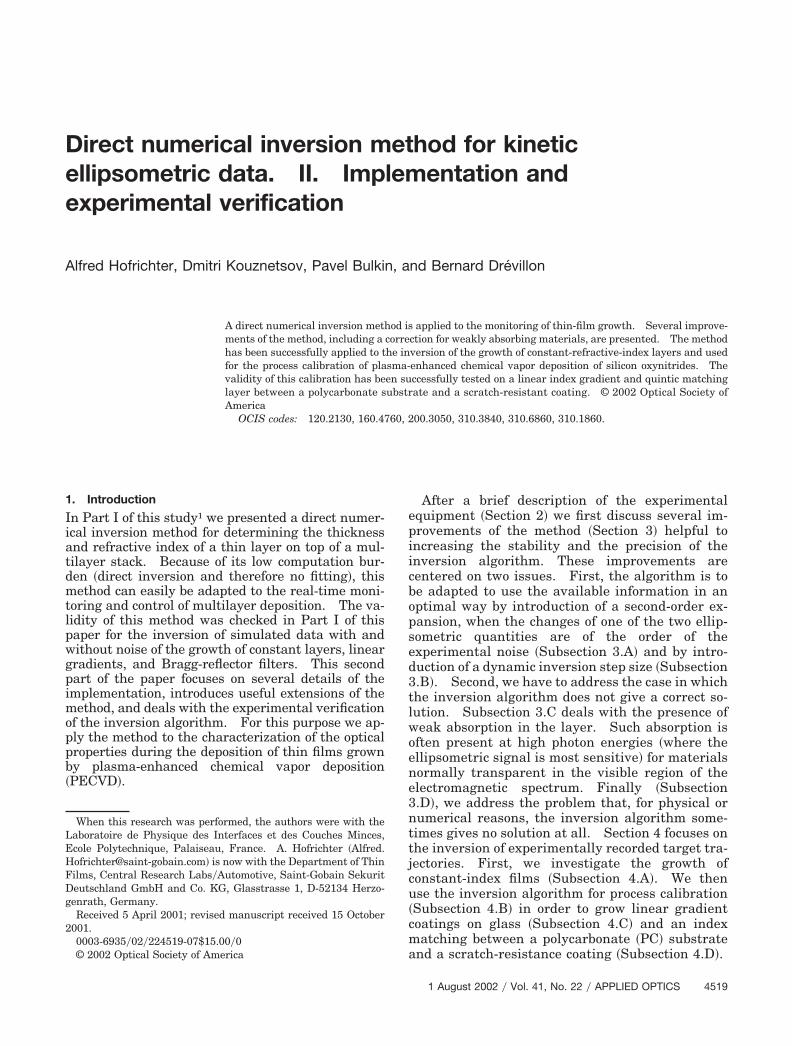
Figure 1 shows the experimental and the recon-structed Is�Ic� trajectories for the growth of a siliconnitride and a silicon oxynitride layer on Corning 7059glass at two different wavelengths. The films weregrown at a pressure of 0.72 mTorr, under a processingpower of 500 W and at a constant nitrogen flow of 15sccm. The SiH4 flow was kept constant at 0.8 sccm,and the oxygen flow was set at 0 sccm for siliconnitride and 0.824 sccm for the silicon oxynitride layer.The trajectories were reconstructed with the incoher-ent reflection model with 15-wavelength spectro-scopic data recorded at a 2-s interval during thedeposition process. The integration time at each ac-quisition was 350 ms, and a blank measurement wasmade at each acquisition to subtract the light emis-sion from the plasma. The size of the ellipsoidaltrajectory is much bigger in the case of the siliconnitride than in the case of the oxynitride. This isexpected, because the refractive-index difference be-tween film and substrate is much higher in the caseof silicon nitride. One observes for all channels agood reconstruction of the experimental trajectory.
Figure 2 �open symbols� plots the reconstructed
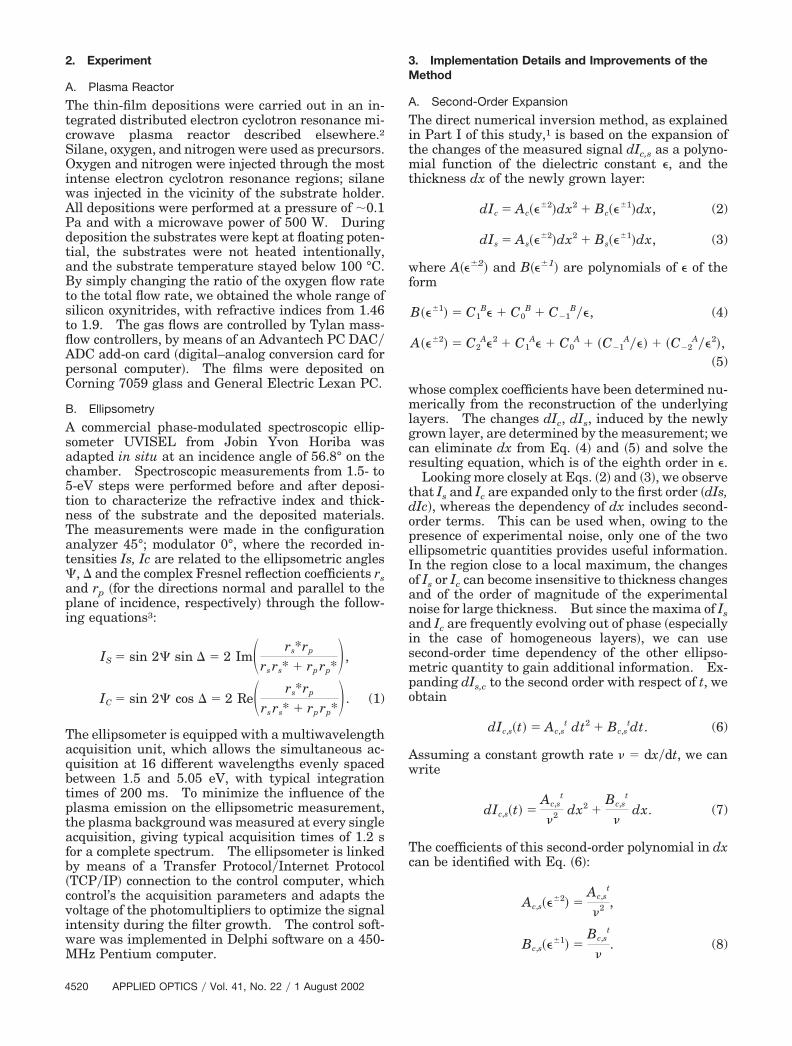
refractive index for a silicon oxynitride versus thethickness. We observe that the reconstructed indexversus thickness shows oscillations for all wave-lengths with a maximum amplitude of �0.03 arounda mean value. The sample was characterized afterdeposition by spectroscopic ellipsometry from 1.5–5eV with a step of 0.025 eV. The spectroscopic fit��2 1.41� indicates a homogeneous layer, whoserefractive index �straight line in Fig. 2� is in accor-dance with the average values of the reconstructedrefractive index. The oscillations of the recon-structed refractive index, however, suggest the pos-sibility of refractive-index variations during thegrowth. As can be observed in Fig. 1 the trajectoriesat all wavelengths show a significant shift of the cen-ter of the ellipsoid during the growth, a shift that isclose, however, to absolute error bars of the measure-ment. Such a shift is characteristic for refractive-index variations during the growth. Because thedeposition process is sensitive to the oxygen-to-nitrogen ratio, such oscillations might be attributedto fluctuations of the oxygen mass-flow controller.The corresponding index variations, however, remainsmall and could not be verified by the spectroscopicmodeling after the deposition.
In the case of silicon nitride �Fig. 2, filled symbols�we observe a refractive-index increase with thicknessat the beginning �first 300–400 Å� of the growth.This can already be seen from Fig. 1, since the elliptictrajectory does not reach the starting point. Thepresence of absorption, however, can be discarded,since the trajectory is an ellipse and not a spiral, oncethe stable state has been reached. From then on, weobserve slight oscillations �between 0.01 and 0.02 de-pending on the acquisition wavelength� of the refrac-tive index with increasing thickness. Because theperiod of these oscillations varies with the photonenergy, the oscillations can be attributed to the peri-odic reconstruction errors that result from combinedinsensitivity at certain optical thickness and thepresence of experimental noise. Note that the re-
Fig. 1. Experimental and reconstructed trajectory Is�Ic� at a 58°angle of incidence 58° for �a� 1.8 eV and �b� 3.8 eV of two PECVDsilicon oxynitrides deposited at a processing power of 500 W and aN2 flow of 15 sccm and variable oxygen flow.
Fig. 2. Reconstructed refractive index versus thickness at 1.8 and3.8 eV of two PECVD silicon oxynitrides at a processing power of500 W and a N2 flow of 15 sccm and variable oxygen flow. Thestraight lines represent the refractive-index evolution found byspectroscopic modeling of the film after deposition.
4522 APPLIED OPTICS � Vol. 41, No. 22 � 1 August 2002
construction error at 1000 s has been well compen-sated by use of the polynomial interpolation methodand did not destabilize the reconstruction process.
The sample was characterized after deposition byspectroscopic ellipsometry from 1.5–5 eV with a stepof 0.025 eV. A modeling with a homogeneous layergave a �2 of 10 and can therefore be rejected. Asecond model consisting of a first layer of 350 Å witha linear gradient, followed by a second layer with athickness of 2225 Å and a homogeneous refractiveindex, gave a satisfactory �2 of 1.46. The refractive-index profile is also plotted in Fig. 2. The total re-constructed thickness of the stack, with 2584 Å, is inexcellent agreement with the thickness of 2578 Åfound by the spectroscopic modeling. A similargrowth behavior for silicon nitride growth on glasshad already been reported3 and attributed to the dep-osition of less-dense material at the beginning of thegrowth.
B. Calibration of the Deposition Process
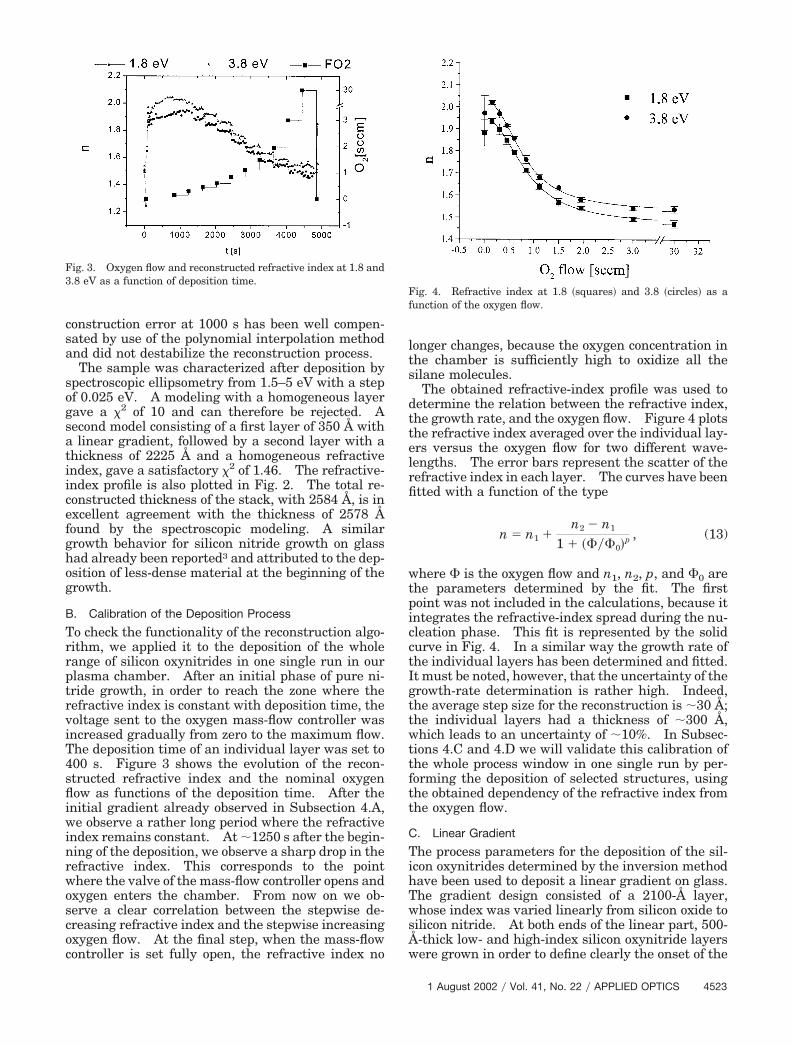
To check the functionality of the reconstruction algo-rithm, we applied it to the deposition of the wholerange of silicon oxynitrides in one single run in ourplasma chamber. After an initial phase of pure ni-tride growth, in order to reach the zone where therefractive index is constant with deposition time, thevoltage sent to the oxygen mass-flow controller wasincreased gradually from zero to the maximum flow.The deposition time of an individual layer was set to400 s. Figure 3 shows the evolution of the recon-structed refractive index and the nominal oxygenflow as functions of the deposition time. After theinitial gradient already observed in Subsection 4.A,we observe a rather long period where the refractiveindex remains constant. At �1250 s after the begin-ning of the deposition, we observe a sharp drop in therefractive index. This corresponds to the pointwhere the valve of the mass-flow controller opens andoxygen enters the chamber. From now on we ob-serve a clear correlation between the stepwise de-creasing refractive index and the stepwise increasingoxygen flow. At the final step, when the mass-flowcontroller is set fully open, the refractive index no
longer changes, because the oxygen concentration inthe chamber is sufficiently high to oxidize all thesilane molecules.
The obtained refractive-index profile was used todetermine the relation between the refractive index,the growth rate, and the oxygen flow. Figure 4 plotsthe refractive index averaged over the individual lay-ers versus the oxygen flow for two different wave-lengths. The error bars represent the scatter of therefractive index in each layer. The curves have beenfitted with a function of the type
n � n1 �n2 � n1
1 � ����0�p , (13)
where � is the oxygen flow and n1, n2, p, and �0 arethe parameters determined by the fit. The firstpoint was not included in the calculations, because itintegrates the refractive-index spread during the nu-cleation phase. This fit is represented by the solidcurve in Fig. 4. In a similar way the growth rate ofthe individual layers has been determined and fitted.It must be noted, however, that the uncertainty of thegrowth-rate determination is rather high. Indeed,the average step size for the reconstruction is �30 Å;the individual layers had a thickness of �300 Å,which leads to an uncertainty of �10%. In Subsec-tions 4.C and 4.D we will validate this calibration ofthe whole process window in one single run by per-forming the deposition of selected structures, usingthe obtained dependency of the refractive index fromthe oxygen flow.
C. Linear Gradient
The process parameters for the deposition of the sil-icon oxynitrides determined by the inversion methodhave been used to deposit a linear gradient on glass.The gradient design consisted of a 2100-Å layer,whose index was varied linearly from silicon oxide tosilicon nitride. At both ends of the linear part, 500-Å-thick low- and high-index silicon oxynitride layerswere grown in order to define clearly the onset of the
Fig. 3. Oxygen flow and reconstructed refractive index at 1.8 and3.8 eV as a function of deposition time.
Fig. 4. Refractive index at 1.8 �squares� and 3.8 �circles� as afunction of the oxygen flow.
1 August 2002 � Vol. 41, No. 22 � APPLIED OPTICS 4523
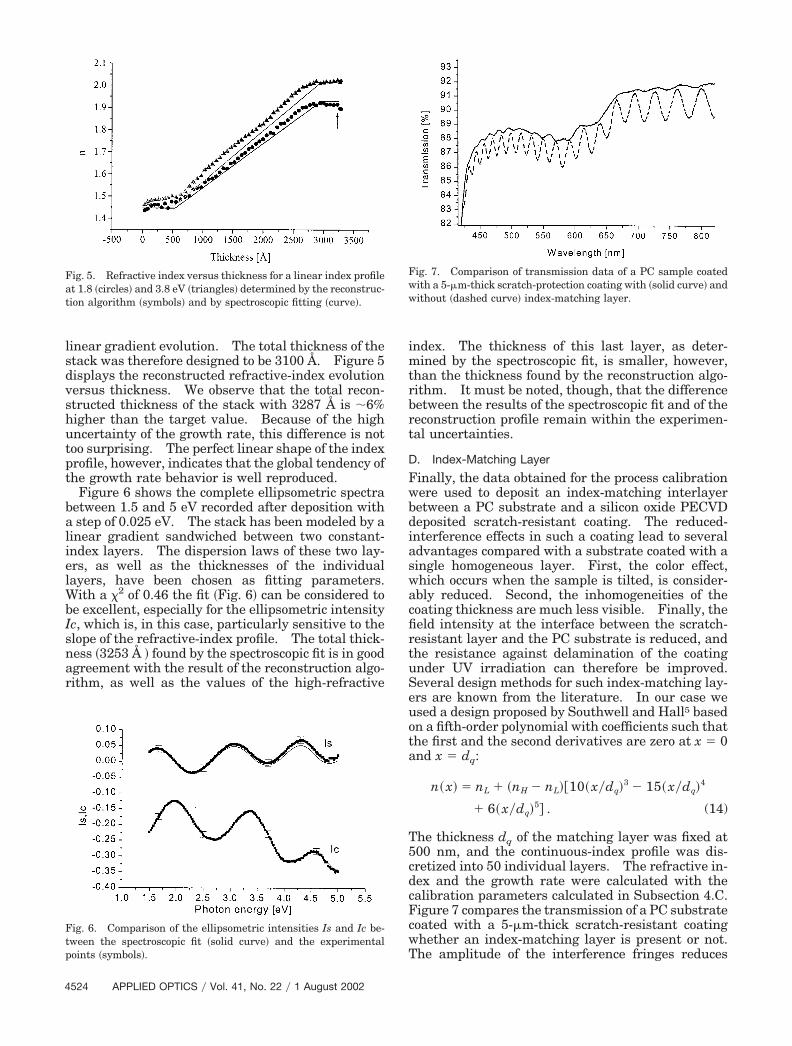
linear gradient evolution. The total thickness of thestack was therefore designed to be 3100 Å. Figure 5displays the reconstructed refractive-index evolutionversus thickness. We observe that the total recon-structed thickness of the stack with 3287 Å is �6%higher than the target value. Because of the highuncertainty of the growth rate, this difference is nottoo surprising. The perfect linear shape of the indexprofile, however, indicates that the global tendency ofthe growth rate behavior is well reproduced.
Figure 6 shows the complete ellipsometric spectrabetween 1.5 and 5 eV recorded after deposition witha step of 0.025 eV. The stack has been modeled by alinear gradient sandwiched between two constant-index layers. The dispersion laws of these two lay-ers, as well as the thicknesses of the individuallayers, have been chosen as fitting parameters.With a �2 of 0.46 the fit �Fig. 6� can be considered tobe excellent, especially for the ellipsometric intensityIc, which is, in this case, particularly sensitive to theslope of the refractive-index profile. The total thick-ness �3253 Å � found by the spectroscopic fit is in goodagreement with the result of the reconstruction algo-rithm, as well as the values of the high-refractive
index. The thickness of this last layer, as deter-mined by the spectroscopic fit, is smaller, however,than the thickness found by the reconstruction algo-rithm. It must be noted, though, that the differencebetween the results of the spectroscopic fit and of thereconstruction profile remain within the experimen-tal uncertainties.
D. Index-Matching Layer
Finally, the data obtained for the process calibrationwere used to deposit an index-matching interlayerbetween a PC substrate and a silicon oxide PECVDdeposited scratch-resistant coating. The reduced-interference effects in such a coating lead to severaladvantages compared with a substrate coated with asingle homogeneous layer. First, the color effect,which occurs when the sample is tilted, is consider-ably reduced. Second, the inhomogeneities of thecoating thickness are much less visible. Finally, thefield intensity at the interface between the scratch-resistant layer and the PC substrate is reduced, andthe resistance against delamination of the coatingunder UV irradiation can therefore be improved.Several design methods for such index-matching lay-ers are known from the literature. In our case weused a design proposed by Southwell and Hall5 basedon a fifth-order polynomial with coefficients such thatthe first and the second derivatives are zero at x 0and x dq:
n� x� � nL � �nH � nL��10� x�dq�3 � 15� x�dq�
4
� 6� x�dq�5� . (14)
The thickness dq of the matching layer was fixed at500 nm, and the continuous-index profile was dis-cretized into 50 individual layers. The refractive in-dex and the growth rate were calculated with thecalibration parameters calculated in Subsection 4.C.Figure 7 compares the transmission of a PC substratecoated with a 5-�m-thick scratch-resistant coatingwhether an index-matching layer is present or not.The amplitude of the interference fringes reduces
Fig. 5. Refractive index versus thickness for a linear index profileat 1.8 �circles� and 3.8 eV �triangles� determined by the reconstruc-tion algorithm �symbols� and by spectroscopic fitting �curve�.
Fig. 6. Comparison of the ellipsometric intensities Is and Ic be-tween the spectroscopic fit �solid curve� and the experimentalpoints �symbols�.
Fig. 7. Comparison of transmission data of a PC sample coatedwith a 5-�m-thick scratch-protection coating with �solid curve� andwithout �dashed curve� index-matching layer.
4524 APPLIED OPTICS � Vol. 41, No. 22 � 1 August 2002
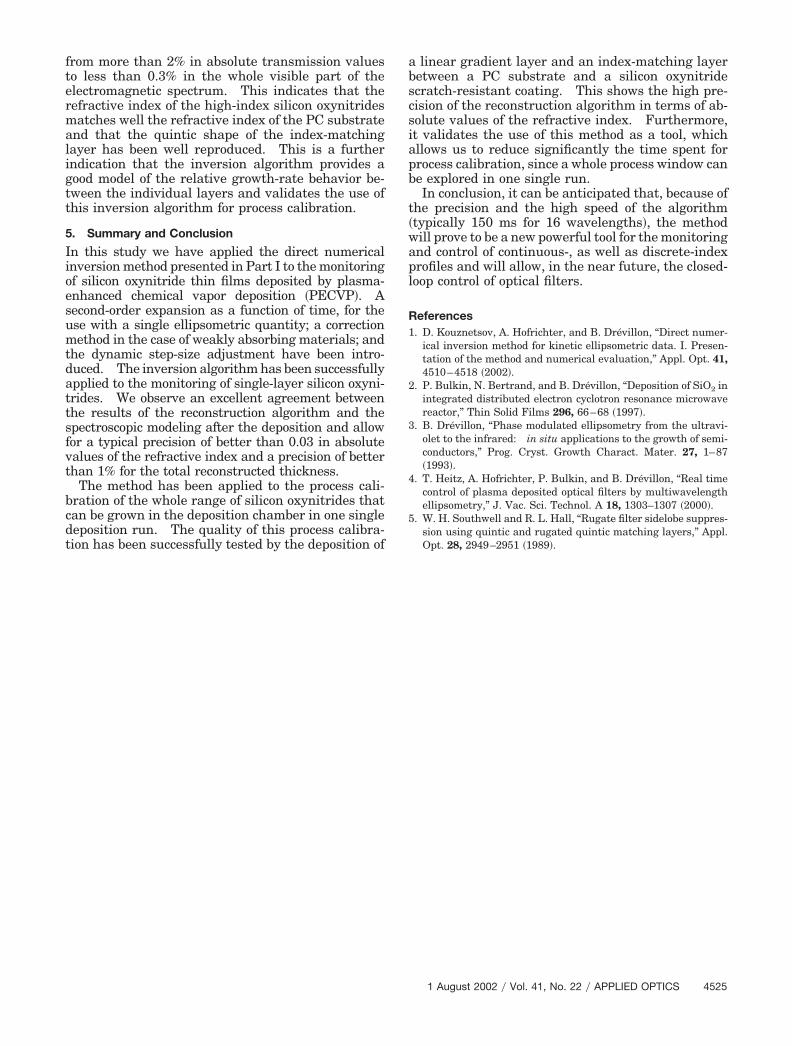
from more than 2% in absolute transmission valuesto less than 0.3% in the whole visible part of theelectromagnetic spectrum. This indicates that therefractive index of the high-index silicon oxynitridesmatches well the refractive index of the PC substrateand that the quintic shape of the index-matchinglayer has been well reproduced. This is a furtherindication that the inversion algorithm provides agood model of the relative growth-rate behavior be-tween the individual layers and validates the use ofthis inversion algorithm for process calibration.
5. Summary and Conclusion
In this study we have applied the direct numericalinversion method presented in Part I to the monitoringof silicon oxynitride thin films deposited by plasma-enhanced chemical vapor deposition �PECVP�. Asecond-order expansion as a function of time, for theuse with a single ellipsometric quantity; a correctionmethod in the case of weakly absorbing materials; andthe dynamic step-size adjustment have been intro-duced. The inversion algorithm has been successfullyapplied to the monitoring of single-layer silicon oxyni-trides. We observe an excellent agreement betweenthe results of the reconstruction algorithm and thespectroscopic modeling after the deposition and allowfor a typical precision of better than 0.03 in absolutevalues of the refractive index and a precision of betterthan 1% for the total reconstructed thickness.
The method has been applied to the process cali-bration of the whole range of silicon oxynitrides thatcan be grown in the deposition chamber in one singledeposition run. The quality of this process calibra-tion has been successfully tested by the deposition of
a linear gradient layer and an index-matching layerbetween a PC substrate and a silicon oxynitridescratch-resistant coating. This shows the high pre-cision of the reconstruction algorithm in terms of ab-solute values of the refractive index. Furthermore,it validates the use of this method as a tool, whichallows us to reduce significantly the time spent forprocess calibration, since a whole process window canbe explored in one single run.
In conclusion, it can be anticipated that, because ofthe precision and the high speed of the algorithm�typically 150 ms for 16 wavelengths�, the methodwill prove to be a new powerful tool for the monitoringand control of continuous-, as well as discrete-indexprofiles and will allow, in the near future, the closed-loop control of optical filters.
References1. D. Kouznetsov, A. Hofrichter, and B. Drevillon, “Direct numer-
ical inversion method for kinetic ellipsometric data. I. Presen-tation of the method and numerical evaluation,” Appl. Opt. 41,4510–4518 �2002�.
2. P. Bulkin, N. Bertrand, and B. Drevillon, “Deposition of SiO2 inintegrated distributed electron cyclotron resonance microwavereactor,” Thin Solid Films 296, 66–68 �1997�.
3. B. Drevillon, “Phase modulated ellipsometry from the ultravi-olet to the infrared: in situ applications to the growth of semi-conductors,” Prog. Cryst. Growth Charact. Mater. 27, 1–87�1993�.
4. T. Heitz, A. Hofrichter, P. Bulkin, and B. Drevillon, “Real timecontrol of plasma deposited optical filters by multiwavelengthellipsometry,” J. Vac. Sci. Technol. A 18, 1303–1307 �2000�.
5. W. H. Southwell and R. L. Hall, “Rugate filter sidelobe suppres-sion using quintic and rugated quintic matching layers,” Appl.Opt. 28, 2949–2951 �1989�.
1 August 2002 � Vol. 41, No. 22 � APPLIED OPTICS 4525