Embed Size (px)
Citation preview

Direct Costs Estimates and Economic Impacts for Washington State
January 2017

Community Attributes Inc. tells data rich stories about communitiesthat are important to decision-makers.
President and CEO
Chris Mefford
Project Manager
Spencer Cohen, PhD
Lead Analyst
Sudarshan Sampath
Analysts
Diana HaringMichaela Jellicoe
Katy NallyAlexandra Streamer
Eric Viola
Community Attributes Inc.1411 Fourth Ave, Suite 1401
Seattle, Washington 98101www.communityattributes.com

Executive Summary
Invasive Species in Washington
Total Costs of Invasive Species
Most Costly Invasive Species
Information and Background
Project Background
Research Questions
Key Terms and Concepts
Methodology
Output Calculations by Commodity
Acreage Datasets and Analysis Used
Direct Impacts from Invasive Species
Induced and Indirect Economic Impacts
3
3
3
5
5
5
7
7
8
8
Summaries of Individual Invasive Species
Himalayan Blackberry
Yellow Starthistle
Diffuse Knapweed
Meadow Knapweed
Spotted Knapweed
Leafy Spurge
Scotch Broom
Rush Skeletonweed
Purple Loosestrife
Smooth Cordgrass
Invasive Knotweed
Eurasian Watermilfoil
Zebra/Quagga Mussels
Apple Maggot
Asian and European Gypsy Moth
Emerald Ash Borer
Nutria
Feral Swine
11
13
15
17
19
21
23
25
27
29
31
33
35
37
39
41
43
45

Executive Summary

Invasive Species in WashingtonWashington is at risk from a wide variety of invasive species. These
nonnative plants and animals have an adverse impact on
Washington’s landscapes, ecosystems, agriculture, commerce and
recreation.
This report aims to help state agencies tasked with managing natural
resources to quantify the potential economic damages of a select list of
twenty-three invasive species on the overall Washington economy,
coupled with a broader understanding as to how these damages
translate into lost jobs, lost wages, and lost business sales (or output).
Total Costs of Invasive Species Crops: Cropland has the potential to be quickly infested by invasive
plants, which reduce overall yields and require resources for their
control. Furthermore, crops are directly lost through invasive animal
consumption. The direct impact of invasive species on crops grown in
Washington is estimated to be $239.5 million per year.
Livestock: Invasive noxious weeds in pastures and rangeland
displace desirable forage that help sustain livestock. In some cases,
these plants are also toxic to livestock and horses and can be fatal.
The direct economic impact of invasive species on the livestock
industry is estimated to be $120.1 million annually.
Timber: Many invasive species can severely impact Washington’s
$1.68 billion timber and logging industry. Invasive noxious weed
species such as Scotch broom can outcompete new saplings, which
reduces future timber harvests. Insect species such as the gypsy moth
have a more immediate impact on the timber industry by defoliating
and stressing, resulting in mortality of adult trees. The direct economic
impact of invasive species on the timber industry is estimated to be
$124.8 million.
Recreation: Recreational activities such as hunting, fishing, and
boating can all be adversely affected by invasive species. Many of the
same species that impact a rancher’s ability to range their cattle also
reduce elk and deer populations. Aquatic invasive
species can cause declines in fish populations and reduce access to
popular fishing areas. Other aquatic species can clog up boat propellers
and render public boat launches unusable. The direct economic impact to
recreational activities from invasive species is estimated to be $20.5
million per year.
Most Costly Invasive Species
Plant Species
Rush skeletonweed has an extensive root system that allows it to
outcompete native grasses and valuable crops for water. Major crops
impacted include wheat and potatoes, both of which are major
commodities in Washington. It has the potential to have a total economic
impact of $149.2 million, putting 1,080 jobs at risk if it were allowed to
spread an additional 12% per year into susceptible land types.
Scotch broom quickly forms dense stands which quickly outcompete
young trees and desirable forage plants. Furthermore, Scotch broom can
be toxic to cattle. Scotch broom is widespread in western Washington and
has the potential to cause a total of $142.7 million in lost sales and 660
job losses in Washington per year if it were allowed to spread an
additional 12% per year into susceptible land types.
Animal Species:
Apple maggots infest apple, pear and cherry orchards, rendering
significant numbers of fruit unsuitable for sale. Since apple maggot is an
invasive species, any orchard infested with apple maggot cannot export
any of its fruit without undergoing treatment. The total economic impact
from apple maggot is estimated to be $392.5 million, putting 2,900 jobs
at risk per year.
Zebra mussels are not currently found in Washington but do have the
potential to infest numerous bodies of water in the Columbia River Basin.
Zebra mussels can clog intake valves in dams as well as colonize public
boat launches, rendering them unusable. If zebra mussels were to
establish in Washington, the economic impact could be as large as $100.1
million. This translates into an estimated loss of 500 jobs.

Information & Background

2. Rangelands: Designated rangeland is considered to be the sum of
Grassland/Pasture and shrub land land areas as described by the
National Agriculture Statistic Service’s CropScape map for
Washington. Rangeland impacts are considered only for livestock
meant for slaughter.
3. Timberland: Lands that were designated as timber-producing areas
were collected from The Washington State Forest Biomass Supply
Assessment Database through the University of Washington.
4. Wildlands: Wildlands are broken into three unique recreation
impacts; 1. Hunting, 2. Fishing, and 3. Boating. Hunting on Wildlands
are considered to cover the same area as rangeland. However, fishing
impacts are focused exclusively on rivers while and boating impacts
are calculated for both rivers and lakes but not ocean bays. River data
is collected through the Washington Department of Fish and Wildlife’s
SalmonScape database. Lake data is collected through the United
States Geographic Survey National Hydrography Dataset.
Degradation Rates: The primary mechanism for calculating direct
impacts of invasive plant species are the utilization of per-acre
degradation rates tabulated in a Oregon Department of Agriculture report
“Economic Impact From Selected Noxious Weeds in Oregon” (The
Research Group, 2014). The degradation rate is the percentage of output
lost per acre across all relevant land types for each considered species.
These degradation rates are related exclusively with the productive
capacity of the land an invasive species might be found on.
Acreages of Impact from Invasive Species: Acreages of impact for
each invasive species and associated commodities are generally based
on a percentage of probable spread for each land type studied this is also
referred to as a “rate of infestation” or “rate of spread” in the report. Some
species have drastically different rates of infestation or spread than others
which in turn result in different levels of impact.
Explanation of AnalyticsThe analytics presented in this report provide a snapshot of total economic
impact within a single year if no prevention or management activities
occurred.
Project BackgroundInvasive species have an adverse impact on Washington’s
landscapes, ecosystems, agriculture, commerce, and recreation.
These damages translate into costs borne by businesses and
communities throughout the state economy, such as lost agricultural
output and outdoor recreation-related sales.
The Washington State Department of Agriculture, in partnership with
the State Noxious Weed Control Board and the Washington Invasive
Species Council, requested a cost-effective study of the potential
economic damages of a select list of 23 invasive species on the wider
Washington economy and a broader understanding as to how these
damages would translate to lost jobs, lost wages, and lost sales. The
resulting analysis leveraged various ecological studies and economic
impact studies done for other states on similar invasive species,
particularly the recent report “Economic impact from selected noxious
weeds in Oregon”, which was released in December 2014 by the
Oregon Department of Agriculture (The Research Group, 2014).
Research Questions> What are the direct economic impacts of invasive species in
terms of lost output across a range of natural resource activities,
e.g., agriculture, timber, and aquaculture?
> What are the total impacts of invasive species in terms of lost
business sales (including indirect and induced impacts), lost labor
income and lost jobs to Washington?
> How do invasive species affect recreational activities in
Washington?
> What are the possible scenarios that describe the spread of
invasive species throughout Washington?
Key Terms and ConceptsThis report broadly focuses on four distinct land types:
1. Croplands: Parcels of land that are designated as agriculture land
by the Washington Department of Agriculture’s 2015 Agriculture
Land Use Survey that are growing a variety of agriculture products.

Methodology

Acreage Datasets and Analysis Used Crops: Data on crop acreages for Washington was taken from the 2015
Washington State Department of Agriculture Agricultural Land Use. This
provides estimates on acres by crop type and county in Washington state for
impact estimates by invasive species. The geodatabase was connected to
ArcGIS using directions provided by the Washington State Department of
Agriculture.
Rangeland: The United State Department of Agriculture Crop Scape dataset
provides estimates on rangeland acres by county in Washington state for impact
estimates by invasive species. Specifically, the process is as follows: the
grass/pasture (value 176) and shrub land (value 152) rasters are downloaded
for Washington state; then using the Use Raster to Polygon tool in ArcGIS the
raster converts pixels to a shapefile and merges the polygons together for one
rangeland area estimate; the Use Erase tool in ArcGIS is used to remove area
from rangeland that overlaps with any crop sections from the Washington State
Department of Agriculture dataset; finally, the Use Split tool in ArcGIS is used
with a detailed county line shapefile to get rangeland estimates by county.
Timber: Timber acreages are from the Washington State Forest Biomass
Supply Assessment Database. This database provides estimates on timberland
acres by county in Washington state for impact estimates by invasive species.
Excluded are timberland polygons where centroids fall within crop sections and
crop group is not “Commercial Tree (4).”
Rivers and Lakes: Rivers and lakes in Washington are taken from the National
Hydrography Database maintained by the U.S. Geological Survey. This
database provides estimates on river and lake acres by county in Washington
state for impact estimates by aquatic invasive species. Rivers were buffered by
one acre on each side of center line in ArcGIS.
Dams: Dam data is taken from the Washington Department of Ecology. This
helps flag rivers and lakes by county in Washington state for the presence of
dams, for estimates of dam maintenance needed as a result of damage caused
by aquatic invasive species. Dams were spatially joined to rivers and lakes
within 500 feet of the dam.
Boat Launches: Data on boat launches are from the Washington State
Recreation and Conservation. This flags rivers and lakes by county in
Washington state for the presence of boat launches, for estimates of aquatic
invasive species spread by boats. Boat launches were spatially joined to rivers
and lakes within 500 feet of the boat launch.
Output Calculations by CommodityCrops: The annual output of crops in Washington are taken from the
National Agriculture Statistics Service for each commodity produced in
Washington in 2015.
Livestock: Livestock’s annual output is taken from the National
Agriculture Statistics Services for Cattle, including calves but excluding
inter-farm and inter-state sales. This value is discounted by the share of
cattle that are fed exclusively on feed lots, as compared to the total head
of cattle.
Timber: Output for the timber industry is represented as the gross
business revenue for North American Industry Classification System
code 113, which represents the forestry and logging industry. This data
is provided by the Washington Department of Revenue.
Hunting: Values for hunting are specifically focused on the cost for big
game and migratory bird licenses and represents the output of hunting.
Fishing: Fishing output is represented at a value of $100 per day per
stream across four days of fishing per week as per the “Economic Impact
from Selected Noxious Weeds in Oregon” report. For Washington, the
total output of fishing is estimated to be $27.4 million in 2015.
Dams: The output value of dams is represented as the additional cost
required for maintenance and repairs by invasive species. The cost for
cleaning dams with entangled vegetation is expected to be $3,000 per
dam facility as per the Colorado Department of Fish and Wildlife. The
cost of removing invasive mussels from dams is estimated to be $48,000
per dam annually as per “Economic Risk of Zebra and Quagga Mussels
in the Columbia River Basin.” From the “Potential Economic Impacts of
Zebra Mussels on the Hydropower Facilities in the Columbia River
Basin” report, the cost of installing a preventive system for zebra
mussels is estimated to be $1.8 million per dam.
Boating and Boat Launches: The output of recreational boating is
calculated by using the methodology outlined in Chang and Jackson
(2003) and the number of recreational boating days as outlined by the
Oregon State Marine Board (2009). The output methodology described
in Chang and Jackson (2003) is specifically applied to bays. This
methodology is slightly altered to provide an output value for streams by
looking at stream lengths instead of bay acreages.

Direct Impacts from Invasive Species
The direct impacts from invasive species are generally categorized by
their impacts to different commodities produced on select land types.
These land types are Cropland, Timberland and Rangeland, which in
turn correspond to the commodities that are produced on those lands
(crop commodities on Croplands, timber on Timberlands and livestock
and hunting on Rangelands). The degradation-per-acre for most
invasive plant species are from the “Economic Impact from Selected
Noxious Weeds in Oregon” report produced for the Oregon
Department of Agriculture by The Research Group, LLC.
Impacts of invasive animal species per acre vary by commodity
affected. In most cases, these per-acre impacts were found through
consultation with Washington State Department of Agriculture and
Washington State Department of Fish and Wildlife to arrive at a
percent rate of damage per acre. Exceptions include gypsy moth and
invasive mussels, which impact trees and dams respectively. Impacts
for these two species are derived from “Estimating the Benefits of
Gypsy Moth Control on Timberland” by Ganser and Herrick (1987) and
“Economic Risk of Zebra and Quagga Mussels in the Columbia River
Basin” produced by the Independent Economics Analysis Board (2013)
supplemented by “Expansion of Dreissena into Offshore Waters of
Lake Michigan and Potential Impacts on Fish Populations” by Bunnel
et al. (2009).
Using the per-acre output values calculated per commodity, the
individual invasive species impacts are applied to calculate the direct
economic loss per commodity per invasive species. These direct
economic losses are then summed across 52 macro economic sectors
that are used to calculate induced and indirect economic impacts.
Induced and Indirect Economic Impacts
The primary tools for estimating the broader impacts of invasive
species in Washington state are calculated from the Washington State
Input-Output (I-O) Model for year 2007, published in 2012, and
IMPLAN. The Washington State I-O Model provides a data-rich
rendering of the state economy across 52 sectors. The transactions
table, which underpins the I-O Model, provides estimates of
intermediate purchases, sales, and final demand across all modeled
sectors.
The complex analysis of the model, published online by the
Washington State Office of Financial Management, allows analysts to
model the impacts of economic activities when output, labor, wages,
and first-round direct purchases/requirements are known. In order to
apply the input-output model for multiple years of analysis, implicit
price deflators were used to adjust previous year totals to 2014 (the
most recent modeling year). Direct requirements for all affected
sectors were calculated based on shares of purchases for each sector
to each year of output, derived from the 2007 transactions table, as
well as IMPLAN social accounting matrices, and interviews.
The economic impacts of invasive species in Washington include
direct, indirect, and induced effects, the total impact being the sum of
these impacts. Analysis begins with a transactions table, constructed
from multiple data sources by Beyers and Lin. This table captures all
transactions between and within industries and final demand, the latter
including personal consumption expenditures (i.e., household
consumption), domestic and foreign exports, investment, and federal,
state, and local expenditures. Total output in an economy is thus the
sum of inter- and intra-industry purchases, also referred to as
intermediate transactions, and final demand. The input-output
transactions table is governed by an important accounting identity
requiring that all purchases in an economy must equal all output.
Within the transactions matrix, the sum of each column represents all
purchases by an industry or source of demand, and will equal the
amount sales and output by that activity.
For example, in the latest transactions table, the input-output sector
“Software Publishing and Internet Service Providers” in 2007
purchased nearly $5.3 billion in non-labor inputs from other industries
in Washington. Added to this, the sector paid $9.7 billion in wage and
salary outlays (including non-wage benefits), plus $8.3 billion in other
value added activities (e.g., profits, dividend payments) and $10.1
billion in imported (domestic and foreign) inputs; these amounts total
$33.4 billion, exactly equal to total sales, or output, by this industry in
Washington.

Induced and Indirect Economic Impacts (continued)
The columns of a transactions table thus represent production
functions for each modeled industry. Direct requirements coefficients,
also referred to as technical coefficients, are the share of total
purchases for each input. For example, in 2007, again return to the
Software Publishing and Internet Service Providers industries in
Washington, firms belonging to this grouping purchased $240.4 million
in goods and services from the industry category “Architectural and
Engineering /Computer Systems Design and Related Services,”
translating into a direct requirements coefficient of 0.0072, or 0.72% of
all purchases made by Software Publishing and Internet Service
Providers based in Washington State ($240.4 million / $33.4 billion).
Once a matrix of direct requirements is calculated, a series of
equations are used to relate changes in demand in one sector of the
economy to changes in gross output to across the entire economy.
Inter-industry transactions, denoted “O,” is equal to a vector X of gross
output per industry multiplied by the matrix of direct requirements,
denoted “A.”
(1) O = AX
The vector of gross output per industry, X, is the sum of inter-industry
output (transactions) and final demand. In the above example, $41.7
billion in total output in aerospace is equal to $842.8 million in inter-
industry sales plus $40.8 billion in final demand.
(2) X = O + D
Combining equations (1) and (2) results in industry gross output
equaling the sum of industry output multiplied by direct requirements
plus final demand:
(3) X = AX + D
Rearranging this equation:
(4) D = (1-A)X, and
(5) X = D(1-A)-1, the (1-A)-1 , which is also referred to as the “Leontief
Inverse”
Finally, input-output modeling is primarily used to assess economy-
wide changes given a change in one or more activities, resulting in
equation
(6)X = (1-A)-1D

Beyers, W, Lin, T. 2007. The 2007 Washington Input-Output Study. Olympia, WA: Washington Office of Financial Management. http://www.ofm.wa.gov/economy/io/2007/I-O_2007_report.pdf
Chang, W-H, Jackson, RS. (2003). Economic Impacts of Recreation Activities at Oregon Costal and River Ports. Washington D.C.: U.S. Army Corps of Engineers.
Gansner, DA, Herrick, OW. 1987. Estimating the benefits of gypsy moth control on timberland. US Dept. Agric. For. Serv. Res. Note. NE-337. https://www.fs.fed.us/ne/newtown_square/publications/research_notes/pdfs/scanned/OCR/ne_rn337.pdf
Oregon State Marine Board. 2009. Boating in Oregon, Triennial Survey Results - 2008. https://data.oregon.gov/Recreation/Waterbodies-In-Rank-Order/rqyv-cfng
Ruyle, G , Ogden, P. 1993. What is an A.U.M.? In: Arizona Ranchers’ Management Guide. Gum, R, Ruyle, G, and R Rice, eds. Tucson, AZ: Arizona Cooperative Extension. pp. 1-4.
Systma, M, Rouhe, A. (2007). Feral Swine Action Plan for Oregon. Portland, Oregon: Portland State University. http://pdxscholar.library.pdx.edu/cgi/viewcontent.cgi?article=1013&context=centerforlakes_pub
The Research Group, LLC. 2014. Economic Impact From Selected Noxious Weeds in Oregon. Prepared for Oregon Department of Agriculture Noxious Weed Control Program. https://www.oregon.gov/ODA/shared/Documents/Publications/Weeds/ORNoxiousWeedEconomicImpact.pdf
United States Department of Agriculture. (2015). 2015 State Agriculture Overview, Washington. Retrieved from https://www.nass.usda.gov/Quick_Stats/Ag_Overview/stateOverview.php?state=WASHINGTON
United States Department of Agriculture. (2014). National Agricultural Statistics Service. Retrieved from https://quickstats.nass.usda.gov/.
Washington Department of Agriculture. 2015 Agriculture Land Use Data Layer. 2016. Published agriculture-specific datalayer [Online]. Available at https://www.arcgis.com/home/webmap/viewer.html?webmap=f6b595bf3a5f438e93bf678d2389b4ea (accessed [4/25/2016]; verified [4/25/2016]). WSDA, Olympia, WA.
Washington Department of Fish and Wildlife. 2015 SalmonScape. 2016. Published river-specific datalayer [Online]. Available at http://apps.wdfw.wa.gov/salmonscape/map.html (accessed [4/25/2016]; verified [4/25/2014]). WDFW, Olympia, WA.
Washington Department of Fish and Wildlife. (2016). Game Harvest Reports. Retrieved from http://wdfw.wa.gov/hunting/harvest/2015/reports/deer_sp_gmu_all.php

Summaries of Individual
Invasive Species

Rubus armeniacus
Himalayan blackberry is a perennial shrub that produces long
sprawling stems called canes that are covered with sharp, hooked
spines and may reach a length of 40 feet. Himalayan blackberry has
five-petaled white or pink flowers, which form aggregate fruits. The
compound leaves have serrated edges and are alternately arranged.
Root crowns of this Class C noxious weed can grow up to 8 inches in
diameter and roots can reach 5 feet into the soil. Blackberry shrubs
can grow up to 12 feet tall.
Description of Species
Impacts Considered
Cattle and livestock: Outcompetes native pasture plants and impacts
quality of grazing lands.
Timber: Prevents growth of shade intolerant trees such as Douglas fir
and ponderosa pine.
Croplands: Can infest croplands and requires control.
Distribution in Washington
Himalayan blackberry is found in 26 counties, with significant
concentrations found in 19 counties in the western part of the state. It
is less widespread but still problematic in parts of eastern Washington.
Source: Washington State Noxious Weed Control Board
Other Considerations
Recreation: Himalayan blackberry produces dense thickets that
restrict access to or limit the use of public lands and increase park
management costs.
Cost of control: Birds and animals consume fruit and carry seed over
a wide area. Any control program needs to be long term.
Host for berry pest: Himalayan blackberry is a host species to the
spotted-wing fruit fly, Drosophila suzukii, a serious insect pest of berry
and tree fruit crops in the Pacific Northwest.
Reference: http://www.nwcb.wa.gov/weeds/himalayan-blackberry and links therein.
Rubus armeniacus
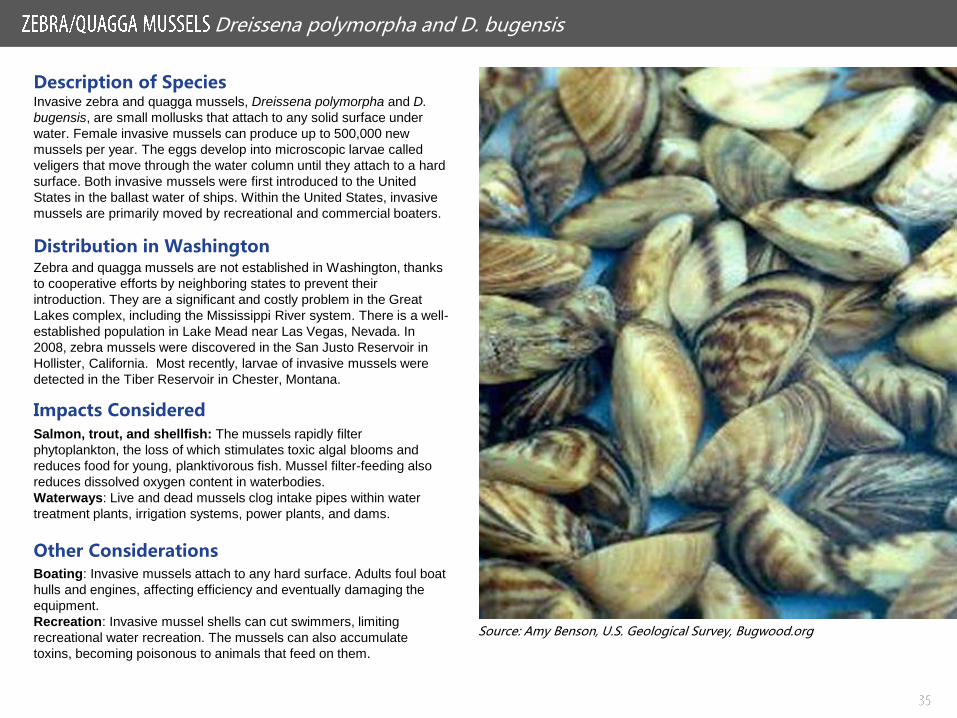
Direct Economic Impact of Species
Sources: The Research Group, 2014; WSDA,
2015; USDA, 2015; WDFW, 2015; University of
Washington, 2015; Ruyle and Ogden, 1993;
Chang and Jackson, 2003; Oregon State
Marine Board, 2009; OFM, 2016; Community
Attributes Inc., 2016
If Himalayan blackberry spread an additional 12% in the 19 counties
with significant infestations in Washington, it would translate to
approximately 17,000 invaded acres of croplands, 284,000 acres of
rangeland and wildland, 2.1 million acres of timberlands, and 1,605
miles of rivers and streams. Timber is the commodity affected the most
by Himalayan blackberry, with a direct economic impact of almost $14
million worth of timberland. Impacts to timber account for 68% of the
total estimated direct impacts from Himalayan blackberry.
Two of the counties most affected by Himalayan blackberry are Lewis
County and Grays Harbor County, which have estimated direct
impacts of $2.4 million and $2.1 million respectively.
Total Economic Activity at Risk
Output $48,786,000
Jobs 230
Labor Income $12,773,000
Total Himalayan Blackberry Impacts
Looking at the broader Washington economy, Himalayan blackberry
infestation could have a cumulative output impact of $48.7 million. This
loss of output translates into a loss of 230 jobs in Washington and $12.7
million in lost labor income.
Direct Impacts to Crops $1,369,500
Blueberry $323,000
Strawberry $54,000
Other Berries $2,500
Hay $990,000
Direct Impacts to Livestock $4,025,000
Direct Impacts to Timber $13,903,000
Recreation in Wildlands $1,135,000
Direct Impacts to Hunting $247,000
Direct Impacts to Fishing $888,000
Total $20,432,500
Himalayan Blackberry Direct Impacts

Centaurea solstitialis
Impacts ConsideredCattle, horses, and livestock: Yellow starthistle rapidly outcompetes
desirable forage species in pastures, rangeland, and meadows.
Horses consuming too much yellow starthistle, whether fresh or dried
in hay, over 1 to 2 months may develop “chewing disease,” a fatal
neurological disease with no cure. Cattle can consume the basal
rosettes but the spines of the flowering plants can cause injury.
Wheat: Can infest wheat crops in areas where there is high
competition for nutrients needed for new seed.
Other Considerations
Hunting: Hunters and their dogs can be injured by the sharp spines,
and they may also help disperse the seeds into new areas. Infested
hunting grounds should be avoided by hunters, hikers, and campers.
Environment: Yellow starthistle is a superior competitor for water than
many native plants in arid regions.
Reference: http://www.nwcb.wa.gov/weeds/yellow-starthistle and links therein.
Distribution in WashingtonYellow starthistle occurs primarily in eastern Washington and is most
abundant in the southeast part of the state. Twenty-one counties
currently have some amount of yellow starthistle, 11 of which have a
significant number of infested acres. Both King and Thurston Counties
had introductions of yellow starthistle, which were eradicated.
Description of SpeciesYellow starthistle is an annual or biennial Class B noxious weed with
long, winged stems covered in white wooly hairs, deeply lobed leaves,
and yellow flowerheads. Bracts at the base of the flowerhead are
covered with spines up to 1 inch long. It typically grows 2 to 3 feet tall
when adequate moisture is present but can bloom when only 2 to 3
inches tall under extreme drought conditions. Most seeds have fine
bristles that allow them to be wind-dispersed.
Source: Marty Hudson, Klickitat County Noxious Weed Control Board

Centaurea solstitialis
Direct Economic Impact of SpeciesIf yellow starthistle were to spread into an additional 12% of
susceptible land types in the 11 counties with significant infestations, it
would be equivalent to 320,000 acres of rangeland and wildland, along
with an additional 596 miles of rivers and streams. The largest impact
caused by yellow starthistle is to livestock, which accounts for more
than $21.1 million in direct impacts.
Yakima County is affected the most by yellow starthistle, with a total of
$8.5 million in potential economic loss. Yakima accounts for 38% of all
the direct impacts associated with yellow starthistle in Washington.
Other counties with significant economic impacts associated with
yellow starthistle include Klickitat County and Ferry County.
Total Economic Activity at Risk
Direct Impacts to Livestock $21,162,000
Recreation in Wildlands $1,215,000
Direct Impacts to Hunting $556,000
Direct Impacts to Fishing $659,000
Total $22,377,000
Yellow Starthistle Direct Impacts
Projecting the impact of yellow starthistle across the wider Washington
economy indicates that the total value of economic output at risk is
approximately $54.3 million. This output loss is associated with a loss of
290 jobs and $14.8 million in wage income.
Output $54,326,000
Jobs 290
Labor Income $14,893,000
Total Yellow Starthistle Impacts
Sources: The Research Group, 2014; WSDA,
2015; USDA, 2015; WDFW, 2015; University of
Washington, 2015; Ruyle and Ogden, 1993; Chang
and Jackson, 2003; Oregon State Marine Board,
2009; OFM, 2016; Community Attributes Inc., 2016

Centaurea diffusa
Impacts Considered
Cattle and livestock: Diffuse knapweed outcompetes desirable
forage species in pastures, rangeland, and meadows.
Other Considerations
Wildfire hazard: Plants produce a high amount of dry biomass, which
is flammable.
Increases soil erosion: Dense infestations of diffuse knapweed can
lead to soil erosion.
Reference: http://www.nwcb.wa.gov/weeds/diffuse-knapweed and links therein.
Distribution in WashingtonDiffuse knapweed is found in 36 of the 39 counties of Washington, with
only Jefferson, Pacific and Wahkiakum Counties having no known
infestations at this time. It is most abundant in eastern Washington,
and 25 counties are considered to be heavily infested with diffuse
knapweed.
Description of SpeciesDiffuse knapweed is a biennial weed that forms basal rosettes in its
first year of growth and then bolts and flowers from midsummer
through fall. This Class B noxious weed is a single-stemmed plant with
numerous branches, and it can grow to 3 feet tall. Flowerheads are
slender and generally white, and bracts are lined with a distinctive
fringe of fine spines. Diffuse knapweed reproduces primarily by seeds,
which are dispersed by the tumbling of windblown mature plants and
when they stick to the fur of animals. Moving water is also a major
dispersal agent that helps spread this species over a wide area.
Source: Sue Winterowd, Stevens County Noxious Weed Control Board

Direct Economic Impact of Species
Centaurea diffusa
Total Economic Activity at RiskDiffuse knapweed is a widespread noxious weed in Washington, with
significant infestations found in 25 of the 39 counties. However, diffuse
knapweed populations are often found in wastelands, roadsides, and
lower-quality rangeland. Furthermore, diffuse knapweed is under an
effective biocontrol program that helps curtail the plant’s spread on
valuable land. Based on these factors, the potential impact of diffuse
knapweed was estimated as if it spread into just an additional 1% of
the productive land types in those 25 counties. This is equivalent to
approximately 70,000 acres of rangeland and wildland along with a
further 210,000 of timberland.
Okanogan and Yakima are the two counties with the largest estimated
impact from diffuse knapweed. Okanogan County is estimated to have
a loss of $791,000 directly attributable to diffuse knapweed while
Yakima County is estimated to experience $644,000 in direct costs.
It is important to point out that if diffuse knapweed has a greater
spread rate than 1%, the potential costs grow rapidly. For example, if
the spread rate increases to 5%, the total direct economic impacts
associated grow to $23.9 million.
Direct Impacts to Livestock $3,345,000
Direct Impacts to Timber $1,373,000
Direct Impacts to Hunting $61,000
Total $4,779,000
Diffuse Knapweed Direct Impacts
At a 1% infestation rate, diffuse knapweed is expected to have a total
impact of $11.5 million throughout the Washington economy. This loss of
output is also associated with a loss of 60 jobs and a further loss of
approximately $3 million in labor income.
Output $11,539,000
Jobs 60
Labor Income $3,097,000
Total Diffuse Knapweed Impacts
Sources: The Research Group, 2014; WSDA, 2015;
USDA, 2015; WDFW, 2015; University of
Washington, 2015; Ruyle and Ogden, 1993; Chang
and Jackson, 2003; Oregon State Marine Board,
2009; OFM, 2016; Community Attributes Inc., 2016

Centaurea x moncktonii
Impacts ConsideredCattle and livestock: Meadow knapweed outcompetes desirable
forage species in pastures, rangeland, and meadows.
Timber: Infestations can be found on tree farms with moist soils.
Other Considerations
Distribution in WashingtonMeadow knapweed is found across 25 counties in Washington, with
eight counties considered to have significant infestations. Many of the
25 counties are found in western and central Washington.
Description of SpeciesMeadow knapweed is a hybrid between black and brown knapweed
and may be difficult to distinguish from its parent species. The Class B
noxious weed is a perennial, has a woody root, and can grow from 1 to
5 feet tall. Leaves are entire and up to 6 inches long. Stems are multi-
branched. Flowerheads are solitary, about an inch in diameter, ranging
from pink to a reddish-purple hue, and are typically oval or globe-
shaped.
Source: Washington State Noxious Weed Control Board
Cost of control: Meadow knapweed can be controlled using
Integrated Pest Management methods including selective herbicides,
mechanical, cultural, and biocontrol agents, but it requires a long-term
management plan.
Reference: http://www.nwcb.wa.gov/weeds/meadow-knapweed and links therein.

Centaurea x moncktonii
Direct Economic Impact of SpeciesSignificant meadow knapweed infestations are found in eight counties
in Washington and if the species were to spread an additional 12% into
productive land in those counties, an estimated 209,000 acres of
rangeland and wildland along with a further 662,000 acres of
timberland would be directly affected.
Kittitas, Klickitat and Skamania are the three counties most likely to be
affected by meadow knapweed. Kittitas County alone has an estimated
direct loss of $4.7 million, which is just over one-third of all the direct
costs associated with meadow knapweed. Meadow knapweed in
Klickitat and Skamania Counties is estimated to have an impact of
$2.7 million and $2.5 million, respectively.
Direct Impacts to Livestock $9,860,000
Direct Impacts to Timber $4,319,000
Direct Impacts to Hunting $181,000
Total $14,360,000
Meadow Knapweed Direct Impacts
Total Economic Activity at Risk
Ouput $34,656,000
Jobs 180
Labor Income $9,290,000
Total Meadow Knapweed Impacts
Looking beyond meadow knapweed’s direct impact and studying its
impact throughout the Washington economy reveals that total impacts to
economic output could amount to $34.6 million. Approximately 180 jobs
would be at risk in Washington along with a further $9.2 million in lost
labor income.
Sources: The Research Group, 2014; WSDA,
2015; USDA, 2015; WDFW, 2015; University of
Washington, 2015; Ruyle and Ogden, 1993;
Chang and Jackson, 2003; Oregon State Marine
Board, 2009; OFM, 2016; Community Attributes
Inc., 2016

Centaurea stoebe
Impacts ConsideredCattle and livestock: Spotted knapweed invades rangeland and is
unpalatable to livestock. The plant releases chemicals from its roots
that inhibit germination and slow the growth of native plants.
Other ConsiderationsCost of control: Once spotted knapweed is well-established, control
and restoration of rangeland may be more expensive than the potential
production of the land.
Recreation: Spotted knapweed can cause long-lasting damage to
native habitat. It is unpalatable to deer and elk, and can significantly
reduce available forage.
Reference: http://www.nwcb.wa.gov/weeds/spotted-knapweed and links therein.
Distribution in WashingtonSpotted knapweed is widespread in Washington with infestations
found in 37 of the 39 counties. Only Pacific and Wahkiakum Counties
do not have any known infestations of spotted knapweed at this time.
Description of SpeciesSpotted knapweed is a multi-stemmed perennial plant that can grow
up to 5 feet tall. Its leaves are typically lobed on the lower part of the
plant, unlobed toward the top of the plant, and have a greyish hue.
This Class B noxious weed begins to flower in July continuing through
the fall with purple, pink, or cream colored flowers. The bracts of the
flower heads are typically tipped black, giving this species its common
name. Spotted knapweed seed production is prolific, and the seeds are
dispersed by wind, animals, and people. It produces a deep taproot,
which draws moisture from deeper soils, allowing the plant to keep
growing through the summer months. This deep taproot also makes
removal of the weed extremely difficult.
Source: Washington State Noxious Weed Control Board

Centaurea stoebe
Direct Economic Impact of SpeciesCurrent estimates of additional valuable land that could be impacted by
spotted knapweed expansion total more than 2.6 million acres, if it
were to spread into 12% of productive land. Approximately 588,000 of
the affected acres are found in rangeland and wildland, with more than
2 million acres in timber. Despite the disparity in affected acres, the
majority of estimated impacts from spotted knapweed come from the
effects on livestock on rangeland, which accounts for more than two-
thirds of all direct impacts associated with spotted knapweed.
Throughout the state, 15 counties have sizable spotted knapweed
infestations. Of those counties, Okanogan County has the potential to
be impacted the most from spotted knapweed, with a direct loss from
spotted knapweed estimated to be $11.8 million. This figure accounts
for more than 28.4% of the total direct loss in Washington.
Direct Impacts to Livestock $27,795,000
Direct Impacts to Timber $13,447,000
Direct Impacts to Hunting $511,000
Total $41,753,000
Spotted Knapweed Direct Impacts
Total Economic Activity at RiskThe risk spotted knapweed poses to the wider Washington economy is
significant. With a 12% rate of spread, total economic output losses
amount to more than $100 million. An additional 510 jobs are estimated to
be lost, along with an associated $26.9 million in lost labor income.
Ouput $100,713,000
Jobs 510
Labor Income $26,944,000
Total Spotted Knapweed Impacts
Sources: The Research Group, 2014; WSDA,
2015; USDA, 2015; WDFW, 2015; University of
Washington, 2015; Ruyle and Ogden, 1993;
Chang and Jackson, 2003; Oregon State Marine
Board, 2009; OFM, 2016; Community Attributes
Inc., 2016

Euphorbia esula
Impacts ConsideredCattle and livestock: Leafy spurge depletes soil of moisture and
nutrients; rangeland invaded by leafy spurge does not readily convert
back to productive grass and wildflower communities, even over long
timespans. It is toxic to cattle and horses.
Other ConsiderationsToxicity to humans: Leafy spurge contains a white latex sap that
causes skin irritations and may cause permanent blindness if rubbed
into the eye.
Reference: http://www.nwcb.wa.gov/weeds/leafy-spurge and links therein.
Distribution in WashingtonLeafy spurge is found in limited distribution in several counties,
primarily in eastern Washington, and it is most abundant in Lincoln
County. It has been detected and eradicated in a few counties in
western Washington.
Description of SpeciesLeafy spurge is an aggressive Class B noxious weed that typically
reaches 2 to 3 feet tall. The perennial plants have tough stems that
contain a white latex sap that is poisonous when consumed and can
cause skin irritation. The leaves are alternate, narrow, and are slightly
wavy along the margins. Flowers are small and are borne in greenish-
yellow clusters above yellow petal-like bracts. Leafy spurge’s woody
root system can extend down 20 feet below the soil surface. Seed
capsules rupture, ejecting the seeds up to 10 feet from the parent
plant.
Source: Washington State Noxious Weed Control Board

Euphorbia esula
Direct Economic Impact of SpeciesLeafy spurge is estimated to have a potential rate of spread of 12%
across 10 counties in Washington. This correlates to 279,000
additional acres of rangeland and wildland throughout Washington. Of
the 10 counties studied to have direct impacts from leafy spurge,
Okanogan County was estimated to experience $13.2 million in direct
costs from leafy spurge. This is equivalent to just under half of all
estimated direct impacts.
Leafy spurge not only displaces native vegetation on rangeland but it
is also toxic for livestock. As such, a portion of the losses accrued from
livestock are from fatalities.
Total Economic Activity at RiskThe total output at risk to leafy spurge infestation is estimated to be more
than $65.3 million. A further 350 jobs are estimated to be at risk coupled
with a loss of more than $18 million in wages.
Direct Impacts to Livestock $26,405,000
Direct Impacts to Hunting $485,000
Total $26,890,000
Leafy Spurge Direct Impacts
Output $65,326,000
Jobs 350
Labor Income $18,011,000
Total Leafy Spurge Impacts
Sources: The Research Group, 2014 4; WSDA,
2015; USDA, 2015; WDFW, 2015; University of
Washington, 2015; Ruyle and Ogden, 1993;
Chang and Jackson, 2003; Oregon State Marine
Board, 2009; OFM, 2016; Community Attributes
Inc., 2016

Cytisus scoparius
Impacts ConsideredCattle and livestock: Scotch broom creates dense stands that
displace desirable, forage species. It is toxic to livestock.
Timber: Dense stands prevent forest regeneration after clearing.
Field crops: Outcompetes crops for nutrients and water.
Elk: Scotch broom is toxic to elk and reportedly may have once
poisoned elk on the Olympic Peninsula. Encroaching Scotch broom
reduces forage for elk, potentially reducing hunting opportunities.
Other Considerations
Distribution in WashingtonScotch broom is found in 32 Washington counties, but it is most
widespread in the western part of the state and is spreading into areas
just east of the Cascade Mountains.
Description of SpeciesScotch broom is a perennial evergreen shrub with numerous dark
green angled branches with small, simple or three-parted deciduous
leaves. The Class B noxious weed grows up to 8 to 10 feet tall and is
in bloom from April to June with numerous bright yellow, pea-shaped
flowers. As its seeds mature inside black, ripened pods, they are
ejected and thrown several feet away from the parent plant to start new
plants. Scotch broom roots have nitrogen-fixing bacteria in nodules
that help it thrive in nutrient-poor soils.
Source: Washington State Noxious Weed Control Board
Reference: http://www.nwcb.wa.gov/weeds/scotch-broom and links therein.
Costs of control: Scotch broom shrubs can produce an average of
almost 10,000 seeds per year, which can remain viable in the soil for
more than 30 years. This means that any control measures must be
extremely long term.
Recreation: Scotch broom can grow in a variety of areas including
natural areas, parkland and even dunes. These all increase the cost of
parkland management significantly.
Fire hazard: Stands of Scotch broom provide dry biomass that is
flammable and can elevate fires to tree canopies.
Environment: Scotch broom can alter soil chemistry and composition,
making native plant restoration difficult.
Ecosystems: Scotch broom threatens rare or vulnerable ecosystems
such as prairies and Garry oak.

Cytisus scoparius
Direct Economic Impact of SpeciesScotch broom is more abundant in western Washington and extremely
difficult to eliminate due to its size, dense stands, and because seed
can remain viable for at least 30 years. More than half the counties in
Washington are considered to have a significant presence of Scotch
broom. Because it is already so pervasive, the risk of increased spread
is considered to be extremely high and scotch broom could invade
35% of productive lands in afflicted counties if landowners stopped
controlling it.
More than 1.8 million acres of rangeland and wildland are estimated to
be at risk for Scotch broom infestation. A further 6.5 million of
timberland is also considered to be at risk of Scotch broom infestation.
Kittitas, Lewis and Grays Harbor Counties are the three counties
estimated to experience the largest share of impacts from Scotch
broom. Kittitas County is estimated to experience roughly $6.5 million
in direct losses from Scotch broom. Lewis County and Grays Harbor
County are estimated to have $6.2 million and $5.9 million in direct
losses from Scotch broom, respectively. Scotch broom impacts
average around $2.9 million per infested county.
Direct Impacts to Livestock $15,859,000
Direct Impacts to Timber $42,907,000
Direct Impacts to Hunting $971,000
Total $59,737,000
Scotch Broom Direct Impacts
Total Economic Activity at RiskGiven Scotch broom’s pervasiveness and high average direct impact per
county, the wider impacts throughout the Washington economy are
similarly significant. An estimated $142.8 million in business activity is
expected to be at risk across the Washington economy. This lost business
activity is associated with a loss of 660 jobs and more than $36 million in
lost wages.
Ouput $142,771,000
Jobs 660
Labor Income $36,753,000
Total Scotch Broom Impacts
Sources: The Research Group, 2014; WSDA,
2015; USDA, 2015; WDFW, 2015; University
of Washington, 2015; Ruyle and Ogden,
1993; Chang and Jackson, 2003; Oregon
State Marine Board, 2009; OFM, 2016;
Community Attributes Inc., 2016

Chondrilla juncea
Impacts ConsideredCattle and livestock: Rush skeletonweed outcompetes desirable
forage species, thereby reducing grazing opportunities for livestock
and wildlife.
Potatoes, wheat and small grains: Extensive root systems
outcompete crops for nutrients and water.
Other ConsiderationsDamage to machinery: Rush skeletonweed produces a thick latex
sap that can gum up crop harvesting machinery.
Reference: http://www.nwcb.wa.gov/weeds/rush-skeletonweed and links therein.
Distribution in WashingtonRush skeletonweed is found in 28 counties and is most abundant in
eastern Washington. Counties with more than 1,000 estimated acres
of rush skeletonweed infestations include Adams, Columbia, Franklin,
Klickitat, Spokane and Stevens.
Description of SpeciesRush skeletonweed has a few sparse leaves and wiry dark-green
stems giving it a skeletal appearance. The Class B noxious weed is a
perennial species with a taproot that can grow 7 feet deep to reach
water. It has small yellow flowers that bloom from July to September.
Each plant can produce up to 20,000 small, wind-dispersed seeds.
Rush skeletonweed seeds are also spread through contaminated
grains. Furthermore, cultivation of croplands infested with rush
skeletonweed facilitates expansion of this noxious weed as machinery
breaks up and then spreads propagating root fragments throughout
fields.
Source: Washington State Noxious Weed Control Board

Direct Impacts to Crops $55,396,000
Wheat $16,707,000
Potato $20,626,000
Legumes $7,319,000
Hay $10,744,000
Direct Impacts to Livestock $6,190,000
Direct Impacts to Hunting $228,000
Total $61,814,000
Rush Skeletonweed Direct Impacts
Chondrilla juncea
Direct Economic Impact of SpeciesRush skeletonweed is estimated to have significant populations in 13
counties in Washington. If rush skeletonweed is not controlled and
spreads into 12% of productive land in those counties, then roughly
321,000 acres of cropland are considered to be directly at risk of rush
skeletonweed infestation, of which 244,000 acres are wheat producing.
Wheat and potato acreages account for more than 81% of the possible
crop acres that see a direct impact. An additional 262,000 acres of
rangeland and wildland are also projected to be directly affected by
rush skeletonweed.
The county estimated to have the largest direct economic impact from
rush skeletonweed is Grant County, with more than $12.7 million at
risk. Other counties at risk from rush skeletonweed include Whitman
County ($9.3 million) and Franklin County ($7.7 million).
Total Economic Activity at RiskRush skeletonweed is primarily a threat to crops, specifically wheat,
potatoes, and hay. Washington is a major producer of all three
commodities; the wider impacts of rush skeletonweed could therefore be
significant to Washington’s economy.
Approximately $149 million in economic output in Washington is estimated
to be at risk due to the spread of rush skeletonweed infestations. This
translates into a loss of 1,080 jobs across Washington and an additional
$46.9 million in labor income.
Output $149,243,000
Jobs 1,080
Labor Income $46,984,000
Total Rush Skeletonweed Impacts
Sources: The Research Group, 2014; WSDA,
2015; USDA, 2015; WDFW, 2015; University of
Washington, 2015; Ruyle and Ogden, 1993;
Chang and Jackson, 2003; Oregon State Marine
Board, 2009; OFM, 2016; Community Attributes
Inc., 2016

Lythrum salicaria
Impacts ConsideredRecreational Fishing: Purple loosestrife displaces native plant
species in riparian habitats. Once it forms dense stands, it restricts
access to rivers.
Shellfish/Wetlands: Native plant species are displaced; wetland
animals cannot use it for nesting or food; can lead to soil erosion and
damage to floodplain habitat needed for shellfish production.
Other ConsiderationsWetlands: Purple loosestrife is very invasive in wetland areas, where
it displaces native wetland plants, significantly reducing food and
nesting habitat for waterfowl and other animals. It can also alter the
aquatic food web.
Irrigation Systems: Can restrict water flow in irrigation ditches.
Reference: http://www.nwcb.wa.gov/weeds/purple-loosestrife and links therein.
Distribution in WashingtonPurple loosestrife is found throughout Washington. Only Columbia,
Garfield and Lincoln Counties have no known infestations of purple
loosestrife at this time. Franklin, Grant and Grays Harbor are the three
counties with the most significant acreages of purple loosestrife.
Description of SpeciesPurple loosestrife is an herbaceous perennial Class B noxious weed
commonly found in wetlands and riparian habitats. Plants can grow up
to 10 feet tall, and stems are typically square-sided with four or six
angles with lance-shaped, opposite leaves. Purple or magenta flowers
typically have five to six petals and are arranged in dense spikes.
Purple loosestrife seeds are very small and the species is a prodigious
seed producer, with some large plants producing more than 1 million
seeds.
Source: Jennifer Andreas, Washington State University- Invasive Weed Management Project

Lythrum salicaria
Direct Economic Impact of SpeciesPurple loosestrife impacts are centered primarily around recreational activities such as impacts to hunting waterfowl, fishing and recreational boating. The weed is found in significant amounts in 20 counties across Washington and risks affecting more than 1,600 miles of rivers and streams along with 38,000 acres of boat-able lakes and rivers.
Purple loosestrife is estimated to potentially impact an additional 12% of riparian habitats if it is not controlled, with Grant and Chelan Counties expected have the largest share of impacts with $932,000 and $726,000 respectively. The average direct loss per county due to purple loosestrife is an estimated $308,000. These economic impacts do not reflect the degradation of valuable wetland habitat and function.
Recreation in Wildlands $6,156,000
Direct Impacts to Hunting $511,000
Direct Impacts to Fishing $1,872,000
Direct Impacts to Boating $3,773,000
Total $6,156,000
Purple Loosestrife Direct Impacts
Output $20,817,000
Jobs 150
Labor Income $6,693,000
Total Purple Loosestrife Impacts
Total Economic Activity at RiskPurple loosestrife effects on recreation industry suggests that more than $20.8 million in economic output is at risk across the Washington economy. Furthermore, 150 jobs in Washington would be at risk along with $6.6 million in lost labor income.
Sources: The Research Group, 2014; WSDA, 2015; USDA, 2015; WDFW, 2015; University of Washington, 2015; Ruyle and Ogden, 1993; Chang and Jackson, 2003; Oregon State Marine Board, 2009; OFM, 2016; Community Attributes Inc., 2016

Spartina alterniflora
Impacts Considered
Mollusks, crustaceans, wild and farmed fish: Smooth cordgrass
transforms intertidal mudflats into steep and deep tidal channels,
increasing waves, all of which restrict commercial and natural
fisheries.
Salmon: Prevents mixing of freshwater and salt water in estuaries that
can harm salmon populations.
Wetlands: Increases flooding potential by creating dense intertidal
meadows.
Other ConsiderationsRecreation: Smooth cordgrass can clog popular waterways and
prevent recreational boating.
Reference: http://www.nwcb.wa.gov/weeds/smooth-cordgrass and links therein.
Distribution in WashingtonSmooth cordgrass has been found throughout the Puget Sound, Neah
Bay, Grays Harbor and Willapa Bay. Small populations have also been
found near the mouth of the Columbia River. At its peak in 2003,
smooth cordgrass colonized upwards of 9,000 solid acres in
Washington but well-funded and coordinated eradication efforts have
since reduced it to a projected 6 solid acres in 2016
.
Description of SpeciesSmooth cordgrass is a hardy estuarine grass with densely-arranged
stems that grow to form a thick mat of roots. The grass has fine leaves
with distinctive lime-green coloring. Smooth cordgrass is a perennial
plant and a prolific seed producer. The species propagates through its
dense root system and can further infest areas via vegetative
fragments and rhizomatous clones. This particular Spartina species is
found in intertidal salt marshes.
Source: Chad Phillips, Washington State Department of Agriculture

Direct Economic Impact of SpeciesSmooth cordgrass control has been one of the top priorities of the
Washington State Department of Agriculture, which has taken the lead
in coordinating eradication efforts between private, federal, state,
county, and tribal landowners. Smooth cordgrass has the potential to
cripple the shellfish/aquaculture industry in Washington without
proactive control of smooth cordgrass populations. Smooth cordgrass
stands also limits nesting habitat for migratory waterfowl.
Smooth cordgrass could potentially reestablish itself in six counties in
Washington at a growth rate of 20%, this is equivalent to
approximately 37,000 acres of shellfish production. Of the six affected
counties, Pacific County and Grays Harbor County are estimated to
have the largest impacts from smooth cordgrass. Pacific County is
estimated to have $6.7 million in direct economic losses, while Grays
Harbor County is estimated to have a similar $6.3 million in direct
economic loss.
Spartina alterniflora
Total Economic Activity at RiskThe majority of direct impacts caused by smooth cordgrass are from
losses incurred by the shellfish industry, which requires a significant
amount of inputs from other industries across Washington. Studying the
expanded impact of smooth cordgrass reveals that total economic output
at risk is more than $48.6 million along with 360 jobs. An estimated $15.5
million in labor income would be lost if smooth cordgrass was able to
significantly reestablish itself in Washington.
Direct Impacts to Shellfish $20,258,000
Direct Impacts to Hunting $224,000
Total $20,482,000
Smooth Cordgrass Direct Impacts
Output $48,866,000
Jobs 360
Labor Income $15,589,000
Total Smooth Cordgrass Impacts
Sources: The Research Group, 2014; WSDA,
2015; USDA, 2015; WDFW, 2015; University
of Washington, 2015; Ruyle and Ogden, 1993;
Chang and Jackson, 2003; Oregon State
Marine Board, 2009; OFM, 2016; Community
Attributes Inc., 2016

Polygonum sachalinense, P. polystachyum, P.cuspidatum, Polygonum x bohemicum
Impacts ConsideredEnvironment: Invasive knotweeds can significantly alter riparian
habitats, food webs, and native plant communities.
Rivers and Streams: Invasive knotweeds can rapidly dominate river
embankments and cause severe soil erosion, impacting water quality
and salmon habitat.
Other ConsiderationsWildfire: Dry knotweed biomass can be a fire hazard.
Infrastructure: Knotweed rhizomes can damage septic systems and
infrastructure such as roads and pipes.
References: http://www.nwcb.wa.gov/weeds/giant-knotweed,
http://www.nwcb.wa.gov/weeds/himalayan-knotweed,
http://www.nwcb.wa.gov/weeds/japanese-knotweed,
http://www.nwcb.wa.gov/weeds/bohemian-knotweed and links therein.
Distribution in WashingtonInvasive knotweed species and hybrids are found throughout
Washington’s riparian habitats. Only Adams County does not appear
to have any sizable population of knotweed at this time.
Description of SpeciesThe invasive knotweeds consist of giant, Polygonum sachalinense;
Himalayan, Polygonum polystachyum; Japanese, Polygonum
cuspidatum; and the hybrid Bohemian knotweed, Polygonum x
bohemicum. These Class B noxious weeds all have bamboo-like,
hollow green or red stems with swollen nodes and alternate, entire
leaves. The invasive knotweeds have an extensive underground
rhizome system. They bloom late in the season and produce small,
creamy-white spikes of flowers from July to October. Knotweed plants
can grow more than 12 feet tall in a single growing season. These
knotweeds are considered some of the most invasive plants on Earth,
and they are extremely difficult to control.
Source: Laurel Baldwin, Whatcom County Noxious Weed Control Board

Direct Economic Impact of SpeciesInvasive knotweed has significant populations in 19 of Washington’s 39
counties. However, it is mostly confined to riparian habitats, so
economic impact estimates only reflect a 1% impact on rangeland,
wildlands, streams and rivers. This is roughly equivalent to 24,000
acres of rangeland and wildland and a further 227 miles of stream
banks and river banks. Impacts across counties are fairly similar, with
the average direct impact per county estimated at $48,000.
Despite the current modest impacts per county, any increase in the
rate of spread has a sizable effect on the direct impacts of invasive
knotweeds because of how widespread it is. For example, if the rate of
spread were estimated to be 5% of productive lands, total direct
impacts from invasive knotweed jump to more than $9.3 million.
Total Economic Activity at RiskLooking at the wider economic impacts of invasive knotweeds reveals that
at a 1% rate of infestation, total economic output at risk across
Washington is nearly $4.5 million. This represents 25 jobs at risk with an
associated $1.2 million in lost labor income.
Polygonum sachalinense, P. polystachyum, P.cuspidatum, Polygonum x bohemicum
Sources: The Research Group, 2014; WSDA,
2015; USDA, 2015; WDFW, 2015; University of
Washington, 2015; Ruyle and Ogden, 1993;
Chang and Jackson, 2003; Oregon State Marine
Board, 2009; OFM, 2016; Community Attributes
Inc., 2016
Direct Impacts to Livestock $1,565,000
Recreation in Wildlands $306,000
Direct Impacts to Hunting $41,000
Direct Impacts to Fishing $265,000
Total $1,871,000
Invasive Knotweed Direct Impacts
Output $4,532,000
Jobs 25
Labor Income $1,256,000
Total Invasive Knotweed Impacts

Eurasian watermilfoil is a perennial, submerged aquatic Class B
noxious weed that flourishes in nutrient-rich water bodies across a
wide range of temperatures, depths and turbidity. It has finely
dissected leaves occurring in whorls of four, with each leaf consisting
of at least 12 pairs of leaflets. Stems sometimes have a reddish hue.
This invasive plant forms dense, underwater stands and forms
canopies that crowd or shade out native submerged plants. Eurasian
watermilfoil can readily propagate via stem fragments and spread to
new water bodies by clinging to boats or gear.
Myriophyllum spicatum
Impacts ConsideredWaterways: Eurasian watermilfoil clogs public water treatment plants,
power plants and dams.
Recreation: Prevents recreational boating by impeding navigation in
bodies of water, getting tangled in propellers, restricting swimming
areas, and reducing habitat for fish.
Other ConsiderationsBoating: Thick canopies of Eurasian watermilfoil can damage boat
propellers and engines.
Reduction in housing prices: Lakeside homes with lakes infested
with Eurasian watermilfoil show a depreciation in property values.
Lake habitat: Displaces native submerged aquatic plants and reduces
quality of habitat.
Reference: http://www.nwcb.wa.gov/weeds/eurasian-watermilfoil and links therein.
Geography in Washington
Description of Species
Source: Julie Sanderson, Chelan County Noxious Weed Control Board
Eurasian watermilfoil populations are found in 34 of Washington's 39
counties. However, it has the potential to be found in lakes and rivers
throughout Washington.

Direct Economic Impact of SpeciesSignificant levels of Eurasian watermilfoil infestation are found in 23
counties across Washington. One scenario assumes Eurasian
watermilfoil affects roughly 12% of the lakes and rivers in those 23
counties – this is equivalent to roughly 49,000 acres of lakes and rivers
in Washington. A further 140 dams are estimated to be in contact with
Eurasian watermilfoil, which requires routine cleaning at a cost of
$3,000 per facility.
Direct Impacts to Boating $5,140,000
Direct Impacts to Dams $420,000
Total $5,560,000
Eurasian Watermilfoil Direct Impacts
Total Economic Activity at RiskProjecting the impact of Eurasian watermilfoil across the Washington
economy shows that an estimated $14.9 million in economic output could
be lost when 12% of affected counties’ waterways are at risk. This
represents a loss of 120 jobs and $4.8 million in lost wages.
Output $14,858,000
Jobs 120
Labor Income $4,895,000
Total Eurasian Watermilfoil Impacts
Myriophyllum spicatum
Sources: The Research Group, 2014; WSDA,
2015; USDA, 2015; WDFW, 2015; University of
Washington, 2015; CDFW, 2015; WSDE, 2016;
Ruyle and Ogden, 1993; Chang and Jackson,
2003; Oregon State Marine Board, 2009; OFM,
2016; Community Attributes Inc., 2016
Dreissena polymorpha and D. bugensis
Impacts ConsideredSalmon, trout, and shellfish: The mussels rapidly filter
phytoplankton, the loss of which stimulates toxic algal blooms and
reduces food for young, planktivorous fish. Mussel filter-feeding also
reduces dissolved oxygen content in waterbodies.
Waterways: Live and dead mussels clog intake pipes within water
treatment plants, irrigation systems, power plants, and dams.
Other ConsiderationsBoating: Invasive mussels attach to any hard surface. Adults foul boat
hulls and engines, affecting efficiency and eventually damaging the
equipment.
Recreation: Invasive mussel shells can cut swimmers, limiting
recreational water recreation. The mussels can also accumulate
toxins, becoming poisonous to animals that feed on them.
Distribution in WashingtonZebra and quagga mussels are not established in Washington, thanks
to cooperative efforts by neighboring states to prevent their
introduction. They are a significant and costly problem in the Great
Lakes complex, including the Mississippi River system. There is a well-
established population in Lake Mead near Las Vegas, Nevada. In
2008, zebra mussels were discovered in the San Justo Reservoir in
Hollister, California. Most recently, larvae of invasive mussels were
detected in the Tiber Reservoir in Chester, Montana.
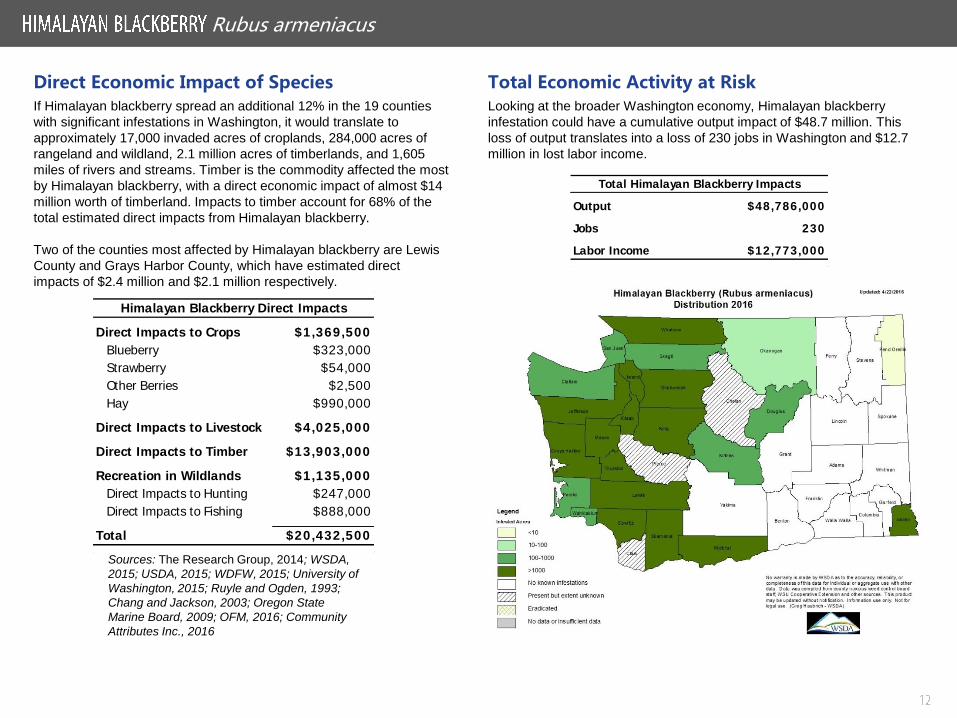
Description of SpeciesInvasive zebra and quagga mussels, Dreissena polymorpha and D.
bugensis, are small mollusks that attach to any solid surface under
water. Female invasive mussels can produce up to 500,000 new
mussels per year. The eggs develop into microscopic larvae called
veligers that move through the water column until they attach to a hard
surface. Both invasive mussels were first introduced to the United
States in the ballast water of ships. Within the United States, invasive
mussels are primarily moved by recreational and commercial boaters.
Source: Amy Benson, U.S. Geological Survey, Bugwood.org

Direct Economic Impact of SpeciesInvasive mussels require waterbodies containing calcium to build and
harden their shells. Twenty-four lakes and five major rivers have
calcium levels that could support the invasive mussels. In total, 23
dams and 227 public boat launches lie in bodies of water that could
support invasive mussels. Furthermore, approximately 1,061 miles of
rivers and streams are likely to be affected by invasive mussels.
The largest cost associated with invasive mussels is the installation of
mussel mitigation systems, costing $1.8 million per dam facility.
Furthermore, removal of invasive mussels costs an estimated $48,000
per facility. Removal of mussels from boat launches is estimated to
cost $750 per boat launch.
These direct impacts reflect the total costs if no measures were in
place to prevent the spread of invasive mussels. After the installation
of preventive systems, the only yearly impacts would be to boat
launches and recreational fishing.
Dreissena polymorpha and D. bugensis
Total Economic Activity at RiskInvasive mussels can quickly reproduce and infest entire waterbodies that
have calcium levels high enough to support shell development. As such,
the total potential impacts throughout the Washington State economy is
significant. Total impacts to economic output at risk is estimated to be
$100.1 million with an associated 500 jobs potentially lost and $27.8
million in labor income.
Sources: The Research Group, 2014; WSDA, 2015; USDA,
2015; WDFW, 2015; Rogers et al., 2015; IEAB, 2013;
WSDE, 2016; WSRCO, 2015; Ruyle and Ogden, 1993;
PSMFC, 2005; Chang and Jackson, 2003; Oregon State
Marine Board, 2009; OFM, 2016; Community Attributes Inc.,
2016
Direct Impacts to Dams $42,895,000
Installation of mitigation systems $41,791,000
Removal from dam installations $1,104,000
Removal from Boat Launches $170,000
Direct Impacts to Fishing $47,000
Total $43,112,000
Invasive Mussels Direct Impacts
Output $100,116,000
Jobs 500
Labor Income $27,884,000
Total Invasive Mussels Impacts

Rhagoletis pomonella
Impacts ConsideredApples, pears, sweet cherries: Apple maggot attacks early maturing
fruit and renders it unfit for consumption, sale, and export.
Other ConsiderationsExports: Crops that are infested with apple maggot cannot be sold for
export in order to prevent the spread of apple maggot.
Quarantine areas: Infested areas are included in quarantine areas,
prohibiting the movement of fruit to protect orchards that do not have
this costly pest.
Distribution in WashingtonApple maggots were first detected in Clark County. Apple maggots are
found in 22 of Washington’s 39 counties.
Description of SpeciesApple maggots are the larvae of the fruit fly, which is native to eastern
North America. Female fruit flies lay eggs by making small incisions
into the skin of the fruit, which causes dimpling. After three to seven
days, eggs hatch and the maggots start to feed on the fruit. Quickly,
the fruit becomes soft and will fall off the tree. Apple maggot larvae
then pupate in the soil underneath the infected fruit tree and emerge as
adult fruit flies in the spring.
Source: Joseph Berger; insectimages.org

Direct Economic Impact of SpeciesApple maggot primarily feeds on apples, but cherry and pear trees are
also hosts. Seventeen counties in Washington are at risk for apple
maggot introduction. An estimated rate of spread of 15% into
susceptible cropland in these counties suggests that a total of 19,000
acres of apples, 5,000 acres of cherries and 2,000 acres of pears are
at risk.
Trees infested with apple maggot are estimated to lose about half their
fruit. However, any orchard infested with apple maggot cannot export
any of their produce. As such, there are different valuations of non-
commercial consumption of fruit versus the value of fruit for export.
A Direct Impacts to Crops (domestic) $54,152,000
Apple $47,663,000
Cherry $4,609,000
Pear $1,880,000
B Direct Impacts to Crops (exports) $108,305,000
Apple $95,327,000
Cherry $9,219,000
Pear $3,759,000
A+B Direct Impacts to Crops (total) $162,457,000
Apple $142,990,000
Cherry $13,828,000
Pear $5,639,000
Apple Maggot Direct Impacts
Rhagoletis pomonella
Total Economic Activity at Risk
Output $391,988,000
Jobs 2,900
Labor Income $125,182,000
Total Apple Maggot Impacts
Apple maggot impacts are unique due to the different valuations of
domestic production and fruit destined for export. At a 15% rate of spread,
the total economic impact of apple maggot is estimated to be nearly $392
million. Approximately $131 million is from fruit destined to be sold
domestically and the remaining $261 million destined for export.
Total jobs at risk amount to approximately 2,900, of which 970 jobs are at
risk due to shortfalls in domestic sales with a further 1,940 jobs at risk due
to shortfalls in export sales. The potential job losses equate to a total
potential loss of $125 million in lost wages.
Sources: The Research Group, 2014; WSDA, 2015;
USDA, 2015; WDFW, 2015; University of Washington,
2015; Ruyle and Ogden, 1993; Chang and Jackson,
2003; Oregon State Marine Board, 2009; OFM, 2016;
Community Attributes Inc., 2016

Lymantria disparasiatica and L. dispar
Impacts ConsideredTimber: Larvae can consume more than 300 different species of trees
and shrubs. European gypsy moth prefers oak species. Asian gypsy
moths will consume larch, oak, poplar, alder, willow and some
evergreen species.
Other Considerations
Recreation: Gypsy moths can defoliate forests and wildlands,
affecting scenic and recreational value.
Distribution in WashingtonGypsy moth has not yet established in Washington State. Some
populations have been detected, but have been quickly eradicated
through an extensive monitoring and eradication program administered
by the Washington State Department of Agriculture.
Description of SpeciesThe caterpillars of Asian and European gypsy moths, Lymantria dispar
asiatica and L. dispar, can have a massive impact on forests and
landscaping trees and shrubs. Both species produce egg masses
containing hundreds of eggs, and the emerging caterpillars quickly
defoliate host trees, which can severely weaken or kill them.
Asian and European gypsy moths are both problematic, but the Asian
species is considered worse. The female European gypsy moth is
flightless and its spread through the eastern United States has been
slow. In contrast, female Asian gypsy moths are strong fliers, and the
Asian gypsy moth has quickly been spreading through the United
States. Additionally, the Asian gypsy moth has a wider range of
potential host trees, compared to the European gypsy moth, although
both gypsy moth species can feed on more than 300 species of trees
and shrubs.
Source: Bill McNee, Wisconsin Department of Natural Resources, Bugwood.org

Direct Economic Impact of SpeciesGypsy moth has an estimated yearly radial spread of 13-14 miles,
which is equivalent to 376,000 acres per year. In 2015, there were
18,975 gypsy moth traps placed in Washington. If an estimated 1% of
those traps proved positive and gypsy moth were allowed to infest
timberland at a 15% rate of spread, more than 7.5 million acres of
timberland would be at risk of defoliation due to Gypsy moth.
Gypsy moth has the potential to infest at least 20 counties across
Washington. King County is estimated to experience the largest
impact, with around $8.5 million in direct costs. The average direct
impact of gypsy moth per county is around $2.4 million.
Direct Impacts to Timber $48,863,000
Total $48,863,000
Gypsy Moth Direct Impacts
Lymantria disparasiatica and L. dispar
Total Economic Activity at Risk
Output $116,086,000
Jobs 500
Labor Income $29,012,000
Total Gypsy Moth Impacts
The projected impact of gypsy moth refers to the economic output, jobs
and labor income at risk. If 1% of all gypsy moth traps tested positive and
15% of timberland near those traps were infested by gypsy moth
caterpillars, the total economic impact at risk from gypsy moth across the
Washington economy is estimated to be approximately $116 million. A
further 500 jobs are considered to be at risk from gypsy moth and $29
million in lost labor income.
Sources: ODA, 2014; WSDA, 2015; USDA,
2015; WDFW, 2015; University of
Washington, 2015; Gansner and Herrick,
1987; Ruyle and Ogden, 1993; Chang and
Jackson, 2003; Oregon State Marine Board,
2009; OFM, 2016; Community Attributes Inc.,
2016

Agrilus planipennis
Impacts ConsideredTimber: Emerald ash borer larvae feed on the ash tree sapwood,
disrupting a tree’s ability to transport water and nutrients through its
trunk.
Urban Forests: Ash trees are frequently planted in urban parks and on
city streets. Larval impacts to urban ash trees would devastate
Washington’s urban and community forestry program.
Other Considerations
Recreation: Emerald ash borer infestations can defoliate forests and
wildlands.
Riparian Forests: Ash tree defoliation and death in near-stream
environments negatively impacts stream temperature and health.
Quarantine: In the event of introduction, a quarantine limiting
intrastate or interstate movement of ash nursery trees, hardwood
firewood, and other ash products will be placed on the affected
counties.
Description of SpeciesEmerald ash borer is an invasive wood-boring beetle that is destructive
to ash (Fraxinus) trees. Adult beetles are roughly 0.33 inches in length
and are metallic green in color. Emerald ash borer larvae feed on the
sapwood of the ash tree, disrupting the flow of water and nutrients of
the tree trunk by girdling it. In the United States, more than 7.5 billion
ash trees have been killed by emerald ash borer.
Source: Leah Bauer, U.S. Department of Agriculture’s Forest Service Northern Research Station, Bugwood.org
Distribution in WashingtonEmerald ash borer is not present in Washington. However,
Washington State actively monitors for new introductions in King,
Lewis Pierce, and Thurston Counties.
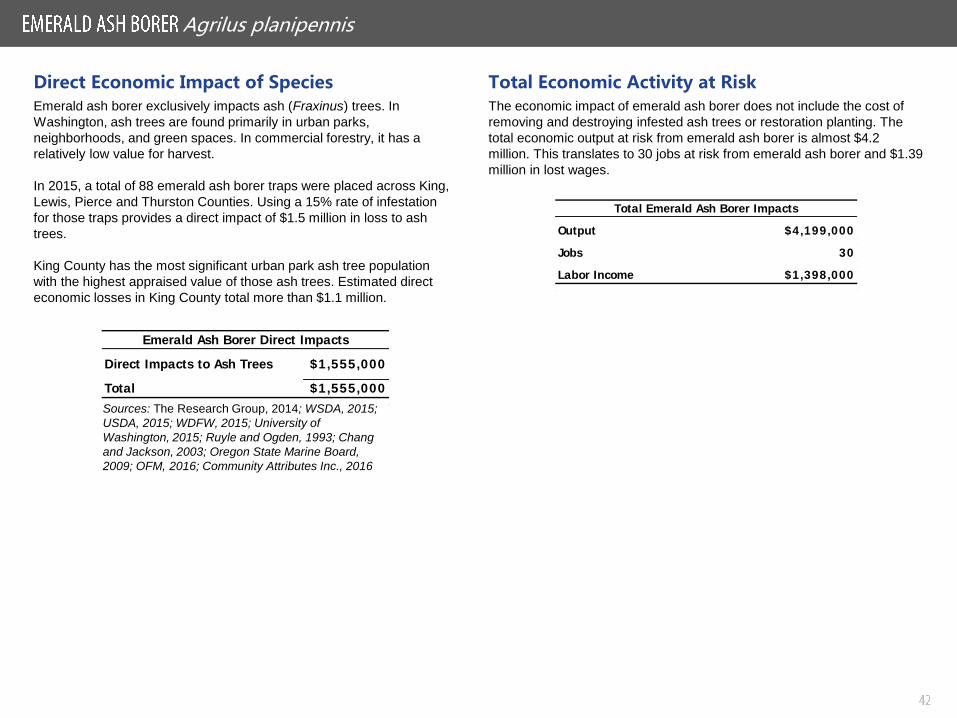
Direct Economic Impact of SpeciesEmerald ash borer exclusively impacts ash (Fraxinus) trees. In
Washington, ash trees are found primarily in urban parks,
neighborhoods, and green spaces. In commercial forestry, it has a
relatively low value for harvest.
In 2015, a total of 88 emerald ash borer traps were placed across King,
Lewis, Pierce and Thurston Counties. Using a 15% rate of infestation
for those traps provides a direct impact of $1.5 million in loss to ash
trees.
King County has the most significant urban park ash tree population
with the highest appraised value of those ash trees. Estimated direct
economic losses in King County total more than $1.1 million.
Direct Impacts to Ash Trees $1,555,000
Total $1,555,000
Emerald Ash Borer Direct Impacts
Agrilus planipennis
The economic impact of emerald ash borer does not include the cost of
removing and destroying infested ash trees or restoration planting. The
total economic output at risk from emerald ash borer is almost $4.2
million. This translates to 30 jobs at risk from emerald ash borer and $1.39
million in lost wages.
Total Economic Activity at Risk
Output $4,199,000
Jobs 30
Labor Income $1,398,000
Total Emerald Ash Borer Impacts
Sources: The Research Group, 2014; WSDA, 2015;
USDA, 2015; WDFW, 2015; University of
Washington, 2015; Ruyle and Ogden, 1993; Chang
and Jackson, 2003; Oregon State Marine Board,
2009; OFM, 2016; Community Attributes Inc., 2016

Myocastor coypus
Impacts ConsideredWetlands: Nutria consume estuary and marsh vegetation, causing
bank erosion, degraded water quality, and wetland habitat loss.
Salmon: Destruction of vegetative cover on stream banks and in
estuaries causes water quality issues, stream bank erosion and habitat
loss.
Other ConsiderationsRecreation: Destruction of stream banks, lake shores, and wetlands
reduces opportunities for outdoor and water recreation.
Habitat destruction: Nutria can disrupt ecosystem processes in
critically-important areas.
Distribution in WashingtonIn Washington, nutria were first detected outside of captivity in 1943.
Nutria have since spread in many areas of western Washington and
are gaining a foothold in in central Washington.
Description of SpeciesNutria is a large semi-aquatic rodent native to South America. Nutria
were first introduced in 1899 to the United States in California for the
purposes of fur farming. During World War II, the fur farming industry
in the United States collapsed, and nutria were released into the wild
where they thrived with little natural predation. Nutria favor riparian and
wetland areas, damaging wildlife habitat and estuaries.
Source: John and Karen Hollingsworth, U.S. Fish and Wildlife Service, Bugwood.org

Direct Economic Impact of SpeciesNutria primarily live in riparian habitats near streams and rivers. The
impact of nutria on crops primarily occurs on farmland adjacent to
riparian habitat. At a 15% rate of spread, nutria are estimated to
directly impact 23,000 acres of crops statewide. In total, 1,724 miles of
rivers and streams are likely to be affected by nutria.
Nutria are found in 13 counties in Washington, with the largest impact
occurring in Yakima County. Nutria in Yakima could cause more than
$525,000 in direct damages. The average direct impact per affected
county is estimated to be $199,000.
Direct Impacts to Crops $298,000
Grains $40,000
Alfalfa Hay $122,000
Corn $136,000
Direct Impacts to Fishing $2,291,000
Total $2,589,000
Nutria Direct Impacts
Myocastor coypus
Total Economic Activity at Risk
Output $6,104,000
Jobs 25
Labor Income $1,779,000
Total Nutria Impacts
While the direct impacts of nutria are limited, the potential impacts across
Washington are significant. At a 15% rate of infestation along rivers in
affected counties, total economic impacts across Washington could total
approximately $6.4 million in lost output. This lost output would lead to a
loss of 25 jobs and $1.7 million in wages.
While the total impact of nutria estimated in this report is relatively small,
the unquantified impacts by nutria to Washington’s environment and
biodiversity will be significantly larger than the figures in this report
suggest.
Sources: The Research Group, 2014; WSDA,
2015; USDA, 2015; WDFW, 2015; University of
Washington, 2015; Ruyle and Ogden, 1993;
Chang and Jackson, 2003; Oregon State
Marine Board, 2009; OFM, 2016; Community
Attributes Inc., 2016

Sus scrofa
Impacts Considered
Cattle and livestock: Feral
swine are known to carry or
transmit more than 30 diseases
and parasites that can be
transmitted to livestock, people,
pets and wildlife.
Other Considerations
Habitat destruction: Feral
swine typically occupy the
same areas as deer and other
native herbivores. In some
instances, feral swine have
been documented killing deer,
turkeys, and young livestock. Sources: PSU, 2007; USDA, 2015; USDA, 2014.
Value of Potentially-Affected Crops and Animals
Distribution in WashingtonThere are no established populations of feral swine in Washington.
There have been isolated occurrences on the Olympic Peninsula and
in southeast and south central Washington. Feral swine have
established populations in parts of northeast Oregon and southern
Idaho.
Description of SpeciesFeral swine are descendants from Eurasian wild boar or domestic pigs
that escaped captivity and have reverted to wild characteristics. Adult
feral swine are prodigious breeders and can weigh upwards of 400
pounds. Feral swine are omnivores and will generally eat anything that
is available, including crops.
Source: The Nature Conservancy, Bugwood.org
Commodity Value (Millions) Data Year
Cattle & Calves $1,163.3 2015
Sheep & Other Livestock $144.4 2015
Apples $1,914.8 2014
Cherries $507.4 2014
Peaches $11.0 2014
Pears $236.1 2014
Potatoes $764.9 2014
Grapes, Wine $304.8 2014
Barley $16.1 2015
Hay $623.5 2015
Hops $280.0 2015
Wheat $629.1 2015
Total $6,595.5
Crops including potatoes, grapes, pears, apples and cherries:
Rooting (digging with tusks and snouts) can destroy crops as well as
till soil and open areas for noxious weed invasion. Because
Washington does not have any established feral swine populations at
this time, the existing economic models were not applicable.
Therefore, economic impacts were not calculated for this species.
Hay, wheat, grain, hops: Rooting can destroy crops’ roots. This can
create areas for noxious weed introduction, further reducing yields.

Washington State Department of Agriculture
Washington Invasive Species Council
Washington State Department of Fish and Wildlife
Washington State Department of Ecology
Prepared For
University of Washington School of Environment and Forest Sciences
Special Thanks
Prepared By
Washington State Noxious Weed Control Board
Washington State Department of Natural Resources
Washington State Parks
Washington State Department of Transportation
Community Attributes Inc.
United States Department of Agriculture Animal and Plant Health Inspection Service Wildlife Services
Washington State Parks and Recreation Commission
David Tonkin and Jill Silver, Washington Scotch Broom Working Group Washington’s native plants, such as balsamroot, are at risk from
encroachment of invasive, noxious weeds. Photo courtesy of Emily Stevenson, Skamania County NWCB