Embed Size (px)
Citation preview

ORIGINAL ARTICLE
Direct capture of carbon dioxide from air vialime-based sorbents
Mohammad Samari1 & Firas Ridha2 & Vasilije Manovic3 & Arturo Macchi1 &
E. J. Anthony3
Received: 22 June 2018 /Accepted: 21 January 2019# The Author(s) 2019
AbstractDirect air capture (DAC) is a developing technology for removing carbon dioxide (CO2) fromthe atmosphere or from low-CO2-containing sources. In principle, it could be used to removesufficient CO2 from the atmosphere to compensate for hard-to-decarbonize sectors, such asaviation, or even for polishing gas streams containing relatively low CO2 concentrations. Inthis paper, the performance of lime-based sorbents for CO2 capture from air in a fixed bed wasinvestigated. The effects of sorbent type, particle diameter, air flow rate, and relative humidityon the breakthrough time, breakthrough shape, and global reaction rate over a series of captureand regeneration cycles were examined. The greatest reaction rates and conversions wereobtained when the sorbents were pre-hydrated and inlet air was humidified to 55% relativehumidity. Humidifying the air alone leads to axial carbonation gradients since there iscompetition between CO2 and water with the available CaO. Negligible conversion, over theduration of the experiment, is obtained in a dry system without pre-hydration and humid air. Ashrinking-core gas–solid reaction model was fitted to the breakthrough curves in order toestimate the surface reaction and effective diffusion constants. Although the surface reactionconstants of the two sorbents were similar, the pelletized limestone had a greater effectivediffusivity due to its greater porosity. At mild calcination conditions with air at 850 °C, thepelletized particles maintained their activity over nine carbonation–calcination cycles with aconversion drop of only 9% points. However, calcination under oxy-fuel conditions (CO2 at920 °C) reduced the pellet carbonation conversion from 81 to 59% and pore surface area from12.01 to 3.20 m2/g after only 4 cycles. This research clearly shows that DAC using lime-based
https://doi.org/10.1007/s11027-019-9845-0
Electronic supplementary material The online version of this article (https://doi.org/10.1007/s11027-019-9845-0) contains supplementary material, which is available to authorized users.
* E. J. [email protected]
1 Centre for Catalysis Research and Innovation, Department of Chemical and Biological Engineering,University of Ottawa, Ottawa K1N 6N5, Canada
2 CanmetENERGY, 1 Haanel Drive, Ottawa K1A 1M1, Canada3 Centre for Climate and Environmental Protection, Cranfield University, Cranfield, Bedfordshire, UK
/Published online: 21 February 2019
Mitigation and Adaptation Strategies for Global Change (2020) 25:25–41

sorbents is technically feasible, and that regeneration schemes compatible with technologieslike calcium looping (CaL) are applicable for the air capture option. Finally, this studydemonstrates that DAC using lime-based materials can be in the future a strategy to addressemissions from transportation and distributed CO2 sources and to mitigate climate change.
Keywords Climate change . Direct air capture . Limestone . Calcination . Carbonation
1 Introduction
It is clear that anthropogenic emission of greenhouse gases (GHGs) is causing significantclimate change (IPCC 2007; Lüthi et al. 2008; Petit et al. 1999). According to the 2010 annualreport of the International Energy Agency (IEA), two thirds of the global carbon dioxide (CO2)emissions are from the electricity/heat generation and transport sectors (IEA 2011). Since fossilfuels are still the least expensive source of energy, it is predicted that GHG emissions due tocombustion of fossil fuels (e.g., coal, oil, and natural gas) will rise by 25–90% between 2000and 2030 (Ranjan and Herzog 2011). Carbon capture and storage (CCS) is the process ofcapturing CO2 from large point sources and producing a concentrated and pressurized streamof CO2 for storage. However, about 60% of CO2 emissions is attributed to dilute, distributedsources (IEA 2013) and while oceans absorb much of the emitted CO2, 20–40% of it remainsin the atmosphere (Bottoms 1930).
Direct air capture (DAC) is a developing, flexible technology for removing CO2 fromthe atmosphere that can, in principle, be built anywhere. Unlike other CO2 removalprocesses, it does not require a relatively concentrated source of CO2 such as providedby flue gas or process streams from carbon-intensive industries. The most importantbenefit of DAC is to remove sufficient CO2 from the environment, to compensate forotherwise difficult-to-decarbonize sectors such as aviation or transportation. Given thatDAC is always going to be more expensive than decarbonizing concentrated gas streamsfrom fossil fuel conversion, its most likely applications are either to polish dilute gasstreams (residual CO2 from CCS processes) or as a method to compensate for the use offossil fuels in transportation options.
Capturing CO2 with a partial pressure p0 from a mixture of gases and separating it as aconcentrated CO2 stream with a pressure P, needs kTln(P/P0) energy, where k and T are theBoltzman constant and working temperature, respectively. Therefore, capturing CO2 (partialpressure ~ 4 × 10⁻⁴ bar) from air and compressing it to 101.3 bar, which is required forsequestration, needs an energy input of almost 4 GJ/t carbon. Comparing this value with thecarbon-specific energy content of fossil fuels, such as coal, oil, and natural gas (40–70 GJ/tcarbon), suggests that part of the energy from carbon fuels could be used for CO2 capturerather than the CO2 being emitted to the atmosphere (Keith et al. 2006). The environmentaladvantages of CO2 capture from air are undeniable. For instance, CO2 capture plants could beconstructed near the final storage sites, in locations where land is cheap, and energy for theseparation process could be obtained from renewable sources (e.g., wind or solar) and,additionally, transportation costs are marginal. DAC could also be used for the tailing CO2
treatment of power generation plants or oil and gas refineries, where 100% CO2 capture is notnormally achieved (Nikulshina et al. 2006).
One method for DAC using hydroxide solutions has been explored by Carbon EngineeringLtd. in Canada (Carbon Engineering 2019). The process consists of two main cycles: an air
Mitigation and Adaptation Strategies for Global Change (2020) 25:25–4126

contactor (CO2 capture cycle) and a sorbent regeneration cycle. In the first cycle, CO2 from airis absorbed by means of a chemical solution to form a carbonate (e.g., K2CO3). The carbonatesolution then reacts with calcium hydroxide (Ca(OH)2) to form calcium carbonate (CaCO3). Inthe next cycle, the CaCO3 is separated from solution and calcined to lime (CaO) in an oxy-fired fluidized bed that operates at approximately 900 °C. During this stage, CO2 is releasedwhile the CaO is recycled and rehydrated to Ca(OH)2. Finally, this hydroxide is used to reactwith the carbonate solution (Mahmoudkhani and Keith 2009). However, since the process usesa solution, good contact between the liquid and ambient air is critical when a spray-basedsystem and a packed tower are employed (Mahmoudkhani et al. 2009). Furthermore, thesemethods have some drawbacks, due to the high cost of sorbent regeneration, solvent losses,and the presence of alkali metal salt impurities in any calcium loop that enhances sintering andloss of sorption capacity. Therefore, eliminating the use of alkali metal hydroxides altogetherand using lime-based sorbents is inherently simpler, and takes advantage of the fact that limeis, after water, arguably the cheapest and most commonly available industrial chemical, andhas numerous uses, including as will be discussed below, in the cement and steel industries.
By contrast, amine-based scrubbing is a mature technology that has been used for more than80 years in the oil and gas industry for acid gas (H2S and CO2) removal (Astarita et al. 1993).However, for DAC, solutions such as diethanolamine (DEA) and monoethanolamine (MEA)are unsuitable since their CO2 capture capacity drops drastically at low CO2 partial pressures.Therefore, amine-based solid sorbents have been proposed instead. Supported amine adsor-bents are classified into two categories. In class 1 adsorbents, amine molecules are loaded intopolymeric or silica supports. These amine molecules are physisorbed on the surface and in thepores of the support. For class 2 adsorbents, amine molecules are bound to the surface of thesupport by covalent bonds. Studies show that class 2 adsorbents have better performance thanother adsorbents such as zeolites and mesoporous silica at low CO2 partial pressure (Choi et al.2011). Despite the relatively low regeneration energy requirement of amine-based sorbents,their relatively high costs, poor CO2 capture capacity from air, and degradation are issues thatmake them less attractive options (Choi et al. 2011; Sculley and Zhou 2012).
Finally, CO2 capture at high temperature via new lime-based sorbents, which are enhancedwith calcium aluminate cement binders and pelletized, has been investigated byCanmetENERGY-Ottawa. Thermogravimetric analyzer (TGA) results show improved sorp-tion capacity relative to natural limestone (Manovic and Anthony 2009a, 2010; Manovic et al.2012) due to the formation of mayenite (Ca12Al14O33), which reduces sintering during CO2
capture cycles (Manovic and Anthony 2009a, b, 2010; Manovic et al. 2012).Limestone is extensively used in the cement industry as a source of CaO and is responsible for
7–10% of anthropogenic CO2 emissions (Zheng et al. 2016). Calcium looping (CaL) has beenproposed as an option for the cement industry to capture CO2 (Erans et al. 2018). Here, the CaOfrom CaL can be used in DAC, or if DAC is carried out with a lime-based sorbent, then the spentlime can be fed back into the cement industry. Recently, it has also been demonstrated that limecan be very efficiently used in the steel industry for decarbonization as well, using a variant of theCaL option (Tian et al. 2018). The basic philosophy of this work is that limestone and lime-basedmaterials are ubiquitous, cheap, nontoxic and are compatible with two of the most importantindustrial sources of anthropogenic CO2 (namely cement and steel), and a lime-based process, if itcan be made to perform at a comparable level to DAC processes using sodium or potassiumhydroxide, is inherently preferable. Thus, while to date, experiments on capturing CO2 focused onconcentrations relevant to coal flue gases (10–15%) at elevated temperatures (Zheng et al. 2016;Erans et al. 2018), here we seek to demonstrate that these sorbents are suitable for DAC.
Mitigation and Adaptation Strategies for Global Change (2020) 25:25–41 27

Significant carbonation of calcium hydroxide at ambient temperature can be achievedwhen the relative humidity (RH) of air is above 40% (Beruto and Botter 2000). Dheillyet al. (2002) suggest that the H2O rather than CO2 partial pressure dominates thecarbonation reaction at low temperature. Furthermore, Yang et al. (2003) observed viaatomic force microscopy (AFM) that the carbonation of calcium hydroxide at ambientconditions occurs when nano-droplets of water are formed on the surface of Ca(OH)2.The carbonation of lime at low temperature can then be said to occur in several steps(Kalinkin et al. 2005). First, gaseous CO2 dissolves in the water droplets and formsH2CO3 (Eq. 1) and then calcium hydroxide from the surface of the sorbent also dissolvesin the water droplets. Here, H2CO3 dissociates to H+, HCO3
−, and CO32− ions (Eqs. 2 and
3), and Ca(OH)2 to Ca2+ and OH− ions in solution (Eq. 4).
CO2 gð Þ þ H2O lð Þ↔H2CO3 aqð Þ ð1Þ
H2CO3 aqð Þ↔HCO3−
aqð Þ þ Hþaqð Þ ð2Þ
HCO3−
aqð Þ↔CO32−
aqð Þ þ Hþaqð Þ ð3Þ
Ca OHð Þ2 sð Þ↔Ca2þ aqð Þ þ 2OH−aqð Þ ð4Þ
The overall carbonation reaction of Ca(OH)2 can then be written as follows:
Ca OHð Þ2 þ CO2↔CaCO3 þ H2O ð5ÞThe formation of CaCO3 on the surface of Ca(OH)2 impedes diffusion of CO2. However,studies show high carbonation conversion of Ca(OH)2 is possible at ambient conditions and,therefore, it can be concluded that the new solid phase on the surface of the sorbent particle isnon-protective (Nakicenovic et al. 2000). This can be explained by the formation of calciumbicarbonate (Ca(HCO3)2), (Pontiga et al. 2013):
CaCO3 þ CO2 þ H2O→Ca HCO3ð Þ2 ð6ÞThe higher solubility of Ca(HCO3)2 enhances CO2 diffusion through the bulk of the particle.Finally, Ca(HCO3)2 reacts with Ca(OH)2 and forms CaCO3:
Ca HCO3ð Þ2 þ Ca OHð Þ2→2CaCO3 þ 2H2O ð7ÞSince these carbonation reactions (Eqs. 5 and 7) occur in parallel, the formed solid phase canbe considered as a non-protective layer. As the solubility of gases in water is greater at lowertemperatures, the carbonation of Ca(OH)2 at a lower temperature is enhanced (Dheilly et al.2002; Pontiga et al. 2013).
The objective of this work was to investigate the use of natural lime and pelletizedlime-cement particles for the direct capture of CO2 from air at ambient conditions,with the sorbents being regenerated via temperature swing. Two particle sizes wereconsidered and experiments were performed in a fixed bed. Using these data, a modelwas developed to simulate the breakthrough curves and to extract the carbonationkinetics data for various operating conditions.
Mitigation and Adaptation Strategies for Global Change (2020) 25:25–4128

2 Materials and methodology
2.1 Materials
The composition of the natural Cadomin lime, calcined at 850 °C, from X-ray fluorescence(XRF) spectroscopy is presented in Table 1. The pelletized lime particles were made frompowdered lime (dp < 45 μm) and calcium aluminate cement (CA-14, ~ 71%wt. Al2O3; ~28%wt. CaO; ~ 1%wt. impurities). The lime and cement were mixed in a mass ratio of 9:1 in amechanical pelletizer (Glatt GmbH). Water was then sprayed into the vessel continuously. Theresulting pellet size was controlled by the speed of an agitator and chopper attached to thevessel. Table 2 shows some physical properties of the natural and pelletized lime sorbents. Thesamples with desired particle size range were obtained by sieving. Then, the samples werecalcined at 850 °C in air and their pore surface area was measured by the Brunauer–Emmett–Teller (BET) technique with a Micromeritics-TriStar II apparatus. The results presented inTable 2 show that the natural lime particles have a greater bulk density while the pellets have agreater pore surface area, primarily due to the formation of mayenite during calcination(Manovic and Anthony 2009a, b).
2.2 Methodology
The schematic of the experimental setup is shown in Fig. 1. A compressor was used tocirculate atmospheric air through a water bubbler and then a packed bed of sorbent. Theaverage CO2 concentration of the inlet air, Co, was 415 ppm and its relative humidity, asmeasured by a Vaisala RH-Transmitter, was maintained at ~ 55% during all experiments. Itshould be noted that experiments without the presence of humidified air were also performedto show the effect of humidity for air capture with lime-based sorbents at low temperature. Theair stream exiting the bed was sent to an online gas analyzer to determine the residual CO2
content, C, of the stream leaving the system.The column containing the bed of particles is a stainless steel tube with a height of 78.6 mm
and inner diameter of 7.8 mm, as shown in Fig. 2. A uniform bed porosity can be assumedwhen the column diameter is 10× to 15× greater than the mean particle diameter (Akehata andSato 1985; Gunn 1968; Gunn and Pryce 1969; Stephenson and Stewart 1986). The fixed bedheight was set at 68 mm, yielding an aspect ratio of around 8 that will mitigate the impact ofentrance effects. Moreover, the column lower section contains glass beads of 200–300 μm indiameter filled to a height of 10 mm in order to minimize fluid channeling. Finally, a paper
Table 1 Composition of naturallime Component wt%
CaO 89.57SiO2 4.03MgO 3.92Al2O3 1.06Fe2O3 0.51K2O 0.38Na2O 0.35SO3 0.17TiO2, P2O5, Br, Ni, Mn, Zn, Cu 0.01Total 100
Mitigation and Adaptation Strategies for Global Change (2020) 25:25–41 29

filter with pore size of 8 μm was also inserted at the bottom of the column. Gas flow rates of0.5 and 1.0 LPM (at 20 °C and 1 barg) were chosen to ensure that the flow regime remainedconstant in all experiments. The particle Reynolds number varied between 0.37 and 1.12, wellbelow the upper limit value of 10 for laminar flow (Ranade et al. 2011).
Before each experiment, the bed material was pre-hydrated for 3 h by passing nitrogenthrough the water bubbler and then the fixed bed. An experiment was typically conducted foronly 1 carbonation cycle. For the experiments performed in series of cycles, after eachcarbonation cycle, sorbents were calcined and prepared for the next cycle. After completebreakthrough, the conversions of sorbent samples from the top, middle, and bottom of the bedwere measured by TGA (METTLER TOLEDO-SDTA581) to determine the carbonationprofile throughout the bed.
3 Results and discussion
3.1 Importance of system moisture
The carbonation conversion, X′, is defined in Eq. 8:
X ’ ¼ m2−m1
A� m0� MCaO
MCO2
ð8Þ
where m2 and m1 are the mass of carbonated and calcined sample after dehydration, respec-tively, m0 is the initial mass of the calcined sample, A is the fraction of CaO in the sorbent, andMCaO and MCO2 are the molecular weight of calcium oxide and carbon dioxide, respectively.
Figures 3 and 4 show that, although the natural limestone or pelletized limestone particles arepre-hydrated for 3 h, the absence of humidity in the inlet air led to a relatively short breakthroughtime (Fig. 3) and the sorbent carbonation was low, at less than 20% for pelletized limestone andless than 10% for natural limestone (Figs. 4 a, b). The conditions for all experiments are as given
Table 2 Physical properties of the sorbents
Pellets(dp = 250–425 μm)
Pellets(dp = 425–600 μm)
Natural lime(dp = 250–425 μm)
Natural lime(dp = 425–600 μm)
Bulk density (g/cm3) 0.87 0.84 0.98 0.96Surface area (m2/g) 14.61 12.01 13.60 11.54
Fig. 1 Experimental setup
Mitigation and Adaptation Strategies for Global Change (2020) 25:25–4130

in Fig. 3 unless noted otherwise. These results are in agreement with those in the literature,showing that negligible carbonation occurs when there is insufficient humidity in the reactivesystem (Beruto and Botter 2000; Dheilly et al. 2002; Nikulshina et al. 2007).
78.6
mm
~ 10
.0m
m
~ 68
.0m
m
7.8 mm
Sorbent (Bed)
Glass bead
Fig. 2 Fixed bed reactor
0
0.2
0.4
0.6
0.8
1
0 20 40 60 80 100 120
C/C 0
Time (min)
Natural LimestonePelle�zed Limestone
Fig. 3 Breakthrough curves in the absence of humidity in air: pre-hydrated sorbent, dp = 250–425 μm, Q =1 LPM (1 barg, 20 °C)
Mitigation and Adaptation Strategies for Global Change (2020) 25:25–41 31

On the other hand, if the inlet air is humidified up to 50–55% relative humidity, but sorbentsare not pre-hydrated, an axially non-uniform carbonated bed is observed (Table 3). This phe-nomenon is due to the partial carbonation of sorbents in the first layers of the bed. While there iscompetition between CO2 and water to react with CaO, the partial carbonation reaction on thesurface of the sorbents prevents further hydration and decreases the reaction rate at the surface.However, in comparison with a dry system where relative humidity was negligible and sorbentswere not pre-hydrated, the observed carbonation conversions were more than 50% higher.
3.2 Effect of particle size and flow rate
Figure 5 shows the effect of particle size and gas flow rate on the breakthrough time andbreakthrough curve for both the pelletized and natural limestone. As smaller particles have agreater specific surface area (m2/g), it is expected (and observed) that their overall CO2 capturein comparison with larger particles is better. As the slopes of the breakthrough curves are similarfor two different gas flow rates, the external mass transfer resistance from bulk to the surface ofthe particles is, as expected, negligible. The breakthrough time using the pelletized limestoneparticles was shorter primarily due to the lower content of CaO as a result of the binder as thetotal mass loading into the bed was kept constant.
Table 4 presents the carbonation conversion at the top, middle, and bottom of the bed. Theaxial variation between the lowest and highest values was always less than 8% points for agiven operating condition. This shows that a relatively uniform carbonation conversion alongthe bed was obtained, confirming the necessity of both moist air and pre-hydration (see axialconversion variation in Table 3).
Moreover, a mass balance on CO2 in the gas phase was performed to confirm the sorbentcarbonation conversion measured by TGA:
n ¼ C0 � tC=C0¼0:9 � PQR
0T� η ð9Þ
where n is the number of CO2 moles that are adsorbed in the bed, P is the pressure of thesystem,Q is volumetric flow rate, R is the ideal gas constant, η is the ratio of the area above the
70
75
80
85
90
95
100
105
0 200 400 600 800 1000
Mas
s (%
)
Temperature (°C)
b
70
75
80
85
90
95
100
105
0 200 400 600 800 1000
Mas
s (%
)
Temperature (°C)
a
Carbona�on Carbona�on
Hydra�on Hydra�on
Fig. 4 TGA analysis of post-run sorbents in the absence of humidity in air: pre-hydrated sorbent, dp = 250–425 μm, dry inlet air, and Q = 1 LPM (1 barg, 20 °C). a Pelletized limestone. b Natural limestone
Mitigation and Adaptation Strategies for Global Change (2020) 25:25–4132

breakthrough curve to the total area at time t where C/C0 = 0.9, and T is temperature. To findthe surface area above the breakthrough curve, the break point is defined as C/C0 = 0.1 and theend of the breakthrough curve is where C/C0 = 0.9. The difference between estimates wasalways less than 10% (average of 5.6%).
In the next stage of the experimental program, the pelletized lime and natural lime particleswith a diameter range of 425–600 μm were used in a series of nine carbonation/calcinationcycles. These cycles consisted of CO2 capture from air at ambient conditions (carbonation) andregeneration of sorbents (calcination) at 850 °C in air for 75min. After each carbonation period,the sorbent conversion was measured by TGA and after each calcination period, the sorbentBET surface area was measured. This series of experiments was then repeated for pelletized
Table 3 Hydration and carbon-ation conversion of non-prehydrated pelletized limestonewith dp = 250–425 μm, inlet air atRH= 55%, and Q = 1 LPM (1 barg,20 °C)
Carbonationconversion (%)
Particles from the bottom of the fixed bed 65.17Particles from the middle of the fixed bed 86.96Particles from the top of the fixed bed 90.39
0
0.2
0.4
0.6
0.8
1
0 1,000 2,000 3,000 4,000 5,000 6,000
C/C0
Time (min)
dp =250-425 μm; Q =0.5 LPMdp =250-425 μm; Q =1.0 LPMdp =425-600 μm; Q =0.5 LPMdp =425-600 μm; Q =1.0 LPM
a
0
0.2
0.4
0.6
0.8
1
0 1,000 2,000 3,000 4,000 5,000 6,000
C/C0
Time (min)
b
Fig. 5 Impact of particle size and gas flow rate on the breakthrough curve. a Pelletized limestone. b Naturallimestone. Flow rates at 1 barg and 20 °C
Mitigation and Adaptation Strategies for Global Change (2020) 25:25–41 33

lime at the more realistic calcination conditions of 920 °C in pure CO2 for 12 min (representingoxy-fuel combustion), while the rest of the operating conditions remained constant.
3.3 Performance of sorbents in series of carbonation/calcination cycles
Table 5 shows the carbonation conversion and BET surface area after selected cycles forpelletized and natural limestone particles. Carbonation conversion of pellets decreased from 80to 71% after 9 cycles (10 calcinations) due to sintering and loss of porosity during calcination.Although the natural limestone sorbents have an initial carbonation conversion greater thanthat of the pelletized limestone sorbents, after the same number of cycles, their net decay due tosintering is greater since the pellets have mayenite, which helps better maintain the structuralmorphology of the particle.
Table 4 Comparison of CO2 conversion: TGA vs. gas mass balance. Flow rates at 1 barg and 20 °C
Particle and flow rate Conversion(CO2 mass balance)
Conversion (TGA) Difference %
Average Top Middle Bottom Average
Pelletized limestone dp = 250–425 μmQ = 0.5 L/min
0.93 0.91 0.88 0.83 0.87 + 6.9
Pelletized limestone dp = 250–425 μmQ = 1 L/min
0.80 0.89 0.88 0.86 0.87 − 8.1
Pelletized limestone dp = 425–600 μmQ = 0.5 L/min
0.85 0.92 0.90 0.85 0.88 − 3.4
Pelletized limestone dp = 425–600 μmQ = 1 L/min
0.83 0.87 0.85 0.80 0.84 − 1.2
Natural limestonedp = 250–425 μmQ = 0.5 L/min
0.89 0.92 0.90 0.90 0.91 − 2.2
Natural limestonedp = 250–425 μmQ = 1 L/min
0.80 0.91 0.93 0.84 0.89 − 10.1
Natural limestonedp = 425–600 μmQ = 0.5 L/min
0.86 0.94 0.92 0.90 0.92 − 6.5
Natural limestonedp = 425–600 μmQ = 1 L/min
0.89 0.97 0.94 0.93 0.95 − 6.3
Table 5 Decay of carbonation re-action and surface area for pellet-ized and natural limestone, dp =425–600 μm and Q = 1 LPM(1 barg, 20 °C)
Particle Cycle Carbonationconversion (%)
Pore surfacearea (m2/g)
Pelletized limestone 1st 80 12.012nd 75 10.004th 74 9.107th 71 8.309th 71 7.92
Natural limestone 1st 93 11.542nd 88 9.534th 81 7.697th 78 6.839th 76 5.93
Mitigation and Adaptation Strategies for Global Change (2020) 25:25–4134
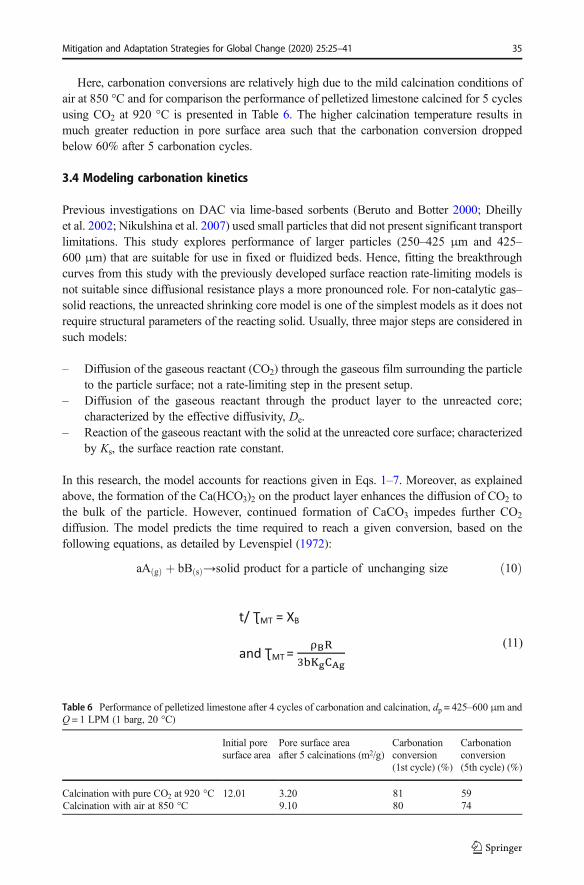
Here, carbonation conversions are relatively high due to the mild calcination conditions ofair at 850 °C and for comparison the performance of pelletized limestone calcined for 5 cyclesusing CO2 at 920 °C is presented in Table 6. The higher calcination temperature results inmuch greater reduction in pore surface area such that the carbonation conversion droppedbelow 60% after 5 carbonation cycles.
3.4 Modeling carbonation kinetics
Previous investigations on DAC via lime-based sorbents (Beruto and Botter 2000; Dheillyet al. 2002; Nikulshina et al. 2007) used small particles that did not present significant transportlimitations. This study explores performance of larger particles (250–425 μm and 425–600 μm) that are suitable for use in fixed or fluidized beds. Hence, fitting the breakthroughcurves from this study with the previously developed surface reaction rate-limiting models isnot suitable since diffusional resistance plays a more pronounced role. For non-catalytic gas–solid reactions, the unreacted shrinking core model is one of the simplest models as it does notrequire structural parameters of the reacting solid. Usually, three major steps are considered insuch models:
– Diffusion of the gaseous reactant (CO2) through the gaseous film surrounding the particleto the particle surface; not a rate-limiting step in the present setup.
– Diffusion of the gaseous reactant through the product layer to the unreacted core;characterized by the effective diffusivity, De.
– Reaction of the gaseous reactant with the solid at the unreacted core surface; characterizedby Ks, the surface reaction rate constant.
In this research, the model accounts for reactions given in Eqs. 1–7. Moreover, as explainedabove, the formation of the Ca(HCO3)2 on the product layer enhances the diffusion of CO2 tothe bulk of the particle. However, continued formation of CaCO3 impedes further CO2
diffusion. The model predicts the time required to reach a given conversion, based on thefollowing equations, as detailed by Levenspiel (1972):
aA gð Þ þ bB sð Þ→solid product for a particle of unchanging size ð10Þ
Table 6 Performance of pelletized limestone after 4 cycles of carbonation and calcination, dp = 425–600 μm andQ = 1 LPM (1 barg, 20 °C)
Initial poresurface area
Pore surface areaafter 5 calcinations (m2/g)
Carbonationconversion(1st cycle) (%)
Carbonationconversion(5th cycle) (%)
Calcination with pure CO2 at 920 °C 12.01 3.20 81 59Calcination with air at 850 °C 9.10 80 74
(11)
Mitigation and Adaptation Strategies for Global Change (2020) 25:25–41 35

where DP, MT, and R,SC are the characteristic times for diffusion of the gaseous reactantthrough the product layer of the particles, external mass transfer from the bulk gas to thesurface of the particle, and chemical reaction at the interface between the unreacted core of thepellet and the product layer, respectively, and XB is conversion, calculated as:
X B ¼ 1–rcR
� �3ð14Þ
To find the relationship between C0 and XB at any point on the breakthrough curve, a massbalance on a differential axial cross-section element of the bed based on the method proposedby Fenouil and Lynn (1996) was used:
CCo
¼X B−
utεfbug
1−utεfbug
ð15Þ
where ut is the moving velocity of the transition zone, calculated by an overall CO2 massbalance over the bed:
ut ¼ ugCo
1−εfbð ÞCCa OHð Þ2ð16Þ
Initially, there is no protective layer (CaCO3) and carbonation rate is controlled by the kinetics ofthe chemical reaction. After the formation of the product layer (CaCO3), diffusion through thislayer becomes the CO2 capture controlling step. Results from fitting the data presented in Fig. 5are summarized in Table 7. Figures 6 and 7 compare experimental data and model predictions forconversion (XB in Eqs. 14 and 15). As it can be seen, although there are slight variations, theagreement between model and experimental measurements is generally very good.
From Fig. 5, it can be seen that the impact of gas flow rate was marginal in terms ofaffecting the shape of the breakthrough curve. The mass transfer resistance from the bulk gasto the surface of the particles was thus assumed in the model to be negligible, which wasvalidated by the fact that the gas flow rate does not affect the fitting model parameters, Ks andDe. For the pelletized limestone particles, the average effective diffusivity is 6.30 × 10⁻⁷ and5.38 × 10−7 m2/s for particle diameters of 250–425 μm and 425–600 μm, respectively, whereasthe surface reaction rate constant is similar for all conditions with an average value of 2.36 ×10⁻³ m/s. Effective diffusivity for smaller particles is higher than for larger particles, while thesurface reaction rate constant is similar for both particle ranges.
(12)
(13)
Mitigation and Adaptation Strategies for Global Change (2020) 25:25–4136

Similar results are obtained with the natural limestone particles where smaller particles had agreater effective diffusivity and the surface reaction constant is similar for all conditions as well
Table 7 Reaction rate constant and effective diffusivity constant of pelletized and natural limestone
Particle Model parameter dp = 250–425 μmQ = 0.5 L/min
dp = 250–425 μmQ = 1 L/min
dp = 425–600 μmQ = 0.5 L/min
dp = 425–600 μmQ = 1 L/min
Pelletizedlimestone
Diffusion controlledDe (m2/s)
6.44 × 10⁻⁷ 6.16 × 10⁻⁷ 5.24 × 10⁻⁷ 5.51 × 10⁻⁷
Reaction controlledKs (m/s)
1.88 × 10⁻³ 2.39 × 10⁻³ 2.29 × 10⁻³ 2.86 × 10⁻³
Naturallimestone
Diffusion controlledDe (m2/s)
4.90 × 10⁻⁷ 4.93 × 10⁻⁷ 8.01 × 10⁻⁸ 8.80 × 10⁻⁸
Reaction controlledKs (m/s)
1.80 × 10⁻³ 2.69 × 10⁻³ 2.00 × 10⁻³ 2.26 × 10⁻³
0
20
40
60
80
100
0 500 1,000 1,500 2,000
Conv
ersi
on, X
B, (%
)
Time (min)
a
0
20
40
60
80
100
0 500 1,000 1,500
Conv
ersi
o , X
B, (%
)
Time (min)
b
c d
0
20
40
60
80
100
0 500 1000 1500 2000
Conv
ersi
on, X
B, (%
)
Time (min)
0
20
40
60
80
100
0 500 1,000 1,500
Conv
ersi
on, X
B, (%
)
Time (min)
Fig. 6 Modeling of the breakthrough curves of pelletized limestone. a dp = 250–425 μm and Q = 0.5 L/min. bdp = 250–425 μm and Q = 1.0 L/min. c dp = 425–600 μm and Q = 0.5 L/min. d dp = 425–600 μm and Q = 1.0 L/min. Flow rates at 1 barg and 20 °C
Mitigation and Adaptation Strategies for Global Change (2020) 25:25–41 37

as for the average value obtained for the pelletized limestone. However, effective diffusivity ofpelletized limestone is greater than for natural limestone. For instance, the average value ofDe is5.38 × 10−7 m2/s for pelletized limestone with a particle diameter range of 425–600 μm, whileits average value is 8.41 × 10⁻⁸ m2/s for natural limestone with the same particle size. Similarly,for the particle diameter range of 250–425 μm, the average value of De is 6.30 × 10⁻⁷ m2/s and4.91 × 10−7 m2/s for the pelletized and natural limestone, respectively. This arises because thebinder increases the pore surface area of the sorbent.
4 Conclusions
The performance of the natural limestone from Cadomin and the pelletized limestone (90%natural limestone and 10% calcium aluminate cement (CA-14)) was compared as sorbent fordirect CO2 capture from air at ambient conditions in a fixed bed reactor. Results show that pre-
0
20
40
60
80
100
0 500 1,000 1,500 2,000
Conv
ersi
on, X
B, (%
)
Time (min)
a
0
20
40
60
80
100
0 500 1,000 1,500
Conv
ersi
on, X
B, (%
)
Time (min)
b
0
20
40
60
80
100
0 500 1,000 1,500 2,000
Conv
ersi
on, X
B,(%
)
Time (min)
c
0
20
40
60
80
100
0 500 1,000 1,500
Conv
ersi
on, X
B,(%
)
Time (min)
d
Fig. 7 Modeling of the breakthrough curve of natural limestone. a dp = 250–425 μm and Q = 0.5 L/min. b dp =250–425 μm and Q = 1.0 L/min. c dp = 425–600 μm and Q = 0.5 L/min. d dp = 425–600 μm and Q = 1.0 L/min.Flow rates at 1 barg and 20 °C
Mitigation and Adaptation Strategies for Global Change (2020) 25:25–4138

hydration of the sorbents leads to a uniformly carbonated bed. Moreover, relative humidity isan important parameter on the carbonation of sorbents. In a dry system, the breakthrough timewas very short and the carbonation conversion of the sorbents was low in comparison with asystem with 55% relative humidity.
Comparing the performance of two sorbents in series of 9 carbonation/calcination cycles at850 °C under air shows that, due to the presence of the binder in pelletized limestone sorbents,their net decay in carbonation conversion (from 80 to 71%) was less than for natural limestone(from 93 to 76%).Moreover, the decay in pore surface area (from 12.01 to 7.92 m2/g) comparedwith that of natural limestone (from 11.54 to 5.93 m2/g) shows that pelletized limestone doesnot sinter as much as natural limestone. Hence, pelletized limestone sorbents were chosen forfurther study under simulated oxy-fuel calcination conditions (920 °C in pure CO2). However,their carbonation conversion fell (from 81 to 59%) and pore surface area drastically decreased(from 12.01 to 3.20 m2/g) after 5 cycles. The presented results on sorbent performance arepromising and show that DAC employing lime-based sorbents can be considered as a feasiblestrategy to mitigate climate change taking CO2 directly from the atmosphere.
The shrinking core model was used for mathematical modeling of breakthrough curve data.Based on preliminary observations, changing the flow rate does not have an effect on theoverall kinetics of the reaction. Hence, the mass transfer resistance from bulk gas to the particlesurface was assumed negligible. The carbonation of sorbents can be divided into two regimes:reaction-controlled and diffusion-controlled. Initially, the carbonation rate is controlled by thechemical reaction kinetics on the surface of the particle. As the reaction proceeds, theformation of the product layer on the surface of the particles moves the reaction into adiffusion-controlled regime. Results from mathematical modeling also confirm these hypoth-eses. Changing the flow rate does not affect the fitting values of effective diffusivity or thesurface reaction constant of the sorbents. Furthermore, the surface reaction constant of smallerparticles is similar to that of larger particles, while their effective diffusivity was greater. Theaverage effective diffusivity, as expected, was greater for pelletized limestone than for naturallimestone. This can be attributed to their higher porosity. Therefore, the main differencebetween the pelletized limestone and natural limestone in CO2 capture at ambient conditionsarises from the higher effective diffusivity of pelletized limestone.
Nomenclature
A Calcium oxide fraction in the particle (–)C0 CO2 concentration in inlet air (ppm)C CO2 concentration (ppm)CAg Inlet gas concentration (kg/m3)dp Particle diameter (m)D Column diameter (m)De Effective diffusivity (m2/s)k Boltzmann constant (J/K)Ks Surface reaction constant (m/s)Kg External mass transfer coefficient (m/s)m Mass (g)n Number of moles (mol)
Mitigation and Adaptation Strategies for Global Change (2020) 25:25–41 39

M Molecular weight (g/mol)P Pressure (Pa)Q Volumetric flow rate (m3/s)rc Unreacted core radius (m)R Particle radius (m)R′ Gas constant (J/(K·mol))Re Reynolds number (–)t Time (s)T Temperature (K)ut Moving velocity of the transition zone (m/s)ug Superficial velocity of the gas into the reactor (m/s)X Fractional conversion (–)X′ Carbonation conversion (Eq. 8) (–)XB Carbonation conversion (Eq. 14) (–)η Adsorption ratio (–)ρs Density (kg/m3)ρB Bulk density (kg/m3)ƮMT Characteristic time for external mass transfer (Eq. 11) (s)ƮDP Characteristic time for diffusion (Eq. 12) (s)ƮR,SCCharacteristic time for chemical reaction (Eq. 13) (s)εfb Bed void fraction (–)
Funding information The authors would like to thank CanmetENERGY (Natural Resources Canada), theNatural Sciences and Engineering Research Council of Canada, and the Carbon Management Canada for theirfinancial support for this research.
Open Access This article is distributed under the terms of the Creative Commons Attribution 4.0 InternationalLicense (http://creativecommons.org/licenses/by/4.0/), which permits unrestricted use, distribution, and repro-duction in any medium, provided you give appropriate credit to the original author(s) and the source, provide alink to the Creative Commons license, and indicate if changes were made.
Publisher’s note Springer Nature remains neutral with regard to jurisdictional claims in published maps andinstitutional affiliations.
References
Akehata T, Sato K (1985) Flow distribution in packed beds. J Chem Eng Japan 27:430–436Astarita G, Savage DW, Bisio A (1993) Gas treating with chemical solvents. Wiley, New YorkBeruto DT, Botter R (2000) Liquid like H2O adsorption layers to catalyze the Ca(OH)2/CO2 solid-gas reaction
and to form a non-protective solid product layer at 20 °C. J Eur Ceram Soc 20:497–503Bottoms RR (1930) U.S. Patent No. 1,783,901Carbon Engineering (2019) Direct air capture. http://carbonengineeringcom/about-dac/. Accessed 15 Jan 2019Choi S, Drese JH, Eisenberger PM, Jones CW (2011) Application of amine-tethered solid sorbents for direct CO2
capture from the ambient air. Environ Sci Technol 45:2420–2427Dheilly RM, Tudo J, Sebaı̈bi Y, Quéneudec M (2002) Influence of storage conditions on the carbonation of
powdered Ca(OH)2. Constr Build Mater 16:155–161Erans M, Jeremias M, Zheng L, Yao JG, Blamey J, Manovic V, Fennell PS, Anthony EJ (2018) Pilot testing of
enhanced sorbents for calcium looping with cement production. Appl Energy 225:392–401Fenouil LA, Lynn S (1996) Design of entrained-flow and moving, packed, and fluidized-bed sorption systems:
grain-model kinetics for hot coal-gas sulfurization with limestone. Ind Eng Chem Res 35:1024–1043Gunn DJ (1968) Mixing in packed and fluidized beds. Chem Eng J CE153–172
Mitigation and Adaptation Strategies for Global Change (2020) 25:25–4140

Gunn DJ, Pryce C (1969) Dispersion in packed beds. Trans IChemE 47:T341–T350International Energy Agency (IEA) (2011) CO2 emissions from fuel combustionInternational Energy Agency (IEA) (2013) CO2 emissions from fuel combustionInternational Panel on Climate Change (IPCC) (2007) Fourth assessment report of the Intergovernmental Panel
on Climate Change Bclimate change 2007 - the physical science basis^Kalinkin AM, Kalinkina EV, Zalkind OA, Makarova TI (2005) Chemical interaction of calcium oxide and
calcium hydroxide with CO2 during mechanical activation. Inorg Mater 41:1073–1079Keith DW, Ha-Duong M, Stolaroff JK (2006) Climate strategy with CO2 capture from the air. Climate Change
7474:17–45Levenspiel O. (1972) Chemical reaction engineering, 2nd ed, chapter 13, pp 357–371Lüthi D, Floch ML, Bereiter B, Blunier T, Barnola JM, Siegenthaler U, Raynaud D, Jouzel J, Fischer H,
Kawamura K, Stocker TF (2008) High-resolution carbon dioxide concentration record 650,000-800,000years before present. Nature 453:379–382
Mahmoudkhani M, Keith DW (2009) Low energy sodium hydroxide recovery for CO2 capture from atmosphericair - thermodynamic analysis. Int J Greenh Gas Contr 3:376–384
Mahmoudkhani M, Heidel KR, Ferreira JC, Keith DW, Cherry RS (2009) Low energy packed tower and causticrecovery for direct capture of CO2 from air. Energy Procedia 1:1535–1542
Manovic V, Anthony EJ (2009a) CaO-based pellets supported by calcium aluminate cements for high-temperature CO2 capture. Environ Sci Technol 43:7117–7122
Manovic V, Anthony EJ (2009b) Long-term behavior of CaO-based pellets supported by calcium aluminatecements in a long series of CO2 capture cycles. Ind Eng Chem Res 48:8906–8912
Manovic V, Anthony EJ (2010) CO2 carrying behavior of calcium aluminate pellets under high temperature/high-CO2 concentration calcination conditions. Ind Eng Chem Res 49:6916–6922
Manovic V, Wu Y, He I, Anthony EJ (2012) Spray water reactivation pelletization of spent CaO-based sorbentsfrom calcium looping cycles. Environ Sci Technol 46:12720–12725
Nakicenovic N. et al. (2000) Emissions scenarios. A special report of working group III of the IPCC, CambridgeUniversity Press: pp. 599
Nikulshina V, Hirsch D, Mazzotti M, Steinfield A (2006) CO2 capture from air and co-production of H2 via theCa(OH)2-CaCO3 cycle using concentrated solar power - thermodynamic analysis. Energy 31:1379–1389
Nikulshina V, Gavez ME, Steinfeld A (2007) Kinetic analysis of the carbonation reactions for the capture of CO2
from air via the Ca(OH)2-CaCO3-CaO solar thermochemical cycle. Chem Eng J 129:75–83Petit JR, Jouzel J, Raynaud D, Barkov NI, Barnola JM, Basile I, Bender M, Chappellaz J, Davis M, Delaygue G,
Delmotte M, Kotlyakov VM, Legrand M, Lipenkov VY, Lorius C, Pepin L, Ritz C, Saltzman E, StievenardM (1999) Climate and atmospheric history of the past 420,000 years from the Vostok ice core, Antarctica.Nature 399:429–436
Pontiga F, Valverde JM, Moreno H, Duran-Olivencia FJ (2013) Dry gas-solid carbonation in fluidized beds ofCa(OH)2 and nanosilica/Ca(OH)2 at ambient temperature and low CO2 pressure. Chem Eng J 222546-552
Ranade VV, Chaudhari R, Gunjal PR (2011) Trickle bed reactors: reactor engineering & applications, chapter 4Ranjan M, Herzog HJ (2011) Feasibility of air capture. Energy Procedia 4:2869–2876Sculley JP, Zhou HC (2012) Enhancing amine-supported materials for ambient air capture. Angewandte Chemie
International Edition 12660–12661Stephenson JL, Stewart WE (1986) Optical measurement of porosity and fluid motion in packed beds. Chem Eng
Sci 42:2161–2170Tian S, Jiang J, Zhang Z, Manovic V (2018) Inherent potential of steelmaking to contribute to decarbonisation
targets via industrial carbon capture and storage. Nat Commun 9:1–8Yang RY, Zou RP, Yu AB (2003) Effect of material properties on the packing of fine particles. J Appl Phys 94:
3025–3034Zheng L, Hills TP, Fennell P (2016) Phase evolution, characterisation, and performance of cement prepared in an
oxy-fuel atmosphere. Faraday Discuss 192:113–124
Mitigation and Adaptation Strategies for Global Change (2020) 25:25–41 41