Embed Size (px)
Citation preview

DIRECT AND INDIRECT EFFECTS OF THE GUPPY, POECILIA RETICULATA, ON
THE STRUCTURE AND FUNCTION OF STREAM ECOSYSTEMS IN THE
NORTHERN RANGE MOUNTAINS OF TRINIDAD
by
TROY NATHANIEL SIMON
(Under the Direction of Catherine M. Pringle)
ABSTRACT
We are currently in the middle of the sixth mass extinction, thus predicting the
ecological consequences of species loss from communities is a high priority research
topic. Additionally, characterizing the ecosystem impact of macroconsumers has strong
conservation implications, given the global trend in biodiversity loss toward higher
trophic levels. The goal of this dissertation was to use Trinidadian guppies in the
mountain streams of Northern Trinidad as a model system to explore several potentially
important direct and indirect ecosystem effects of macroconsumers, which we have little
understanding of in natural systems. This collection of studies utilizes both localized
exclusion of macroconsumers using underwater electric fences within pools, as well as
the natural reach-scale exclusion of guppies above and below barrier waterfalls to
examine the ecosystem-level effects of macroconsumers.
Results show that local adaptation of guppy populations, to the absence of large
piscivores in higher elevation streams, shifted their top-down effects from reducing
macroinvertebrate standing stock biomass, to reducing primary producer standing stock
biomass. Additionally, the consumptive and non-consumptive effects guppies had similar
but opposing effects on algal growth and biomass, which resulted in strong treatment
effects from excluding guppies on primary algae. Finally, the loss of omnivorous guppies
from a macroconsumer assemblage can alter the strength of top down effects of the
remaining macroconsumer community on an important ecosystem-level process at both
local- and landscape-scales. Together these studies expand our understanding of how
macroconsumers alter ecosystem-level processes in natural systems.
INDEX WORDS: macroconsumer, guppy, Poecilia reticulata, streams, freshwater,
local adaptation, direct and indirect effects, biomass, macroinvertebrates, algae, consumptive and non-consumptive effects, leaf decomposition, trophic cascades

DIRECT AND INDIRECT EFFECTS OF THE GUPPY, POECILIA RETICULATA, ON
THE STRUCTURE AND FUNCTION OF STREAM ECOSYSTEMS IN THE
NORTHERN RANGE MOUNATAINS OF TRINIDAD
by
TROY NATHANIEL SIMON
B.S., Florida State University, 2010
A Dissertation Submitted to the Graduate Faculty of The University of Georgia in Partial
Fulfillment of the Requirements for the Degree
DOCTOR OF PHILOSOPHY
ATHENS, GEORGIA
2015

© 2015
Troy Nathaniel Simon
All Rights Reserved

DIRECT AND INDIRECT EFFECTS OF THE GUPPY, POECILIA RETICULATA, ON
THE STRUCTURE AND FUNCTION OF STREAM ECOSYSTEMS IN THE
NORTHERN RANGE MOUNATAINS OF TRINIDAD
by
TROY NATHANIEL SIMON
Major Professor: Catherine M. Pringle
Committee: Mary C. Freeman James F. Gilliam Amy D. Rosemond Electronic Version Approved: Suzanne Barbour Dean of the Graduate School The University of Georgia August 2015

iv
DEDICATION
This dissertation is dedicated to my Wife, Gareth Crosby and to my Son,
Benjamin Oliver Simon.

v
ACKNOWLEDGEMENTS
I would not have been able to complete this document without the help of my
advisor Catherine Pringle and the members of my committee Mary Freeman, James
Gilliam, Amy Rosemond , and Richard Shefferson. I would also like to thank the
members of the Pringle and Rosemond labs for their never-ending comments and
encouragement. Additionally there are countless field and lab technicians for which this
work would not have been possible without their huge effort. Finally and most
importantly I would like to thank my Wife, Gareth Crosby and my Parents Dennis and
Brooke Simon; without their constant encouragement and emotional support I would
never have come close to finishing my degree.

vi
TABLE OF CONTENTS
Page
ACKNOWLEDGEMENTS .................................................................................................v
LIST OF TABLES ............................................................................................................ vii
LIST OF FIGURES .............................................................................................................x
CHAPTER
1 INTRODUCTION AND LITERATURE REVIEW ............................................1
2 EXAMINING THE EFFECTS OF TRINIDADIAN GUPPIES ON THE
STRUCTURE OF THE ECOSYSTEM RELATIVE TO SYMPATRIC
MACROCONSUMERS USING AN IN SITU DENSITY MANIPULATION ...6
3 LOCAL ADAPTATION IN TRINIDADIAN GUPPIES ALTERS
ECOSYSTEM STRUCTURE IN SITU AT LOCAL- AND LANDSCAPE-
SCALES ..............................................................................................................36
4 TRINIDADIAN GUPPIES DECOUPLE A DETRITUS-BASED TROPHIC
CASCADE WHEN PRESENT IN MACROCONSUMER ASSEMBLAGES
WITHIN THE MONTANE HEADWATER STREAMS OF NORTHERN
TRINIDAD .........................................................................................................67
5 CONCLUSIONS ..............................................................................................103
6 REFERENCES .................................................................................................107
APPENDICES
A CHATER 4 ...................................................................................................113

vii
LIST OF TABLES
Page
Table 2.1: Mean estimate of physiochemical characteristics from pools across replicate
streams (n=4) for each density manipulation treatment. END= Endler Stream, QRE2
and QRE6= tributaries of the Quare River, RDN= Ramdeen Stream. Physiochemical
characteristics were measured one day after experiment was completed (April 13th
2012) ...........................................................................................................................28
Table 2.2: Guppy densities (individuals m-2) in pools across replicate streams (n=4)
before (pre-) and after (post-) each density manipulation treatment was carried out.
To account for migrations in and out of pools during our experiment, we also
estimated post-manipulation densities upon experiment completion. The average
density of guppies present in guppy Removal treatment pools during the experiment
was used to calculate the post-manipulation density after the experiment. See Table
2.1 caption for stream names associated with abbreviations ......................................29
Table 3.1: Physical and chemical parameters [mean±SE (n=7); range (min, max)] for
paired reaches examined in the landscape-scale survey and the location of our local-
scale experiment, the Caigual*. Physical and chemical parameters not measured are
denoted by §. Physical and chemical parameters for landscape-scale study were
measured one week before (April 13th-19th, 2011) biological sampling. Physical
parameters for local-scale study were calculated one day after experiments were

viii
completed for GP1KC and GP2KC reaches on 24 March 2009 and 25 May 2010,
respectively. ................................................................................................................60
Table 3.2: Bayesian model parameter estimates for each response variable measured in
landscape-scale study including: mean and standard deviation (SD), upper (97.5%)
and lower (2.5%) confidence limits (CL), and percent (%) effect size. To insure
outliers within our dataset did not heavily bias our parameter estimates, we ran our
models both with and without the top two outliers in for each response variable. We
report parameter estimates highlighted in gray, and those that were well supported by
our model are in bold. .................................................................................................61
Table 4.1: Density [No. m-2 (SE)] estimates of macroconsumers (killifish, crabs, and
guppies) from the macroconsumer exclosure experiment. Macroconsumer density
was estimated using day and night observations. Observations conducted for 10
hours per reach (n=20 observations per reach). Diurnal estimates based on pooled
visitation from 24 hr. access and daytime access treatments, while Nocturnal
estimates are based on 24 hr. access and nighttime access treatments. Bolded values
represent significant results from Kruskal-Wallis rank sum tests (P<0.05) between
diurnal and nocturnal activity.. ...................................................................................91
Table 4.2: Physiochemical characteristics [means±SE (min, max)] of pools from the
landscape study measured on the final day of the experiment. Physical characteristics
were measured in pools (n=18 replicate pools per reach type) across KCG (killifish,
crab, and guppy) and KC (killifish and crab) reaches.. ..............................................91
Table 4.3: Abundance of macroconsumers (killifish, crabs, guppies) for the landscape
study. Abundance estimated using catch per unit effort [CPUE (+SE)], for killifish
ix
and guppies, and transect observations [individuals m-1(+SE)] for crabs. CPUE
estimates were calculated during the day using two baited minnow traps, once in
each pool (n=18 replicate pools). Transect counts of crabs were conducted at night,
across 100 m length of stream, once in each reach (n=6 replicate reaches). Bolded
values represent significant differences (P<0.05) from one-way ANOVA between
KCG and KC reaches for each species respectively.. .................................................92

x
LIST OF FIGURES
Page
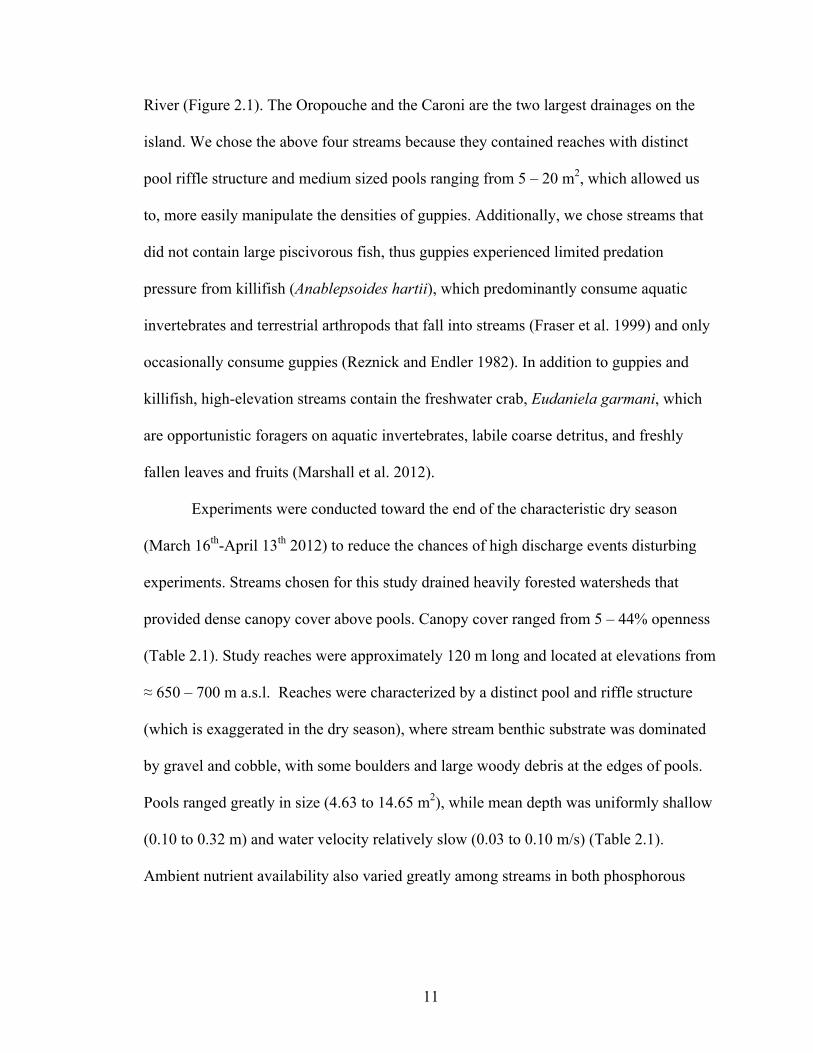
Figure 2.1:. Location of study sites in the Caroni and Oropuche drainages of Trinidad's
Northern Range (Inset A). Streams are coded by numbers (1) RDN= Ramdeen
Stream, (2) END= Endler Stream, (3) QRE2 and (4) QRE6= tributaries of the Quare
River ...........................................................................................................................32
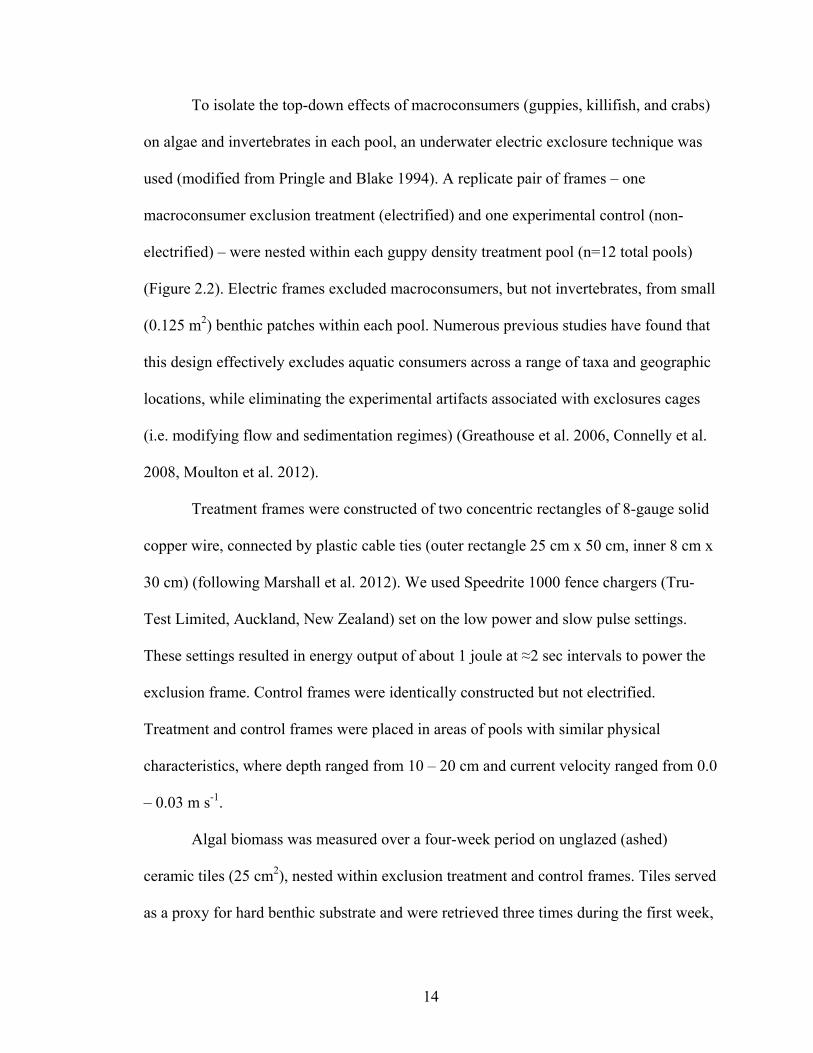
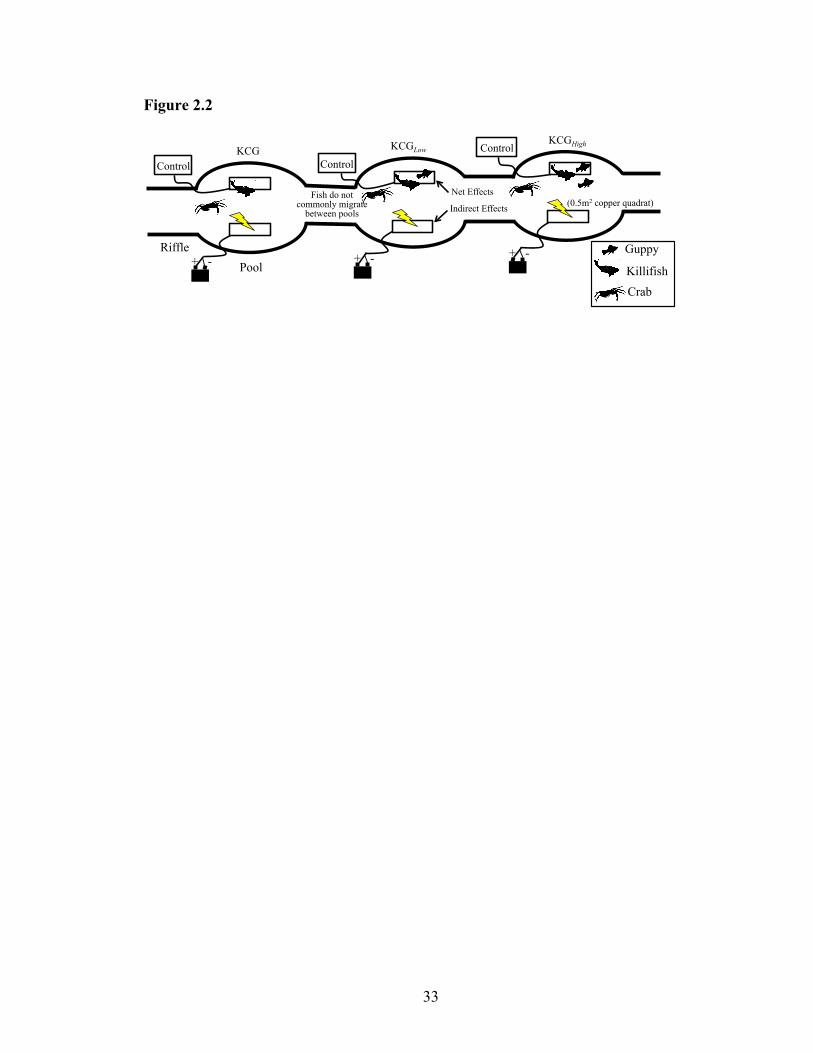
Figure 2.2: Schematic of experimental design for one block, experiment was blocked by
stream (n=4). Experimental design isolated the ecosystem effects of one species of
macroconsumer, the guppy Poecilia reticulata, from the remaining macroconsumer
assemblage (including the killifish, Anablepsoides hartii, and the crab, Eudaniela
garmani). Guppies were either removed from pools leaving only killifish and crabs
(KC) present, removed and replaced at ambient (Low) density (KCGLow), or removed
and replaced at double ambient (high) density (KCGHigh). To isolate the top-down
effects of each macroconsumer community, underwater electric fences were placed
in each pool to exclude macroconsumers from localized areas of the stream bottom
.. ..................................................................................................................................33
Figure 2.3: Mean (+SE) for the (a) biomass of total benthic invertebrate community (b)
rate of algal accrual, (c) algal biomass, and percent (%) composition of (d) nitrogen
(N) and (e) phosphorous (P) from experiment manipulating guppy density within
pools across streams (n=4). Underwater electric frames manipulated the presence
(light grey) and absence (dark grey) of all macroconsumers (killifish, crabs, guppies)

xi
within pools from localized areas of the stream bottom. Split-plot statistical analysis
investigated the interaction between macroconsumer community (whole-plot) and
macroconsumer exclusion (sub-plot) treatments to test if the effect excluding
macroconsumer depended on the presence of guppies within macroconsumer
community. We found significant interactions effects for algal accrual rate and algal
biomass, but no other ecosystem metrics. Additionally, the top-down effects of each
macroconsumer community were tested using paired T-Tests for each exclosure and
control treatments nested within pools, significant differences signified by *
(p<0.05); † (p<0.1)... ..................................................................................................34
Figure 2.4: Estimated percent (%) change caused by the per capita consumptive (dark
grey), Non-consumptive (light grey), and net (black) effects guppies on invertebrates
biomass (mg m-2), Chl a accrual rate (mg m-2/ day), Chl a biomass (mg m-2), and
percent (%) composition of phosphorous (P) and nitrogen (N) in biofilm. Per capita
effects of guppies was estimated using linear mixed effects models, where guppy
biomass was a continuous explanatory variable to estimate the biomass specific
effect of guppies which scales our output to the effect increasing density by 1
individual m-2. Positive values for percent change represent positive effects of
guppies and negative values represent negative effects. Figures show 95% credible
intervals (CI) around estimated effect sizes. Estimates where 95% CI do not include
zero are signified by *... ..............................................................................................35
Figure 3.1: Map showing subwatersheds sampled for landscape-scale study [denoted by
outlined watersheds, where either GP2 (1-4) or GP1 (5-8) guppies are located] and
local-scale experiments (denoted by a dashed subwatershed) across the Caroni

xii
drainage in Trinidad’s Northern Range mountains. The Caroni drainage contains
large sections of high-density urban areas (diamond shaded area) and rural areas with
mixed agriculture (hatch shaded area). Subwatersheds chosen for landscape study
were located in watersheds with the largest tracts of intact-forested headwaters. Inset
(B) illustrates paired reach design (above and below waterfalls) of landscape study,
where reaches below barrier waterfalls contain guppies, killifish, and crabs (GPiKC)
and reaches above waterfalls contain only killifish and crabs (KC)... .......................64
Figure 3.2: Mean (±SE) of natural log (LN) response ratio of ecosystem response
variables in two local-scale experiments conducted in macroconsumer communities
containing either (A) GP1 guppies, killifish, and crabs (GP1KC), or (B) GP2 guppies,
killifish, and crabs (GP2KC). X-axis is the response variables measure during
experiment including algal accrual rate (mg m-2/day), algal biomass (mg m-2), and
invertebrate biomass (mg m-2). Y-axis is the response ratios calculated as LN
(response variable in control/response variable in macroconsumer exclusion), where
positive values represent positive effects of macroconsumers and negative values
represent negative effects. Statistical significance is signified by * (p<0.05), **
(p<0.01).... ..................................................................................................................65
Figure 3.3: Mean ±95% Credible Intervals (CI) of percent (%) change caused by the
presence of either GP1 or GP2 guppies relative to guppy-free reaches, or the effect of
exchanging GP1 with GP2 guppies (Phenotype) on (A) algae biomass (mg m-2) and
(B) invertebrate biomass (mg m-2) from landscape-scale study. Effects of guppies
estimated using linear mixed effects models with random intercepts. Positive effect
sizes represent positive effects of guppies and negative values represent negative

xiii
effects. Parameter estimates were considered to be statistically significant if the 95%
credible interval of the estimate did not include zero, where significant parameter
estimates indicated by an asterisk (*)..... ....................................................................66
Figure 4.1: Conceptual diagram of detrital food web in streams consisting of paired
reaches containing killifish, crabs, and guppies (KCG) downstream, and killifish and
crabs (KC) upstream, where barrier waterfalls naturally limit upstream migration of
guppies. Phylloicus hansoni is a dominant macroinvertebrate detrital shredder in
these streams. Solid arrows indicate hypothesized energy movement up trophic
levels while dashed arrows represents movement within trophic level....... ...............96
Figure 4.2: Location of study sites in the Caroni drainage of Trinidad's Northern Range
(Inset A) for macroconsumer exclosure experiment (1) and the landscape study (2a-
f). Each study site consists of paired reaches (Inset B) containing killifish, crabs, and
guppies (KCG) downstream, and killifish and crabs (KC) upstream. Guppies are
naturally excluded from the upstream-most reaches by barrier waterfalls....... ..........97
Figure 4.3: Mean (+SE) for (a,b) decay rate of Cecropia peltata leaves (% mass lost day-
1) and (c,d) Phylloicus hansoni resource-specific biomass (mg dry mass g-1
Cecropia) for the exclosure experiment, where 24 hour treatments allow full
macroconsumer access [control (C)] or completely exclude macroconsumers
[electric (E)]. 12 hour treatments allow access to either diurnally active [day (D)] or
nocturnally active [night (N)] macroconsumers. Experiment conducted in reaches
containing either (a,c) killifish, crabs, and guppies (KCG), or (b,d) only killifish and
crabs (KC) and replicated in pools (n=5 per reach). Letters between bars indicate

xiv
results of post-hoc Tukey-Kramer HSD tests, with different letters indicating
significant within reach differences in pairs of means between treatments........ .......98
Figure 4.4: Bivariate fit of decay rate for leaves of Cecropia peltata (% mass lost day-1)
and Phylloicus hansoni resource-specific biomass (mg dry mass g-1 Cecropia) from
the exclosure experiment. Experiment conducted in reaches containing either (a)
killifish, crabs, and guppies (KCG), or (b) only killifish and crabs (KC) and
replicated by diel treatments in pools (n=20 per reach). Statistical significance of
correlation noted by * (P<0.05) and ** (P<0.01)........ ...............................................99
Figure 4.5: Mean (+SE) for (a) decay rate for Cecropia peltata leaves (% mass lost day-1)
and (b) Phylloicus hansoni resource-specific biomass (mg dry mass g-1 Cecropia) for
the landscape study. Landscape study conducted in streams consisting of a paired
reach containing killifish, crabs, and guppies (KCG) downstream, and killifish and
crabs (KC) upstream. Estimates of leaf decay were replicated across streams (n=6
streams per reach type). Letters between bars indicate results of one-way ANOVA,
with different letters indicating significant differences in pairs of means between
reaches......... .............................................................................................................100
Figure 4.6: Bivariate fit of decay rate for Cecropia peltata leaves (% mass lost day-1) and
Phylloicus hansoni resource-specific biomass (mg dry mass g-1 Cecropia) from the
landscape study. Study conducted in streams consisting of a paired reach containing
(a) killifish, crabs, and guppies (KCG) downstream, and killifish and (b) crabs (KC)
upstream, and replicated in pools (n=18 pool per reach type). Statistical significance
of correlation noted by * (P<0.05) and ** (P<0.01)......... ........................................101
xv
Figure 4.7: Phylloicus hansoni resource-specific biomass [mg dry mass g-1 Cecropia (+
SE)], in individual pools averaged over the 4 week landscape study. Landscape study
consisting of a reach containing killifish, crabs, and guppies (KCG, pools 1-3)
downstream, paired with a reach containing killifish and crabs (KC, pools 4-6)
upstream. Estimates of Phylloicus biomass were replicated in pools nested within
streams (n=6 streams per reach type). Individual pools were separated by at least 50
m and adjacent pools in KCG (pool 3) and KC (pool 4) reaches were separated by no
more than 100 m. Analysis showed that changes in Phylloicus biomass are not
gradual along a stream continuum between pools (p>0.5), but abrupt when
macroconsumer assemblage changes (reach effect; p<0.001)......... .........................102

1
CHAPTER 1
INTRODUCTION AND LITURATURE REVIEW
We are currently in the middle of the sixth mass extinction (Wake and
Vredenburg 2008). Biodiversity loss is predicted to disproportionally impact large-bodied
consumers, relative to species in lower tropic levels (Petchey et al. 1999, Duffy 2002),
therefore, predicting the consequences of macroconsumer loss is a high research priority
in both terrestrial and aquatic systems (Sutherland et al. 2013). Here I define
macroconsumers as species that are relatively large in their environment and therefore
have relatively low predation risk as adults. Macroconsumers have been shown to
influence ecosystem structure and function in a diversity of habitats worldwide (Estes et
al. 2011, Schmitz et al. 2014).
The bulk of research investigating macroconsumers has focused on the effects of
distinct top-consumers on lower trophic levels (Ripple et al. 2014). The removal or
introduction of predators can trigger alternating changes in the relative populations of
lower trophic levels, a phenomenon called a trophic cascade (Carpenter et al. 1985).
Classic examples include decreased algal growth via increased herbivory from minnows
following bass removal from streams (Power et al. 1985) and increases in elk populations
and changes in the biomass of quaking aspen following wolf extirpation from
Yellowstone National Park (Ripple et al. 2001). Food web theory predicts that trophic
cascades are strongest in systems with simple linear food web structure and that the
presence of omnivory can weaken otherwise strong cascades (Strong 1992, Polis and

2
Strong 1996). Because omnivores can have an effect on both prey populations and basal
resources, their ecosystem effects are often less predictable (Polis and Strong 1996,
Tanabe and Namba 2005). For example, the presence of omnivorous crayfish in
experimental lakes increased zooplankton biomass by consuming fish eggs while
simultaneously reducing the biomass of edible green algae through direct consumption
(Dorn and Wojdak 2004). In order to better understand the potential cascading ecosystem
effects of macroconsumer loss across systems, we must characterize the effects of
removing both predatory and omnivorous consumers in systems without distinct top-
consumers.
Research on the cascading effects of terrestrial macroconsumers has focused on
relatively large-bodied species (Estes et al. 2011, Ripple et al. 2014). However, in aquatic
ecosystems, such as headwater streams, small-bodied fish and crustaceans are often the
top consumers. While experimental manipulations investigating the ecosystem effects of
macroconsumers in terrestrial or larger aquatic systems can be logistically challenging,
macroconsumer manipulations are more tractable in headwater streams, and can help to
predict the effects of removing larger-bodied consumers in other systems. Beyond
translating these effects to other systems, understanding the drivers of ecosystem function
in headwater streams is significant, given their high prevalence across the landscape.
Headwater streams contribute to local-scale ecosystem processes as well as global-scale
process like the global carbon budget (Butman and Raymond 2011).
Trinidadian guppies have been a model system for evolutionary and ecological
research for more than three decades (Magurran 2005). In the Northern Range Mountains
of Trinidad, guppies are found across an elevational gradient (Liley and Seghers 1975).

3
In lower elevation reaches, guppy populations typically evolve under high predation risk
from large piscivores, notably Crenicichla spp. and Hoplias malabaricus (Reznick and
Endler 1982). Barrier waterfalls naturally limit the upstream migration of these large
predators, such that guppies, the killifish, Anablepsoides hartii, and the freshwater crab,
Eudaniela garmani, typically dominate reaches at higher elevations in the absence of
large piscivores (Marshall et al. 2012). Guppies located in high-elevation streams
(hereafter guppy phenotype-1, GP1) display distinct genetic-based differences in life-
history, color, morphology and behavior when compared to guppies from low-elevation
streams (hereafter guppy phenotype-2, GP2) (Magurran 2005).
Studying the effects of guppies on ecosystems in high elevation headwater streams
in Trinidad is ideal because they contain natural controls for the ecosystem effects of
guppies. Barrier waterfalls limit upstream colonization by guppies, such that only killifish
and crabs are found in the uppermost reaches of streams (Gilliam et al. 1993, Walsh et al.
2011). Stream reaches with killifish, crabs, and guppies (KCG reaches) and those with
only killifish and crabs (KC reaches) can be separated by a single waterfall and are often
separated by less than 200 m. As a result, reaches with these different animal
communities have similar physical habitat and environmental characteristics (Walsh and
Reznick 2009) providing a natural control for the ecosystem effects of omnivorous
guppies.
The goal of my dissertation is to use Trinidadian guppies as a model system to
explore several potentially important direct and indirect effects of macroconsumers,
which we have little understanding of in natural systems including: 1), the relative
importance of consumptive and non-consumptive effects of macroconsumers on primary

4
producers, 2) the ecosystem consequences of macroconsumer local adaptation, and 3) the
ecosystem effects of losing individual macroconsumer species from a system containing
multiple macroconsumers species.
In Chapter 2, I focus on wild populations of guppies in high elevation, low
predation risk streams, in order to investigate the importance of guppies for structuring
the ecosystem of natural streams. We nested macroconsumer exclusion treatments, within
the context of a guppy density manipulation to address two questions: (1) what are the
top-down ecosystem effects of guppies relative to the remaining macroconsumer
community in situ? And (2) how sensitive is the ecosystem to the abundance of guppies?
We hypothesized that guppies would have unique top-down effects on algal accrual rates
and biomass within the macroconsumer community, because while guppies have been
documented to consume algae, killifish and crabs are more predatory and have not been
shown to graze on algae. Additionally, we predict that while guppies in natural streams
will have consumptive effects which are similar in direction, but lower magnitude to
previous ex situ mesocosm, the non-consumptive effects of guppies observed in
mesocosms will not be observed in natural streams due to increased environmental
heterogeneity and increased water movement.
In Chapter 3, I address two questions: (1) what are the top-down ecosystem
effects of two distinct, locally adapted populations of a fish consumer (the guppy,
Poecilia reticulata) in situ? and (2) are the relative ecosystem effects of each phenotype
distinct at a landscape-scale despite high environmental variability? To address these
questions, I examine how trait variation (life history and diet selectivity), in two locally
adapted populations (GPI, GP2) of Trinidadian guppy affects stream ecosystem properties

5
in situ, at a local-scale (one stream) and a larger landscape-scale (eight streams). Because
consistent patterns in multiple other traits (life history, color, morphology, and behavior)
have been documented in natural populations, I hypothesized that the different ecological
effects of these two guppy phenotypes, previously observed in ex situ experiments, will
also occur in nature despite high levels of environmental variation at local- and
landscape- scales.
In Chapter 4, I examine how the loss of guppies from a system with multiple
macroconsumers alters top-down effects on leaf litter decomposition – a major energy
pathway in headwater streams. To address this question, we used both a mechanistic in
situ exclosure experiment and a landscape-scale study to examine the cascading effects of
macroconsumers on leaf decomposition in the context of the natural presence or absence
of guppies, below and above waterfalls. We hypothesized that if the presence of any
macroconsumer species reduced the biomass of insect shredders (particularly Phylloicus),
then macroconsumers would indirectly decrease the rate of leaf litter decomposition.
Additionally, because previous work has demonstrated that guppies and killifish are
partial intraguild predators, we predicted that the documentation of a trophic cascade
would be more likely to occur above waterfalls because the natural exclusion of guppies
should enable greater killifish predation on invertebrate shredders, resulting in lower rates
of leaf decomposition.

6
CHAPTER 2
EXAMINING THE EFFECTS OF TRINIDADIAN GUPPIES ON THE STRUCTURE
OF THE ECOSYSTEM RELATIVE TO SYMPATRIC MACROCONSUMERS USING
AN IN SITU DENSITY MANIPULATION1
1 Troy N. Simon, M.C. Freeman, A.S. Flecker, J.F. Gilliam, S.A. Thomas, J. Travis, D.N. Reznick, C.M. Pringle To be submitted to Freshwater Science

7
Introduction
Human impacts on freshwater ecosystems are more likely to reduce the
abundance of sensitive taxa rather than cause their extinction (Strayer 2010). Therefore,
characterizing the ecosystem effects of changes in the abundance of individual species
has strong conservation implications. A major challenge to understanding ecosystem
effects caused by changes in abundance of individual species is distinguishing between
effects of a single consumer species from a given consumer community, and quantifying
these species-specific effects, in situ. Isolating species-specific effects in aquatic systems
is often difficult because experimental exclusion techniques, such as cages, cannot
distinguish between consumers of a similar size and the use of large in situ enclosures is
often experimentally intractable. While some studies have overcome these challenges and
effectively isolated species-specific effects (Taylor et al. 2006), fewer studies have
isolated the effects of individual consumer species across a range of densities, in situ.
Populations of macroconsumers in the mountain streams of Trinidad provide an
opportunity to investigate the ecosystem effects of an individual macroconsumer species,
the guppy Poecilia reticulata, relative to the remaining community, which includes an
insectivorous killifish (Anablepsoides hartii) and an omnivorous freshwater crab
(Eudaniela garmani). This is an ideal study system as guppy populations can be
effectively manipulated without the use of enclosures (Reznick et al. 2012). The use of
exclosures is unnecessary for the following reasons: 1) guppies often occupy discrete
pools, 2) guppies do not frequently migrate between pools during the dry season, and 3)
pools are clear and lack vegetation, allowing researchers to effectively remove all
guppies from a pool.

8
Trinidadian guppies are a model system for understanding interactions between
evolutionary and ecosystem processes (an emerging field termed eco-evolutionary
dynamics). In high-elevation streams, guppies (hereafter guppy phenotype-1, GP1)
experience lower predation pressure than guppies from low-elevation streams (hereafter
guppy phenotype-2, GP2), and display distinct genetic-based differences in life-history,
color, morphology and behavior (Magurran 2005). Some of these traits can evolve rapidly,
in as little as four years or eight generations (Reznick et al. 1997).
Previous ex situ experiments reported that guppy phenotypes have distinct
consumptive and non-consumptive effects on ecosystem structure and function;
consumptive being the effect of guppy predation on invertebrates and algae, and non-
consumptive being changes in the physical environment of pools caused by guppies (e.g.
sediment disturbance and increases in the availability of limiting nutrients). In ex situ
common garden experiments GP1 guppies consumed significantly more algae and
significantly fewer invertebrates than GP2 guppies (Palkovacs et al. 2009, Bassar et al.
2010). Corresponding to these differences in diet, mesocosms with GP1 guppies contained
significantly lower algal biomass (Palkovacs et al. 2009, Bassar et al. 2010) and
significantly higher biomass of larval midges [(Chironomidae:Diptera) the dominant
invertebrate taxon] relative to mesocosms with GP2 guppies (Bassar et al. 2010). Non-
consumptive effects of guppies included increases in the availability of ammonium
(NH4+) via excretion, which stimulated gross primary production in mesocosms
containing guppies (Bassar et al. 2010). Additionally, GP2 guppies were found to excrete
ammonium (NH4+) at higher rates than GP1 guppies (Palkovacs et al. 2009, Bassar et al.
2010).
9
These studies strongly suggest that guppy evolution may alter the ecosystem,
which, in turn, may cause further guppy evolution, resulting in a dynamic interaction
between these two processes. In order to determine whether eco-evolutionary dynamics is
a useful framework for understanding the forces that shape the structure of an ecosystem,
as well as the evolutionary trajectories of resident consumers in this system (i.e. guppies),
we must first determine if guppies significantly alter the ecosystem relative to other
common macroconsumers present in natural streams.
Because previous ex situ mesocosm experiments greatly simplified food web
diversity by not including predatory insects as well as other macroconsumers species
naturally found with guppies, the general significance of the presence and abundance of
guppies in structuring the ecosystem in situ remains unknown. While results from a
previous in situ experiment suggested that guppies significantly altered algal accrual and
biomass, their experimental design was not able to isolate the effects of guppies from that
of the other macroconsumers present (Killifish and crabs) (Marshall et al. 2012).
Here we focus on wild populations of guppies in high-elevation, low-predation
streams, representing a single phenotype of guppy (GP1 guppies), in order to investigate
two questions: (1) what are the top-down ecosystem effects of guppies relative to the
remaining macroconsumer community (killifish and crabs) in situ? And (2) how sensitive
is the ecosystem to the abundance of guppies? To quantify the importance of guppy
browsing on algal accrual and biomass, relative to the remaining macroconsumer
community, we nested macroconsumer exclosures within pools where we categorically
manipulated guppy density. To directly characterize the sensitivity of the ecosystem to
the abundance of guppies we used continuously varying, pool-specific, guppy densities to

10
quantify the per capita effect of guppies on algal accrual rates and biomass in the context
of our macroconsumer exclosure treatments including: (1) guppy effects in control
frames (full access), which represents the Net response of the ecosystem to changes in
guppy density, (2) guppy effects in exclosure treatments which represent the Non-
consumptive ecosystem effects of changing guppy density, and (3) the treatment effects
of guppies (i.e. the difference between control and exclosure treatments) which represent
the top-down or Consumptive effects of changing guppy density.
We hypothesized that guppies would have unique top-down effects on algal
accrual rates and biomass within the macroconsumer community, because, while guppies
have been documented to consume algae, killifish and crabs are more predatory and have
not been shown to graze on algae. Additionally, we predict that while guppies in natural
streams will have consumptive effects which are similar in direction, but lower in
magnitude to previous ex situ mesocosms, the non-consumptive effects of guppies
observed in mesocosms will not be observed in natural streams due to increased
environmental heterogeneity and increased water movement.
Methods
Study Sites
Research was carried out in the high-elevation streams draining the southern
slope of Trinidad’s Northern Range Mountains. Experiments were replicated across four
streams, with two streams (QRE 2 and QRE 6) located in the headwaters of the Quare
River that drains into the Oropouche River and two streams (END and RDN) in the
headwaters of the Aripo and Arima Rivers respectively, which drain into the Caroni
11
River (Figure 2.1). The Oropouche and the Caroni are the two largest drainages on the
island. We chose the above four streams because they contained reaches with distinct
pool riffle structure and medium sized pools ranging from 5 – 20 m2, which allowed us
to, more easily manipulate the densities of guppies. Additionally, we chose streams that
did not contain large piscivorous fish, thus guppies experienced limited predation
pressure from killifish (Anablepsoides hartii), which predominantly consume aquatic
invertebrates and terrestrial arthropods that fall into streams (Fraser et al. 1999) and only
occasionally consume guppies (Reznick and Endler 1982). In addition to guppies and
killifish, high-elevation streams contain the freshwater crab, Eudaniela garmani, which
are opportunistic foragers on aquatic invertebrates, labile coarse detritus, and freshly
fallen leaves and fruits (Marshall et al. 2012).
Experiments were conducted toward the end of the characteristic dry season
(March 16th-April 13th 2012) to reduce the chances of high discharge events disturbing
experiments. Streams chosen for this study drained heavily forested watersheds that
provided dense canopy cover above pools. Canopy cover ranged from 5 – 44% openness
(Table 2.1). Study reaches were approximately 120 m long and located at elevations from
≈ 650 – 700 m a.s.l. Reaches were characterized by a distinct pool and riffle structure
(which is exaggerated in the dry season), where stream benthic substrate was dominated
by gravel and cobble, with some boulders and large woody debris at the edges of pools.
Pools ranged greatly in size (4.63 to 14.65 m2), while mean depth was uniformly shallow
(0.10 to 0.32 m) and water velocity relatively slow (0.03 to 0.10 m/s) (Table 2.1).
Ambient nutrient availability also varied greatly among streams in both phosphorous

12
(2.45 to 40.50 µg L-1) and nitrate + nitrite (52.48 to 231.45 µg L-1) concentrations (Table
2.1).
Experimental Design
We manipulated the density of guppies in pools, across steams. The goal of the
density manipulation was to produce a range in guppy densities (that could naturally
occur between years due to storm events), and document their effect on algal accrual and
biomass in pools. Guppy survival has been shown to decrease when the frequency and
intensity of floods increases (Fitzpatrick et al. 2014). The 2011-12 rainy season that
preceded our study included several large storm events, which were observed to depress
guppy populations in multiple streams in Northern Trinidad (D.N.R unpublished data).
Therefore, our experimental manipulation included an increase in guppy densities to
reflect densities in years with less extreme discharge events. The resulting densities
reflected what has been considered average low and high densities expected for guppy
populations in the headwater stream of Northern Trinidad (Bassar et al. 2010).
In each replicate stream, three pools were selected that had defined riffles at the
upstream and downstream end of each pool, which acted to reduce guppy migration
between pools (Reznick et al. 2012). In headwater steams, guppies preferentially occupy
pools and have relatively low migration rates from one pool to the next (Reznick et al.
2012). Pools were randomly assigned to three macroconsumer community treatments: (1)
complete guppy removal leaving only killifish and crabs (KC) in pools, which were then
checked every two days to record and remove any immigrant guppies; (2) pools where all
guppies were removed and then added back at ambient densities leaving killifish, crabs,
and guppies, which we considered a low guppy density treatment as stated above

13
(KCGLow); and (3) pools where all guppies were removed and added back at double
ambient density leaving killifish, crabs, and guppies at high densities (KCGHigh).
Treatment pools were separated by at least 40 m to reduce the possible downstream
effects of upstream manipulations.
Guppy densities were manipulated using previously described methods (Reznick
et al. 2012). Guppies were collected from pools using butterfly nets and capture
techniques that allowed us to avoid standing in the pool, thus limiting our disturbance of
the benthic habitat. Captured guppies were immediately placed in buckets of stream
water. Guppies were easily captured from clear pools, due to the lack of vegetation, and
because they are attracted to the minor sediment disturbance caused by maneuvering nets.
In the field and immediately after collection, guppies were lightly anaesthetized with MS-
222, measured (standard length), placed in millimeter size classes for each sex, and
weighed to the nearest milligram. We used 1 mm size classes ranging from 12 to 28 mm.
Individuals <12mm were classified as immature. For Low and High density treatments,
collected fish were returned to their original pools after, all were counted and weighed. In
order to increase guppy density without changing the size and sex distribution of the
original population, guppies added to the High density treatment were matched to the
millimeter size categories (for each sex) recorded from the original guppy population of
the given pool (methods detailed in Reznick et al. 2012). Finally, to account for
migrations in and out of pools, we estimated post-manipulation densities, both before the
experiment began and upon experiment completion, (when we again removed, counted,
measured and weighed all guppies in each experimental pool).
Macroconsumer Exclusion
14
To isolate the top-down effects of macroconsumers (guppies, killifish, and crabs)
on algae and invertebrates in each pool, an underwater electric exclosure technique was
used (modified from Pringle and Blake 1994). A replicate pair of frames – one
macroconsumer exclusion treatment (electrified) and one experimental control (non-
electrified) – were nested within each guppy density treatment pool (n=12 total pools)
(Figure 2.2). Electric frames excluded macroconsumers, but not invertebrates, from small
(0.125 m2) benthic patches within each pool. Numerous previous studies have found that
this design effectively excludes aquatic consumers across a range of taxa and geographic
locations, while eliminating the experimental artifacts associated with exclosures cages
(i.e. modifying flow and sedimentation regimes) (Greathouse et al. 2006, Connelly et al.
2008, Moulton et al. 2012).
Treatment frames were constructed of two concentric rectangles of 8-gauge solid
copper wire, connected by plastic cable ties (outer rectangle 25 cm x 50 cm, inner 8 cm x
30 cm) (following Marshall et al. 2012). We used Speedrite 1000 fence chargers (Tru-
Test Limited, Auckland, New Zealand) set on the low power and slow pulse settings.
These settings resulted in energy output of about 1 joule at ≈2 sec intervals to power the
exclusion frame. Control frames were identically constructed but not electrified.
Treatment and control frames were placed in areas of pools with similar physical
characteristics, where depth ranged from 10 – 20 cm and current velocity ranged from 0.0
– 0.03 m s-1.
Algal biomass was measured over a four-week period on unglazed (ashed)
ceramic tiles (25 cm2), nested within exclusion treatment and control frames. Tiles served
as a proxy for hard benthic substrate and were retrieved three times during the first week,

15
and then weekly for the remainder of each experiment. Algal accrual rates were
calculated using a linear fit across the entire 28-day experiment (mg Chl a m-2 day-1); day
28 biomass was sampled from a large tile (100 cm2) in order to better characterize final
standing stock biomass. Algal biomass was calculated using chlorophyll a fluorescence,
measured with a Turner Aquafluor handheld fluorometer (Turner Designs, Inc.,
Sunnyvale, CA, USA) fitted with a chlorophyll a-specific wavelength channel, on
replicated aliquots of extracted material scraped from tiles (detailed in Marshall et al.
2012). In addition to algal biomass, on day 28 we collected all material accrued on tiles,
which were collected and dried onto glass fiber filters in order to measure relative
nutrient content (on day 28). The biofilm nitrogen content (%N) was measured using a
Carlo Erba 1500 CHN analyzer (Milan, Italy). Phosphorus (%P) content of the biofilm
was determined using the plant dry ash/acid extraction method (Allen 1974) followed by
colorimetric analysis of the extracted solution using an Alpkem Rapid Flow Analyzer 300
(Alpkem, College Station, TX, USA).
To determine the possible effects of macroconsumers on aquatic invertebrates we
sampled invertebrates on a single large unglazed tile (100 cm2; same tile material as algal
biomass) on day 28 in order to quantify total invertebrate biomass. Invertebrate samples
were dyed with Rose Bengal stain for 24 hours and sorted. All invertebrates > 1 mm were
counted and identified to the lowest taxonomic resolution possible (usually genus, except
for midge taxa) using taxonomic keys by Merritt et al. (2008) and Perez (1988). Length-
mass (Benke et al. 1999, Becker et al. 2009) and volume-mass (Feller and Warwick
1988) regressions were used to generate biomass values for insects and non-insect
invertebrates, respectively.

16
Statistical Analysis
Isolating the top-down effects of guppies relative to remaining macroconsumer
community: This experiment followed a split-plot design where guppy density
represented the whole-plot treatment (n=3) and macroconsumer exclosure was the sub-
plot treatment (n=2) (Figure 2.3). Experimental treatments were blocked by stream (n=4)
in order to account for differences between streams, among experimental treatments (e.g.
ambient nutrient availability or biofilm community composition). Significance testing
was conducted with an analysis of variance (ANOVA) using two factors (macroconsumer
community and exclosure treatment) with three and two levels respectively: (1) killifish
and crabs guppies removed (KC), (2) killifish, crabs, and guppies at low density
(KCGLow), (3) killifish, crabs, and guppies at low density (KCGHigh) and (1)
macroconsumer exclosure and (2) control. Significant effects of guppies versus the rest of
the macroconsumer community (killifish and crabs) on each response variable
(invertebrate biomass, algal accrual rate, algal biomass, and biofilm %N and %P) were
determined by analyzing the interaction between the whole-plot treatment (guppy
density) and the sub-plot treatment (exclosure). A significant effect of exclosure would
show that macroconsumers affected a given response variable regardless of the density of
guppies. The effect of macroconsumer community is not a treatment effect of interest,
because it combines the effect of excluding and allowing macroconsumers access to
frames, therefore results will not be discussed. Additionally, to determine the significance
of the top-down effects of each macroconsumer community used Paired T-Tests for each
exclosure and control treatments nested within pools. In order to meet the assumption of

17
normality required by ANOVA, all data was natural-log transformed before statistical
analysis.
Estimation of per capita effects of guppies: We used a mixed effects linear
regression to estimate the effects of continuously varying guppy density across pools. To
account for possible changes in guppy density across the experimental period, we used
the average of the total density measured at the beginning and end of the experiment. The
response variables examined by linear regression were, treatment-frame specific algal
accrual rate (mg Chl a m-2 day-1) and day-28 biomass (mg Chl a m-2), invertebrate
biomass (mg DM m-2), and biofilm percent (%) composition of N and P. We applied
natural-log transformations to each response variable. Our analysis nested
macroconsumer exclosure and control treatments within streams to account for algal
differences among streams, not explained by covariates (modeled as a random effect on
the intercept). Pool-specific guppy densities were used as covariates to estimate the per
capita effect of guppies, which scaled the output to the effect, increasing density by 1
individual m-2. Additionally our model was crossed with either macroconsumer access
(controls) or macroconsumer exclusion, to estimate, respectively, net and non-
consumptive effects of guppies across pools on each ecosystem response variable. The
resulting regression equations took the form:
Responseij = αi + β_Net*Guppy_Densityj*Controlj + β_Non-
consumptive*Guppy_Denistyj* Exclusionj + residual_errror
where Responseij was the frame-specific measure for the response variable, αi was the
stream-specific intercept, Guppy Densityj was the guppy density associated with each
treatment frame, and Controlj and Exclusionj were set to 1, respectively, for control and

18
exclusion frames and to 0 otherwise. The terms β_net and β_Non-consumptive were the
estimated net and non-consumptive guppy effects. The guppy top-down consumptive
effect (or treatment effect) was estimated as the difference between β_net and β_Non-
consumptive.
To facilitate simple estimation of net, consumptive, and non-consumptive guppy
effects and associated uncertainty, we fit the linear models using a Bayesian framework.
Priors for parameter values were specified as normal distributions with a mean of 0 and a
precision of 0.001. Priors for standard deviations of the stream effect and residuals were
specified as uniform distributions between 0 and 100. The model derived a posterior
distribution for the top-down effects of guppies (means and 95% credible intervals) as the
difference between net (exclusion control frames) and non-consumptive (exclusion
treatment frames) effects. We ran three independent Markov chain Monte Carlo (MCMC)
chains of 20000 iterations with a thinning rate of 2 and burn-in of 1000. Convergence
was assessed using the Rhat potential scale reduction factor (Gelman 2007). Model fitting
was implemented in JAGS v. 3.2 through R package R2jags (Plummer 2003). We
considered parameter estimates to be statistically significant if the 95% credible interval
of the estimate did not include zero.
Results
Guppy density manipulation
Our categorical experimental manipulations of guppy populations effectively
altered the densities of guppies in pools (Table 2.2) and mirrored the expected mean high
and low densities of guppies reported in previous studies (Bassar et al. 2010). Densities

19
of guppies in our removal killifish and crab (KC) only treatments were reduced on
average from 9.04 individuals m-2 before our manipulation to 0.17 individuals m-2 during
the course of our experiment. Guppy densities in our killifish, crab, and low guppy
density treatment (KCGLow) treatments guppies were on average 7.09 individuals m-2 at
the start of the experiment and increased to 8.41 individuals m-2 by the end of our
experiment. In our killifish, crab, and high guppy density treatment (KCGHigh)
treatments, we increased densities on average from 7.82 individuals m-2 to 14.77
individuals m-2, and as expected, densities decreased during the course of the experiment
to 12.54 individuals m-2.
Isolating the top-down effects of guppies relative to remaining macroconsumer
community
The split plot ANOVA analysis showed that guppies were the only
macroconsumer to affect algal accrual rate and algal biomass. However, while guppy
browsing on tiles negatively affected algal accrual rate and biomass, guppies did not
consistently affect invertebrate biomass or %N and %P of tile material. We found a
significant interaction between macroconsumer exclusion and guppy density treatments
on algal accrual (F2,12=4.34, p<0.05) and algal biomass (F2,12=5.79, p<0.05) (Figure
2.3b,c), but not on %N and %P, or invertebrate biomass (Figure 2.3a,d,e). In KC pools
where guppies were removed, algal accrual rate and biomass was similar whether
remaining macroconsumers (killifish and crabs) were excluded or allowed access to tiles
(p>0.5; t-test), suggesting that killifish and crabs did not strongly affect algal accrual or
biomass. However, algal accrual rate and biomass tended to be 2.5- and 3- fold higher
[non-significantly (p<0.1)], respectively when macroconsumers were excluded in

20
KCGLow treatments and approximately 3- and 4- fold higher (p<0.05; t-test), respectively
when macroconsumers were excluded in the KCGHigh treatments.
Additionally, the effect of excluding macroconsumers without accounting for
guppy density significantly reduced algal accrual (F1,12=6.72, p<0.05), %N (F1,12=8.24,
p<0.05) and %P (F1,12=14.09, p<0.01) of accrued tile material, and had no effect on algal
biomass or invertebrate biomass. No significant block effects were detected among
streams for all response variables except %P (F3,6=15.38, p<0.01). Finally we found no
significant effect for macroconsumer community regardless of exclosure treatment
(p>0.1) for any response variables, however this was not a treatment effect of interest,
because it does not take into account effect of excluding macroconsumers.
Estimation of per capita effects of guppies
Regression models showed that although guppies had strong negative top-down
consumptive effects on algal accrual and biomass, a nearly equal and opposing positive
non-consumptive effect of guppy excretion on algae accrual rate and biomass resulted in
negative but non-significant (with 95% CI overlapping zero) net per capita effect of
guppies on algal accrual rate and biomass (Figure 2.4). The per capita consumptive
effects of guppies significantly (95% credible intervals not overlapping zero) reduced
algal accrual rates by 10.2% and biomass by 8.4%, while non-consumptive effects
simultaneously increased accrual rates by 7.5% and biomass by 7.6%. Net per capita
effects of guppies tended to be negative, however, there was large uncertainty
surrounding this estimate (95% credible interval overlapping zero -10.1% and 3.2% and -
8.4% and 5.8%, respectively). Additionally, the consumptive effects of increasing guppy
density reduced %P on accrued tile material by 2.8% and %N by 0.9%, while non-

21
consumptive effects increased %P by 3.5% and %N by 0.9% on material accrued on tiles,
resulting in no significant net effects of guppy biomass on either %N or %P. Finally
models showed no significant effects (net, consumptive, or non-consumptive) of
increasing guppy biomass on total invertebrate biomass across replicate pools (Figure
2.4).
Discussion
Effects of guppies relative to remaining macroconsumer community
We found strong evidence that guppy grazing of biofilms dominated the top-down
effects of macroconsumers on algal accrual rate and algal biomass consistently across
four streams in Northern Trinidad. While excluding macroconsumers from tiles had no
treatment effect on algal accrual and biomass when guppies were removed,
macroconsumer communities with low and high densities of guppies tended to reduce
algal accrual and biomass, however these effects were only strongly significant at high
guppy density. Additionally, we found no evidence for top-down control of invertebrates
by any macroconsumer present in this system. These findings are similar to conclusions
from previous in situ experiments in this system, which reported no top-down effects on
invertebrates and negative top-down effects on algal accrual biomass in stream reaches
with killifish, crabs, and guppies (Marshall et al. 2012). Moreover, we found negative per
capita, top-down effects of guppies, which further supports our findings that guppies are
a key macroconsumer in this system. Given that life history evolution in guppies results
in different population growth rates and densities, these results suggest that eco-
evolutionary dynamics could be a useful framework for understanding both what shapes

22
the structure of the ecosystem as well as what shapes the evolutionary trajectories of
resident consumers (i.e. guppies).
Several studies have examined the potential for one species of macroconsumer to
dominate a particular ecosystem function relative to other resident macroconsumers. For
example, field experiments isolating the effects of the armored catfish, Prochilodus
mariae, from a diverse fish community in a tropical river, strongly suggested that there
was no functional redundancy for the large detritivor at either the patch scale (Flecker
1996) or the reach scale (Taylor et al. 2006). Similarly, Connelly et al. (2008) found that
tadpoles dominated the top-down effects on algal populations and that sympatric fish or
macroinvertebrate did not fill this functional role after tadpoles were extirpated by
disease.
The above studies provide strong evidence for a lack of functional redundancy of
key consumers within communities; however, several studies have shown that multiple
species can hold similar functional roles. For example, Pringle and Hamazaki (1998)
found that both shrimp and fish species had negative top-down effects on several
measures of stream ecosystem structure including algal and invertebrate biomass.
Similarly, Schofield et al. (2008) predicted that the extirpation of obligate benthic
insectivores would release benthic macroinvertebrate from top-down control, yet counter
to this prediction they found that the remaining fish community maintained top-down
control after the loss of the specialist species. Together, these results suggest that
predicting the functional redundancy of a species within a community is often difficult
and does not merely depend on the diversity of species or of the presence of species that
appear to be specialists.
23
Our results suggested that guppies hold a unique role within macroconsumer
communities especially when found at high densities. While we did not find strongly
significant effects of guppies at low densities, this was likely caused by our relatively
small sample size (four replicate streams). Given that the effects of guppies at low
densities are consistent with effects reported in previous in situ experiments, it is likely
that these results would be significant with increased replication. Of the four pools
sampled for the low-density treatment, three had strong negative effects, while one had
positive effects, which was likely due to a sloughing event that reduced the biomass of
algae remaining on the tiles in exclosures. Moreover, a previous in situ study found
experimental evidence that guppies, at densities even lower than our low-density
treatment, had significant negative top-down effects on algal accrual and biomass
(Marshall et al. 2012).
Per Capita Effects of Guppies
Counter to our prediction, in addition to a negative per capita consumptive effect
of guppies on algal accrual and biomass we found positive per capita non-consumptive
effects of guppies. Knoll et al. (2009) and Capps et al. (2014) found that grazing by
armored catfish (Ancistrus triradiatus and Loricariidae: Pterygoplichthys, respectively)
depressed algal biomass, while catfish-mediated nutrient excretion enhanced algal
biomass within grazing exclosures. We report similar consumptive and non-consumptive
effects of guppy density on algal accrual and biomass and several lines of evidence
suggest that non-consumptive effects were a consequence of guppy excretion stimulating
algal biomass accrual. First, we found that the non-consumptive effect of increasing
guppy density increased %P and %N of material accruing on tiles with algae, which

24
strongly suggests that in the absence of grazing, increasing the density of guppies
increased nutrient availability on tiles. Second, a previous ex situ experiment found that
the presence of guppies in mesocosms increased ambient N and P flux in the water
column, again suggesting guppies increased nutrient availability (Bassar et al. 2010).
Third, previous in situ work has shown that excretion by guppies can contribute 30% of
biofilm nitrogen demand, suggesting that guppy excretion may be an important
component of nutrient cycling in natural streams (Marshall in prep).
Sterner (1986) showed that zooplankton remineralisation of nitrogen (N) and
phosphorous (P) stimulated algal reproductive rates as strongly as increased mortality
from zooplankton grazing, resulting in no net effect of zooplankton on phytoplankton in
the water column of a pond. Similarly, our results suggest that both guppy excretion and
consumption had strong effects on algae, which resulted in reduced net per capita effects
of guppies on algal biomass accruing on benthic tiles in a headwater stream. This result
was surprising and counter to our prediction that the net effects of increasing guppy
density on algal accrual and biomass in pools would be strongly negative due to large
consumptive effects. However, we caution against interpreting this non-significant effect
to mean there is no net effects of guppies on algal biomass in this system. Instead we
suggest that the trend toward negative net effects of guppies on algae would be stronger
with increased replication, which would reduce the uncertainty surrounding our estimate.
Additionally, it is possible that algal biomass was too coarse of an ecosystem response
for the effects of guppy grazing on primary producers given our limited replication.
While we found large variability surrounding the net per capita effects of guppies
on algal biomass accrual, guppy browsing on tiles could have resulted in more consistent
25
effects on biomass-specific algal primary productivity and algal community structure. For
example, tadpole grazing on benthic algae in a tropical stream has been shown to increase
biomass-specific net primary production by removing less productive algal cells
(Connelly et al. 2008). Additionally, previous ex situ studies in our system reported that
guppy grazing in mesocosms stimulated biomass-specific gross primary production
(Bassar et al. 2010). Therefore, further research is needed to examine these effects on
biomass-specific primary productivity and algal community composition in order to fully
characterize the net per capita effects of guppies on primary producers.
We wish to note that although we found significant per capita top-down effects of
guppies on %N and %P using linear models, we did not detect a treatment effect of
adding guppies to macroconsumer communities on N and P in our split-plot ANOVA
analysis. However, the disjoint in the results of our two statistical analyses may not be
surprising given that the effect of consumers on N and P content are likely to be directly
linked to actual guppy densities rather than a categorical manipulation of high or low
densities. Additionally our inability to detect significant effects using our ANOVA
analysis may again have been a consequence of low replication. Of the 12 pools sampled,
the 3 largest positive effects of excluding macroconsumers on %N and %P were found in
pools containing Ambient or >Ambient guppy densities, providing some evidence that
the presence of guppies can alter biofilm nutrient content.
Conclusions
Few studies have isolated the species-specific ecosystem effects of a
macroconsumer community in the context of an unconstrained, in situ, density
manipulation. Not only did this approach allow us to compare the relative top-down

26
effects of guppies to that of killifish and crabs, but also estimate the per capita ecosystem
effects of guppies. By estimating the per capita effects of guppies we found that guppies
can also simultaneously stimulate algal biomass accrual and that the opposing
consumptive and non-consumptive effects can decrease the overall net effects of guppies
on algal accrual and biomass. Moreover, these results have strong implications for our
understanding of the interactions between ecological and evolutionary interactions in this
model system. We found that the effects of one phenotype of guppy (GP1 guppy) are
similar in both ex situ mesocosm and in situ experiments, which strongly suggests that
the ecosystem effects of trait evolution observed in mesocosms could occur in natural
streams.

27
Acknowledgements
We thank T. Mcdevitt-Galles for his help during field sampling; this work would not
have been possible without his heroic effort. We thank K. Murray, C. Nguyen, A.
Snellgrove, and E. White for their help processing samples in the lab. We thank P.
Bumpers, D. Manning and the members of the Pringle Lab for their extensive manuscript
comments. We thank the Water and Sewage Authority of Trinidad and Tobago, the
University of the West Indies at St. Augustine, and the Asa Wright Nature Centre for
permission to access various sites and for use of facilities. The authors appreciate the help
and support of Jogie Ramlal and the Ramlal family. This work was supported by a
National Science Foundation Frontiers in Integrative Biological Research (FIBR) Grant
to DNR and others (NSF-FIBR, DEB-0623632) and the NSF Graduate Research
Fellowship program (fellowship to TNS).

28
Table 2.1: Mean estimate of physiochemical characteristics from pools across replicate
streams (n=4) for each density manipulation treatment. END= Endler Stream, QRE2 and
QRE6= tributaries of the Quare River, RDN= Ramdeen Stream. Physiochemical
characteristics were measured one day after experiment was completed (April 13th 2012).
Table 1: Mean estimate of physiochemical characteristics from pools across replicate streams (n=4) for each macroconsumer community where guppies were either removed from pools leaving only killifish and crabs (KC), removed and replaced at ambient density (KCGAmbient), or removed and replaced at double ambient density (KCG2xAmbient). Physiochemical characteristics were measured one day after experiment was completed (April 13th 2012).
Physiochemical Characteristics
Macroconsumer Community Stream Area (m2) Canopy
Openness Depth (m) Velocity (m/s) P (µg L-1) NO3
- + NO2-
(µg L-1)
KC END 8.74 30.42 0.18 0.05 2.45 150.98 QRE2 9.74 8.49 0.32 0.07 3.58 55.64 QRE6 7.15 7.73 0.15 0.03 2.04 52.48 RDN 4.63 10.19 0.15 0.04 40.50 231.55 Mean (SE) 7.56 (1.11) 14.21 (5.43) 0.20 (0.04) 0.05 (0.01) 12.14 (9.46) 122.66 (42.89)
KCGLow END 6.75 17.51 0.23 0.08 5.11 125.73 QRE2 12.66 14.43 0.17 0.04 3.17 59.50 QRE6 11.64 6.24 0.14 0.05 2.45 57.00 RDN 5.59 7.45 0.23 0.06 26.98 198.25 Mean (SE) 9.16 (1.76) 11.41 (2.72) 0.19 (0.02) 0.06 (0.01) 9.43 (5.88) 110.12 (33.41)
KCGHigh END 9.03 44.13 0.13 0.10 2.86 113.73 QRE2 14.65 7.13 0.10 0.05 6.95 60.40 QRE6 5.16 13.87 0.10 0.03 5.72 64.91 RDN 12.86 5.20 0.12 0.06 25.03 166.71 Mean (SE) 10.42 (2.11) 17.58 (9.04) 0.11 (0.01) 0.06 (0.01) 10.14 (5.04) 101.44 (24.88)

29
Table 2.2: Guppy densities (individuals m-2) in pools across replicate streams (n=4)
before (pre-) and after (post-) each density manipulation treatment was carried out. To
account for migrations in and out of pools during our experiment, we also estimated post-
manipulation densities upon experiment completion. The average density of guppies
present in guppy Removal treatment pools during the experiment was used to calculate
the post-manipulation density after the experiment. See Table 2.1 caption for stream
names associated with abbreviations.
Table 2: Guppy density in each macroconsumer community treatment across replicate streams (n=4) before (pre-) the density manipulation and at the start and end of the experiment. KC treatment pools were checked for guppies every two days and any individuals found were counted and removed. The average density of guppies which migrated into KC treatment pools during the experiment was used to calculate the post-manipulation density after the experiment.
Guppy Density (indiv. m-2) [Mean (SE)]
Macroconsumer Community Stream Pre-Manipulation Experiment Start Experiment End
KC END 6.63 0.00 0.22
QRE2 3.69 0.00 0.14
QRE6 8.53 0.00 0.11
RDN 17.30 0.00 0.20
Mean (SE) 9.04 (2.93) 0.00 (0.00) 0.17 (0.02)
KCGLow END 4.74 4.74 6.52
QRE2 5.61 5.61 6.08
QRE6 8.34 8.34 8.51
RDN 9.66 9.66 12.53
Mean (SE) 7.09 (1.15) 7.09 (1.15) 8.41 (1.59)
KCGHigh END 7.65 15.29 8.19
QRE2 5.46 10.31 8.14
QRE6 3.49 6.20 18.66
RDN 14.69 27.29 15.29
Mean (SE) 7.82 (2.44) 14.77 (4.57) 12.54 (2.26)

30
Figure Legends
Figure 2.1: Location of study sites in the Caroni and Oropuche drainages of Trinidad's
Northern Range (Inset A). Streams are coded by numbers (1) RDN= Ramdeen
Stream, (2) END= Endler Stream, (3) QRE2 and (4) QRE6= tributaries of the
Quare River.
Figure 2.2: Schematic of experimental design for one block, experiment was blocked by
stream (n=4). Experimental design isolated the ecosystem effects of one species
of macroconsumer, the guppy Poecilia reticulata, from the remaining
macroconsumer assemblage (including the killifish, Anablepsoides hartii, and the
crab, Eudaniela garmani). Guppies were either removed from pools leaving only
killifish and crabs (KC) present, removed and replaced at ambient (Low) density
(KCGLow), or removed and replaced at double ambient (high) density (KCGHigh).
To isolate the top-down effects of each macroconsumer community, underwater
electric fences were placed in each pool to exclude macroconsumers from
localized areas of the stream bottom.
Figure 2.3: Mean (+SE) for the (a) biomass of total benthic invertebrate community (b)
rate of algal accrual, (c) algal biomass, and percent (%) composition of (d)
nitrogen (N) and (e) phosphorous (P) from experiment manipulating guppy
density within pools across streams (n=4). Underwater electric frames
manipulated the presence (light grey) and absence (dark grey) of all
macroconsumers (killifish, crabs, guppies) within pools from localized areas of

31
the stream bottom. Split-plot statistical analysis investigated the interaction
between macroconsumer community (whole-plot) and macroconsumer exclusion
(sub-plot) treatments to test if the effect excluding macroconsumer depended on
the presence of guppies within macroconsumer community. We found significant
interactions effects for algal accrual rate and algal biomass, but no other
ecosystem metrics. Additionally, the top-down effects of each macroconsumer
community were tested using paired T-Tests for each exclosure and control
treatments nested within pools, significant differences signified by * (p<0.05); †
(p<0.1).
Figure 2.4: Estimated percent (%) change caused by the per capita consumptive (dark
grey), Non-consumptive (light grey), and net (black) effects guppies on
invertebrates biomass (mg m-2), Chl a accrual rate (mg m-2/ day), Chl a biomass
(mg m-2), and percent (%) composition of phosphorous (P) and nitrogen (N) in
biofilm. Per capita effects of guppies was estimated using linear mixed effects
models, where guppy biomass was a continuous explanatory variable to estimate
the biomass specific effect of guppies which scales our output to the effect
increasing density by 1 individual m-2. Positive values for percent change
represent positive effects of guppies and negative values represent negative
effects. Figures show 95% credible intervals (CI) around estimated effect sizes.
Estimates where 95% CI do not include zero are signified by *.

32
Figure 2.1
5 km
Caroni
Island of Trinidad
Northern Range
(A)
Arip
o
4 2
3 1
Figure 2: Location of study sites in the Caroni and Oropuche drainages of Trinidad's Northern Range (Inset A). Streams are coded by numbers (1) RDN= Ramdeen Stream, (2) END= Endler Stream, (3) QRE2 and (4) QRE6= tributaries of the Quare River.
Oropuche
33
Figure 2.2
KCG
Killifish
Guppy
KCGLow
Riffle
Pool
KCGHigh
Control Control
+ -
(0.5m2 copper quadrat) Fish do not
commonly migrate between pools
Control
+ - + -
Crab
Net Effects
Indirect Effects
Figure 2: Schematic of experimental design for one block, experiment was blocked by stream (n=4). Experimental design isolated the ecosytem effects of one species of macroconsumer, the guppy Poecilia reticulata, from the remaining macroconsumer assemblage (including the killifish, Anablepsoides hartii, and the crab, Eudaniela garmani). Guppies were either removed from pools leaving only killifish and crabs (KC) present, removed and replaced at ambient (Low) density (KCGLow), or removed and replaced at double ambient (high) density (KCGHigh). To isolate the top-down effects of each macroconsumer community, underwater electric fences were placed in each pool to exclude macroconsumers from localized areas of the stream bottom.

34
Figure 2.3
0
50
100
150 Control'
Exclosure'
0
0.1
0.2
0.3
0.4
0.000
0.025
0.050
0.075
Removal Ambient >Ambient
0
25
50
75
Chl
a B
iom
ass
(mg
m-2
)
Bio
film
% N
B
iofil
m %
P
(c)
(d)
(e) In
verte
brat
e B
iom
ass
(mg
m-2
) (a)
0
1
2
3
Removal Ambient >Ambient
Chl
a A
ccru
al (m
g m-2
day
-1)
(b)
KC KCGLow KCGHigh
Macroconsumer Assemblage
KC KCGLow KCGHigh
Macroconsumer Assemblage
*
*
†

35
Figure 2.4:
-20
-15
-10
-5
0
5
10
15
20
Algal Accrual Algal Biomass Invertebrate Biomass
% P %N
Consumptive
Non-consumptive
Net
% C
hang
e in
Res
pons
e Va
riabl
e '
Ecosystem Response Variables'
*'
*'
*'
*'
*'
*'
*'
*'

36
CHAPTER 3
LOCAL ADAPTATION IN TRINIDADIAN GUPPIES ALTERS ECOSYSTEM
STRUCTURE IN SITU AT LOCAL- AND LANDSCAPE- SCALES2
2 Troy N. Simon, M.C. Freeman, A.J. Binderup, M.C. Marshall, R.D. Bassar, A.S. Flecker, J.F. Gilliam, S.A. Thomas, J. Travis, D.N. Reznick, C.M. Pringle To be submitted to Ecology Letters

37
Abstract
In this paper we address two questions: (1) what are the top-down ecosystem
effects of two distinct, locally adapted populations of a fish consumer (the guppy,
Poecilia reticulata) in situ? and (2) are the relative ecosystem effects of each phenotype
distinct at a landscape-scale despite high environmental variability? First, we
experimentally assessed how each guppy phenotype (abbreviated here as GP1, GP2)
affected algal primary producers and invertebrate consumers in situ, in paired reaches of
one headwater stream. We then measured algal and invertebrate biomass in paired
reaches of seven additional streams within the larger drainage that differ in terms of the
presence of GP1 or GP2 guppies.
Experiments demonstrated that each guppy phenotype had significant top-down
effects on different aspects of the ecosystem. GP1 guppies significantly reduced algal
accrual rates by 18% (SE±6%) and biomass by 52% (±31%), and had highly variable,
non-significant effects on invertebrate biomass, which, on average, reduced biomass by
49% (±470%). GP2 guppies significantly reduced biomass of invertebrates by 84%
(±74%), but not algae accrual or biomass; on average algal accrual rates were reduced by
4% (±11%), and biomass by 8% (±10%).
In our expanded landscape-scale assessment we found similar negative effects of
GP1 and GP2 guppies on algal and invertebrate biomass, respectively, yet our ability to
distinguish between the effects of each phenotype was much stronger for algal biomass
relative to invertebrate biomass. We found that the effect of replacing GP2 with GP1
guppies resulted in a significant reduction in algal biomass [Mean (Lower and Upper
95% Credible Intervals) -34% (-53%, -12%)]; however, we did not detect a significant
38
phenotype effect on invertebrate biomass despite a strong trend toward a positive effect
(43% (-10%, 114%). Additionally, we found that the effect of exchanging guppy
phenotypes on algal biomass was comparable to the effect of increasing canopy openness
by one standard deviation of the values measured across the landscape (equivalent to
40% of the observed variation). These findings demonstrate that divergent local
adaptation can be ecologically significant relative to an important environmental driver at
the landscape-level.
Introduction
G.E. Hutchinson’s classic essay The Ecological Theater and the Evolutionary Play
(1965) provides a conceptual framework for the field of evolutionary ecology. Hutchinson
used a metaphor to illustrate how ecology drives evolution: the “ecological theater”
provides the “stage design” (niche), to which the “evolutionary play” tailors the “actors”
(organisms). Recent experimental evidence has also shown that the “evolutionary play” can
affect the “ecological theater” – altering populations, communities, and ecosystems
(Schoener 2011). This alternative perspective, whereby ecological and evolutionary forces
interact in contemporary time has been termed eco-evolutionary dynamics (Schoener
2011).
Despite much empirical evidence that evolution can influence ecological
processes ex situ (Yoshida et al. 2003, Bassar et al. 2010) or in common garden field
experiments (Turcotte et al. 2011, Agrawal et al. 2013), a major challenge in assessing
the general significance of eco-evolutionary dynamics is testing whether the evolution-to-
ecology pathway is frequent and strong enough to regulate communities and ecosystems

39
in natural ecosystems (Schoener 2011). Few studies have reported evidence of
evolutionary change altering communities and ecosystems in nature because the ecological
effects of locally adapted phenotypes are often difficult to isolate in comparable
environments in contemporary time (but see Post et al. 2008, Urban 2013). Isolating these
effects is particularly challenging given that complex species interactions and
environmental variation may diminish the ecological consequences of evolutionary change
in situ.
The well-documented case of rapid evolution by the small freshwater guppy,
Poecilia reticulata, provides an opportunity to test the ecosystem consequences of
evolutionary change in a complex natural system. In the mountain streams of Trinidad’s
Northern Range, two locally adapted phenotypes of guppy have been described from
localities that differ in predation pressure (Reznick and Endler 1982). Guppies located in
high-elevation streams (hereafter guppy phenotype-1, GP1) experience lower predation
pressure than guppies from low-elevation streams (hereafter guppy phenotype-2, GP2), and
display distinct genetic-based differences in life-history, color, morphology and behavior
(Magurran 2005). Some of these traits can evolve rapidly in natural streams, within as little
as four years or eight generations (Reznick et al. 1997).
While the effects of each guppy phenotype on ecosystem structure and function
have been well-documented ex situ (Palkovacs et al. 2009, Bassar et al. 2010, Bassar et al.
2012), the strength of these effects in situ is uncertain. In ex situ common garden
experiments GP1 guppies consumed significantly more algae and significantly fewer
invertebrates than GP2 guppies (Palkovacs et al. 2009, Bassar et al. 2010). Corresponding
to these differences in diet, mesocosms with GP1 guppies contained significantly lower

40
algal biomass (Palkovacs et al. 2009, Bassar et al. 2010) and significantly higher biomass
of larval midges [(Chironomidae:Diptera) the dominant invertebrate taxon] relative to
mesocosms with GP2 guppies (Bassar et al. 2010). Additionally, an in situ manipulative
experiment has suggested that some top-down effects of guppies observed in ex situ
experiments are reflected in natural streams containing GP1 guppies (Marshall et al. 2012,
Simon In Prep), yet conclusive evidence that the two phenotypes have differing and
persistent ecosystem effects in natural streams has yet to be documented.
Here we address two questions: (1) what are the top-down ecosystem effects of
two distinct, locally adapted populations of a fish consumer (the guppy, Poecilia
reticulata) in situ? and (2) are the relative ecosystem effects of each phenotype distinct at
a landscape-scale despite high environmental variability? To address these questions, we
examine how trait variation (life history and diet selectivity) in two locally adapted
populations (GPI, GP2) of Trinidadian guppy affects stream ecosystem properties in situ,
at a local-scale (one stream) and a larger landscape-scale (eight streams). Because
consistent patterns in multiple other traits (life history, color, morphology, and behavior)
have been documented in natural populations, we hypothesize that the different
ecological effects of these two guppy phenotypes, previously observed in ex situ
experiments, will also occur in natural streams despite high levels of environmental
variation at local- and landscape- scales. Specifically, we predict that: (1) at the local-
scale, GP1 guppies will significantly reduce algal standings stocks and algal accrual rates
but not invertebrate biomass, while GP2 guppies will significantly reduce invertebrate
biomass, but not algal biomass or algal accrual rates; (2) at the landscape-scale, stream
reaches characterized by either GP1 or GP2 guppies will reflect patterns in the relative

41
biomass of algal and invertebrate biomass observed in local-scale experiments despite
higher levels of environmental variation; and (3) relative to previous ex situ mesocosm
experiments (Palkovacs et al. 2009, Bassar et al. 2010), the effects of each guppy
phenotype on algal and invertebrate biomass will be similar in direction, but lower in
magnitude in natural streams.
Methods
Study Site
Our studies were carried out within the Caroni drainage on the southern slope of
Trinidad’s Northern Range Mountains. The Caroni is the largest drainage in Trinidad (≈
60,000 ha) and is located in the southwestern half of the Northern Range Mountains
(Figure 3.1). Rivers draining into the Caroni are characterized by fish communities that
are separated by intermittent waterfalls, resulting in a consistent pattern of declining fish
diversity with increasing elevation. In lower elevation reaches, guppy populations (GP2
guppies) typically evolve under high predation risk from large piscivores, notably
Crenicichla spp. and Hoplias malabaricus (Reznick and Endler 1982). Barrier waterfalls
restrict the access of fish species, such that guppies and the killifish, Anablepsoides
hartii, typically dominate reaches at higher elevations in the absence of large piscivores.
In these upper reaches, guppy populations (GP1 guppies) have evolved under low-
predation risk from killifish, which only occasionally consume guppies and primarily
forage on terrestrial ants and larval aquatic midges (Fraser et al. 1999). Killifish can
disperse over land and bypass barriers during wet periods and are commonly the only fish
species present in the most upstream reaches of streams. These isolated, killifish-only
42
reaches are ideal for tracking the evolution of small populations of GP2 guppies that have
been experimentally introduced from lower elevations into low-predation risk
environments (Reznick et al. 1990).
Local-Scale Experiments
As part of a Frontiers in Integrative Biological Research (FIBR) project funded
by the National Science Foundation (2007-2011), populations of GP2 guppies from low-
elevation streams were introduced upstream into four high-elevation focal study streams
(Pennisi 2012). To isolate the ecosystem effects of each guppy phenotype, we
experimentally manipulated the presence and absence of GP2 and GP1 guppies in an
upstream and downstream reach of one of the focal study streams [the Caigual (Figure
3.1)]. The downstream reach of the Caigual contains a natural population of GP1 guppies,
killifish, crabs (GP1KC) and the upstream reach contains introduced GP2 guppies and
native populations of killifish and crabs (GP2KC). We conducted our first experiment (22
February – 23 March, 2009) in the downstream GP1KC reach of the Caigual, prior to the
introduction of GP2 guppies upstream to preclude any potential confounding of native GP1
guppy effects with effects produced by introducing GP2 guppies or their offspring moving
downstream. Our second experiment (26 April - 24 May 2010) was conducted in the
GP2KC reach one year after GP2 guppies were introduced, in order to allow the small
introduced guppy population (38 individuals) to expand and include first and second-
generation individuals (generation time ≈ 5 months).
Both experiments were conducted in the dry season when stream discharge was
low (except for occasional storms) to reduce the confounding effects of seasonal variation
in stream discharge between experiments. The Caigual drains a heavily forested

43
watershed (≈ 170 ha) that provided abundant canopy cover over both the GP1KC and
GP2KC reaches (Table 3.1). Study reaches (200 m long) were separated by ~200 m and
located at elevations from ≈ 650 – 700 m a.s.l. Both reaches were characterized by a
distinct pool and riffle structure, where stream benthic substrate was dominated by gravel
and cobble, with some boulders and large woody debris at the edges of pools. Pools in the
GP1KC reach were slightly deeper with faster moving water than pools in the GP2KC
reach (Table 3.1).
To isolate the top-down effects of macroconsumers (guppies, killifish, and crabs),
on algae and invertebrates, we used an underwater electric exclosure technique (modified
from Pringle and Blake 1994). A number of previous studies have found this design to
work effectively in excluding aquatic consumers across a range of taxa and geographic
locations (Greathouse et al. 2006, Connelly et al. 2008, Moulton et al. 2012). Five
replicate pairs of macroconsumer exclusion (electrified frames) and control (non-
electrified frames) treatments were nested within each of five pools in each of the two
study reaches (200 m) of the Caigual focal stream. Electric frames excluded
macroconsumers from small (0.125 m2) benthic patches within each pool and pools were
located ≈ 40 m apart within each study reach.
Treatment frames were constructed of two concentric rectangles of 8-gauge solid
copper wire, connected by plastic cable ties (outer rectangle 25 cm x 50 cm, inner 8 cm x
30 cm) (following Marshall et al. 2012). We used Speedrite 1000 fence chargers (Tru-
Test Limited, Auckland, New Zealand) set on the low power and slow pulse settings.
These settings result in energy output of about 1 joule at ≈2-sec intervals to power the
exclusion frame. Control frames were identically constructed but not electrified.

44
To confirm observations from previous experiments that guppies were the
dominant macroconsumer visiting control frames in the Caigual (Marshall et al. 2012),
we estimated the density of macroconsumers (guppies, killifish, and crabs) over timed
observation periods. Each control treatment frame was observed for one hour, spread
across four observation periods per experiment: two diurnal and two nocturnal. We
recorded the number of each macroconsumer present (0.125 m2) using visual point counts
once a minute over a 15 min period (n=15 point counts). Before making observations we
waited quietly for 5 min to allow macroconsumers to resume normal activity. Density of
each species was estimated as an average over the 15-point counts (following Reznick et
al. 2001).
Algal biomass was measured over a four-week period on unglazed (ashed)
ceramic tiles (25 cm2) nested within control and exclusion treatments. Tiles served as a
proxy for hard benthic substrate and were retrieved three times during the first week, and
then weekly for the remainder of each experiment. Peak algal biomass was measured on
day 21 and day 28 in GP1KC and GP2KC reaches, respectively, to assess algal standing
stocks prior to sloughing in the GP1KC reach and after it had recovered from a storm
event that occurred on day 15 in the GP2KC reach. Additionally due to the storm event in
the GP2KC reach on day 15 we calculated algal accrual rates across the first 14 days of
rapid growth. Accrual rates were calculated using a linear fit of the algal biomass accrued
on days 0, 3, 7, and 14. Algal biomass was calculated using chlorophyll a fluorescence
measured with a Turner Aquafluor handheld fluorometer (Turner Designs, Inc.,
Sunnyvale, CA, USA) fitted with a chlorophyll a-specific wavelength channel, on
45
replicated aliquots of extracted material scraped from tiles (detailed in Marshall et al.
2012).
Invertebrates were sampled on day 28 with a stovepipe core of the stream bottom
within each treatment frame. We sampled one core (102.6 cm2) per treatment frame,
equivalent to 16% of the quadrat area not affected by other sampling substrates (tiles).
Samples were dyed with Rose Bengal stain for 24 hr and sorted, and all invertebrates > 1
mm were counted and identified using taxonomic keys by Merritt et al. (2008) and Perez
(1988). Length-mass (Benke et al. 1999, Becker et al. 2009) and volume-mass (Feller and
Warwick 1988) regressions were used to generate biomass values for insects and non-
insect invertebrates, respectively. Because previous studies found that guppy diets
contain mostly small aquatic insects (Bassar et al. 2010), we removed predatory aquatic
invertebrates (which tended to be the largest invertebrates) from our statistical analysis to
better isolate the top-down effects of guppy foraging behavior on invertebrates (Bassar et
al. 2012).
Landscape-Scale Study
To put results of our local-scale experiments in the context of environmental
variability at a larger landscape-scale, we expanded our studies to include seven
additional streams draining watersheds within the larger Caroni River drainage (≈ 14,053
ha) for a total of eight study streams (Figure 3.1). We measured algal and invertebrate
biomass in each of the eight streams, with paired upstream (guppy-free) and downstream
(guppy-dominated) reaches isolated by barrier waterfalls. Streams dominated by natural
populations of GP1 guppies were located in the Aripo, Guanapo, Arima, and Tacarigua,

46
while four subwatersheds of the Guanapo were dominated by experimentally introduced
GP2 guppies (Figure 3.1).
All study streams were sampled during one week in the dry season at base flow
(April 20th-27th, 2011). In each of the eight study streams we sampled the first seven
pools up- and down- stream of barrier waterfalls where stream gradient was < 7%
(avoiding cascades of waterfalls). Elevation was similar among subwatersheds, ranging
from 600 – 750 m a.s.l, but many physiochemical variables varied greatly among sites
(Table 3.1): discharge (Q m3 s-1) ranged from 0.33 - 2.65 m3 s-1; total N (NO2 + NO3)
ranged from 126 - 314 µg L-1 and soluable reactive phosphorous (SRP) ranged from 0.87
- 25.95 µg SRP L-1. Our water chemistry measurements were conducted once at the
downstream end of each reach; however, our values of SRP and total N in the GP2
introduction reaches are consistent with annual means reported in previous studies
(Kohler et al. 2012). All sites contained heavily forested watersheds that ranged from ≈
53 - 170 ha in drainage area, with mean canopy openness ranging from 3.4 - 24 %.
Similar to the Caigual focal study stream (where we ran local-scale experiments), all
study reaches were characterized by a distinct pool and riffle structure, with stream
benthic substrate dominated by gravel and cobble, and some boulders and large woody
debris at the edges of pools. Pool morphology was highly variable within and between
sites (Table 3.1), with pool area ranging from 1.8 - 28.2 m2, mean depth ranging from
0.06 - 0.27 m, and mean velocity ranging from 0.01 - 0.05 m s-1.
Fish abundance was quantified by observations (guppies) and baited trapping
(killifish) in pools. We visually estimated guppy density, similar to that used in local-
scale experiments, within a standardized quadrat area (1 m2) during the day in the seven

47
downstream (guppy dominated) pools of each stream. Guppy density was estimated as an
average 16-point counts (once every 45 seconds for 12 min). To insure that killifish
abundance was similar between paired upstream and downstream reaches, a single baited
trap was placed in each pool (n=14 per stream) for 5 min. All captured killifish were
counted and promptly returned to a pool yielding a catch per unit effort (CPUE; Seber
1982). Crabs were never observed in quadrats during observation periods or in baited
minnow traps used for CPUE of killifish; however, they were present at low densities in
all streams sampled (T.N.S personal observation).
Algal standing stock biomass was calculated by measuring chlorophyll a collected
from natural substrates on the stream bottom using a suction sampler (4.823 cm2)
modified from Loeb (1981). Five Loeb samples were combined for each of the seven
pools per reach into a single sample bag and analyzed for chlorophyll a using methods
described earlier. Invertebrates were collected from the stream bottom of pools using two
separate stovepipe cores (102.6 cm2) combined into a single sample bag for each of the
seven pools per reach and measured and identified using methods described earlier.
Biomass for non-predatory taxa were processed and prepared for statistical analysis in the
same manner as reported above for local scale experiments.
Statistical Analysis
Local-Scale Experiments: The magnitude of top-down control was estimated by
calculating a single value for the treatment effects of macroconsumers between each
control and exclosure treatment replicate (n=5 pairs). Magnitude of the effects were
calculated as natural log response ratios for statistical analysis in order for data to meet
assumptions of normality (Hedges et al. 1999).

48
One-sample t-tests were used to determine if the effect size of macroconsumers was
statistically different from 0 for each experiment. All statistical analyses were conducted
using R (R Version 3.0.1).
Landscape-Scale Study: We used mixed effects linear regression to estimate the
fixed effects of guppy phenotype (either LP or HP) and percent canopy openness on
standing stock biomass of algae and macroinvertebrates, while stream (n=8) was included
as a random effect. We included canopy openness in our models because light availability
in particular has been identified as a significant driver of algae and invertebrate biomass
in this system (Heatherly in prep; Kohler et al. 2012; El Sabaawi et al. 2015). Our
analysis nested pools within streams in order to estimate the size and uncertainty of each
guppy phenotype effect on algae or invertebrate biomass relative to guppy-free locations,
while accounting for canopy openness (standardized to a mean of 0 and standard
deviation of 1), a possible interaction between each phenotype and canopy openness, and
differences among streams not explained by covariates (modeled as a random effect on
the intercept). Additionally, we used natural log transformations to normally distribute
our response variables (algae and invertebrate biomass).
We fit linear models of algae and invertebrate biomass using a Bayesian
framework, which allowed us to estimate the net effect on algae or invertebrate biomass
of exchanging HP with LP guppies (LP – HP = Phenotype Effect) and the associated
uncertainty in this estimate. Priors for effect sizes were specified as normal distributions

49
with a mean of 0 and a precision of 0.001. Priors for standard deviations of the stream
effect and residuals were specified as uniform distributions between 0 and 100. We ran
three independent Markov chain Monte Carlo (MCMC) chains of 20000 iterations with a
thinning rate of 2 and burn-in of 1000. Convergence was assessed using the Rhat
potential scale reduction factor (Gelman 2007). Model fitting was implemented in JAGS
v. 3.2 through R package R2jags (Plummer 2003). We considered parameter estimates to
be statistically significant if the 95% credible interval of the estimate did not include
zero. To insure that our parameter estimates were not biased by statistical outliers, we ran
our models both with and without the top two outliers identified in each dataset (algae or
invertebrate biomass). Outliers in our dataset were identified using Cook’s distance
regression diagnostic (Cook 1977).
Results
Local-Scale Experiments
No macroconsumers were observed within exclosure treatments except when
electricity was briefly turned off to collect samples. Observations confirmed that guppies
were the most numerically abundant macroconsumer to visit control treatments in both
experiments. Guppy densities were on average at least 8x that of other macroconsumer
taxa observed in control treatments. Guppies were active exclusively during daytime
observations in both GP1KC (8.3±2.60 [mean±SE] GP1 m-2) and GP2 KC (18.2±7.72
introduced GP2 m-2) study reaches. Killifish maintained low densities in GP1KC (daytime
0.37±0.20 Killifish m-2; nighttime 0.80±0.28 Killifish m-2) and GP2KC (daytime
1.76±1.47 Killifish m-2; nighttime 1.12±0.60 Killifish m-2) study reaches. Crabs also
maintained low densities in both GP1KC (daytime 0.27±0.12 Crab m-2; nighttime

50
0.16±0.11 Crab m-2) and GP2KC (daytime 0.88±0.78 Crab m-2; nighttime 2.56±1.32 Crab
m-2) study reaches.
In the GP1KC reach, macroconsumers consistently reduced algal accrual rates by
18% (SE±6%)(p=0.03; Figure 3.2a) and biomass by 52% (±31%)(p=0.05; Figure 3.2a) in
control vs. macroconsumer exclosure treatments, whereas macroconsumers had both
positive and negative effects on invertebrate biomass, on average reducing biomass by
49% (±470%)(p=0.72; Figure 3.2a). In the GP2KC reach, macroconsumers had both
positive and negative effects on algae, on average algal accrual rates were reduced by 4%
(±11%)(p=0.73; Figure 3.2b) and biomass by 8% (±10%)(p=0.42; Figure 3.2b), whereas
macroconsumers consistently reduced invertebrate biomass, on average by 84%
(±74%)(p=0.03; Figure 3.2b) in the control vs. macroconsumer exclosure treatments.
Landscape-Scale Study
Guppies were abundant across all eight subwatersheds in reaches below barrier
waterfalls: (4.5±0.68 [mean±SE] for GP1 guppies; 5.3±0.67 Guppies m-2 for GP2 guppies).
Guppies were never observed in reaches above waterfalls. Killifish abundance (CPUE)
was similar between paired reaches above and below barrier waterfalls in subwatersheds
containing GP1 (above 5.96±1.19 Killifish CPUE; below 5.29±0.96 Killifish CPUE) or
GP2 guppies (above 3.66±0.72 Killifish CPUE; below 4.00±1.24 Killifish CPUE).
The top outliers in the algae dataset did not bias parameter estimates from our
models and therefore we discuss the model output from the full dataset (Table 3.2).
Models showed a significant positive correlation between canopy openness and algal
biomass, with algal biomass increasing, by 29% when canopy openness was increased by
1 standard deviation unit (Table 3.2). Additionally, we found no support for interactive

51
effects between canopy openness and the presence of either GP1 or GP2 guppies on algal
standing stocks (Table 3.2). Models did show a significant negative correlation between
the presence of GP1 guppies and algal biomass [-24% (-40%, -6%); mean (lower, upper
95% CI)] relative to paired upstream guppy-free reaches (Figure 3.3a). Additionally,
models showed a positive, but highly variable correlation between the presence of GP2
guppies and algal biomass [17% (-6%, 44%)], relative to paired upstream guppy-free
reaches (Figure 3.3a). Additionally, we found that the effect of replacing GP2 with GP1
guppies resulted in a significant reduction in algal biomass [-34% (-53%, -12%)].
The top outliers in our invertebrate dataset biased the parameter estimates from
our model, so we report model outputs with the top two outliers removed (Table 3.2).
Models including and excluding the top two outliers found strong negative correlations
between the presence of GP2 guppies and invertebrate biomass, although there was no
support for a positive interaction of GP2 guppy presence and canopy openness when
outliers were removed from the model (Table 3.2).
Models showed a significant positive correlation between canopy openness and
invertebrate biomass, with invertebrate biomass increasing on average by 53% when
canopy openness was increased by 1 standard deviation unit (Table 3.2). Models also
showed a significant negative correlation between the presence of GP2 guppies and
invertebrate biomass [-31% (-52%, -6%)], relative to paired upstream guppy-free reaches
(Figure 3.3b). Additionally, models showed a negative, but highly variable correlation
between the presence of GP1 guppies and invertebrate biomass [-4% (-33%, 32%)],
relative to paired upstream guppy-free reaches (Figure 3.3b). Finally, we found that the
effect of replacing GP2 with GP1 guppies on invertebrate biomass was skewed toward a
52
positive effect (43% (-10%, 114%); however, we did not detect a significant effect likely
due to the large variability surrounding the effects of each phenotype on invertebrate
biomass (Figure 3.3b).
Discussion
Our study provides strong evidence that two phenotypes of the Trinidadian guppy,
which represent the outcome of genetic adaptation to different predatory environments,
have different effects on stream ecosystem properties despite natural levels of
environmental variation at local- and landscape- scales. Even though our in situ local-
scale experiments were conducted in separate years and the two focal experimental
reaches varied in four of the five environmental variables measured, we found that
macroconsumer communities dominated by GP1 guppies had different treatment effects
on algal accrual rate and algal and invertebrate biomass than communities in an upstream
reach of the same stream dominated by GP1 guppies. While we recognize that the relative
effects of macroconsumer communities cannot be directly compared given that our
experiments were confounded by both time and location, it is important to note that
experimental differences between control and exclosure treatments in each reach were
consistent with previous common garden mesocosm experiments (Palkovacs et al. 2009,
Bassar et al. 2010). Additionally, Marshall et al. (2012) reported strikingly similar top-
down effects of macroconsumer communities dominated by GP1 guppies on algal
(significant negative effect) and invertebrate (lack of effects) biomass in the same reach
(GP1KC) of our experimental stream one year prior to our study (2008). Moreover, Simon
(In Prep) reported similar top-down effects in an in situ experiment isolating the effects
53
of GP1 guppies across four streams on the southern slope of the Northern Range
mountains. The above lines of evidence strongly suggest that trait differences between
guppy phenotypes (diet selectivity and life history), rather than any concomitant
differences in the time or location of respective experiments, were the mechanism for
differences in treatment effects between our experimental reaches. Moreover, landscape-
scale patterns in the relative biomass of algae and invertebrates in stream reaches
containing either GP1 or GP2 guppies reflected the divergent effects of guppy phenotypes
observed in local-scale experiments, despite landscape-scale levels of environmental
variation.
At the landscape-scale, we found increased variability in all five of the physical
characteristics measured in our local-scale experiments (Table 3.1). While the effects of
GP1 and GP2 guppies, relative to upstream controls across eight streams, reflected
treatment effects from local scale experiment, we could only detect a significant effect of
exchanging guppy phenotypes on algal biomass. Our inability to detect a significant
phenotypic effect on invertebrates could have been caused by high environmental
variability. Of those physical characteristics measured, canopy openness in particular has
been identified as a significant driver of algae and invertebrate biomass in this system
(Heatherly in prep; Kohler et al. 2012); therefore we could reasonably expect that
patterns caused by variation in canopy openness to obscure the influence of guppy
phenotype, if its effects on invertebrate biomass are comparatively small. Additionally,
given that GP1 guppies have been found to be generalist browsers (consuming algae and
some invertebrates) relative to GP2 guppies (Palkovacs et al. 2009, Bassar et al. 2010) it is

54
not surprising that it is more difficult to detect a phenotype effect on invertebrates relative
to algae.
Differences in diet flexibility between guppy phenotypes is highlighted by the
variability in the effects of each phenotype on their less desired prey type; the effects of
GP1 guppies on invertebrates, while non-significant, varied from positive and negative at
both local- and landscape- scales, while the effects of GP2 guppies on algae were much
less variable tending to be either zero or positive at local- and landscape- scales,
respectively.
While distinguishing between the effects of each phenotype on invertebrates may
be difficult to detect, phenotypic effects of algal biomass were much stronger. The effect
of exchanging GP2 for GP1 guppies was similar to the effect of increasing canopy
openness by one standard deviation (40% of the observed variation in canopy across 112
pools) on these variables across our 16 study reaches (Table 3.2). This result from natural
streams supports the findings reported by El-Sabaawi et al. (2015) from artificial stream
channels where light and phenotype were examined in a factorial experiment. Moreover,
despite 3x higher ambient concentrations of soluble reactive phosphorous (SRP) in our
GP2 guppy streams (including paired upstream guppy-free reaches), our model still
showed strong evidence that GP1 guppies reduced algae biomass and GP2 guppies tended
to increase algal biomass relative to upstream guppy free reaches. Therefore, our findings
suggest that divergent effects of guppy phenotypes on algal biomass are not only
persistent at the landscape-scale, but are also ecologically significant relative to known,
bottom-up drivers (light and nutrients) of ecosystem structure and function.
55
A caveat to our landscape-study is that it was conducted in the only river system
in Trinidad’s Northern Range that does not contain shrimp populations. Shrimp have
been shown to have a strong influence on stream ecosystems of other Caribbean islands
(Pringle et al. 1999, Greathouse et al. 2006), therefore it remains unclear whether the
influence of guppy local adaptation on ecosystem structure will be similar in drainages
containing dense populations of shrimp.
We predicted that results from our in situ studies would match the direction of
phenotypic effects reported in previous ex situ mesocosm experiments, but we expected
the magnitude of the effects observed in natural systems to be comparatively small. In
contrast, however, we found that while the effects of guppies (regardless of phenotype)
on algal biomass were greater in previous ex situ compared to our in situ work, the
relative difference in effects of GP1 and GP2 guppies on algal and invertebrate biomass
was conserved between experimental approaches. In mesocosms, the presence of guppies
(mean of both phenotypes relative to fishless controls) reduced algae and larval midge
biomass by 400% and 70% respectively, compared to mostly <50% reductions of these
biomass pools in our in situ studies. However, similar to our findings at the landscape
scale, detecting the effects of exchanging guppy phenotypes in previous mesocosm
experiments was much stronger for algal than invertebrate biomass. Both Palkovacs et al.
(2009) and Bassar et al. (2010) found highly significant effects of guppy phenotype on
algal biomass (≈50% difference in both ex situ experiments and 34% difference in
landscape study), while only Bassar et al. (2010) found an effect on invertebrate biomass
that was only marginally significant. Two previous studies (Palkovacs and Post 2009,
Urban 2013) have shown that mesocosm experiments can predict some of the ecological

56
effects of local adaptation observed in situ but often overestimate the magnitude of those
effects. Therefore, while mesocosms may predict general trends, estimating the realized
ecological consequences of local adaptation may require measuring the strength of the
evolution-to-ecology pathway in natural systems, where environmental heterogeneity may
alter the ecosystem effects of evolution in nature.
Density is a key demographic parameter that can impact both the ecological effects
and evolution of Trinidadian guppies (Bassar et al. 2010, Reznick et al. 2012). It is
important to note that while guppy density was controlled for in previous mesocosm
experiments, density was not controlled for in our unmanaged in situ field studies. In our
landscape study guppy densities were similar for each phenotype; however, in our local-
scale experiments, GP2 guppies were, on average, twice as dense as GP1 guppies. It is
conceivable then, that the differences in the top-down effects of each phenotype observed
in the local scale experiment were the result of density rather than differences in diet or life
history. Several lines of evidence, however, suggest that differences in density would not
have changed the direction of the effects of each guppy phenotype on algal and invertebrate
biomass. A previous ex situ mesocosm experiment reported that doubling guppy density
reduced algal biomass, regardless of phenotype, however, despite densities of GP2 guppies
being double that of GP1 guppies in our experiment, only GP1 guppies significantly reduced
algal biomass, which provides strong evidence that guppy phenotypes have divergent
effects on algal biomass. Additionally, Simon (In Prep) found that GP1 guppies had no top-
down effects on invertebrates, at either low or high guppy densities, in an in situ
experiment across four streams. Therefore, if GP1 guppy densities were increased to match
57
that of GP2 guppies in our local-scale experiment it is not likely that guppies would reduce
invertebrate biomass.
To our knowledge, our study is the first to report experimental evidence of the
ecosystem consequences of local adaptation in an unmanaged natural system. Two
previous studies, however, have provided strong evidence that local adaptation of a single
consumer species can alter the structure of communities in observational studies at the
landscape-scale: (1) Post and colleagues (2008) reported that diet selectivity in migratory
vs. non-migratory alewives caused divergent zooplankton communities in 19 natural
lakes across coastal Connecticut; and (2) Urban (2013) reported that foraging rates of
spotted salamander populations varied with the abundance of an intraguild predator
(marbled salamander), which in turn altered zooplankton diversity in 14 natural ponds
across Totoket Mountain in Connecticut. Here we report similar effects of foraging traits
(diet selectivity) in two locally adapted guppy phenotypes in 16 stream reaches across the
Caroni drainage in Trinidad’s Northern Range Mountains. Similarities among these
studies highlight an emergent theme addressing the effects of local adaptation on
communities and ecosystems in nature. Because the differences in resource use of
guppies affect aspects of ecosystem structure, our results expand the breadth of effects
attributed to local adaptation of populations within the landscape, beyond community-
level responses.
Conclusions
In support of our hypothesis, our results show a strong linkage between local
adaptation and ecosystem structure, despite high natural levels of environmental
variation. Moreover, our study is the first to our knowledge to report evidence that the

58
ecosystem consequences of local adaptation are consistent local- and landscape- scales
and are also ecologically significant relative to known, bottom-up drivers of ecosystem
structure and function. While our results strongly suggest that divergent local adaptation
can result in different ecosystem effects of each guppy phenotype on algal and
invertebrate biomass at local- and landscape- scales, our ability to distinguish between
the effects of each phenotype was much stronger for algal biomass relative to invertebrate
biomass due to reduced variability in top-down effects.

59
Acknowledgements
We thank T. Mcdevitt-Galles, W. Roberts, M. Rautenberg, A. Bratt, T. Schipper, and E.
Nash for their help during field sampling. We thank K. Murray, C. Nguyen, A.
Snellgrove, and E. White for their help processing samples in the lab. We thank R.
Shefferson and the members of the Pringle Lab for their extensive manuscript comments.
We thank the Water and Sewage Authority of Trinidad and Tobago, the University of the
West Indies at St. Augustine, and the Asa Wright Nature Centre for permission to access
various sites and for use of facilities. The authors appreciate the help and support of
Ronnie Hernandez and the staff of William Beebe Tropical Research Station. This work
was supported by a National Science Foundation Frontiers in Integrative Biological
Research (FIBR) Grant to DNR and others (NSF-FIBR, DEB-0623632) and the NSF
Graduate Research Fellowship program (fellowship to TNS).

60
Table 3.1: Physical and chemical parameters [mean±SE (n=7); range (min, max)] for
paired reaches examined in the landscape-scale survey and the location of our local-scale
experiment, the Caigual*. Physical and chemical parameters not measured are denoted by
§. Physical and chemical parameters for landscape-scale study were measured one week
before (April 13th-19th, 2011) biological sampling. Physical parameters for local-scale
study were calculated one day after experiments were completed for GP1KC and GP2KC
reaches on 24 March 2009 and 25 May 2010, respectively.
River Reach Q (m3 s-1)
Canopy openness (%) Pool Area (m2) Pool Depth (m) Pool Velocity
(m s-1) SRP
(µg L-1) TIN
(µg L-1)
GP1KC 1.32 18.91±3.13 (6.50, 25.74)
5.28±1.06 (1.80, 9.14)
0.15±0.02 (0.08, 0.23)
0.04±0.02 (0.00, 0.14) 1.60 314.96
KC 1.02 7.87±1.24 (3.90, 13.52)
11.23±1.12 (6.62,#16.12)
0.21±0.03 (0.12, 0.33)
0.01±0.01 (0.01, 0.03) 1.08 280.54
GP1KC 0.88 24.07±2.87 (11.70, 35.62)
6.39±1.43 (3.07, 12.53)
0.13±0.01 (0.09, 0.17)
0.04±0.01 (0.01, 0.12) 3.24 126.11
KC 0.98 7.50±1.67 (2.86, 15.86)
11.75±0.83 (8.68, 14.63)
0.25±0.03 (0.13, 0.37)
0.02±0.00 (0.01, 0.03) 0.87 147.17
GP1KC 1.21 12.93±3.07 (1.04, 24.70)
5.83±1.16 (2.43, 9.67)
0.17±0.02 (0.09, 0.24)
0.04±0.01 (0.01, 0.08) 5.99 248.19
KC 1.77 7.87±1.84 (2.86, 14.82)
6.25±0.69 (4.16, 8.52)
0.18±0.01 (0.10, 0.22)
0.01±0.00 (0.00, 0.04) 5.95 224.73
GP1KC 0.35 3.45±0.81 (1.30, 6.50)
9.38±3.87 (2.65, 28.20)
0.15±0.02 (0.10, 0.20)
0.03±0.00 (0.01, 0.04) 14.60 222.72
KC 0.33 3.38±0.34 (2.08, 4.42)
5.94±1.12 (1.99, 10.79)
0.16±0.01 (0.12, 0.23)
0.03±0.01 (0.01, 0.11) 8.65 215.33
GP2KC 1.39 8.95±2.82 (1.30, 22.88)
7.26±1.75 (3.68, 14.14)
0.18±0.03 (0.07, 0.26)
0.03±0.00 (0.02, 0.05) 6.49 169.24
KC 1.21 15.30±2.94 (7.02, 29.38)
10.98±1.61 (7.20, 19.24)
0.25±0.01 (0.21, 0.32)
0.02±0.00 (0.01, 0.04) 12.43 163.16
GP2KC 2.32 9.03±2.52 (1.56, 15.86)
5.73±1.48 (2.03, 13.96)
0.14±0.02 (0.08, 0.24)
0.02±0.01 (0.01, 0.04) 25.95 239.22
KC 2.21 5.27±0.91 (1.30, 8.32)
6.77±0.86 (3.11, 10.12)
0.15±0.01 (0.09, 0.21)
0.01±0.01 (0.00, 0.02) 23.79 249.13
GP2KC 0.99 21.93±1.27 (17.42, 26.26)
6.98±1.11 (4.57, 12.78)
0.11±0.01 (0.06, 0.16)
0.05±0.01 (0.02, 0.07) 17.30 190.45
KC 1.03 8.69±1.05 (6.24, 14.30)
11.88±1.27 (5.03, 15.15)
0.27±0.02 (0.18, 0.32)
0.01±0.00 (0.01, 0.02) 19.46 197.62
GP2KC 2.16 16.42±2.72 (8.32, 28.86)
6.33±0.97 (2.52, 8.90)
0.16±0.02 (0.10, 0.23)
0.04±0.01 (0.01, 0.09) 13.52 247.92
KC 2.65 7.80±1.17 (4.94, 12.74)
10.81±1.59 (5.36, 16.55)
0.19±0.03 (0.12, 0.31)
0.04±0.01 (0.01, 0.08) 9.73 258.61
GP1KC 1.35 25±3.98 (3.38, 32.31)
9.56±2.14 (6.25, 11.68)
0.24±0.06#(0.11, 0.28)
0.07±0.03 (0.02, 0.09)
§ §
GP2KC 1.30 15.74±3.44
(1.56, 24.70) 8.95±2.57
(4.59, 9.65) 0.17±0.03
(0.12, 0.23) 0.03±0.01
(0.01, 0.07) §
§
Arima
Aripo
Guanapo
Tacarigua
Guanapo (Ciagual)
Guanapo (Lower Lalaja)
Guanapo (Taylor)
Guanapo (Upper Lalaja)
Guanapo* (Ciagual)

61
Table 3.2: Bayesian model parameter estimates for each response variable measured in
landscape-scale study including: mean and standard deviation (SD), upper (97.5%) and
lower (2.5%) confidence limits (CL), and percent (%) effect size. To insure outliers
within our dataset did not heavily bias our parameter estimates, we ran our models both
with and without the top two outliers in for each response variable. We report parameter
estimates highlighted in gray, and those that were well supported by our model are in
bold.
!!!
Full Dataset Outliers Removed Response Variable Parameter Estimate
(SD) Lower, Upper CL
% Change of Response
Estimate (SD)
Lower, Upper CL
% Change of Response
Algae
Intercept 4.54 (0.17) 4.19, 4.88 n.a. 4.54 (0.16) 4.23, 4.84 n.a.
GP1 Guppy -0.29 (0.11) -0.51, -0.07 -24.5% -0.22 (0.11) -0.44, -0.01 -19.1%
GP2 Guppy 0.15 (0.11) -0.07, 0.36 16.6% 0.14 (0.11) -0.06, 0.35 16.1%
Phenotype -0.44 (0.16) -0.74, -0.13 -34.4% -0.36 (0.15) -0.66, -0.06 -29.6%
Canopy Openness 0.21 (0.06) 0.08, 0.33 28.8% 0.20 (0.06) 0.08, 0.32 28.3%
GP1 x Canopy -0.04 (0.13) -0.30, 0.23 -2.9% -0.04 (0.13) -0.29, 0.21 -3.0%
GP2 x Canopy -0.09 (0.10) -0.27, 0.10 -7.8% -0.08 (0.09) -0.26, 0.10 -7.5%
Intercept Random effects
0.43 (0.17) 0.22, 0.85 n.a. 0.39 (0.15) 0.20, 0.76 n.a.
Residual 0.39 (0.03) 0.34, 0.45 n.a. 0.38 (0.03) 0.33, 0.44 n.a.
Invertebrate
Intercept -0.31 (0.13) -0.57, -0.05 n.a. -0.22 (0.13) -0.47, 0.03 n.a.
GP1 Guppy 0.03 (0.19) -0.34, 0.39 4.8% -0.06 (0.17) -0.40, 0.28 4.2%
GP2 Guppy -0.29 (0.19) -0.65, 0.07 -23.9% -0.39 (0.17) -0.73, -0.06 -31.5%
Phenotype 0.32 (0.24) -0.17, 0.78 41.6% 0.33 (0.22) -0.11, 0.76 43.1%
Canopy Openness 0.22 (0.10) 0.03, 0.42 32.0% 0.35 (0.10) 0.16, 0.54 52.8%
GP1 x Canopy 0.08 (0.23) -0.37, 0.52 10.4% -0.05 (0.21) -0.46, 0.37 -2.5%
GP2 x Canopy 0.26 (0.34) -0.07, 0.60 31.9% 0.14 (0.16) -0.17, 0.45 16.4%
Random effects on Intercept
0.21 (0.14) 0.02, 0.55 n.a. 0.22 (0.14) 0.02, 0.54 n.a.
Residual 0.72 (0.05) 0.63, 0.83 n.a. 0.66 (0.05) 0.57, 0.76 n.a.

62
Figure Legends
Figure 3.1: Map showing subwatersheds sampled for landscape-scale study [denoted by
outlined watersheds, where either GP2 (1-4) or GP1 (5-8) guppies are located] and
local-scale experiments (denoted by a dashed subwatershed) across the Caroni
drainage in Trinidad’s Northern Range mountains. The Caroni drainage contains
large sections of high-density urban areas (diamond shaded area) and rural areas
with mixed agriculture (hatch shaded area). Subwatersheds chosen for landscape
study were located in watersheds with the largest tracts of intact-forested
headwaters. Inset (B) illustrates paired reach design (above and below waterfalls)
of landscape study, where reaches below barrier waterfalls contain guppies,
killifish, and crabs (GPiKC) and reaches above waterfalls contain only killifish
and crabs (KC).
Figure 3.2: Mean (±SE) of natural log (LN) response ratio of ecosystem response
variables in two local-scale experiments conducted in macroconsumer
communities containing either (A) GP1 guppies, killifish, and crabs (GP1KC), or
(B) GP2 guppies, killifish, and crabs (GP2KC). X-axis is the response variables
measure during experiment including algal accrual rate (mg m-2/day), algal
biomass (mg m-2), and invertebrate biomass (mg m-2). Y-axis is the response
ratios calculated as LN (response variable in control/response variable in
macroconsumer exclusion), where positive values represent positive effects of

63
macroconsumers and negative values represent negative effects. Statistical
significance is signified by * (p<0.05), ** (p<0.01).
Figure 3.3: Mean ±95% Credible Intervals (CI) of percent (%) change caused by the
presence of either GP1 or GP2 guppies relative to guppy-free reaches, or the effect
of exchanging GP1 with GP2 guppies (Phenotype) on (A) algae biomass (mg m-2)
and (B) invertebrate biomass (mg m-2) from landscape-scale study. Effects of
guppies estimated using linear mixed effects models with random intercepts.
Positive effect sizes represent positive effects of guppies and negative values
represent negative effects. Parameter estimates were considered to be statistically
significant if the 95% credible interval of the estimate did not include zero, where
significant parameter estimates indicated by an asterisk (*).

64
Figure 3.1

65
Figure 3.2
-2.5
-1.5
-0.5
0.5
1.5
2.5 A
-2.5
-1.5
-0.5
0.5
1.5
2.5
Algal Accrual Rate
Algal Biomass
Invertebrate Biomass
B
Ecosystem Response Variable
* *
*
LN (V
aria
ble c
ontr
ol /
Varia
ble e
xclu
sion
)

66
Figure 3.3
-75
-25
25
75
-125
-75
-25
25
75
125
% C
hang
e in
Alg
ae B
iom
ass
% C
hang
e in
Inve
rtebr
ate
Bio
mas
s
B
A
GP1 guppy GP2 guppy Phenotype
Parameter Estimate
* *
*

67
CHAPTER 4
TRINIDADIAN GUPPIES DECOUPLE A DETRITUS-BASED TROPHIC CASCADE
WHEN PRESENT IN MACROCONSUMER ASSEMBLAGES WITHIN THE
MONTANE HEADWATER STREAMS OF NORTHERN TRINIDAD3
3 Troy N. Simon, A.J. Binderup, A.S. Flecker, J.F. Gilliam, S.A. Thomas, J. Travis, D.N. Reznick, C.M. Pringle To be submitted to Ecology

68
Abstract
The loss of dominant macroconsumer species can have strong cascading
ecosystem effects. However, the ecosystem-level effects of consumer loss from systems
that lack dominant macroconsumers remains unclear. Here, we investigated how the
natural presence or absence of an omnivorous guppy, Poecilia reticulata, in a
macroconsumer assemblage including a generalist predator (the killifish, Anablepsoides
hartii) and an omnivore (the freshwater crab, Eudaniela garmani), alters the top-down
effects of the macroconsumer assemblage on leaf litter decomposition. We used an in situ
exclosure experiment in one stream and a landscape-scale study to quantify the potential
effects of macroconsumers on insect shredders and leaf decomposition rates in the
context of the presence or absence of guppies below and above natural barrier waterfalls,
respectively.
We found strong evidence that killifish caused a detritus-based trophic cascade,
but only when guppies were absent above waterfalls. Above waterfalls, where guppies
were absent, experimental exclosures isolating the effects of nocturnal and diurnal
consumers suggest that killifish rather than crab reduced the biomass of a dominant insect
shredder (Trichoptera: Phylloicus hansoni) 4-fold (p<0.001) and reduced leaf
decomposition rates by 40% (p<0.01). Below waterfalls, where guppies were present,
macroconsumers had no observable top-down effects on P. hansoni biomass (p>0.5) or
leaf decomposition rates (p>0.5). In support of our experimental findings, our landscape
scale study found 25-fold higher biomass of P. hansoni (p<0.001) and 3.5-fold higher
leaf decomposition rates (p<0.05) when guppies were present relative to where they were
absent above barriers.

69
Reduced killifish density in the presence of guppies is a likely mechanism for
reduced predation of P. hansoni below barriers. Previous studies in this system reported
that guppy predation on larval killifish and predicted that the presence of guppies would
reduce killifish density. In support of this prediction, we found a 40% and 400%
reduction in the density of killifish in presence of guppies in our exclosure experiment
and landscape study, respectively. Our results strongly suggest that the presence of
intraguild predation between guppies and killifish decoupled a detritus-based trophic
cascade at both local- and landscape- scales.
Introduction
The loss of macroconsumers can have landscape-scale effects on communities
and ecosystems in both aquatic and terrestrial systems worldwide (Estes et al. 2011).
Much research investigating macroconsumers has focused on how predators alter
community and ecosystem properties via trophic cascades, whereby predators indirectly
affect lower trophic levels by altering the density or activity of intermediate consumer
species. Textbook examples of trophic cascades include increases in elk populations and
changes in the biomass of quaking aspen following wolf extirpation from Yellowstone
Park (Ripple et al. 2001) or increases in primary production via indirect reductions of
herbivorous zooplankton in lakes following the removal of piscivorous largemouth bass
(Carpenter et al. 1987). Although much research on the ecosystem effects of
macroconsumers has focused on the direct and cascading ecosystem effects of dominant
species, the effect of losing less dominant consumer species from systems with multiple
macroconsumers remains unclear. Given that biodiversity loss is predicted to

70
disproportionally impact large-bodied consumers (Petchey et al. 1999, Duffy 2002),
predicting the consequences of macroconsumer loss remains a high research priority
(Sutherland et al. 2013).
Predicting the ecosystem consequences of losing an individual macroconsumer
species from a system containing multiple macroconsumers often requires understanding
the functional relationships among consumer species. For example, if predatory
macroconsumers compete for shared prey or engage in intraguild predation, then
removing one species could increase prey consumption by the second species (Polis et al.
1989, Huang and Sih 1991, Finke and Denno 2002), which can then have indirect effects
on lower trophic levels (e.g. basal resources)(Finke and Denno 2005). However,
predicting the cascading effects of macroconsumer loss from a system containing both
predators and omnivores is difficult because omnivores can affect both prey populations
and basal resources and therefore may reduce the strength of trophic cascades on basal
resources (Polis and Strong 1996, Bruno and O'Connor 2005). In order to better
understand the potential cascading ecosystem effects of macroconsumer losses across
systems, we must quantify the effects of removing individual species from systems
containing functionally diverse macroconsumer assemblages (e.g. including both
predators and omnivores).
We examined the ecosystem consequences of the presence or absence of an
omnivore from a macroconsumer assemblage containing both strict predators and
generalist omnivores. We define macroconsumers as species that are relatively large in
their environment and have low predation risk as adults. In the headwater streams of
northern Trinidad, two distinct macroconsumer assemblages, separated by barrier

71
waterfalls, are characterized by the presence or absence of the guppy, Poecilia reticulata.
Killifish (Anablepsoides hartii), crabs (Eudaniela garmani), and guppies dominate
macroconsumer communities below waterfalls. However, waterfalls limit upstream
colonization by guppies, such that only killifish and crabs are found in the uppermost
reaches of streams. Because detrital processing is a dominant energy pathway in many
forested headwater streams (Vannote et al. 1980, Wallace et al. 1997), we addressed the
top-down effects of macroconsumer communities on leaf decomposition rates.
Previous research in this system has shown that macroconsumer communities
directly increase the decomposition rates of soft, palatable, black stick leaves (Marshal et
al., 2012). However, no studies have attempted to isolate possible indirect cascading
effects of macroconsumers (e.g. consumption of leaf shredding invertebrates) within
these communities. Isolating the effects of macroconsumer predation on detrital
processing is simplified in the streams of Northern Trinidad compared to many mainland
streams because a single species, the caddisfly, Phylloicus hansoni (Flint Jr 1996), is the
dominant insect shredder (Botosaneanu and Sakal 1992). Thus, if any macroconsumer
species consumes Phylloicus hansoni (hereafter referred to as Phylloicus), then a trophic
cascade on leaf decomposition rates may occur (Figure 4.1). Although each
macroconsumer species in this system consumes aquatic invertebrates, conclusive
evidence that any species significantly impacts invertebrate biomass in high elevation
streams has yet to be documented. Gut content analysis shows that killifish are generalist
predators of aquatic invertebrates and terrestrial arthropods that fall into streams (Fraser
et al. 1999), while Crabs and guppies are omnivores (Marshall et al. 2012). Guppies
consume mostly algae and fine detritus, as well as some invertebrates and aquatic
72
consumers (Zandona et al. 2011), and crabs are opportunistic foragers of labile coarse
detritus, and freshly fallen leaves and fruits (T.N.S personal observation). Additionally,
when found together, guppies and killifish are reported to be partial intraguild predators,
where guppies consume larval killifish and killifish occasionally consume adult guppies
(Fraser and Lamphere 2013).
Here, we assessed differences in the top-down effects of macroconsumers on leaf
decomposition rates in the context of the presence or absence of omnivorous guppies
from a system containing multiple macroconsumers. We used both an in situ exclosure
experiment and a landscape-scale study to examine the potential cascading effects of
macroconsumer assemblages above and below barrier waterfalls. We hypothesized that if
the presence of any macroconsumer species reduced the biomass of insect shredders
(particularly Phylloicus), then macroconsumers would indirectly decrease the rate of leaf
litter decomposition. Additionally, because previous work has demonstrated that guppies
and killifish are partial intraguild predators, we predicted that the documentation of a
trophic cascade would be more likely to occur above waterfalls because the natural
exclusion of guppies should enable greater killifish predation on invertebrate shredders,
resulting in lower rates of leaf decomposition. Moreover, because crabs can consume
both macroinvertebrates and coarse organic matter, their exclusion could potentially
accelerate or decelerate leaf decomposition rate. Given that the activity of some
macroconsumers in this system varied along a diel cycle (Marshall et al. 2012), we also
included 12hr diel exclusion treatments to better isolate the effects of diurnally active
consumers (killifish and or guppies) from nocturnally active consumers (crabs and
killifish).

73
Methods
Study Site
Our studies were carried out within the Caroni drainage on the southwestern slope
of the Northern Range Mountains in Trinidad (10° 39’N 61°18’ W). The Caroni is the
largest drainage in Trinidad (≈ 60,000 ha) (Figure 4.2). Rivers draining the Northern
Range Mountains and into the Caroni are characterized by declining fish diversity with
increasing elevation. In the high elevation reaches of these streams, killifish, crabs, and
guppies characterize macroconsumer communities. Macroconsumers in this system vary
in size, where guppies and killifish have a maximum total length of 45mm and 100mm
(Fraser and Lamphere 2013), and crabs have a maximum carapace width of 110 mm
(Maitland 2003). Killifish and crabs can disperse over land and bypass barrier waterfalls
during wet periods and are commonly the only macroconsumer species present in the
most upstream reaches of streams. Stream reaches with killifish, crabs, and guppies
(KCG reaches) and those with only killifish and crabs (KC reaches) can be characterized
by a single waterfall and are often separated by less than 200 m. As a result, stream
reaches with these communities have similar physical habitat and environmental
characteristics, while maintaining distinctly different consumer assemblages (Walsh and
Reznick 2009).
Exclusion Experiment
Experimental Design: We conducted experiments in two reaches of the Caigual
River a third order tributary of the Guanapo River (Figure 4.2). Experiments were
conducted during the dry season when stream discharge was low [KC (February 22nd –
March 23rd 2009) and KCG (April 16th – May 13th 2009)] to reduce the confounding

74
effects of seasonal variation in stream discharge between experiments. Temporally
separated experiments were necessary due to logistical limitations, and we assumed
stable populations of macroconsumers between reaches due to stable base flows with no
storm events, which could have ‘reset’ the benthic environment between experimental
periods. Previous studies in the Caigual River (Gilliam et al. 1993) found that in addition
to killifish and guppies, there were very low numbers of the Pimelodid catfish, Rhamdia
quelen, however no individuals were observed in experimental pools. The Caigual drains
a heavily forested watershed (≈ 170 ha) that provided abundant canopy cover in the KCG
(25% canopy openness) and KC (11.3% canopy openness) reaches. Study reaches (200 m
long) were isolated by a large barrier waterfall and separated by ~200 m (located at
elevations from ≈ 650 – 700 m a.s.l.). Reaches were characterized by a distinct pool and
riffle structure, where stream benthic substrate was dominated by gravel and cobble, with
some boulders and large woody debris at the edges of pools. Pools in the KCG reach
were similar in depth with slightly slower water velocity than pools in the upstream KC
reach (22.9 vs. 25.5 cm depth and 0.23 vs. 0.33 m s-1).
To isolate the top-down effects of macroconsumers (guppies, killifish, and crabs)
on leaf decomposition rates, we used an underwater electric exclosure technique
(modified from Pringle and Blake 1994), where macroconsumer are either allowed access
(non-electrified control) or excluded (electrified exclusion treatment). Electric exclosures
have not been found to exclude any aquatic invertebrates in this system (Marshall et al.
2012). A number of previous studies have found this design to work effectively in
excluding aquatic macroconsumers across a range of taxa and geographic locations
(Greathouse et al. 2006, Connelly et al. 2008, Moulton et al. 2012). In order to better
75
characterize the potentially opposing effects of crabs from killifish and guppies on leaf
decomposition, we also included 12hr diel exclusion treatments to better isolate the
effects of diurnally active consumers (killifish and or guppies) from nocturnally active
consumers (crabs and killifish). Replicate sets of macroconsumer treatments (24h access,
24h exclusion, 12h daytime exclusion, 12h nighttime exclusion) were deployed in five
separate pools across each of the two study reaches (200 m) of the Caigual, resulting in
20 total frames per reach. Electric frames excluded macroconsumers from small (0.125
m2) benthic patches within each pool. Pools were located ≈ 40 m apart within each study
reach.
Treatment frames were constructed of two concentric rectangles of 8-gauge solid
copper wire, connected by plastic cable ties (outer rectangle 25 cm x 50 cm, inner 8 cm x
30 cm) (following Marshall et al. 2012). We used Speedrite 1000 fence chargers (Tru-
Test Limited, Auckland, New Zealand) set on the low power and slow pulse settings.
These setting result in energy output of about 1 joule at ≈2-sec intervals to power the
exclusion frame. Control frames were identically constructed but not electrified.
Macroconsumer observations: To confirm observations from previous
experiments of macroconsumer activity patterns (Marshall et al. 2012), we estimated the
density of macroconsumers over timed observation periods. We made observations of
each macroconsumer access treatment (control and non-electrified 12hr treatment) for
1hr, spread across four 15 min observation periods per experiment: two-diurnal and two-
nocturnal (10 total observation hours per reach). Nocturnal observations were made on
relatively clear nights with the moon in either first or last quarter phase. We recorded the
number of each macroconsumer species present using visual point counts once a minute

76
over a 15 min period (n=15 point counts) for each treatment. Before making observations
we waited 5 min to allow macroconsumers to resume normal activity. Density of each
species was estimated as an average number of individuals observed across point counts
divided by the frame area (0.125 m2) (following Reznick et al. 2001).
Leaf Decomposition: We used packs of recently fallen leaves from the guarumo
tree, Cecropia peltata (hereafter referred to as Cecropia), leaves to assess the effects of
macroconsumers on leaf litter decomposition rates. Cecropia is a common Neotropical
tree genus found in riparian areas across Central and South America and throughout
many of the islands of the Caribbean Basin (Rickson 1977) including Trinidad. Cecropia
leaves tend to be high in nutrients and low in secondary compounds (Zou et al. 1995).
Leaves were oven-dried at 40°C for at least 3 days and then grouped in batches of 5 g,
weighed to the nearest 0.01 g and clipped together at the petiole using a binder clip to
allow access by larger shredding consumers (e.g. crabs). Leaf packs were attached to the
copper wire quadrats using plastic zip ties, and one pack from each frame was collected
after 4, 8, 15, 22, and 29 days by placing a 63µm mesh net placed downstream of the
pack while removing it from the quadrat to avoid loss of invertebrates or leaf material.
Retrieved leaf packs were rinsed over a 250-µm sieve and all leaf particles were placed in
pre-weighed paper bags and the >1mm size fraction of invertebrates was saved for
quantification of taxa. Bags were dried at 40°C for at least 3 days and weighed to the
nearest 0.01 g. The average dry mass lost in handing packs was subtracted from the initial
dry mass of leaf packs. We calculated the percent of leaf dry mass remaining using initial
and final measurements.
Leaf Invertebrates: Invertebrate samples were dyed with Rose Bengal stain for 24
77
hr and sorted; all invertebrates >1mm were identified to the lowest taxonomic resolution
possible (usually genus, except for midge taxa) using taxonomic keys by Merritt et al.
(2008) and Perez (1988). All invertebrates >1mm were also assigned to functional
feeding groups, as described by Merritt et al. (2008) and de Carvalho and Uieda (2009).
We used length-mass regressions (Benke et al. 1999, Becker et al. 2009) to estimate
invertebrate biomass in each leaf pack, which was then divided by the final leaf mass of
the pack on the corresponding sample date. We focused only on the biomass of
invertebrates in the shredding functional feeding group for our statistical analysis in order
to better isolate the cascading effects of macroconsumers on leaf decomposition.
Landscape Study
To determine how the natural exclusion of guppies above and below waterfalls
altered leaf decomposition rates at the landscape scale, we expanded our studies to six
additional streams draining subwatersheds within the larger Caroni River drainage (≈
14,053 ha; Figure 4.2). We measured leaf decomposition rates and the biomass of
shredding invertebrates in each of the six streams, with paired upstream (killifish and
crab) and downstream (killifish, crab, and guppy) reaches separated by waterfalls.
Leaf packs were deployed and collected in all streams concurrently under
baseflow conditions toward the end of the dry season (April 23rd – May 21st, 2014). In
each of the six study streams we placed Cecropia leaf packs in the first three pools
(separated by >50 m) up- and down- stream of waterfalls. Additionally, paired reaches
within streams were separated by no more than 200 m, and elevation was similar among
subwatersheds, ranging from 600 – 800 m a.s.l. All sites contained heavily forested
subwatersheds that ranged from ≈ 53 - 105 ha in drainage area. Similar to the Caigual

78
subwatershed from the exclosure experiment, all study reaches were characterized by a
distinct pool and riffle structure, with stream benthic substrate dominated by gravel and
cobble, and some boulders and large woody debris at the edges of pools. In each pool we
estimated percent canopy openness, percent leaf cover (visually estimated for entire
pool), and areal biomass of leaf litter from randomized transects (0.125 m wide) across
pools. We also measured depth, percent saturation of dissolved oxygen and water
temperature using a YSI Pro2030 (Yellow Springs, Ohio) at the downstream end of each
pool, and current velocity near leaf packs using a Marsh McBirney Flo-Mate 2000
(Loveland, Colorado).
Macroconsumer Abundance: Fish abundance (killifish and guppies) was
estimated by placing two baited minnow traps in each pool (n=6 per stream) for 10 min.
All captured fish were counted and promptly returned to a pool yielding a catch per unit
effort (CPUE; Seber 1982). Total catch in each of the two traps in a pool were combined
for CPUE calculation. Crab abundance was estimated using nocturnal transect counts
across a 100 m stream-reach. One transect count was conducted in each of the two
reaches per stream (n=12 total transects), yielding number of crabs per m of stream
length.
Leaf Decomposition and Leaf Shredding Invertebrates: The deployment,
collection, and calculation of mass loss for leaf packs followed methods described for the
exclusion experiment. All invertebrates >1mm in the shredding functional feeding guild
were counted and length-mass regressions (Benke et al. 1999, Becker et al. 2009) were
used to generate total shredder biomass values for each leaf pack.
Statistical Analysis
79
Exclosure Experiment: Because experiments in KCG and KC reaches were
spatially and temporally isolated from each other we compared relative treatment effects
within reaches only. Macroconsumer density data from diurnal and nocturnal
observations within each reach were compared using Friedman’s non parametric test to
investigate the effects of partial access (12 hr exclusion) vs. full access (control)
treatments on macroconsumer density estimates (i.e., full access and daytime access
observed during the diurnal period, and full access and nighttime access during the
nocturnal period); with a random block effect of replicate pool. If statistical significance
was detected (a < 0.05), pairwise comparisons were made with Kruskal-Wallis rank sum
tests. The rate of decomposition (% mass lost day-1) was determined using a linear fit
because mass-loss through time was not strongly exponential. Differences in leaf
decomposition rate between all treatments were first examined using a one-way ANOVA
where treatment was a fixed effect and pool was a random block effect. Significant
treatment effects led to examination of pairwise differences in decay rates using Tukey-
Kramer HSD post-hoc tests. Differences in the mean normalized biomass of invertebrate
shredders (mg invertebrate dry mass / mg leaf material remaining) between treatments
were also compared using one-way ANOVA and Tukey-Kramer HSDs. Leaf
decomposition rate and invertebrate biomass data were natural log transformed to meet
the assumptions of normality. Leaf decomposition rates and shredder biomass across all
treatments (including controls) were examined for bivariate correlations in each reach.
Landscape-Study: Macroconsumer CPUE data between reaches were compared
using one-way ANOVA where reach was the fixed effect and stream was the random
block effect. The rate of decomposition (% mass lost day-1) was determined using a linear

80
fit because mass-loss through time was not strongly exponential. Leaf decomposition
rates between reaches was compared using one-way ANOVA where reach was the fixed
effect and stream was the random block effect. Differences in the mean normalized
biomass of invertebrate shredders above and below waterfalls were also compared using
one-way ANOVA. Leaf decomposition and invertebrate biomass and abundance data
were natural log transformed to meet the assumptions of normality. Additionally, we used
a two-way ANOVA to analyze whether changes in shredder biomass were gradual along
a stream continuum (i.e., an effect of pool position, with pools numbered 1-6 in order
from upstream to downstream) or abrupt corresponding to barrier waterfalls (loss of
guppies), where pool and reach were fixed effects and stream was a random block effect.
Leaf decomposition rates and shredder biomass were examined for bivariate correlations.
All statistical analyses were conducted using R (R Version 3.0.1).
Results
Macroconsumer Exclosure Experiment
Macroconsumer Observations: No macroconsumers were observed in either the
24hr exclusion treatments or when the 12hr exclusions treatments were electrified.
Additionally there were no significant differences between visits to treatments in the
same diel period (i.e., full access and daytime access observed during the diurnal period,
and full access and nighttime access during the nocturnal period); therefore, observation
treatments from the same diel period were pooled (Table 4.1).
In the KCG (guppy present) reach, guppies were strictly diurnally active
(7.31±1.49 [mean±SE] individuals m-2). Killifish were active both day and night, yet we

81
observed significantly more killifish during the night in both KCG (p=0.03; daytime
0.35±0.12 individuals m-2; nighttime 0.84±0.18 individuals m-2) and KC reaches (p=0.02;
daytime 0.56±0.33 individuals m-2; nighttime 1.36±0.52 individuals m-2). Crabs were not
observed more at night than during the day in the KCG reach (p=0.35; daytime 0.16±0.07
individuals m-2; nighttime 0.08±0.06 individuals m-2) but were observed significantly
more at night in the KC reach (p=0.04; daytime 0.16±0.13 individuals m-2; nighttime
1.89±0.60 individuals m-2).
Leaf Decomposition Rate: In the downstream KCG reach we found no effect of
macroconsumers on leaf decomposition rate in any of the macroconsumer manipulation
treatments. Decomposition rates of Cecropia in control treatments (full access) were
similar to treatments allowing access only during the day or night, or no access
(F3,16=0.023, p=0.85; Figure 4.3a).
The presence of killifish and crabs reduced the decomposition rate of Cecropia in
the upstream KC reach (F3,16=6.67, p=0.004; Figure 4.3a). Decomposition rates were
reduced by 40% in control frames relative to 24hr. and 12hr. exclusion (p < 0.03; Figure
4.3b). Additionally, our results suggest that killifish rather than crabs likely reduced
decomposition rates, because decomposition rates were similar in treatments excluding
either diurnal (Killifish; 12hr. daytime exclusion) or nocturnal (Killifish+Crabs; 12hr.
nighttime exclusion) macroconsumers (p>0.1).
Invertebrate community and leaf decomposition: We found 18 different
macroinvertebrate taxa on Cecropia leaves, and similar to previous studies in the region
(Botosaneanu and Sakal 1992), the only leaf shredding macroinvertebrate was the
caddisfly Phylloicus hansoni (supplemental Table 4.1). In control treatments (full

82
macroconsumer access) we found 2-fold higher total biomass of macroinvertebrates
>1mm in the downstream KCG (guppy present) reach (374.20 mg) compared to the
upstream KC (guppy-free) reach (178.73 mg) reach. This difference in biomass was
driven primarily by increased biomass of Phylloicus in KCG (251.61 mg; 67% of total
invertebrate biomass) compared to KC (21.89 mg; 12% of total invertebrate biomass)
reaches (Appendix Table 1). We found a significant positive correlation between
Phylloicus biomass and Cecropia litter decomposition in the downstream KCG reach
(R2=0.41, p=0.002; Figure 4.4a) where Phylloicus biomass was high, but not the
upstream KC reach (p=0.37; Figure 4.4b) where Phylloicus biomass was low.
Phylloicus Biomass: We found no effect of macroconsumers on Phylloicus
biomass in any of the macroconsumer manipulation treatments in the downstream KCG
reach (F3,16=0.149, p=0.94; Figure 4.3c).
In the upstream KC reach, we found that macroconsumers, when allowed full
access, reduced Phylloicus biomass on average by 4-fold, relative to 12hr. and 24hr.
exclusion treatments (F3,16=9.25, p=0.001; Figure 4.3d). Additionally, we note that
experimental results on Phylloicus abundance are parallel to the results on Phylloicus
biomass in both experimental reaches (Data not presented here). Additionally, our results
suggest that killifish rather than crabs likely reduced Phylloicus biomass, because
biomass was similar in treatments excluding either diurnal (Killifish; 12hr. daytime
exclusion) or nocturnal (Killifish+Crabs; 12hr. nighttime exclusion) macroconsumers
(p>0.1).

83
Landscape Study
Physiochemical characteristics: The physiochemical characteristics of pools
downstream of waterfalls in the KCG (guppy present) reaches were similar to those
upstream of waterfalls in the KC (guppy-free) reaches (Table 4.2). The percent canopy
openness was low, while percent leaf litter cover in pools and standing stocks of course
particulate organic matter were relatively high (Table 4.2). Pools were generally shallow
with low current velocity (Table 4.2). Finally, the percent saturation of dissolved oxygen
and water temperatures were also similar between pools above and below waterfalls
(Table 4.2).
Macroconsumer Density/Abundance: In the KCG reaches we captured
approximately 3-fold more individual guppies than killifish in baited traps (Table 4.3).
Additionally, killifish CPUE abundance was approximately 4-fold higher in the KC reach
relative to the downstream KCG reach (F1,5=27.97, p=0.003) (Table 4.3). Finally, we
found similar abundances of crabs in our transect surveys of KCG and KC reaches
(F1,5=0.78, p=0.42) (Table 4.3).
Dynamics between Leaf Decomposition and Phylloicus biomass: Cecropia leaves
decayed 3.5-fold faster in the KCG reaches (below waterfalls) as compared to the KC
reaches (above waterfalls), (F1,5=9.85, p=0.03; Figure 4.5a). Phylloicus biomass was 25-
fold higher in KCG reaches compared to the KC reaches (F1,5=17.19, p=0.009; Figure
4.5b), corresponding to differences in litter decay rates. Finally, we found a significant
positive correlation between Phylloicus biomass and litter decomposition rates in the
KCG reach where biomass was high (R2=0.57, p=0.01; Figure 4.6a), but not in the KC
reach where biomass was low (p=0.61; Figure 4.6b).
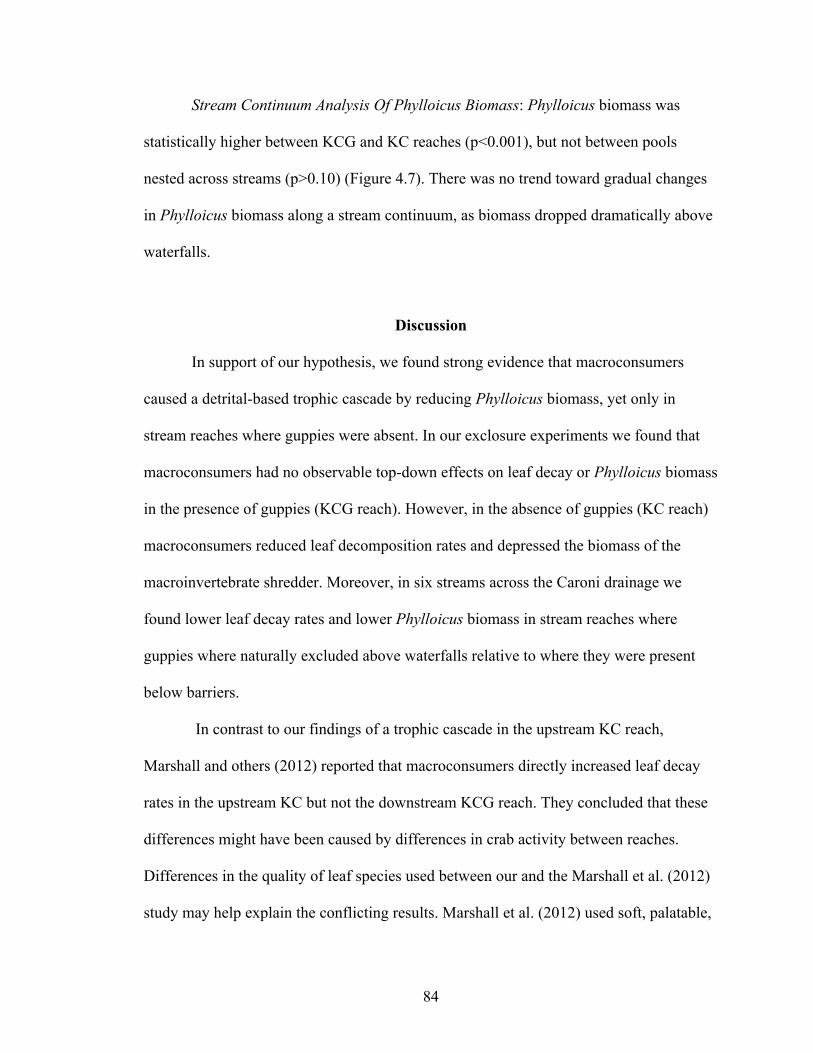
84
Stream Continuum Analysis Of Phylloicus Biomass: Phylloicus biomass was
statistically higher between KCG and KC reaches (p<0.001), but not between pools
nested across streams (p>0.10) (Figure 4.7). There was no trend toward gradual changes
in Phylloicus biomass along a stream continuum, as biomass dropped dramatically above
waterfalls.
Discussion
In support of our hypothesis, we found strong evidence that macroconsumers
caused a detrital-based trophic cascade by reducing Phylloicus biomass, yet only in
stream reaches where guppies were absent. In our exclosure experiments we found that
macroconsumers had no observable top-down effects on leaf decay or Phylloicus biomass
in the presence of guppies (KCG reach). However, in the absence of guppies (KC reach)
macroconsumers reduced leaf decomposition rates and depressed the biomass of the
macroinvertebrate shredder. Moreover, in six streams across the Caroni drainage we
found lower leaf decay rates and lower Phylloicus biomass in stream reaches where
guppies where naturally excluded above waterfalls relative to where they were present
below barriers.
In contrast to our findings of a trophic cascade in the upstream KC reach,
Marshall and others (2012) reported that macroconsumers directly increased leaf decay
rates in the upstream KC but not the downstream KCG reach. They concluded that these
differences might have been caused by differences in crab activity between reaches.
Differences in the quality of leaf species used between our and the Marshall et al. (2012)
study may help explain the conflicting results. Marshall et al. (2012) used soft, palatable,

85
black stick leaves (100% decomposed in two weeks) that crabs were reported to directly
consume, while we used less fragile and palatable Cecropia leaves (~50% mass lost in 29
days), which we never observed crabs to consume. The use of Cecropia leaves allowed
us to investigate the affect of macroinvertebrate shredding, because unlike black stick
leaves, invertebrate shredders are able to colonize Cecropia leaves before they
decompose. These results suggest that when omnivorous macroconsumers are present the
pathway of top-down effects (direct vs. indirect) on leaf decomposition may depend on
the quality of litter used in experiments.
Several lines of evidence suggest that killifish predation on Phylloicus increased
in the absence of guppies (i.e., in the upstream KC reach). We found similar biomass of
Phylloicus in the macroconsumer daytime and nighttime exclosure treatments, suggesting
that killifish rather than nocturnally active crabs were the primary predators on the
caddisfly. Additionally, killifish were observed to readily consume Phylloicus larvae; if
Phylloicus were dropped into the stream (by a stream-side observer), larvae were quickly
pulled from their case and consumed by killifish (T.N.S personal observation). Moreover,
gut content analysis of killifish from four different streams in northern Trinidad
confirmed this observation – dissections of 30 killifish showed that ~30% of individuals
contained Phylloicus in their stomach contents (Murray In Prep).
Theory predicts that the presence of an intraguild predator can reduce prey risk
(Polis et al. 1989) and recent empirical research supports this prediction. In a meta-
analysis of 50 experiments manipulating predator diversity, Schmitz (2007) reported that
70% of field experiments found that increasing predator diversity weakened prey
suppression. Intraguild predation has frequently been cited as a mechanism for the effects

86
of increasing predator diversity dampening the strength of trophic cascades (Finke and
Denno 2005; Bruno and Cardinale 2008; Sanders et al., 2011; Sitvarin and Rysptra 2014).
While cascading ecosystem effects of intraguild predation have been observed in
terrestrial systems no studies to our knowledge have been conducted in aquatic systems.
In a terrestrial example, Karp and Daily (2014) showed that intraguild predation between
bats and spiders reduced herbivore suppression leading to increased grazing on coffee
plants in Costa Rica. Similarly, in our study several lines of evidence suggest that the
presence of guppies decoupled the cascading effects of killifish on leaf decay. First,
Fraser and Lamphere (2013) reported that guppies consumed larval killifish, which
caused reductions of killifish recruitment in a multi-year, whole-stream guppy
introduction experiment. Second, in support of Fraser and Lamphere (2013) conclusions
we found that killifish densities were reduced in the presence of guppies (~40% increase).
Moreover, previous studies from our experimental exclusion stream (Marshall et al.,
2012; Gilliam et al., 1993), as well as other similar streams (Walsh and Reznick 2009,
Walsh et al. 2011), reported that killifish densities were more than three times as dense in
KC compared to KCG reaches, further indicating that the presence of guppies is linked to
reduced killifish densities. Moreover, although the differences in top-down effects
observed in our exclusion experiment could have been caused by other, unmeasured
environmental differences between the upstream and downstream experimental reaches,
results from our landscape study suggest that the absence of guppies rather than
environmental context strengthened a detrital-based trophic cascade across the Caroni
drainage.

87
In support of our prediction that the absence of guppies strengthened cascading
effects on leaf decomposition, we found 29-fold higher biomass of Phylloicus and 3.5-
fold lower leaf decay rates in reaches where guppies where naturally absent above
waterfalls relative to where they were present below barriers in six streams across the
Caroni drainage. Similar to previous studies (Gilliam et al. 1993, Walsh and Reznick
2009) in this system, we found that while physiochemical characteristics were similar
between upstream and downstream reaches across all six streams, killifish abundance was
significantly higher (4-fold) in KC relative to KCG reaches. Additionally, we found 40-
fold lower abundance but similar mean length of Phylloicus in KC relative to KCG
reaches suggesting that observed differences in Phylloicus biomass were not the result of
size selective predation (Appendix Table 2). Furthermore, we found strong statistical
evidence that the presence or absence of guppies rather than gradual changes along a
stream continuum (across 6 pools sampled in a stream) explained differences in
Phylloicus biomass between reaches. We note, however, that the effect size of guppy
absence on leaf decomposition and Phylloicus biomass were much larger (2- and 10- fold
greater respectively) in our landscape-study relative to differences observed between
reaches in our exclosure experiment. There are multiple possibilities for why this
difference occurred, but one possible reason may have been the results of the historic
drought that preceded our landscape study. The combination of stable flows (no scouring
floods) and increased leaf input (T.N.S Personal Observation) likely allowed Phylloicus
populations to flourish in downstream KCG reaches where they experience reduced
predation risk. Therefore, the cascading effects of killifish on leaf decomposition could

88
be mediated by climate patterns, such that the strength of cascading effects may be
dependent on the length and intensity of the dry season.
While the indirect effects of macroconsumers on algal-driven “green food webs”
have been well characterized (reviewed by Estes et al. 2011), less is known about the
indirect effects of consumers on detritus-based “brown food webs” (Moore et al. 2004,
Wu et al. 2011). Those studies that have reported detrital-based trophic cascades have
predominantly been documented within temperate streams. For example, by preying on
leaf-consuming detritivores, stonefly predators indirectly reduced leaf decay rates in
alpine streams (Obernborfer et al. 1984, Malmqvist 1993). The predatory effects of fishes
on detritivores (such as caddisflies and amphipods) can also slow decay rates of leaves in
temperate streams (Konishi et al. 2001, Ruetz et al. 2002, S Greig and R McIntosh 2006,
Woodward et al. 2008). Boyero and others (2008), in the only detritus-based trophic
cascade to our knowledge observed in tropical streams, reported that predatory
rainbowfish in Australia significantly reduced the breakdown rate of leaf material by
inhibiting activity of all shredding macroinvertebrates. Similarly, we found strong
evidence that predatory killifish caused a detritus-based trophic cascade by reducing the
biomass of an insect shredder in Neotropical mountain streams. However, in contrast to
the above examples, we found these cascading effects depended on the presence or
absence of a sympatric omnivorous consumer (guppies).
While research has consistently shown strong indirect ecosystem effects of losing
dominant top consumers at the landscape-scale (Estes et al. 2011), we found increasing
the number of macroconsumers in a stream community decoupled a detritus-based
trophic cascade at both local- and landscape-scales. Moreover, our findings suggest that

89
characterizing the functional relationships among sympatric consumers will be important
in predicting the community and ecosystem effects of losing individual macroconsumer
species from systems containing multiple macroconsumers.

90
Acknowledgements
We thank C. Morris, S. Collins, K. MacNeill, J. Zagarola, and S. Grabinski for field
assistance, and C. Morris, K. MacNeill, J. Zagarola, C. Braman, J. Bielenberg, A.
Donnelly, T. Stratmann, and M. Chamblee for lab assistance. We thank P. Bumpers, D.
Manning, and K. Farrell and the members of the Pringle Lab for their extensive
manuscript comments. We thank the Water and Sewage Authority of Trinidad and
Tobago, the University of the West Indies at St. Augustine, and the Asa Wright Nature
Centre for permission to access various sites and for use of facilities. The authors
appreciate the help and support of Ronnie Hernandez and the staff of William Beebe
Tropical Research Station. Additionally we appreciate the help and support of Jogie
Ramlal and the Ramlal family. This work was supported by a National Science
Foundation Frontiers in Integrative Biological Research (FIBR) Grant to DNR and others
(NSF-FIBR, DEB-0623632) and the NSF Graduate Research Fellowship program
(fellowship to TNS).

91
Table 4.1: Density [No. m-2 (SE)] estimates of macroconsumers (killifish, crabs, and
guppies) from the macroconsumer exclosure experiment. Macroconsumer density was
estimated using day and night observations. Observations conducted for 10 hours per
reach (n=20 observations per reach). Diurnal estimates based on pooled visitation from
24 hr. access and daytime access treatments, while Nocturnal estimates are based on 24
hr. access and nighttime access treatments. Bolded values represent significant results
from Kruskal-Wallis rank sum tests (P<0.05) between diurnal and nocturnal activity.
Table 4.2: Physiochemical characteristics [means±SE (min, max)] of pools from the
landscape study measured on the final day of the experiment. Physical characteristics
were measured in pools (n=18 replicate pools per reach type) across KCG (killifish, crab,
and guppy) and KC (killifish and crab) reaches.
Macroconsumer Density
Reach Observation Period Killifish Crab Guppy
KCG Daytime 0.35 (0.12) 0.16 (0.07) 7.31 (1.49)
Nighttime 0.84 (0.18) 0.08 (0.06) 0.00 (0.00)
KC Daytime 0.56 (0.33) 0.16 (0.13) Not Present
Nighttime 1.36 (0.52) 1.89 (0.60) .
Table 1: Density [No. m-2 (SE)] estimates of macroconsumers (killifish, crabs, and guppies) from the macroconsumer exclosure experiment. Macroconsumer density was estimated using day and night observations. Observations conducted for 10 hours per reach (n=20 observations per reach). Diurnal estimates based on pooled visitation from 24 hr. access and daytime access treatments, while Nocturnal estimates are based on 24 hr. access and nighttime access treatments. Bolded values represent significant results from Kruskal-Wallis rank sum tests (P<0.05) between diurnal and nocturnal activity.
Reach Canopy openness (%)
CBOM (g/m2) Depth (cm) DO (%
saturation L-1) Leaf Cover
(%) Temp (°C) Velocity (m/s)
KCG 4.25±1.41 (1.3, 15.86)
112.93±21.46 (23.52, 394.86)
13.78±1.09 (8.0, 18.0)
79.9±43.16 (66.9, 89.9)
46.94±8.08 (15, 80)
23.78±0.16 (23.3, 24.4)
0.0049±0.001 (0.00, 0.03)
KC 4.64±1.13 (0.26, 12.48)
161.7±25.71 (48.80, 480.25)
14.22±1.01 (10.5, 18.5)
81.64±3.30 (56.9, 91.7)
43.61±8.04 (15, 80)
23.69±0.18 (23.1, 24.4)
0.0054±0.001 (0.00, 0.07)
0
Physiochemical Characteristics
Table 2: Physiochemical characteristics [means±SE (min, max)] of pools from the landscape study measured on the final day of the experiment. Physical characteristics were measured in pools (n=18 replicate pools per reach type) across KCG (killifish, crab, and guppy) and KC (killifish and crab) reaches.

92
Table 4.3: Abundance of macroconsumers (killifish, crabs, guppies) for the landscape
study. Abundance estimated using catch per unit effort [CPUE (+SE)], for killifish and
guppies, and transect observations [individuals m-1(+SE)] for crabs. CPUE estimates
were calculated during the day using two baited minnow traps, once in each pool (n=18
replicate pools). Transect counts of crabs were conducted at night, across 100 m length of
stream, once in each reach (n=6 replicate reaches). Bolded values represent significant
differences (P<0.05) from one-way ANOVA between KCG and KC reaches for each
species respectively.
Macroconsumer Abundance
Table 3: Abundance of macroconsumers (killifish, crabs, guppies) for the landscape study. Abundance estimated using catch per unit effort [CPUE (+SE)], for killifish and guppies, and transect observations [individuals m-1(+SE)] for crabs. CPUE estimates were calculated during the day using two baited minnow traps, once in each pool (n=36 replicate pools). Transect counts of crabs were conducted at night, across 100 m length of stream, once in each reach (n=12 replicate reaches). Bolded values represent significant differences (P<0.05) from one-way ANOIVA between KCG and KC reaches for each species respectively.
Reach Killifish (CPUE) Crab (Indiv. m-1) Guppy (CPUE)
KCG 8.83 (2.81) 3.32 (1.38) 23.00 (9.57)
KC 30.61 (6.98) 3.09 (1.35) N.A.

93
Figure legends
Figure 4.1: Conceptual diagram of detrital food web in streams consisting of paired
reaches containing killifish, crabs, and guppies (KCG) downstream, and killifish
and crabs (KC) upstream, where barrier waterfalls naturally limit upstream
migration of guppies. Phylloicus hansoni is a dominant macroinvertebrate detrital
shredder in these streams. Solid arrows indicate hypothesized energy movement
up trophic levels while dashed arrows represents movement within trophic level.
Figure 4.2: Location of study sites in the Caroni drainage of Trinidad's Northern Range
(Inset A) for macroconsumer exclosure experiment (1) and the landscape study
(2a-f). Each study site consists of paired reaches (Inset B) containing killifish,
crabs, and guppies (KCG) downstream, and killifish and crabs (KC) upstream.
Guppies are naturally excluded from the upstream-most reaches by barrier
waterfalls.
Figure 4.3: Mean (+SE) for (a,b) decay rate of Cecropia peltata leaves (% mass lost
day-1) and (c,d) Phylloicus hansoni resource-specific biomass (mg dry mass g-1
Cecropia) for the exclosure experiment, where 24 hour treatments allow full
macroconsumer access [control (C)] or completely exclude macroconsumers
[electric (E)]. 12 hour treatments allow access to either diurnally active [day (D)]
or nocturnally active [night (N)] macroconsumers. Experiment conducted in
reaches containing either (a,c) killifish, crabs, and guppies (KCG), or (b,d) only
killifish and crabs (KC) and replicated in pools (n=5 per reach). Letters between

94
bars indicate results of post-hoc Tukey-Kramer HSD tests, with different letters
indicating significant within reach differences in pairs of means between
treatments.
Figure 4.4: Bivariate fit of decay rate for leaves of Cecropia peltata (% mass lost day-1)
and Phylloicus hansoni resource-specific biomass (mg dry mass g-1 Cecropia)
from the exclosure experiment. Experiment conducted in reaches containing
either (a) killifish, crabs, and guppies (KCG), or (b) only killifish and crabs (KC)
and replicated by diel treatments in pools (n=20 per reach). Statistical significance
of correlation noted by * (P<0.05) and ** (P<0.01).
Figure 4.5: Mean (+SE) for (a) decay rate for Cecropia peltata leaves (% mass lost day-
1) and (b) Phylloicus hansoni resource-specific biomass (mg dry mass g-1
Cecropia) for the landscape study. Landscape study conducted in streams
consisting of a paired reach containing killifish, crabs, and guppies (KCG)
downstream, and killifish and crabs (KC) upstream. Estimates of leaf decay were
replicated across streams (n=6 streams per reach type). Letters between bars
indicate results of one-way ANOVA, with different letters indicating significant
differences in pairs of means between reaches.
Figure 6: Bivariate fit of decay rate for Cecropia peltata leaves (% mass lost day-1) and
Phylloicus hansoni resource-specific biomass (mg dry mass g-1 Cecropia) from
the landscape study. Study conducted in streams consisting of a paired reach
containing (a) killifish, crabs, and guppies (KCG) downstream, and killifish and
(b) crabs (KC) upstream, and replicated in pools (n=18 pool per reach type).
Statistical significance of correlation noted by * (P<0.05) and ** (P<0.01).

95
Figure 4.7: Phylloicus hansoni resource-specific biomass [mg dry mass g-1 Cecropia (+
SE)], in individual pools averaged over the 4 week landscape study. Landscape
study consisting of a reach containing killifish, crabs, and guppies (KCG, pools 1-
3) downstream, paired with a reach containing killifish and crabs (KC, pools 4-6)
upstream. Estimates of Phylloicus biomass were replicated in pools nested within
streams (n=6 streams per reach type). Individual pools were separated by at least
50 m and adjacent pools in KCG (pool 3) and KC (pool 4) reaches were separated
by no more than 100 m. Analysis showed that changes in Phylloicus biomass are
not gradual along a stream continuum between pools (p>0.5), but abrupt when
macroconsumer assemblage changes (reach effect; p<0.001).

96
Figure 4.1
KC Reach KCG Reach
Killifish (A. hartii) Guppy (P. reticulata) Crab (E. garmani)
Leaf (Cecropia peltata)
P. hansoni
Waterfall!
Water Flow
Figure 1: Conceptual diagram of detrital food web in streams consisting of a paired reach containing killifish, crabs, and guppies (KCG) downstream, and killifish and crabs (KC) upstream, where barrier waterfalls naturally limit upstream migration of guppies. Phylloicus hansoni is a dominant macroinvertebrate detrital shredder in these streams. Solid arrows indicate hypothesized energy movement up trophic levels while dashed arrows represents movement within trophic level.
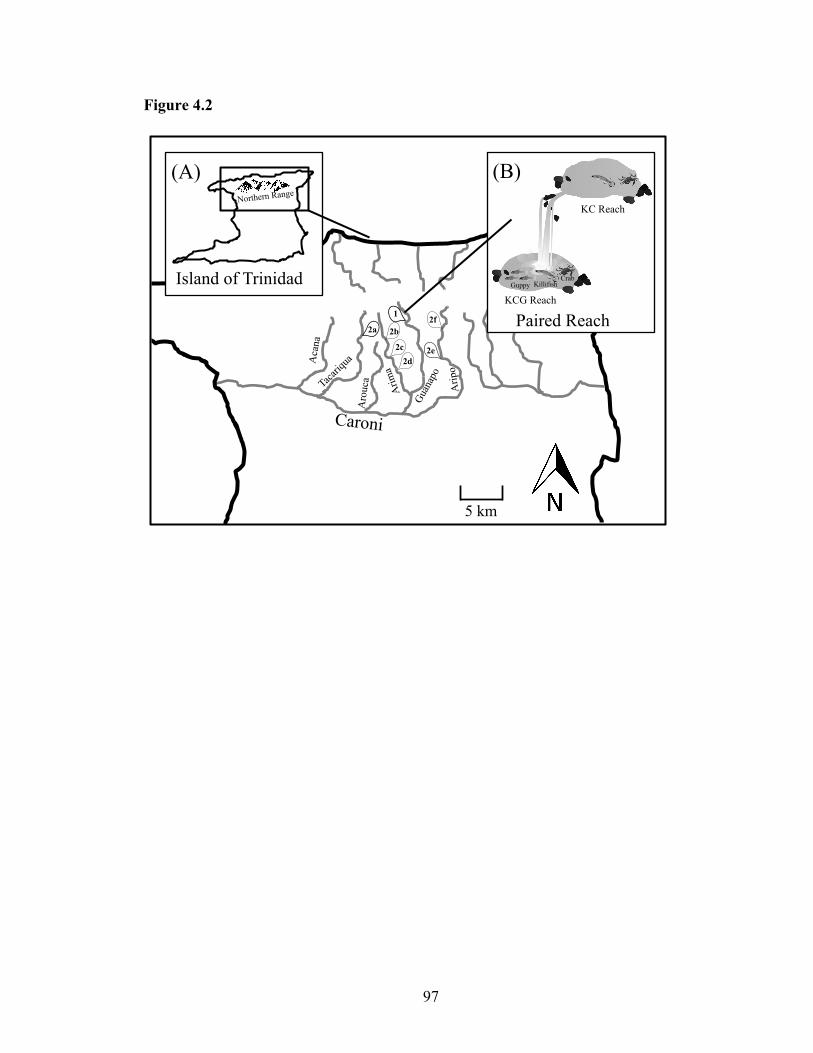
97
Figure 4.2
5 km
Caroni
Guppy Killifish Crab
KCG Reach
KC Reach
Paired Reach
(B)
Island of Trinidad
Northern Range
(A)
Arip
o
Aro
uca
2a
2d
2f
2e
1 A
cana
2c
2b
Figure 2: Location of study sites in the Caroni drainage of Trinidad's Northern Range (Inset A) for macroconsumer exclosure experiment (1) and the landscape study (2a-f). Each study site consists of paired reaches (Inset B) containing killifish, crabs, and guppies (KCG) downstream, and killifish and crabs (KC) upstream. Guppies are naturally excluded from the upstream-most reaches by barrier waterfalls.

98
Figure 4.3
0
0.01
0.02
0.03
0.04
C E D N 0
0.01
0.02
0.03
0.04
C E D N
0
2
4
6
C E D N 0
2
4
6
C E D N 24 hr
KCG KC Ph
yllo
icus
Bio
mas
s (m
g dr
y m
ass
g-1 C
. pel
tata
) !
12 hr 24 hr 12 hr
Treatment
a a a
a
a
b
b b
Phyl
loic
us B
iom
ass
(mg
dry
mas
s g-1
C. p
elta
ta)
!
a a
a a a
b b b
Cec
ropi
a
Dec
ay R
ate
(%m
ass l
ost d
ay -1
)
Cec
ropi
a
Dec
ay R
ate
(%m
ass l
ost d
ay -1
)
Figure 3: Mean (+SE) decay rate of (a,b) Cecropia peltata leaves (% mass lost day-1) and (c,d) Phylloicus hansoni resource-specific biomass (mg dry mass g-1 Cecropia) for the exclosure experiment, where 24 hour treatments allow full macroconsumer access [control (C)] or completely exclude macroconsumers [electric (E)]. 12 hour treatments allow access to either diurnally active [day (D)] or nocturnally active [night (N)] macroconsumers. Experiment conducted in reaches containing either (a) killifish, crabs, and guppies (KCG), or (b) only killifish and crabs (KC) and replicated in pools (n=5 per reach). Letters between bars indicate results of post-hoc Tukey-Kramer HSD tests, with different letters indicating significant within reach differences in pairs of means between treatments.
a) b)
c) d)
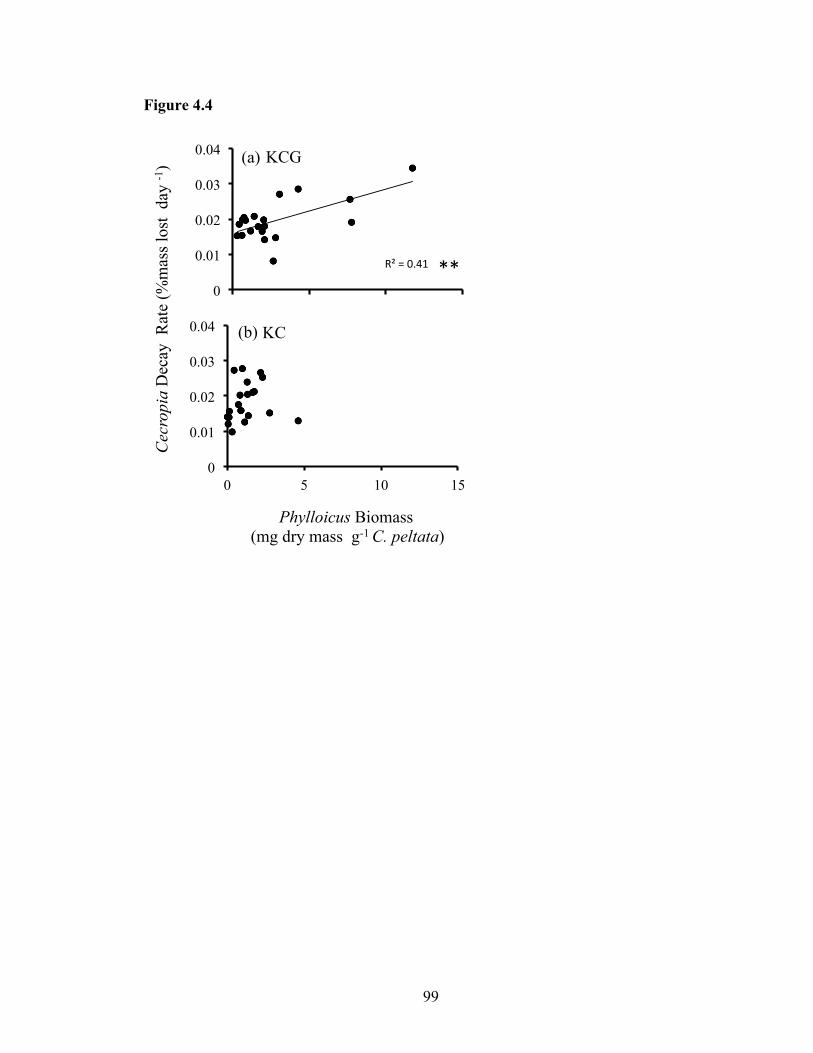
99
Figure 4.4
0
0.01
0.02
0.03
0.04
0 5 10 15
Cec
ropi
a D
ecay
Rat
e (%
mas
s lo
st d
ay -1
) !
Phylloicus Biomass (mg dry mass g-1 C. peltata)
!
Figure 4: Bivariate fit of decay rate for leaves of Cecropia peltata (% mass lost day-1) and Phylloicus hansoni resource-specific biomass (mg dry mass g-1 Cecropia) from the exclosure experiment. Experiment conducted in reaches containing either (a) killifish, crabs, and guppies (KCG), or (b) only killifish and crabs (KC) and replicated by diel treatments in pools (n=20 per reach). Statistical significance of correlation noted by * (P<0.05) and ** (P<0.01).
R²!=!0.41!
0
0.01
0.02
0.03
0.04
0 5 10 15
KC (b)
KCG (a)
**!

100
Figure 4.5
0
4
8
12
KCG KC
0
0.008
0.016
0.024
KCG KC
Cec
ropi
a
D
ecay
Rat
e (%
mas
s los
t da
y-1)
Reach
Figure 5: Mean (+SE) (a) decay rate for Cecropia peltata leaves (% mass lost day-1) and (b) Phylloicus hansoni resource-specific biomass (mg dry mass g-1 Cecropia) for the landscape study. Landscape study conducted in streams consisting of a paired reach containing killifish, crabs, and guppies (KCG) downstream, and killifish and crabs (KC) upstream. Estimates of leaf decay were replicated across streams (n=6 streams per reach type). Letters between bars indicate results of one-way ANOVA, with different letters indicating significant differences in pairs of means between reaches.
a
b
Phyl
loic
us B
iom
ass
(mg
dry
mas
s g-1
C. p
elta
ta)
!
(a)
(b) a
b
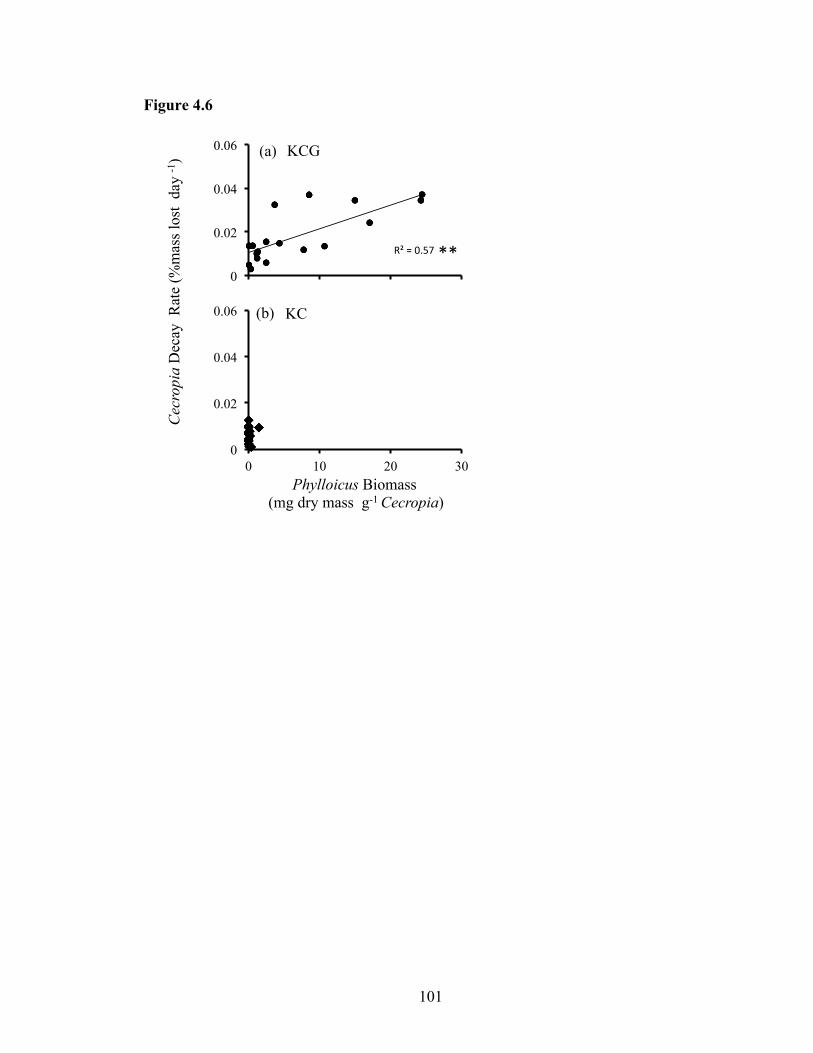
101
Figure 4.6
0
0.02
0.04
0.06
0 10 20 30
Figure 6: Bivariate fit of decay rate for Cecropia peltata leaves (% mass lost day-1) and Phylloicus hansoni resource-specific biomass (mg dry mass g-1 Cecropia) from the landscape study. Study conducted in streams consisting of a paired reach containing (a) killifish, crabs, and guppies (KCG) downstream, and killifish and (b) crabs (KC) upstream, and replicated in pools (n=18 pool per reach type). Statistical significance of correlation noted by * (P<0.05) and ** (P<0.01).
R²!=!0.57!
0
0.02
0.04
0.06
0 10 20 30
Cec
ropi
a D
ecay
Rat
e (%
mas
s lo
st d
ay -1
) !
KC (b)
KCG (a)
Phylloicus Biomass (mg dry mass g-1 Cecropia)
!
**!

102
Figure 4.7
0
5
10
15
0 1 2 3 4 5 6 7
Phyl
loic
us B
iom
ass
(mg
dry
mas
s g-1
Cec
ropi
a)
Pool
KCG! KC!
Waterfall!
1 2 3 4 5 6
Figure 7: Phylloicus hansoni resource-specific biomass [mg dry mass g-1 Cecropia (+ SE)], in individual pools averaged over the 4 week landscape study. Landscape study consisting of a reach containing killifish, crabs, and guppies (KCG, pools 1-3) downstream, paired with a reach containing killifish and crabs (KC, pools 4-6) upstream. Estimates of Phylloicus biomass were replicated in pools nested within streams (n=6 streams per reach type). Individual pools were separated by at least 50 m and adjacent pools in KCG (pool 3) and KC (pool 4) reaches were separated by no more than 100 m. Letters between bars indicate results of post-hoc Tukey-Kramer HSD tests, with different letters indicating significant differences in pairs of means between pools. Analysis tests whether changes in Phylloicus biomass are gradual along a stream continuum or abrupt when macroconsumer assemblage changes.
Water Flow

103
CHAPTER 5
CONCLUSIONS AND RECOMMENDATIONS FOR FUTURE RESEARCH
General Conclusions
This dissertation explored direct and indirect ecosystem effects of
macroconsumers in aquatic community dynamics, using Trinidadian guppies in the
mountain streams of Northern Trinidad as a model system. The findings of this
dissertation broadly suggest that in order to understand the ecosystem consequences of
macroconsumers more fully, future research must consider the effects of intraspecific
variation, macroconsumer consumption and excretion, and the functional relationships
among sympatric macroconsumers. These results have strong conservation implications
given the global trend of biodiversity loss in higher trophic levels (Duffy 2002, Petchey
et al. 2004).
In Chapter 2, I explored the relative importance of macroconsumer consumptive
and non-consumptive effects for primary producer growth and biomass. We found strong
evidence that browsing by guppies dominated the top-down effects of macroconsumers
on algal accrual rate and algal biomass consistently across four streams in Northern
Trinidad. Additionally I found that the net effects of guppies, from high elevation
streams, on algal growth and biomass, was not the result of a simple top-down
consumptive effect, but likely the combination of large and opposing top-down and

104
bottom-up effects. Surprisingly, these results suggest that opposing consumptive and non-
consumptive effects reduced the observed net effects of guppies.
In Chapter 3, I examined the ecosystem consequences of macroconsumer local
adaptation in situ. The results of this study show that the local adaptation of guppy
populations, to the loss of large piscivorous fish in higher elevation streams, shifted their
top-down ecosystem effects from reducing macroinvertebrate standing stock biomass to
reducing primary producer standing stock biomass. Moreover, I found that the
differential effects of guppy phenotypes on primary producers were similar in magnitude
to that of light availability, an important abiotic driver of ecosystems.
Finally in Chapter 4, I investigated the top-down effects of macroconsumers on
leaf decomposition rates in the context of the natural presence or absence of omnivorous
guppies from a system containing multiple macroconsumers. Our results demonstrate that
the loss of an omnivorous consumer from a macroconsumer assemblage can alter the
strength of top down effects of the remaining macroconsumer community on an
important ecosystem-level process at both local- and landscape-scales.
Recommendations For Future Research
My findings are based on studies conducted during the dry season. In Trinidadian
streams, like those most temperate and tropical streams, the strongest interaction strength
between biota is likely to occur during baseflow conditions experienced during the dry
season. This is partly due to the reduced water volume in the dry season, which increases
the density of consumers, but also because repeated storm events, during the wet season,
often ‘reset’ the benthic environment and may greatly reduce the biomass of biota.

105
Therefore, to fully characterize the effects of macroconsumers on ecosystem structure
and function, future research should examine effects of macroconsumers in both the wet
and the dry season. If resources were infinite, I would suggest a continuous electric
exclosure study to examine the top-down and bottom-up effects of macroconsumers
across multiple years. This would allow investigating if macroconsumer ecosystem
effects are context dependent and elucidate possible interactive effects of
macroconsumers and abiotic disturbances like floods. Pringle and Homazaki (1997),
reported evidence that the presence of omnivorous fish stabilized the benthic
environment, thereby reducing the effects of a storm event.
In Trinidad, I predict that transition periods between wet and dry season could be
a particularly key time to investigate interactions between macroconsumer and abiotic
events. For example, in a dry period after a prolonged phase of flooding,
macroinvertebrate grazer biomass and inorganic sediment would be extremely low
potentially allowing for benthic primary producers to have accelerated growth rates.
During this period I would predict that macroconsumer nutrient excretion could become a
particularly important bottom-up pathway allowing primary producer biomass to grow at
a faster rate. Additionally, in the transition from dry to wet season, loose sediment is
often washed into streams and may limit primary production. I predict that benthic
grazing and excretion by macroconsumers could facilitate a longer “growing season” for
primary producers by clearing sediments and reducing nutrient limitation (sensu Power
1990).
Interactions between abiotic disturbance and patterns of species abundance have
long been acknowledged (Connell 1961), however investigating how abiotic factors

106
influence the direction and magnitude of macroconsumers top-down and bottom-up
effects on lower trophic levels would be a novel path for future research.

107
REFERENCES
Agrawal, A. A., M. T. J. Johnson, A. P. Hastings, and J. L. Maron. 2013. A Field Experiment Demonstrating Plant Life-History Evolution and Its Eco-Evolutionary Feedback to Seed Predator Populations. American Naturalist 181:S35-S45.
Allen, S. E. 1974. Chemical Analysis of Ecological Materials. Blackwell Scientific
Publications, London, UK:565. Bassar, R. D., R. Ferriere, A. Lopez-Sepulcre, M. C. Marshall, J. Travis, C. M. Pringle,
and D. N. Reznick. 2012. Direct and Indirect Ecosystem Effects of Evolutionary Adaptation in the Trinidadian Guppy (Poecilia reticulata). American Naturalist 180:167-185.
Bassar, R. D., M. C. Marshall, A. Lopez-Sepulcre, E. Zandona, S. K. Auer, J. Travis, C.
M. Pringle, A. S. Flecker, S. A. Thomas, D. F. Fraser, and D. N. Reznick. 2010. Local adaptation in Trinidadian guppies alters ecosystem processes. Proceedings of the National Academy of Sciences of the United States of America 107:3616-3621.
Becker, B., M. S. Moretti, and M. Callisto. 2009. Length-dry mass relationships for a
typical shredder in Brazilian streams (Trichoptera: Calamoceratidae). Aquatic Insects 31:227-234.
Benke, A. C., A. D. Huryn, L. A. Smock, and J. B. Wallace. 1999. Length-mass
relationships for freshwater macroinvertebrates in North America with particular reference to the southeastern United States. Journal of the North American Benthological Society 18:308-343.
Botosaneanu, L., and D. Sakal. 1992. Ecological observations on the caddisflies (Insecta:
Trichoptera) from Trinidad and Tobago (W. Indies). Revue d'hydrobiologie tropicale 25:197.
Boyero, L., P. A. Rincon, and R. G. Pearson. 2008. Effects of a predatory fish on a
tropical detritus-based food web. Ecological Research 23:649-655. Bruno, J. F., and M. I. O'Connor. 2005. Cascading effects of predator diversity and
omnivory in a marine food web. Ecology Letters 8:1048-1056. Butman, D., and P. A. Raymond. 2011. Significant efflux of carbon dioxide from streams
and rivers in the United States. Nature Geoscience 4:839-842.

108
Capps, K. A., A. Ulseth, and A. S. Flecker. 2014. Quantifying the top-down and bottom-up effects of a non-native grazer in freshwaters. Biological Invasions:1-14.
Carpenter, S. R., J. F. Kitchell, and J. R. Hodgson. 1985. Cascading trophic interactions
and lake productivity. Bioscience:634-639. Carpenter, S. R., J. F. Kitchell, J. R. Hodgson, P. A. Cochran, J. J. Elser, M. M. Elser, D.
M. Lodge, D. Kretchmer, X. He, and C. N. Vonende. 1987. Regulation of lake primary production by food web structure. Ecology 68:1863-1876.
Connell, J. H. 1961. The influence of interspecific competition and other factors on the
distribution of the barnacle Chthamalus stellatus. Ecology 42:710-723. Connelly, S., C. M. Pringle, R. J. Bixby, R. Brenes, M. R. Whiles, K. R. Lips, S. Kilham,
and A. D. Huryn. 2008. Changes in Stream Primary Producer Communities Resulting from Large-Scale Catastrophic Amphibian Declines: Can Small-Scale Experiments Predict Effects of Tadpole Loss? Ecosystems 11:1262-1276.
Dorn, N. J., and J. M. Wojdak. 2004. The role of omnivorous crayfish in littoral
communities. Oecologia 140:150-159. Duffy, J. E. 2002. Biodiversity and ecosystem function: the consumer connection. Oikos
99:201-219. El-Sabaawi, R. W., R. D. Bassar, C. Rakowski, M. C. Marshall, B. L. Bryan, S. N.
Thomas, C. Pringle, D. N. Reznick, and A. S. Flecker. 2015. Intraspecific phenotypic differences in fish affect ecosystem processes as much as bottom–up factors. Oikos:n/a-n/a.
Estes, J. A., J. Terborgh, J. S. Brashares, M. E. Power, J. Berger, W. J. Bond, S. R.
Carpenter, T. E. Essington, R. D. Holt, J. B. C. Jackson, R. J. Marquis, L. Oksanen, T. Oksanen, R. T. Paine, E. K. Pikitch, W. J. Ripple, S. A. Sandin, M. Scheffer, T. W. Schoener, J. B. Shurin, A. R. E. Sinclair, M. E. Soule, R. Virtanen, and D. A. Wardle. 2011. Trophic Downgrading of Planet Earth. Science 333:301-306.
Feller, R. J., and R. M. Warwick. 1988. Energetics.in R. P. Higgins and H. Thiel, editors.
Introduction to the study of meiofauna. Smithsonian Institution Press, Washington, DC.
Finke, D. L., and R. F. Denno. 2002. Intraguild predation diminished in complex-
structured vegetation: implications for prey suppression. Ecology 83:643-652. Finke, D. L., and R. F. Denno. 2005. Predator diversity and the functioning of
ecosystems: the role of intraguild predation in dampening trophic cascades. Ecology Letters 8:1299-1306.

109
Fitzpatrick, S. W., J. Torres-Dowdall, D. N. Reznick, C. K. Ghalambor, and W. C. Funk. 2014. Parallelism Isn’t Perfect: Could Disease and Flooding Drive a Life-History Anomaly in Trinidadian Guppies? The American Naturalist 183:290-300.
Flecker, A. S. 1996. Ecosystem engineering by a dominant detritivore in a diverse
tropical stream. Ecology 77:1845-1854. Flint Jr, O. S. 1996. Studies of neotropical caddisflies LV: Trichoptera of Trinidad and
Tobago. Transactions of the American Entomological Society:67-113. Fraser, D. F., J. F. Gilliam, M. P. MacGowan, C. M. Arcaro, and P. H. Guillozet. 1999.
Habitat quality in a hostile river corridor. Ecology 80:597-607. Fraser, D. F., and B. A. Lamphere. 2013. Experimental evaluation of predation as a
facilitator of invasion success in a stream fish. Ecology 94:640-649. Gelman, A. 2007. Data analysis using regression and multilevel/hierarchical models.
Cambridge University Press. Gilliam, J. F., D. F. Fraser, and M. Alkinskoo. 1993. Sructure of a tropical stream fish
community - a role for biotic interactions. Ecology 74:1856-1870. Greathouse, E. A., C. M. Pringle, and W. H. McDowell. 2006. Do small-scale
exclosure/enclosure experiments predict the effects of large-scale extirpation of freshwater migratory fauna? Oecologia 149:709-717.
Hedges, L. V., J. Gurevitch, and P. S. Curtis. 1999. The meta-analysis of response ratios
in experimental ecology. Ecology 80:1150-1156. Huang, C., and A. Sih. 1991. Experimental studies on direct and indirect interactions in a
three trophic-level stream system. Oecologia 85:530-536. Hutchinson, G. E. 1965. The ecological theater and the evolutionary play. Yale
University Press New Haven. Knoll, L. B., P. B. McIntyre, M. J. Vanni, and A. S. Flecker. 2009. Feedbacks of
consumer nutrient recycling on producer biomass and stoichiometry: separating direct and indirect effects. Oikos 118:1732-1742.
Kohler, T. J., T. N. Heatherly, R. W. El-Sabaawi, E. Zandona, M. C. Marshall, A. S.
Fecker, C. M. Pringle, D. N. Reznick, and S. A. Thomas. 2012. Flow, nutrients, and light availability influence Neotropical epilithon biomass and stoichiometry. Freshwater Science 31:1019-1034.
Konishi, M., S. Nakano, and T. Iwata. 2001. Trophic cascading effects of predatory fish
on leaf litter processing in a Japanese stream. Ecological Research 16:415-422.

110
Liley, N., and B. Seghers. 1975. Factors affecting the morphology and behaviour of guppies in Trinidad. Function and evolution in behaviour:92-118.
Loeb, S. L. 1981. An insitu method for measuring the primary productivity and standing
crop of the epilithic periphyton community in lentic systems Limnology and Oceanography 26:394-399.
Magurran, A. E. 2005. Evolutionary ecology: the Trinidadian guppy. Oxford University
Press. Maitland, D. P. 2003. Predation on snakes by the freshwater land crab Eudaniela
garmani. Journal of Crustacean Biology 23:241-246. Malmqvist, B. 1993. Interactions in stream leaf packs: effects of a stonefly predator on
detritivores and organic matter processing. Oikos:454-462. Marshall, M. C., A. J. Binderup, E. Zandona, S. Goutte, R. D. Bassar, R. W. El-Sabaawi,
S. A. Thomas, A. S. Flecker, S. S. Kilham, D. N. Reznick, and C. M. Pringle. 2012. Effects of Consumer Interactions on Benthic Resources and Ecosystem Processes in a Neotropical Stream. Plos One 7.
Merritt, R. W., K. W. Cummins, and M. B. Berg. 2008. An Introduction to the Aquatic
Insects of North America. 4th edition. Kendall Hunt, Dubuque, IA. Moore, J. C., E. L. Berlow, D. C. Coleman, P. C. de Ruiter, Q. Dong, A. Hastings, N. C.
Johnson, K. S. McCann, K. Melville, P. J. Morin, K. Nadelhoffer, A. D. Rosemond, D. M. Post, J. L. Sabo, K. M. Scow, M. J. Vanni, and D. H. Wall. 2004. Detritus, trophic dynamics and biodiversity. Ecology Letters 7:584-600.
Moulton, T. P., M. L. Souza, E. F. Brito, M. R. A. Braga, and S. E. Bunn. 2012. Strong
interactions of Paratya australiensis (Decapoda: Atyidae) on periphyton in an Australian subtropical stream. Marine and Freshwater Research 63:834-844.
Murray, K. In Prep. Evidence for inter-reach variation in the population size structure of
a shredding caddisfly (Phylloicus hansoni) in headwater streams, Trinidad. Obernborfer, R. Y., J. V. McArthur, J. R. Barnes, and J. Dixon. 1984. The effect of
invertebrate predators on leaf litter processing in an alpine stream. Ecology:1325-1331.
Palkovacs, E. P., M. C. Marshall, B. A. Lamphere, B. R. Lynch, D. J. Weese, D. F.
Fraser, D. N. Reznick, C. M. Pringle, and M. T. Kinnison. 2009. Experimental evaluation of evolution and coevolution as agents of ecosystem change in Trinidadian streams. Philosophical Transactions of the Royal Society B-Biological Sciences 364:1617-1628.

111
Palkovacs, E. P., and D. M. Post. 2009. Experimental evidence that phenotypic divergence in predators drives community divergence in prey. Ecology 90:300-305.
Pennisi, E. 2012. The Great Guppy Experiment. Science 337:904-908. Perez, R. G. 1988. Guia para el estudio de los macroinvertebrados acuaticos del
Departmento de Antioquia. Universidad de Antioquia, Medellin, Colombia. Petchey, O. L., A. L. Downing, G. G. Mittelbach, L. Persson, C. F. Steiner, P. H. Warren,
and G. Woodward. 2004. Species loss and the structure and functioning of multitrophic aquatic systems. Oikos 104:467-478.
Petchey, O. L., P. T. McPhearson, T. M. Casey, and P. J. Morin. 1999. Environmental
warming alters food-web structure and ecosystem function. Nature 402:69-72. Plummer, M. 2003. JAGS: A program for analysis of Bayesian graphical models using
Gibbs sampling. Pages 20-22 in Proceedings of the 3rd International Workshop on Distributed Statistical Computing (DSC 2003). March.
Polis, G. A., C. A. Myers, and R. D. Holt. 1989. The ecology and evolution of intraguild
predation: potential competitors that eat each other. Annual Review of Ecology and Systematics:297-330.
Polis, G. A., and D. R. Strong. 1996. Food web complexity and community dynamics.
American Naturalist 147:813-846. Post, D. M., E. P. Palkovacs, E. G. Schielke, and S. I. Dodson. 2008. Intraspecific
variation in a predator affects community structure and cascading trophic interactions. Ecology 89:2019-2032.
Power, M. E. 1990. Resource enhancement by indirect effects of grazers: armored
catfish, algae, and sediment. Ecology:897-904. Power, M. E., W. J. Matthews, and A. J. Stewart. 1985. Grazing minnows, piscivorous
bass, and stream algae: dynamics of a strong interaction. Ecology 66:1448-1456. Pringle, C. M., and G. A. Blake. 1994. Quantitative effects of Atyid shrimp (Decapoda,
Atyidae) on the depostional environment in a tropical stream - use of electricity for experimental exclusion. Canadian Journal of Fisheries and Aquatic Sciences 51:1443-1450.
Pringle, C. M., and T. Hamazaki. 1997. Effects of fishes on algal response to storms in a
tropical stream. Ecology 78:2432-2442.

112
Pringle, C. M., and T. Hamazaki. 1998. The role of omnivory in a neotropical stream: Separating diurnal and nocturnal effects. Ecology 79:269-280.
Pringle, C. M., N. Hemphill, W. H. McDowell, A. Bednarek, and J. G. March. 1999.
Linking species and ecosystems: Different biotic assemblages cause interstream differences in organic matter. Ecology 80:1860-1872.
Reznick, D., M. J. Butler, and H. Rodd. 2001. Life-history evolution in guppies. VII. The
comparative ecology of high- and low-predation environments. American Naturalist 157:126-140.
Reznick, D., and J. A. Endler. 1982. The impact of predation on the life-history evolution
in Trinidadian guppies (Poecilia reticulata). Evolution 36:160-177. Reznick, D. A., H. Bryga, and J. A. Endler. 1990. Experimentally induced life-history
evolution in a natural-population. Nature 346:357-359. Reznick, D. N., R. D. Bassar, J. Travis, and F. H. Rodd. 2012. Life-history evolution in
guppies VII: The demographics of density regulation in guppies (Poecilia reticulata). Evolution 66:2903-2915.
Reznick, D. N., F. H. Shaw, F. H. Rodd, and R. G. Shaw. 1997. Evaluation of the rate of
evolution in natural populations of guppies (Poecilia reticulata). Science 275:1934-1937.
Rickson, F. R. 1977. Progressive loss of ant-related traits of Cecropia peltata on selected
Caribbean islands. American Journal of Botany:585-592. Ripple, W. J., J. A. Estes, R. L. Beschta, C. C. Wilmers, E. G. Ritchie, M. Hebblewhite,
J. Berger, B. Elmhagen, M. Letnic, M. P. Nelson, O. J. Schmitz, D. W. Smith, A. D. Wallach, and A. J. Wirsing. 2014. Status and Ecological Effects of the World's Largest Carnivores. Science 343:151-+.
Ripple, W. J., E. J. Larsen, R. A. Renkin, and D. W. Smith. 2001. Trophic cascades
among wolves, elk and aspen on Yellowstone National Park's northern range. Biological Conservation 102:227-234.
Ruetz, C. R., R. M. Newman, and B. Vondracek. 2002. Top-down control in a detritus-
based food web: fish, shredders, and leaf breakdown. Oecologia 132:307-315. S Greig, H., and A. R McIntosh. 2006. Indirect effects of predatory trout on organic
matter processing in detritus-‐‑based stream food webs. Oikos 112:31-40. Schmitz, O. J., P. A. Raymond, J. A. Estes, W. A. Kurz, G. W. Holtgrieve, M. E. Ritchie,
D. E. Schindler, A. C. Spivak, R. W. Wilson, and M. A. Bradford. 2014. Animating the carbon cycle. Ecosystems 17:344-359.

113
Schoener, T. W. 2011. The Newest Synthesis: Understanding the Interplay of Evolutionary and Ecological Dynamics. Science 331:426-429.
Schofield, K. A., C. M. Pringle, J. L. Meyer, and E. J. Rosi-Marshall. 2008. Functional
redundancy of stream macroconsumers despite differences in catchment land use. Freshwater Biology 53:2587-2599.
Seber, G. A. F. 1982. The estimation of animal abundance. Griffin. Simon, T. N. In Prep. Isolating the effects of Trinidadian guppies from sympatric
macroconsumers on the structure of the ecosystem using an in situ density manipulation.
Sterner, R. W. 1986. Herbivores' direct and indirect effects on algal populations.
Science(Washington) 231:605-607. Strayer, D. L. 2010. Alien species in fresh waters: ecological effects, interactions with
other stressors, and prospects for the future. Freshwater Biology 55:152-174. Strong, D. R. 1992. Are trophic cascades all wet? Differentiation and donor-control in
speciose ecosystems. Ecology 73:747-754. Sutherland, W. J., R. P. Freckleton, H. C. J. Godfray, S. R. Beissinger, T. Benton, D. D.
Cameron, Y. Carmel, D. A. Coomes, T. Coulson, and M. C. Emmerson. 2013. Identification of 100 fundamental ecological questions. Journal of Ecology 101:58-67.
Tanabe, K., and T. Namba. 2005. Omnivory creates chaos in simple food web models.
Ecology 86:3411-3414. Taylor, B. W., A. S. Flecker, and R. O. Hall. 2006. Loss of a harvested fish species
disrupts carbon flow in a diverse tropical river. Science 313:833-836. Turcotte, M. M., D. N. Reznick, and J. D. Hare. 2011. The impact of rapid evolution on
population dynamics in the wild: experimental test of eco-evolutionary dynamics. Ecology Letters 14:1084-1092.
Urban, M. C. 2013. Evolution mediates the effects of apex predation on aquatic food
webs. Proceedings of the Royal Society B-Biological Sciences 280. Vannote, R. L., G. W. Minshall, K. W. Cummins, J. R. Sedell, and C. E. Cushing. 1980.
The river continuum concept. Canadian Journal of Fisheries and Aquatic Sciences 37:130-137.
114
Wake, D. B., and V. T. Vredenburg. 2008. Are we in the midst of the sixth mass extinction? A view from the world of amphibians. Proceedings of the National Academy of Sciences of the United States of America 105:11466-11473.
Wallace, J. B., S. L. Eggert, J. L. Meyer, and J. R. Webster. 1997. Multiple trophic levels
of a forest stream linked to terrestrial litter inputs. Science 277:102-104. Walsh, M. R., D. F. Fraser, R. D. Bassar, and D. N. Reznick. 2011. The direct and
indirect effects of guppies: implications for life-history evolution in Rivulus hartii. Functional Ecology 25:227-237.
Walsh, M. R., and D. N. Reznick. 2009. Phenotypic diversification across an
environmental gradient: a role for predators and resource availability on the evolution of life histories. Evolution 63:3201-3213.
Woodward, G., G. Papantoniou, F. Edwards, and R. B. Lauridsen. 2008. Trophic trickles
and cascades in a complex food web: impacts of a keystone predator on stream community structure and ecosystem processes. Oikos 117:683-692.
Wu, X., J. E. Duffy, P. B. Reich, and S. Sun. 2011. A brown-world cascade in the dung
decomposer food web of an alpine meadow: effects of predator interactions and warming. Ecological Monographs 81:313-328.
Yoshida, T., L. E. Jones, S. P. Ellner, G. F. Fussmann, and N. G. Hairston. 2003. Rapid
evolution drives ecological dynamics in a predator-prey system. Nature 424:303-306.
Zandona, E., S. K. Auer, S. S. Kilham, J. L. Howard, A. Lopez-Sepulcre, M. P.
O'Connor, R. D. Bassar, A. Osorio, C. M. Pringle, and D. N. Reznick. 2011. Diet quality and prey selectivity correlate with life histories and predation regime in Trinidadian guppies. Functional Ecology 25:964-973.
Zou, X., C. P. Zucca, R. B. Waide, and W. H. McDowell. 1995. Long-term influence of
deforestation on tree species composition and litter dynamics of a tropical rain forest in Puerto Rico. Forest Ecology and Management 78:147-157.
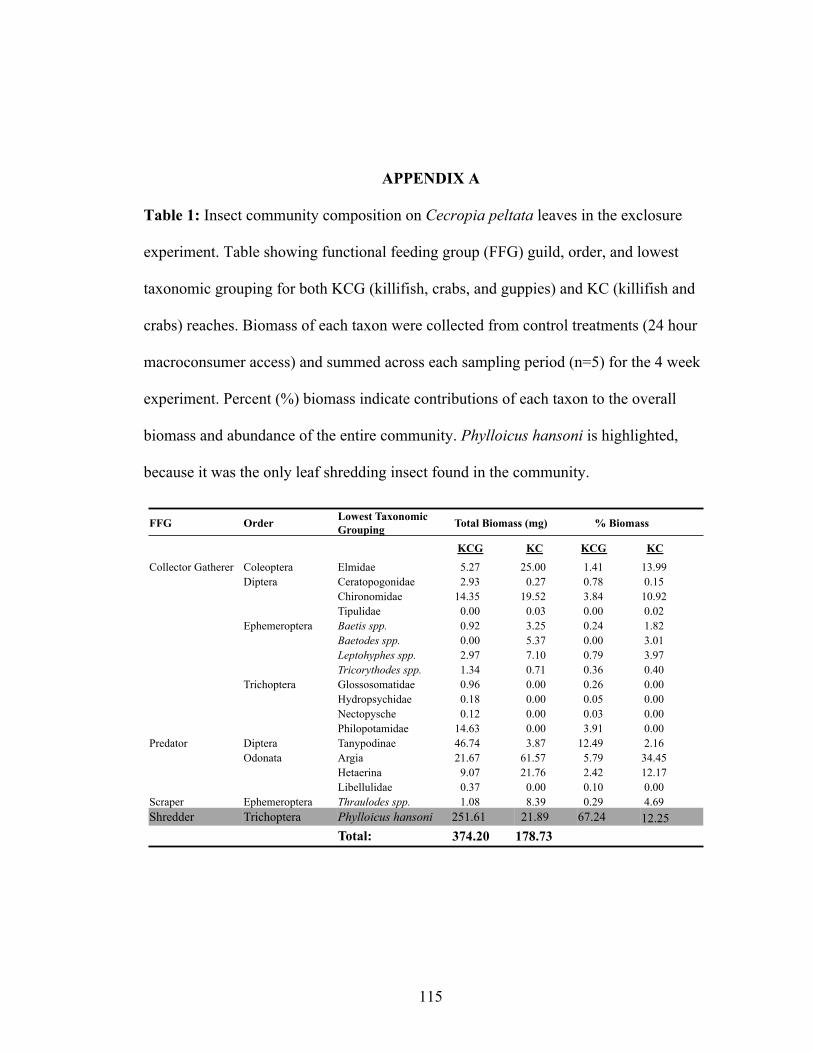
115
APPENDIX A
Table 1: Insect community composition on Cecropia peltata leaves in the exclosure
experiment. Table showing functional feeding group (FFG) guild, order, and lowest
taxonomic grouping for both KCG (killifish, crabs, and guppies) and KC (killifish and
crabs) reaches. Biomass of each taxon were collected from control treatments (24 hour
macroconsumer access) and summed across each sampling period (n=5) for the 4 week
experiment. Percent (%) biomass indicate contributions of each taxon to the overall
biomass and abundance of the entire community. Phylloicus hansoni is highlighted,
because it was the only leaf shredding insect found in the community.
FFG Order Lowest Taxonomic Grouping Total Biomass (mg) % Biomass
KCG KC KCG KC
Collector Gatherer Coleoptera Elmidae 5.27 25.00 1.41 13.99 Diptera Ceratopogonidae 2.93 0.27 0.78 0.15
Chironomidae 14.35 19.52 3.84 10.92 Tipulidae 0.00 0.03 0.00 0.02
Ephemeroptera Baetis spp. 0.92 3.25 0.24 1.82 Baetodes spp. 0.00 5.37 0.00 3.01 Leptohyphes spp. 2.97 7.10 0.79 3.97 Tricorythodes spp. 1.34 0.71 0.36 0.40
Trichoptera Glossosomatidae 0.96 0.00 0.26 0.00 Hydropsychidae 0.18 0.00 0.05 0.00 Nectopysche 0.12 0.00 0.03 0.00 Philopotamidae 14.63 0.00 3.91 0.00
Predator Diptera Tanypodinae 46.74 3.87 12.49 2.16 Odonata Argia 21.67 61.57 5.79 34.45
Hetaerina 9.07 21.76 2.42 12.17 Libellulidae 0.37 0.00 0.10 0.00
Scraper Ephemeroptera Thraulodes spp. 1.08 8.39 0.29 4.69 Shredder Trichoptera Phylloicus hansoni 251.61 21.89 67.24 12.25
Total: 374.20 178.73
Supplemental Table 1: Insect community composition on Cecropia peltata leaves in the exclosure experiment. Table showing functional feeding group (FFG) guild, order, and lowest taxonomic grouping for both KCG (killifish, crabs, and guppies) and KC (killifish and crabs) reaches. Biomass of each taxon were collected from control treatments (24 hour macroconsumer access) and summed across each sampling period (n=5) for the 4 week experiment. Percent (%) biomass indicate contributions of each taxon to the overall biomass and abundance of the entire community. Phylloicus hansoni is highlighted, because it was the only leaf shredding insect found in the community.

116
Table 2: Phylloicus hansoni normalized abundance [RSA (No. Phylloicus g-1 Cecropia
dry mass)], and length (mm), averaged over the 4 week landscape study. Landscape study
conducted in streams consisting of a paired reach containing killifish, crabs, and guppies
(KCG) downstream, and killifish and crabs (KC) upstream. Estimates of Phylloicus
biomass, abundance, and length were replicated across streams (n=6 streams per reach
type).
Mean (SE)
Reach RSA Length
KCG 3.64 (1.60) 8.25 (0.93)
KC 0.09 (0.06) 7.41 (0.98)
Supplemental Table 2: Phylloicus hansoni normalized abundance [RSA (No. Phylloicus g-1 Cecropia dry mass)], and length (mm), averaged over the 4 week landscape study. Landscape study conducted in streams consisting of a paired reach containing killifish, crabs, and guppies (KCG) downstream, and killifish and crabs (KC) upstream. Estimates of Phylloicus biomass, abundance, and length were replicated across streams (n=6 streams per reach type). !