Embed Size (px)
Citation preview
http://www.jstor.org
Dimensions of Structure in Effective Organizations: Some Empirical EvidenceAuthor(s): Bernard C. ReimannSource: The Academy of Management Journal, Vol. 17, No. 4, (Dec., 1974), pp. 693-708Published by: Academy of ManagementStable URL: http://www.jstor.org/stable/255647Accessed: 15/07/2008 16:23
Your use of the JSTOR archive indicates your acceptance of JSTOR's Terms and Conditions of Use, available at
http://www.jstor.org/page/info/about/policies/terms.jsp. JSTOR's Terms and Conditions of Use provides, in part, that unless
you have obtained prior permission, you may not download an entire issue of a journal or multiple copies of articles, and you
may use content in the JSTOR archive only for your personal, non-commercial use.
Please contact the publisher regarding any further use of this work. Publisher contact information may be obtained at
http://www.jstor.org/action/showPublisher?publisherCode=aom.
Each copy of any part of a JSTOR transmission must contain the same copyright notice that appears on the screen or printed
page of such transmission.
JSTOR is a not-for-profit organization founded in 1995 to build trusted digital archives for scholarship. We work with the
scholarly community to preserve their work and the materials they rely upon, and to build a common research platform that
promotes the discovery and use of these resources. For more information about JSTOR, please contact [email protected].
Dimensions of Structure
in Effective Organizations:
Some Empirical Evidence'
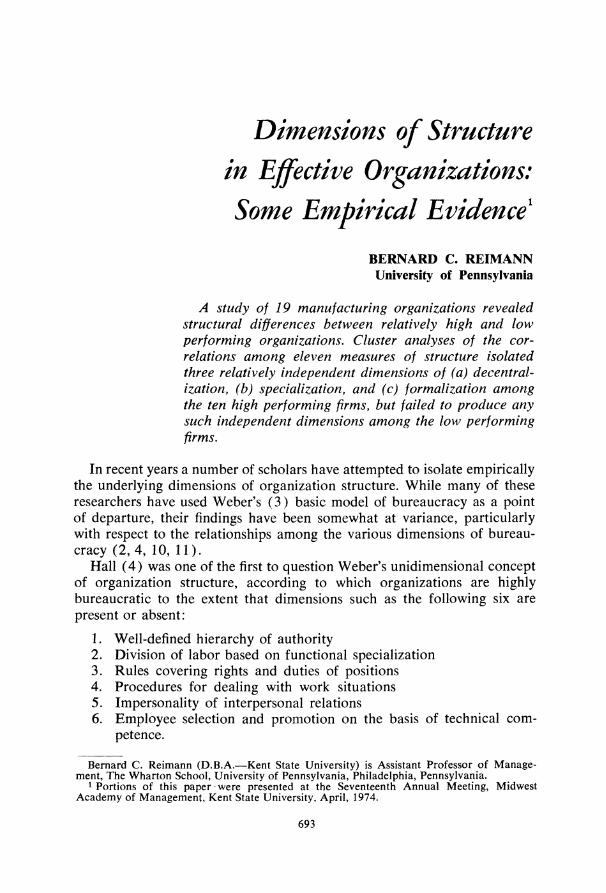
BERNARD C. REIMANN University of Pennsylvania
A study of 19 manufacturing organizations revealed structural differences between relatively high and low performing organizations. Cluster analyses of the cor- relations among eleven measures of structure isolated three relatively independent dimensions of (a) decentral- ization, (b) specialization, and (c) formalization among the ten high performing firms, but failed to produce any such independent dimensions among the low performing firms.
In recent years a number of scholars have attempted to isolate empirically the underlying dimensions of organization structure. While many of these researchers have used Weber's (3) basic model of bureaucracy as a point of departure, their findings have been somewhat at variance, particularly with respect to the relationships among the various dimensions of bureau- cracy (2,4, 10, 11).
Hall (4) was one of the first to question Weber's unidimensional concept of organization structure, according to which organizations are highly bureaucratic to the extent that dimensions such as the following six are present or absent:
1. Well-defined hierarchy of authority 2. Division of labor based on functional specialization 3. Rules covering rights and duties of positions 4. Procedures for dealing with work situations 5. Impersonality of interpersonal relations 6. Employee selection and promotion on the basis of technical com-
petence.
Bernard C. Reimann (D.B.A.-Kent State University) is Assistant Professor of Manage- ment, The Wharton School, University of Pennsylvania, Philadelphia, Pennsylvania.
1 Portions of this paper were presented at the Seventeenth Annual Meeting, Midwest Academy of Management, Kent State University, April, 1974.
693
Academy of Management Journal
Hall conceived of these dimensions as continua representing an organiza- tion's degree of bureaucratization. He measured his dimensions by means of Likert-type scales administered to random samples of employees in ten organizations, half of which were nonprofit government agencies, the other half business firms. Since none of the correlations among his six dimensions reached significance (p < .05), Hall concluded that "the magnitude of the dimensions varied independently in the organizations studied" (4, p. 39).
Hall's study suffered from two basic weaknesses, however. Due to the small size of his sample, its heterogeneity (government agencies as well as business firms) may have been more of a hindrance than a help for purposes of making generalizations. This heterogeneity reduced the likeli- hood of strong correlations between bureaucratic "dimensions" on the one hand, while the smallness of the sample required very high correlation coefficients to reach "significance," on the other.
A second possible weakness of Hall's research was his use of perceptual data. The magnitudes on his dimensions reflected the perceptions of those dimensions by organization participants. Whether this is better or worse than other approaches which might reflect, for example, the biases of researchers, is, of course, debatable.
A subsequent research study by the Aston group (10) did not, however, suffer from these weaknesses, yet it reached essentially similar conclusions. The Aston group studied some 46 British work organizations (primarily profit-oriented manufacturing or service organizations), measuring struc- tural variables by observation and interviews with executives, and making it a point to use no perceptual data. By means of a factor analysis of their structural measures, the Aston researchers derived four independent factors or underlying dimensions of structure: (a) structuring of activities, (b) concentration of authority, (c) line control of workflow, and (d) size of supportive component.
A recent replication of the Aston study by Child (2) produced some- what different results. The first two Aston factors of structuring of activities and concentration of authority merged into a single bi-polar "administrative control" dimension in Child's factor structure (unrotated). This bi-polar factor was defined by a high negative loading on concentration of authority (or centralization), and positive loadings on structuring (formalization and specialization). That is, for the 82 organizations in Child's study, centralized firms tended to be relatively unstructured and decentralized firms relatively structured. Child concluded, therefore, that his results provided support for an administrative strategy of controlling the behavior of organization members either by centralization of authority or by structur- ing of their activities through formalized standards and procedures and by functional specialization.
A possible reason for the difference between Child's results and those of the Aston group may be found in a basic difference in their samples of organizations. The Aston sample consisted of organizations with varying
694 December
Volume 17, Number 4
degrees of dependence on other organizations (i.e., branch plants, sub- sidiaries, etc.); Child examined only legally independent organizational units.
A recent comparative study of 19 Northeast Ohio manufacturing plants (11), also with varying degrees of dependence, and using the Aston group's approach, produced three independent bureaucratic structure dimensions. Both factor and cluster analyses revealed separate dimensions of (a) decentralization, (b) specialization, and (c) formalization; that is, the Aston group's single structuring of activities factor formed two independent dimensions of specialization and formalization in this study of American firms.
A basic issue raised by the research studies cited is the extent to which the bureaucratic aspects of centralization of authority, specialization, and formalization tend to occur together in complex organizations. According to Child, they all tend to be strongly related to form a single unidimensional "strategy of administrative control." The Aston study (10) suggests that formalization and specialization vary together, but are, in turn, independent of decentralization. Finally, the studies by Hall (4) and Reimann (11) indicate that these three bureaucratic dimensions may all vary quite inde- pendently; that is, an organization can be highly formalized, and either centralized or decentralized, and specialized or nonspecialized.
The differences in findings among these research studies demonstrate that the existence of underlying and perhaps universal dimensions of structure is very much open to question. One strong possibility is that the dimensionality of the organization structure space, rather than being universal, may be contingent on the types of organizations studied and the kinds of situations or environments in which they exist. Further research may reveal, for example, that differences in their sociocultural environ- ments have resulted in a more complex structure space, with more inde- pendent dimensions, for industrial organizations in the United States than might be found among their counterparts in Great Britain or other Euro- pean countries. Another possibility is that the dimensionality of organization structure may be related to organizational performance. None of the research studies cited have examined organization structure in relation to organizational effectiveness.
THE STUDY
The research reported in this article was designed to examine the rela- tionship between the underlying dimensions of structure and organizational performance. More specifically, answers to the following two related research questions were sought:
1. What differences, if any, exist between the structural dimensions of relatively high and low performing organizations?
2. If different from those of low performing organizations, what are the dimensions associated with the relatively high performing organizations?
1974 695
Academy of Management Journal
Sample and Method
The sample for this study consisted of 19 Northeast Ohio industrial organizations in a wide range of sizes (220 to 4,000 employees), manu- facturing a variety of products. Data were gathered from personal inter- views with from four to ten top executives (depending on the size of the management team) in each firm, and by consulting available documents such as organization charts, standard operating procedures, or policy manuals.
Organization Effectiveness
The measurement of the relative effectiveness of the industrial organiza- tions in this study presented some difficulties. Data on the various financial indices commonly used to measure this aspect of performance were not available for the majority of organizations, since these data are rarely broken out for subsidiaries or branch plants. Data on many nonfinancial indices were just as difficult to obtain.
It was decided, therefore, to base the measure of the organization's relative effectiveness on the perceptions of its top executives. This type of measure was recently employed by Lawrence and Lorsch (8), who asked executives to rate their organization's overall performance relative to others in their industry on a scale of 0 to 100 percent, with 100 percent regarded as the optimum or ideal performance. In the present study, executives similarly were asked to rate their organization's performance, but on each of eight different criteria.
The first two were the financial criteria of average growth for the past five years in (a) sales and (b) profits. The six nonfinancial indicators included: (a) The firm's ability to attract and retain high-level manpower, (b) satisfaction and morale of employees, (c) quality of the firm's products, (d) service to customers, (e) future growth potential (sales and/or profits), and (f) the rating which its competitors would be expected to give the firm for its overall performance.
A criterion score was determined for each firm on each of the eight criterion measures by (a) computing the mean response for each criterion and (b) assigning a rank score to each firm on every criterion. The internal consistency of rankings assigned firms on the eight criteria was high (Kendall's coefficient of concordance was 0.385, significant at the .001 level); therefore all eight criterion scores were combined to give an overall score for each firm. This score represented the organization's relative effectiveness as perceived by its top management group.
The objectivity of the executive's responses to the two financial indicators could be checked by comparison with actual financial data for six of the nineteen firms where such information was obtainable. Spearman's rank correlation coefficients of .95 and .83 were obtained, respectively, for sales and profit growth for the last five years. The fact that both of these coefficients were significant (p < .05) suggested that the executive rank-
696 December
Volume 17, Number 4
ings of the relative financial performance of their firms corresponded closely to reality, at least for the six firms in question.
In addition to the subjective criteria, an objective criterion of "behavioral" effectiveness was also employed-voluntary turnover among top to middle level executives for the past two years. This executive turnover measure provided an indication of general morale and work satisfaction of top management. Based on the assumption that the more effective the organiza- tion, the happier and less frustrated its top managers and vice versa, it was felt that the organization's sucess in retaining its top executives would pro- vide an indirect indicator of its overall effectiveness. Moreover, this measure was quite objective, since each executive was asked whether any of his fellow executives had left of their own accord in the past two years. On the basis of a consensus of these executives, a reasonably accurate number was established. In order to calculate the turnover rate, this number was expressed as a percentage of the total group of executives considered. Depending on the firm's size and organizational setup, the total group of executives varied in number from about 12 to 40.
The scores of the nineteen firms on the various effectiveness criteria are summarized in Table 1.
Organization Structure
Organization structure was conceptualized in a multidimensional frame- work, as suggested recently by the Aston researchers (10). Therefore, the bulk of the structural measures used in this study were based on the ab- breviated scales published by the Aston group (5). In addition, a structural measure developed by Negandhi and Prasad (9) was used, along with several others adapted from measures reported in the literature. The details of the scaling of these measures have been described in detail elsewhere (11); therefore, the 11 measures will be described only briefly here.
The first three of the following measures are- nearly identical, except as noted, with the Aston measures (5).
1. Functional specialization was the number of specialties from a spe- cific list which were performed by at least one specialist. The EDP function was added to the Aston group's list due to its increasing importance in modern firms. The list included 17 functions such as advertising, market research, employee training and development, quality control, maintenance, and transportation. Each function represented was awarded one point, so that the organization's maximum score was 17 points.
2. Formalization of role definition was a function of the extent to which the employee's role was defined by various formal documents, such as information booklets, organization charts, job descriptions, policy manuals, and the like.
3. Lack of autonomy was measured by the extent to which top manage- ment had to refer certain typical decisions to a higher level of authority (outside the organizational unit being examined).
1974 697
Academy of Managemenlt Journal
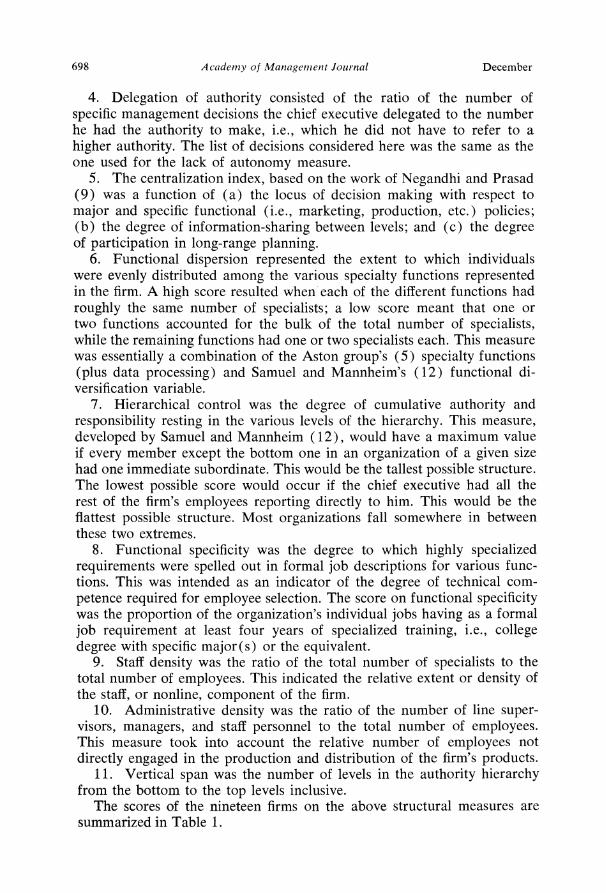
4. Delegation of authority consisted of the ratio of the number of specific management decisions the chief executive delegated to the number he had the authority to make, i.e., which he did not have to refer to a higher authority. The list of decisions considered here was the same as the one used for the lack of autonomy measure.
5. The centralization index, based on the work of Negandhi and Prasad (9) was a function of (a) the locus of decision making with respect to major and specific functional (i.e., marketing, production, etc.) policies; (b) the degree of information-sharing between levels; and (c) the degree of participation in long-range planning.
6. Functional dispersion represented the extent to which individuals were evenly distributed among the various specialty functions represented in the firm. A high score resulted when each of the different functions had roughly the same number of specialists; a low score meant that one or two functions accounted for the bulk of the total number of specialists, while the remaining functions had one or two specialists each. This measure was essentially a combination of the Aston group's (5) specialty functions (plus data processing) and Samuel and Mannheim's (12) functional di- versification variable.
7. Hierarchical control was the degree of cumulative authority and responsibility resting in the various levels of the hierarchy. This measure, developed by Samuel and Mannheim (12), would have a maximum value if every member except the bottom one in an organization of a given size had one immediate subordinate. This would be the tallest possible structure. The lowest possible score would occur if the chief executive had all the rest of the firm's employees reporting directly to him. This would be the flattest possible structure. Most organizations fall somewhere in between these two extremes.
8. Functional specificity was the degree to which highly specialized requirements were spelled out in formal job descriptions for various func- tions. This was intended as an indicator of the degree of technical com- petence required for employee selection. The score on functional specificity was the proportion of the organization's individual jobs having as a formal job requirement at least four years of specialized training, i.e., college degree with specific major(s) or the equivalent.
9. Staff density was the ratio of the total number of specialists to the total number of employees. This indicated the relative extent or density of the staff, or nonline, component of the firm.
10. Administrative density was the ratio of the number of line super- visors, managers, and staff personnel to the total number of employees. This measure took into account the relative number of employees not directly engaged in the production and distribution of the firm's products.
11. Vertical span was the number of levels in the authority hierarchy from the bottom to the top levels inclusive.
The scores of the nineteen firms on the above structural measures are summarized in Table 1.
698 December
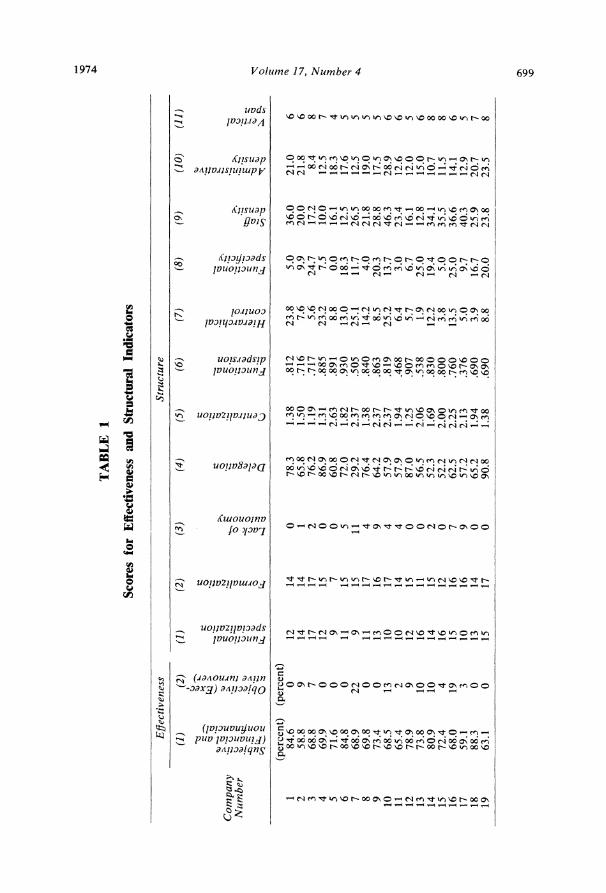
TABLE 1
Scores for Effectiveness and Structural Indicators
E#fectiveness Structure
(1) (2) (1) (2) (3) (4) (5) (6) (7) (8) (9) (10) (11)
Company tJ . 01. | .1 , Number Xi l i 1,,
zS ?:102 0 (.) 00.
1
(percent) (percent) 1 84.6 0 12 14 0 78.3 1.38 .812 23.8 5.0 36.0 21.0 6 2 58.8 9 14 14 1 65.8 1.50 .716 7.6 9.9 20.0 21.8 6 3 68.8 7 17 17 2 76.2 1.19 .717 5.6 24.7 17.2 8.4 8 4 69.9 0 12 15 0 86.9 1.31 .885 23.2 7.5 10.0 12.5 7 5 71.6 0 9 7 0 60.8 2.63 .891 8.8 0.0 16.1 18.3 4 6 84.8 0 11 15 5 72.0 1.82 .930 13.0 18.3 12.5 17.6 5 7 68.9 22 9 15 11 29.2 2.37 .505 25.1 11.7 26.5 12.5 5 8 69.8 0 11 17 4 76.4 1.38 .840 14.2 4.0 21.8 19.0 5 9 73.4 0 13 16 9 64.2 2.37 .863 8.5 20.3 28.8 17.5 5
10 68.5 13 10 17 4 57.9 2.37 .819 25.2 13.7 46.3 28.9 6 11 65.4 2 10 14 4 57.9 1.94 .468 6.4 3.0 23.4 12.6 6 12 78.9 9 12 15 0 87.0 1.25 .907 5.7 6.7 16.1 12.0 5 13 73.8 10 16 11 0 56.5 2.06 .538 1.9 25.0 12.8 15.0 6 14 80.9 10 14 15 2 52.3 1.69 .830 12.2 19.4 34.1 10.7 8 15 72.4 4 16 12 0 52.2 2.00 .800 3.8 5.0 35.5 11.5 8 16 68.0 19 15 16 7 62.5 2.25 .760 13.5 25.0 36.6 14.1 6 17 59.1 3 10 16 9 57.2 2.13 .376 5.0 9.7 40.3 12.9 5 18 88.3 0 13 14 0 65.2 1.94 .690 3.9 16.7 25.9 20.7 7 19 63.1 0 15 17 0 90.8 1.38 .690 8.8 20.0 23.8 23.5 8
0
(Z) 0
0 i.-
0\ \0 \0
Academy of Management Journal
ANALYSIS
Structure Clusters
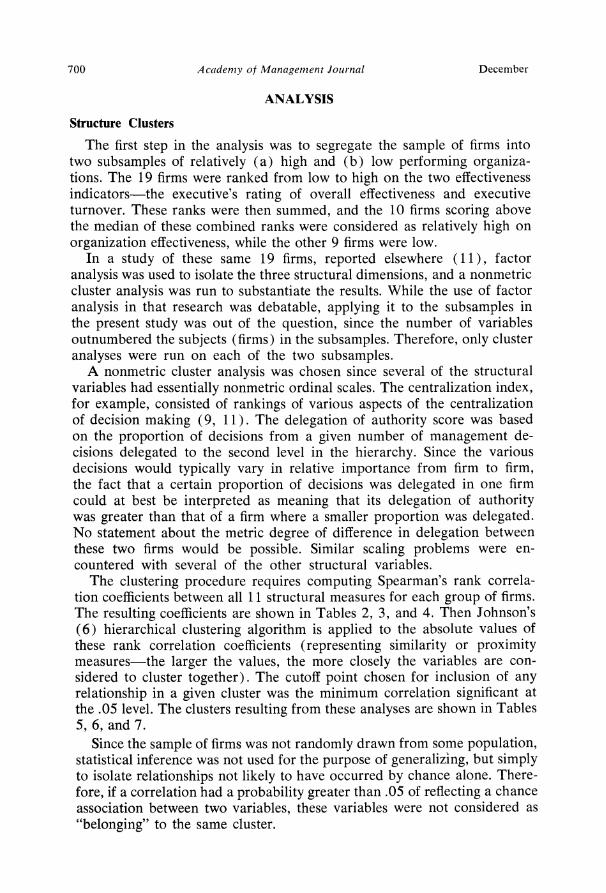
The first step in the analysis was to segregate the sample of firms into two subsamples of relatively (a) high and (b) low performing organiza- tions. The 19 firms were ranked from low to high on the two effectiveness indicators-the executive's rating of overall effectiveness and executive turnover. These ranks were then summed, and the 10 firms scoring above the median of these combined ranks were considered as relatively high on organization effectiveness, while the other 9 firms were low.
In a study of these same 19 firms, reported elsewhere (11), factor analysis was used to isolate the three structural dimensions, and a nonmetric cluster analysis was run to substantiate the results. While the use of factor analysis in that research was debatable, applying it to the subsamples in the present study was out of the question, since the number of variables outnumbered the subjects (firms) in the subsamples. Therefore, only cluster analyses were run on each of the two subsamples.
A nonmetric cluster analysis was chosen since several of the structural variables had essentially nonmetric ordinal scales. The centralization index, for example, consisted of rankings of various aspects of the centralization of decision making (9, 11). The delegation of authority score was based on the proportion of decisions from a given number of management de- cisions delegated to the second level in the hierarchy. Since the various decisions would typically vary in relative importance from firm to firm, the fact that a certain proportion of decisions was delegated in one firm could at best be interpreted as meaning that its delegation of authority was greater than that of a firm where a smaller proportion was delegated. No statement about the metric degree of difference in delegation between these two firms would be possible. Similar scaling problems were en- countered with several of the other structural variables.
The clustering procedure requires computing Spearman's rank correla- tion coefficients between all 11 structural measures for each group of firms. The resulting coefficients are shown in Tables 2, 3, and 4. Then Johnson's (6) hierarchical clustering algorithm is applied to the absolute values of these rank correlation coefficients (representing similarity or proximity measures-the larger the values, the more closely the variables are con- sidered to cluster together). The cutoff point chosen for inclusion of any relationship in a given cluster was the minimum correlation significant at the .05 level. The clusters resulting from these analyses are shown in Tables 5, 6, and 7.
Since the sample of firms was not randomly drawn from some population, statistical inference was not used for the purpose of generalizing, but simply to isolate relationships not likely to have occurred by chance alone. There- fore, if a correlation had a probability greater than .05 of reflecting a chance association between two variables, these variables were not considered as "belonging" to the same cluster.
700 December
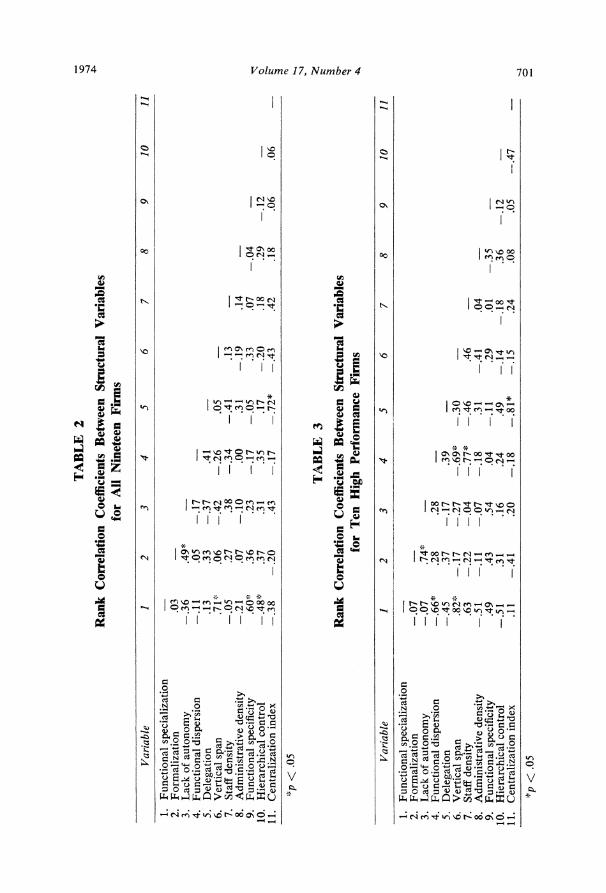
TABLE 2
Rank Correlation Coefficients Between Structural Variables for All Nineteen Firms
Variable 1 2 3 4 5 6 7 8 9 10 11
1. Functional specialization 2. Formalization .03 3. Lack of autonomy -.36 .49* 4. Functional dispersion -.11 .05 -.17 5. Delegation .13 .33 -.37 .41 6. Vertical span .71' .06 -.42 -.26 .05 7. Staff density -.05 .27 .38 -.34 -.41 .13 8. Administrative density -.21 .07 -.10 .00 .31 -.19 .14 9. Functional specificity .60* .36 .23 -.17 -.05 .33 .07 -.04
10. Hierarchical control -.48* .37 .31 .35 .17 -.20 .18 .29 -.12 11. Centralization index -.38 -.20 .43 -.17 -.72* -.43 .42 .18 .06 .06
*p < .05
TABLE 3
Rank Correlation Coefficients Between Structural Variables for Ten High Performance Firms
Variable 1 2 3 4 5 6 7 8 9 10 11
1. Functional specialization 2. Formalization -.07 3. Lack of autonomy -.07 .74* 4. Functional dispersion -.66* .28 .28 5. Delegation -.45 .37 -.17 .39 6. Vertical span .82* -.17 -.27 -.69* -.30 7. Staff density .63 -.22 -.04 -.77* -.46 .46 8. Administrative density -.51 -.11 -.07 -.18 .31 -.41 .04 9. Functional specificity .49 .43 .54 .04 -.11 .29 .01 -.35
10. Hierarchical control -.51 .31 .16 .24 .49 -.14 -.18 .36 -.12 11. Centralization index .11 -.41 .20 -.18 -.81* -.15 .24 .08 .05 --.47
*p < .05
.0
P
t_
0 O ^>
0
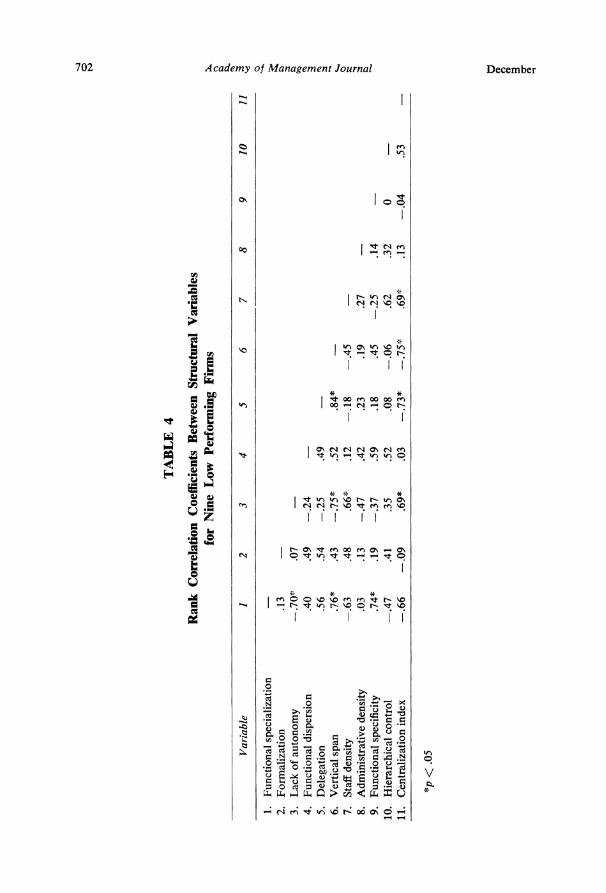
TABLE 4
Rank Correlation Coefficients Between Structural Variables for Nine Low Performing Firms
Variable 1 2 3 4 5 6 7 8 9 10 11
1. Functional specialization 2. Formalization .13 3. Lack of autonomy -.70* .07 4. Functional dispersion .40 .49 - .24 5. Delegation .56 .54 -.25 .49 6. Vertical span .76* .43 -.75* .52 .84* 7. Staff density -.63 .48 .66* .12 -.18 -.45 8. Administrative density .03 .13 -.47 .42 .23 .19 .27 9. Functional specificity .74* .19 -.37 .59 .18 .45 -.25 .14
10. Hierarchical control -.47 .41 .35 .52 .08 -.06 .62 .32 0 11. Centralization index -.66 -.09 .69* .03 -.73* -.75* .69* .13 -.04 .53
*p < .05
0
a
s:
a I
sl
a
opo
CD
CD
Volume 17, Number 4
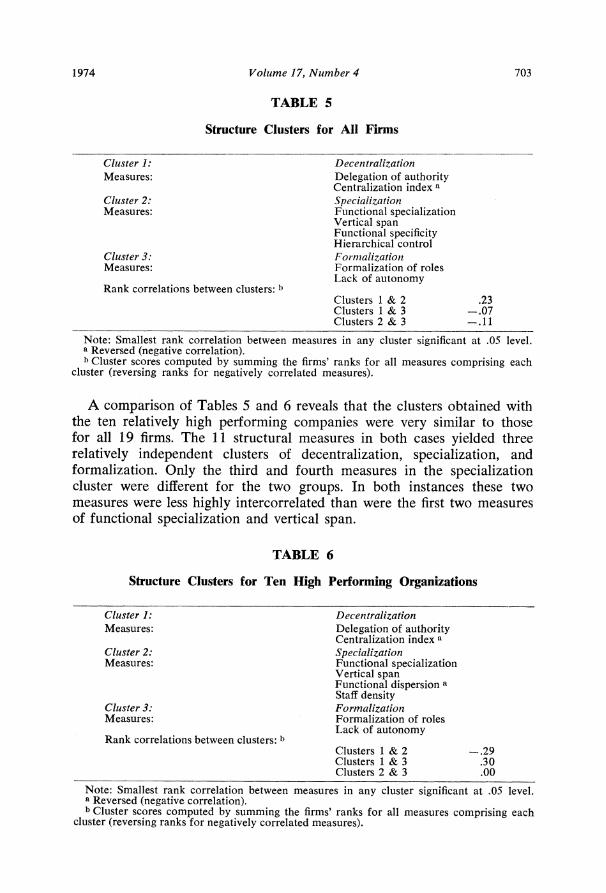
TABLE 5
Structure Clusters for All Firms
Cluster 1: Decentralization Measures: Delegation of authority
Centralization index a Cluster 2: Specialization Measures: Functional specialization
Vertical span Functional specificity Hierarchical control
Cluster 3: Formalization Measures: Formalization of roles
Lack of autonomy Rank correlations between clusters: b
Clusters 1 & 2 .23 Clusters 1 & 3 -.07 Clusters 2 & 3 -.11
Note: Smallest rank correlation between measures in any cluster significant at .05 level. a Reversed (negative correlation). b Cluster scores computed by summing the firms' ranks for all measures comprising each
cluster (reversing ranks for negatively correlated measures).
A comparison of Tables 5 and 6 reveals that the clusters obtained with the ten relatively high performing companies were very similar to those for all 19 firms. The 11 structural measures in both cases yielded three relatively independent clusters of decentralization, specialization, and formalization. Only the third and fourth measures in the specialization cluster were different for the two groups. In both instances these two measures were less highly intercorrelated than were the first two measures of functional specialization and vertical span.
TABLE 6
Structure Clusters for Ten High Performing Organizations
Cluster 1: Decentralization Measures: Delegation of authority
Centralization index a Cluster 2: Specialization Measures: Functional specialization
Vertical span Functional dispersion a Staff density
Cluster 3: Formalization Measures: Formalization of roles
Lack of autonomy Rank correlations between clusters: b
Clusters 1 & 2 -.29 Clusters 1 & 3 .30 Clusters 2 & 3 .00
Note: Smallest rank correlation between measures in any cluster significant at .05 level. a Reversed (negative correlation). b Cluster scores computed by summing the firms' ranks for all measures comprising each
cluster (reversing ranks for negatively correlated measures).
1974 703
Academy of Management Journal
The first cluster appeared to define the decentralization dimension, since it comprised the measures of authority delegation and the centralization index (negative correlation). The third cluster included the measures of formalization of roles and lack of autonomy. Since the lack of autonomy scale indicated the degree to which the organizational unit's decision making process was restricted by a higher authority (i.e., corporate headquarters), both of the above measures were related to the formalization of organiza- tional controls. Therefore, this cluster seemed to measure the organization's degree of formalization. The first two measures in the second cluster clearly identified it as the specialization dimension (both vertical and horizontal specialization, or differentiation). The other four measures appearing in this cluster (two for all firms and two for the high performing firms) were somewhat related to specialization (see the earlier description of variables).
The three dimensions of (a) decentralization, (b) specialization, and (c) formalization were also fairly independent of one another, as the rela- tively low and insignificant (p > .05) rank correlations between these clusters indicate (see Tables 5 and 6). These correlations were calculated by averaging the ranks of all measures representing each cluster to arrive at cluster scores. Spearman's rank correlation coefficients were then com- puted between these cluster scores.
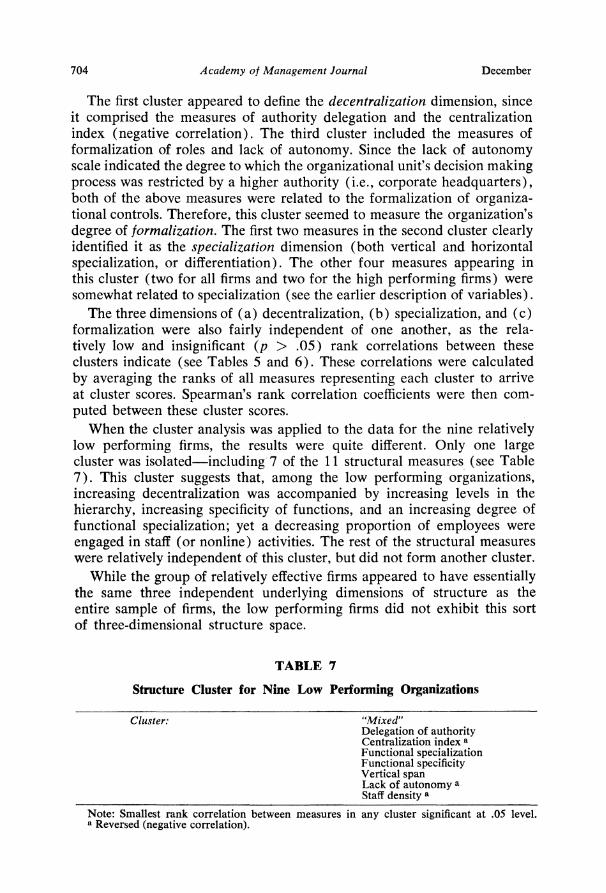
When the cluster analysis was applied to the data for the nine relatively low performing firms, the results were quite different. Only one large cluster was isolated-including 7 of the 11 structural measures (see Table 7). This cluster suggests that, among the low performing organizations, increasing decentralization was accompanied by increasing levels in the hierarchy, increasing specificity of functions, and an increasing degree of functional specialization; yet a decreasing proportion of employees were engaged in staff (or nonline) activities. The rest of the structural measures were relatively independent of this cluster, but did not form another cluster.
While the group of relatively effective firms appeared to have essentially the same three independent underlying dimensions of structure as the entire sample of firms, the low performing firms did not exhibit this sort of three-dimensional structure space.
TABLE 7
Structure Cluster for Nine Low Performing Organizations
Cluster: "Mixed" Delegation of authority Centralization index a Functional specialization Functional specificity Vertical span Lack of autonomy a Staff density a
Note: Smallest rank correlation between measures in any cluster significant at .05 level. a Reversed (negative correlation).
704 December
Volume 17, Number 4
The sample of nineteen firms was also split in half purely at random, by assigning the first ten randomly selected firms to one group and the rest to another. This was done twice (using different random numbers), and in neither case was there much difference in the clusters of structural measures between groups.
Actually all of the firms in this study were at least moderately successful. A few of the low performing firms reported slight declines in profits or sales over the past few years, but even these firms were still basically profitable.
Unfortunately the sample of firms in this study was biased in favor of good performance-possibly in both financial and "social" terms. Only about 20 percent of the firms initially contacted consented to the study. Reasons for not taking part typically involved financial difficulties or labor problems. Other firms simply refused to take part in any study which involved questionnaires or interviews with their executives. This may have reflected some defensiveness on the part of management about its operations, or perhaps simply a negative attitude toward this type of university- sponsored research.
The fact that all firms in this study tended to be fairly effective may account for the close correspondence between the structure clusters for the whole sample and for the ten most effective firms. It also seems quite possible that, had the sample included some truly ineffective firms, i.e., incurring losses and/or declining sales, the differences in structural di- mensions between effective and ineffective firms might have been even more pronounced. Unfortunately, this is pure speculation, and further research is needed to test this hypothesis.
At this point all that can be said is that the structural arrangements among all the firms in this study, and particularly the relatively effective ones, can be described by a multidimensional framework along the lines proposed by the Aston group (10). In contrast, the relatively low perform- ing organizations in this study tend to conform more closely to the Weber- ian, unidimensional conception of degree of bureaucratization. However, since increasing specialization and decentralization were not accompanied by increasing formalization, the structures of these low performing organi- zations did not entirely fit Child's model of a unidimensional administrative control strategy (2).
This finding suggests that one of the reasons for the differences in conclusions drawn by various researchers regarding the dimensionality of the organizational structure space may be their failure to analyze the relationship between an organization's structural arrangements and its performance (2, 3, 10, 11). These researchers might well have found that the relatively high performing organizations in their samples had different structural dimensions than did their low performing counterparts.
1974 705
Academy of Management Journal
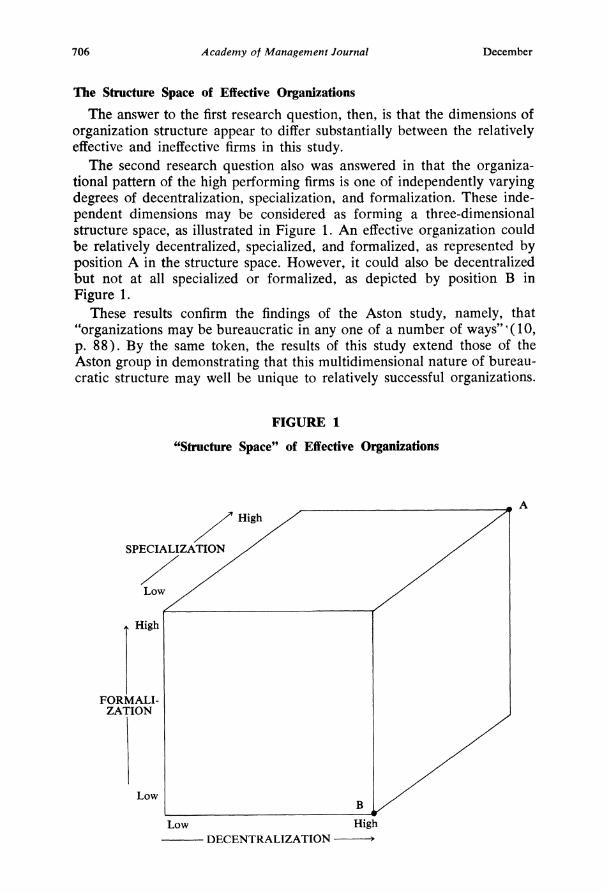
The Structure Space of Effective Organizations The answer to the first research question, then, is that the dimensions of
organization structure appear to differ substantially between the relatively effective and ineffective firms in this study.
The second research question also was answered in that the organiza- tional pattern of the high performing firms is one of independently varying degrees of decentralization, specialization, and formalization. These inde- pendent dimensions may be considered as forming a three-dimensional structure space, as illustrated in Figure 1. An effective organization could be relatively decentralized, specialized, and formalized, as represented by position A in the structure space. However, it could also be decentralized but not at all specialized or formalized, as depicted by position B in Figure 1.
These results confirm the findings of the Aston study, namely, that "organizations may be bureaucratic in any one of a number of ways" ( 10, p. 88). By the same token, the results of this study extend those of the Aston group in demonstrating that this multidimensional nature of bureau- cratic structure may well be unique to relatively successful organizations.
FIGURE 1
"Structure Space" of Effective Organizations
A High
SPECIALIZATION
Low
^ High
FORMALI- ZATION
Low
Low High DECENTRALIZATION --
706 December
Volume 17, Number 4
Moreover, the research reported in this article has suggested one way of settling the controversy over the existence of universal dimensions of structure. It has demonstrated that, even among fairly similar organizations (manufacturing firms), different dimensions of structure may be found as between high and low performing organizations; that is, when organiza- tional performance was introduced as a test variable, the kinds of under- lying dimensions of structure isolated were altered substantially.
In the present study several other test variables were introduced in a manner similar to performance. These were size-small versus large firms; process technology-Woodward's classification (13); and ownership- independent versus dependent firms. None of these test variables was found to introduce as pronounced a change in the dimensionality of the organization structure space as the performance variable.
SUGGESTIONS FOR FUTURE RESEARCH
The results of this study suggest that future research on the dimensions of organization structure can benefit from incorporating the effectiveness variable. If, for example, future studies were to demonstrate that certain independent dimensions of structure were consistently associated with relatively high performing firms, and not with relatively low performers, this would have interesting implications for a prescriptive theory of or- ganization. It might even make it possible to develop some universal principles of organization based on the underlying dimensions of structure.
Structure, of course, is far from being the only factor likely to influence organization effectiveness. For example, the popular contingency theory of organizations (8) holds that an organization must structure its activities in accordance with the demands of its environment (markets, technology, etc.). It may be, therefore, that the difference in the dimensionality of structure between high and low performing organizations observed in this study resulted from a more successful adaptation of structure to a variety of environmental demands by the former than by the latter.
On the other hand, it seems just as plausible that their greater inde- pendence of structural dimensions merely reflected the greater freedom enjoyed by the high performing firms (relative to their low performing counterparts) when it came to choosing their internal structures. That is, the relatively high performing firms may have had relatively few constraints on their structural devices and may, therefore, have opted for a wide variation in degrees of centralization, specialization, and formalization. Or the low performing firms may have been more inhibited and therefore tended to stick more closely to the Weberian model of bureaucracy.
In conclusion, the research reported in this article has provided few answers, but has generated some new research questions which seem to warrant further study. It has shed very little light on the controversy over the existence of universal underlying dimensions of organization structure, but it has suggested one approach which may be helpful in establishing
1974 707
Academy of Management Journal
the existence or nonexistence of such dimensions. Moreover, it has raised the possibility that the structures of relatively successful organizations may be described by several independently varying dimensions.
REFERENCES
1. Burns, T., and G. M. Stalker. The Management of Innovation (London: Tavistock, 1961).
2. Child, John. "Organization Structure and Strategies of Control; A Replication of the Aston Studies," Administrative Science Quarterly, Vol. 17 (1972), 163-177.
3. Gerth, H. H., and C. W. Mills (Eds.). From Max Weber: Essays in Sociology (London: Routledge, 1948).
4. Hall, Richard H. "The Concept of Bureaucracy: An Empirical Assessment," American Journal of Sociology, Vol. 69 (1963), 32-40.
5. Inkson, J. H. K., D. S. Pugh, and D. J. Hickson. "Organization Context and Structure: An Abbreviated Replication," Administrative Science Quarterly, Vol. 15 (1970), 318- 329.
6. Johnson, S. C. "Hierarchical Clustering Schemes," Psychometrika, Vol. 32 (1967), 241-254.
7. Katz, Daniel, and Robert L. Kahn. The Social Psychology of Organizations (New York: Wiley, 1966).
8. Lawrence, P. R., and J. W. Lorsch. Organization and Environment (Homewood: Irwin, 1969).
9. Negandhi, Anant R., and S. Benjamin Prasad. Comparative Management (New York: Appleton-Century-Crofts, 1971).
10. Pugh, D. S., D. J. Hickson, C. R. Hinings, and C. Turner. "Dimensions of Organiza- tion Structure," Administrative Science Quarterly, Vol. 13 (1968), 65-105.
11. Reimann, Bernard C. "On the Dimensions of Bureaucratic Structure: An Empirical Reappraisal," Administrative Science Quarterly, Vol. 18 (1973), 464-476.
12. Samuel, Yitzhak, and Bilha F. Mannheim. "A Multidimensional Approach Toward a Typology of Bureaucracy," Administrative Science Quarterly, Vol. 15 (1970), 216-228.
13. Woodward, Joan. Industrial Organization: Theory and Practice (London: Oxford Uni- versity Press, 1965).
708 December