Embed Size (px)
Citation preview

Digitally Tuned
Low Power Gyroscope
Bernhard E. Boser & Chinwuba Ezekwe
Berkeley Sensor & Actuator Center
Dept. of Electrical Engineering and Computer Sciences
University of California, Berkeley
B. Boser 1

Outline
• Objective:
– 100x power reduction in MEMS gyroscope
• What are gyroscopes?
• Power reduction techniques
– Mechanical gain
– Low power, low noise amplification
• Results
B. Boser 2

Accelerometer flexture
anchor
N Unit Cells
Fixed Plates
Angstrom40
1
pm5.2
10kHz2
mG12
2
π
ax
B. Boser 3
xcell

Vibratory Gyroscope
B. Boser 4
• Vibrate along drive axis with
oscillator @ fdrive
• Detect vibration @ fdrive
about sense axis with
accelerometer
Angstrom
4000
1x
Gyroscope Design
B. Boser 5
Electrostatic
Drive
Electrostatic
Sense Pickup
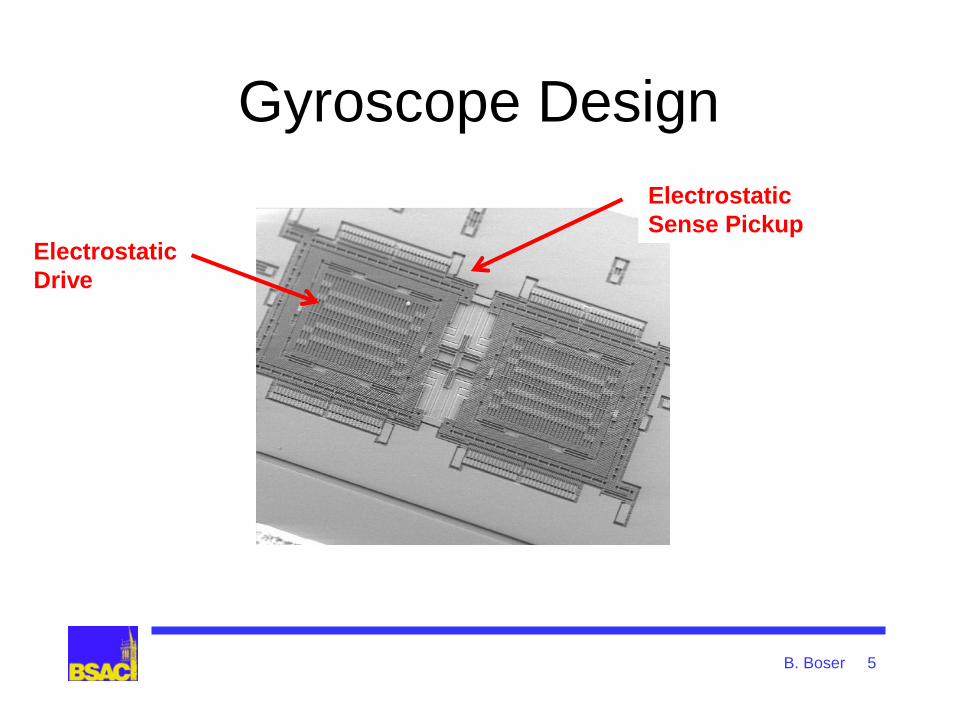
Power / Accuracy Tradeoff
Dm
nIg
v112 const
noise
signalSNR
Design options:
1) Lower amplifier noise
2) Increase signal Dv
without power penalty
B. Boser 6
gyro

Outline
• Objective:
– 100x power reduction in MEMS gyroscope
• What are gyroscopes?
• Power reduction techniques
Mechanical gain
– Low power, low noise amplification
• Results
B. Boser 7

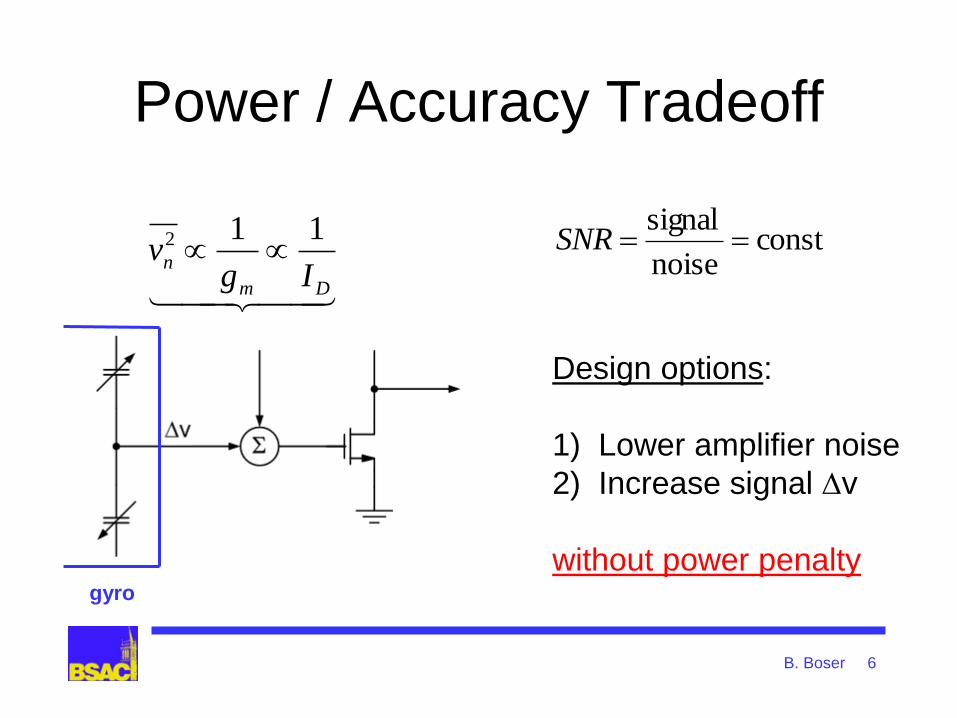
Mode-Matching
Drive Axis Response
fdrive Frequency
Drive
Amplitude
B. Boser 8
Mode-Matching
Fabrication tolerance ~ 2%
Match by active tuning get Q times the deflection
Drive Axis Response Sense Axis Response
Amplitude
B. Boser 9
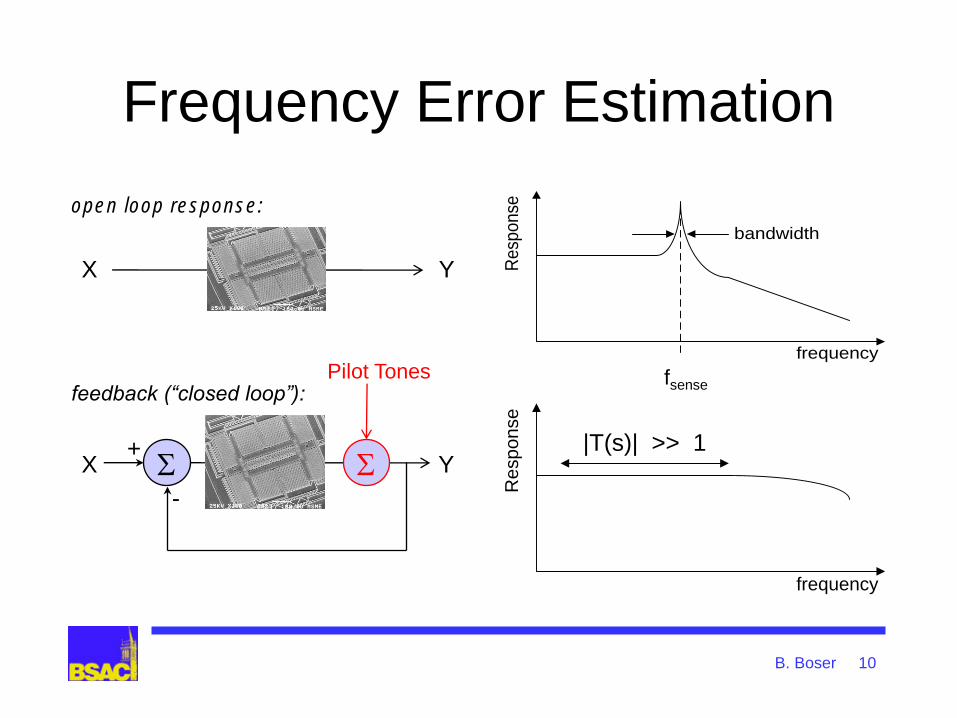
Frequency Error Estimation
B. Boser 10
frequency
Re
spo
nse
r/2
bandwidth
open loop response:
X Y
frequency
Re
sp
on
se
|T(s)| >> 1
feedback (“closed loop”):
X Y S +
-
S
Pilot Tones fsense

Sense Resonance Estimation
sH
1
m
Frequency fsense
B. Boser 11
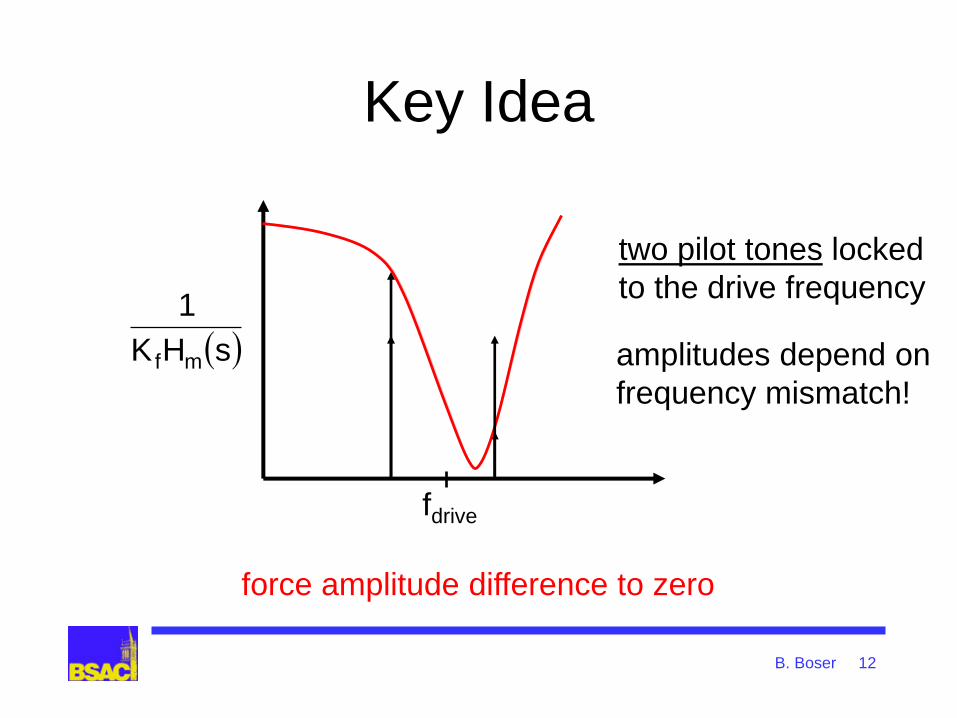
Key Idea
sHK
1
mf
two pilot tones locked
to the drive frequency
fdrive
amplitudes depend on
frequency mismatch!
force amplitude difference to zero
B. Boser 12
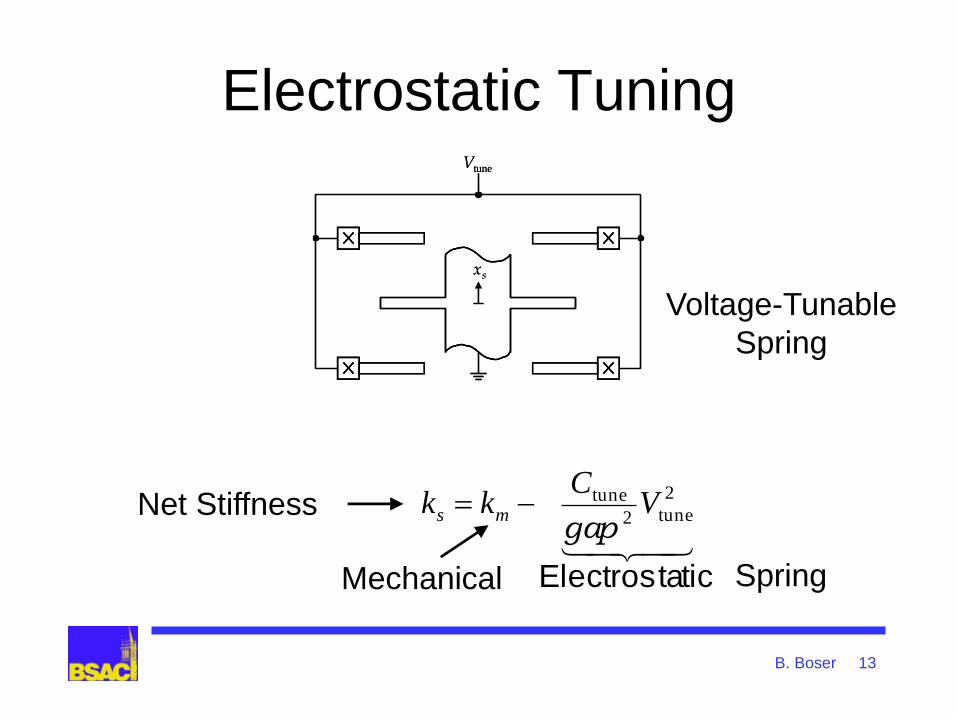
Electrostatic Tuning tuneV
sx
tuneV
sx
ticElectrosta
2
tune2
tune VC
kk msgap
Mechanical
Net Stiffness
Voltage-Tunable
Spring
Spring
B. Boser 13

Electrostatic Force Feedback
sx
biasV
fbv
fbv
sx
biasV
fbv
fbv
sfbbiass
fbbiass
e xvVC
vVC
F
StiffnessDependent Signal
Gain Force--ToVoltage
2200 22 2gapgap
B. Boser 14
2-level feedback (Sampled Data “SD”) feedback
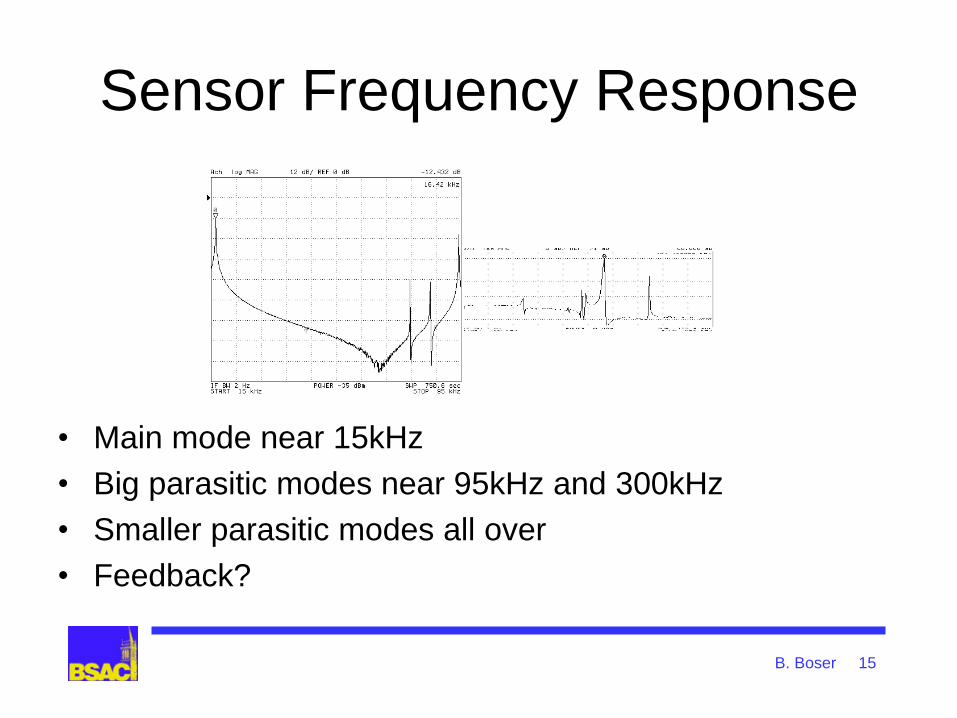
Sensor Frequency Response
• Main mode near 15kHz
• Big parasitic modes near 95kHz and 300kHz
• Smaller parasitic modes all over
• Feedback?
B. Boser 15
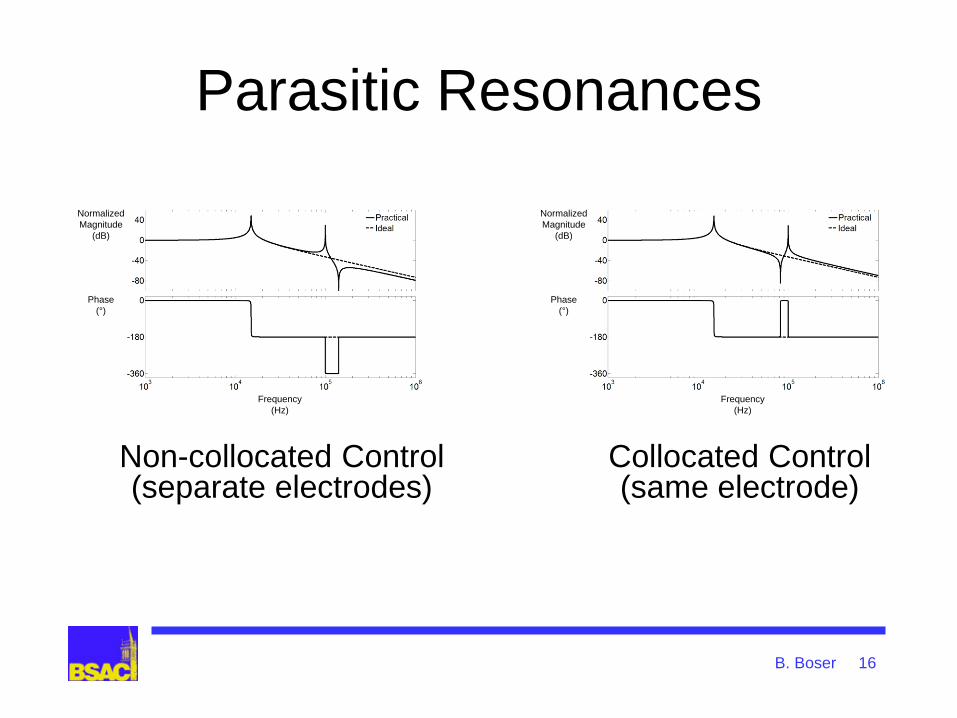
Parasitic Resonances
Frequency
(Hz)
Normalized
Magnitude
(dB)
Phase
(°)
Frequency
(Hz)
Normalized
Magnitude
(dB)
Phase
(°)
Collocated Control (same electrode)
Frequency
(Hz)
Normalized
Magnitude
(dB)
Phase
(°)
Frequency
(Hz)
Normalized
Magnitude
(dB)
Phase
(°)
Non-collocated Control (separate electrodes)
B. Boser 16
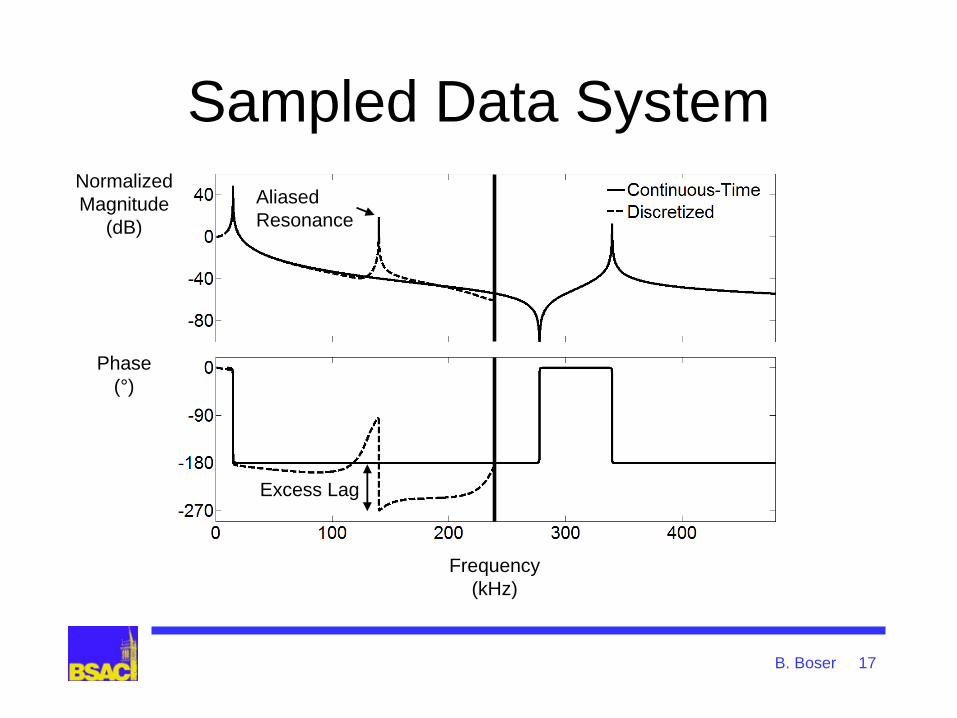
Sampled Data System
Excess Lag
Aliased
Resonance
Frequency
(kHz)
Normalized
Magnitude
(dB)
Phase
(°)
Excess Lag
Aliased
Resonance
Frequency
(kHz)
Normalized
Magnitude
(dB)
Phase
(°)
B. Boser 17

Negative Feedback
Frequency
(kHz)
Magnitude
(dB)
Phase
(°)
Large Negative Margin
Frequency
(kHz)
Magnitude
(dB)
Phase
(°)
Large Negative Margin
Unstable
B. Boser 18

Positive Feedback
Frequency
(kHz)
Magnitude
(dB)
Phase
(°) Small But
Enough
Margin Huge Positive
Margins
Frequency
(kHz)
Magnitude
(dB)
Phase
(°) Small But
Enough
Margin Huge Positive
Margins
B. Boser 19
stable
DC gain < 0

Mode-Matching Summary
>100x increased signal
100x power savings
Fabrication tolerances, drift mismatch
Background calibration
Electrostatic tuning
Sensitivity = f(Q, environment)
Force feedback
Stability positive feedback
B. Boser 20

Sampling Noise
Closed Loop Open Loop
Δf
v2n
Ci
IdealSampler
CS-
CS+
CP
CPCi CL
VoVm Vx
Vx
Ts
Vm
sample
CL
Signal
Δf
v2n
CS-
CS+
CP
CP
CL
CL
Vm VxGmIdeal
SamplerVo
Vx
Ts
Vm
Signal
sample
B. Boser 21
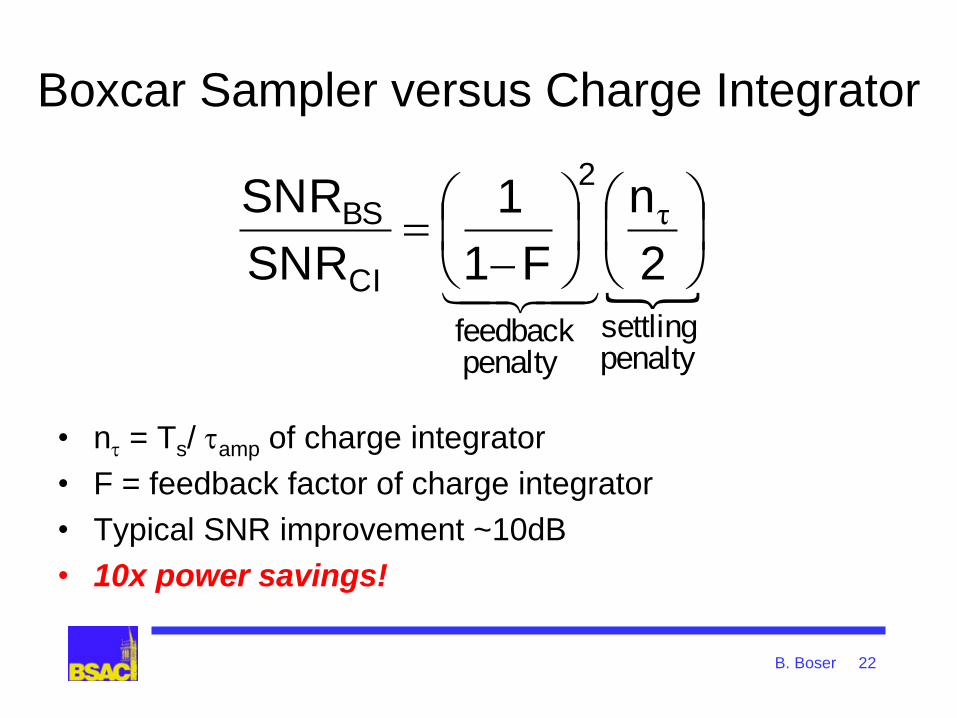
Boxcar Sampler versus Charge Integrator
• n = Ts/ amp of charge integrator
• F = feedback factor of charge integrator
• Typical SNR improvement ~10dB
• 10x power savings!
penaltysettling
penalty feedback
2
CI
BS
2
n
F1
1
SNR
SNR
τ
B. Boser 22
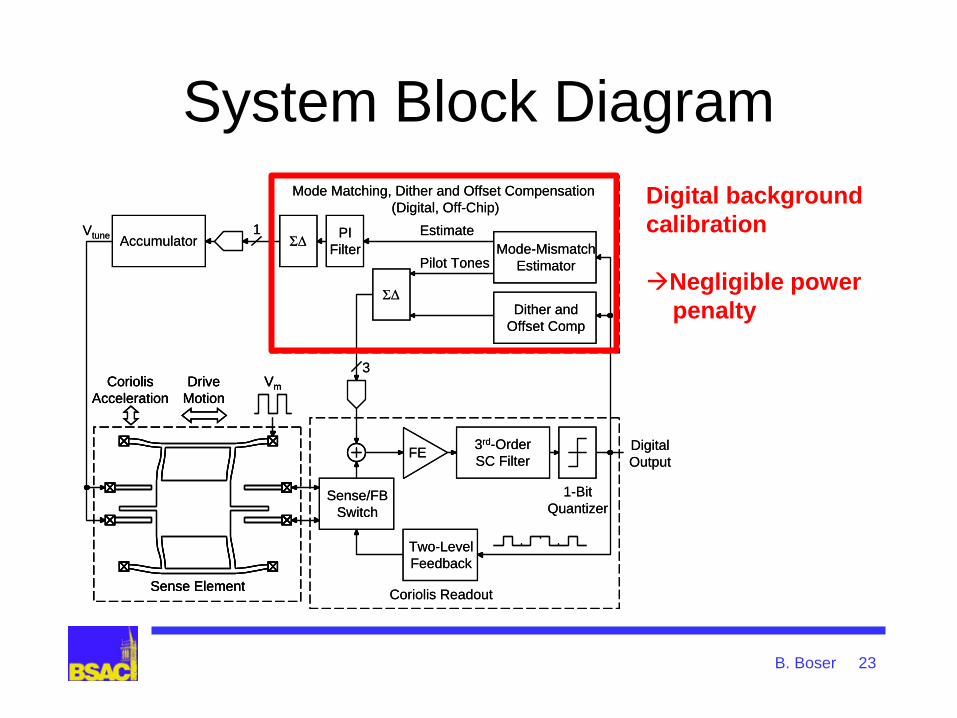
System Block Diagram
Sense/FB
Switch
FE
Two-Level
Feedback
3rd-Order
SC Filter
1-Bit
Quantizer
3
Accumulator
ΣΔDither and
Offset Comp
Mode-Mismatch
EstimatorPilot Tones
EstimateΣΔ
Vtune1
Digital
Output
Mode Matching, Dither and Offset Compensation
(Digital, Off-Chip)
Sense Element
Coriolis
Acceleration
VmDrive
Motion
PI
Filter
Coriolis Readout
Sense/FB
Switch
FE
Two-Level
Feedback
3rd-Order
SC Filter
1-Bit
Quantizer
3
Accumulator
ΣΔDither and
Offset Comp
Mode-Mismatch
EstimatorPilot Tones
EstimateΣΔ
Vtune1
Digital
Output
Mode Matching, Dither and Offset Compensation
(Digital, Off-Chip)
Sense Element
Coriolis
Acceleration
VmDrive
Motion
Sense Element
Coriolis
Acceleration
VmDrive
Motion
PI
Filter
Coriolis Readout
B. Boser 23
Digital background
calibration
Negligible power
penalty
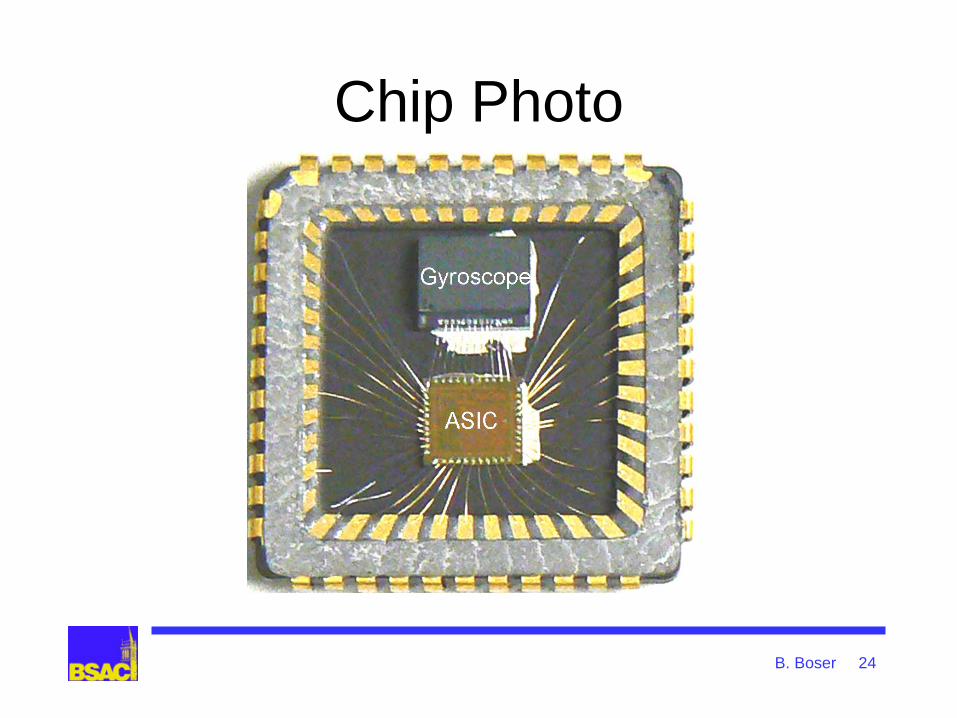
Chip Photo
B. Boser 24
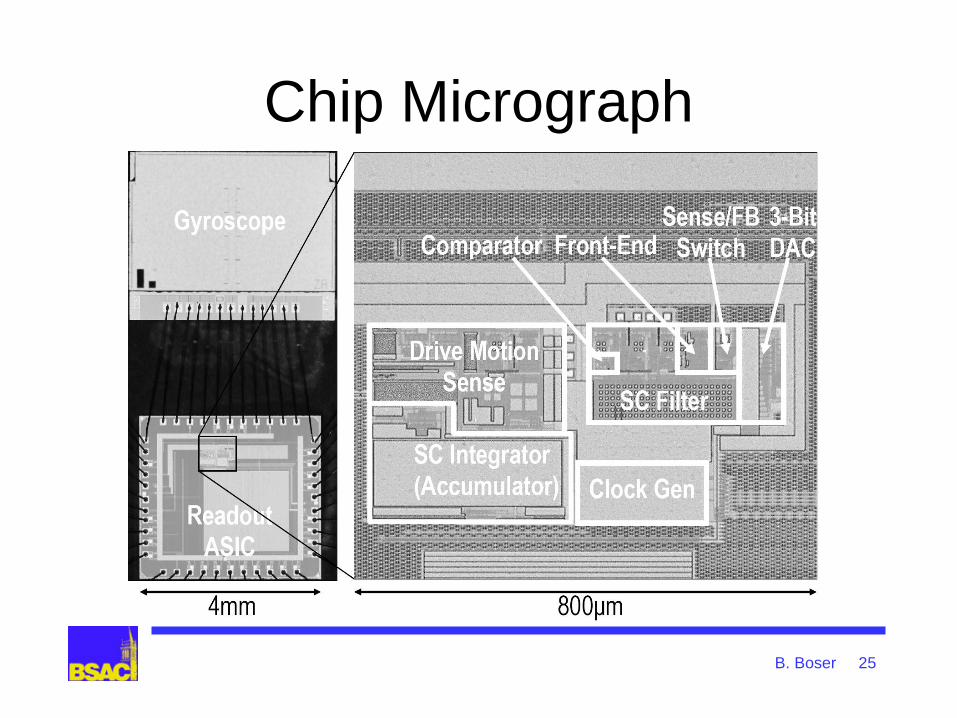
Chip Micrograph
B. Boser 25
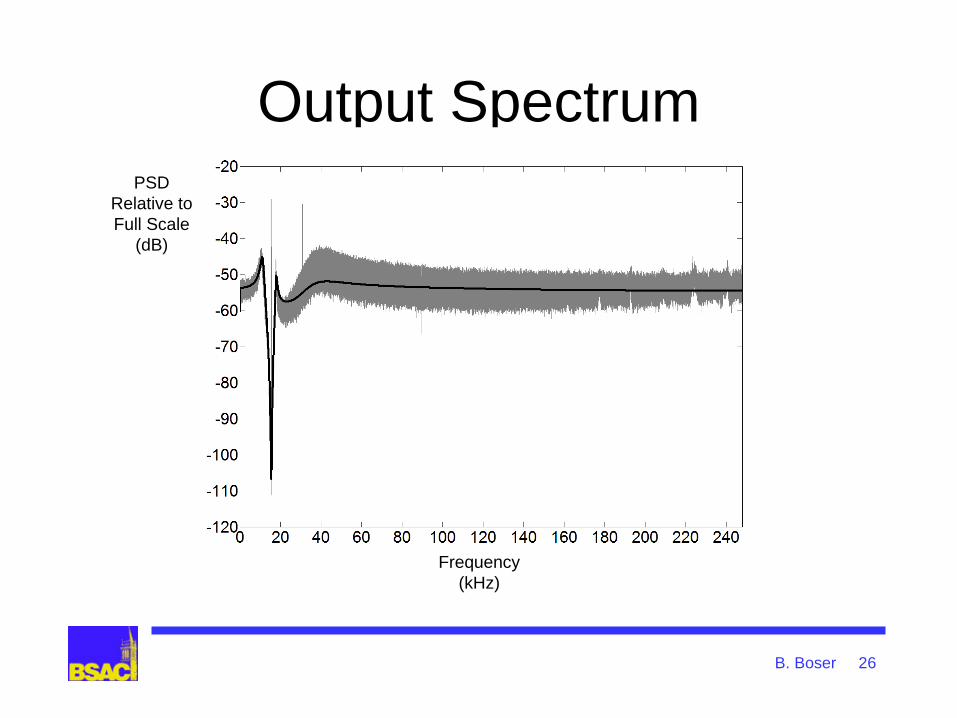
Output Spectrum
Frequency
(kHz)
PSD
Relative to
Full Scale
(dB)
Frequency
(kHz)
PSD
Relative to
Full Scale
(dB)
B. Boser 26

Output Spectrum
Without calibration
• Noise Floor:
0.03°/s/Hz
• Mismatch:
~400Hz (2.6%)
14800 15000 15200 15400 15600 15800 16000 1620010
-3
10-2
10-1
100
101
102
103
Pilot
Tones
~400Hz
An
gu
lar
Ra
te (°/
se
c)
Frequency (Hz)
B. Boser 27
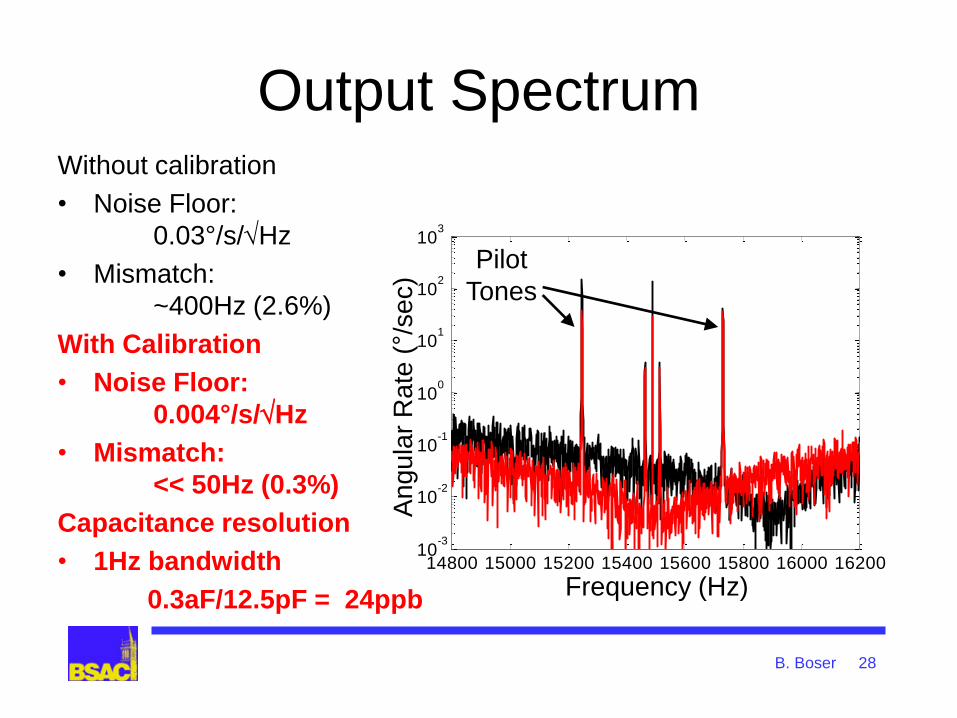
Output Spectrum
14800 15000 15200 15400 15600 15800 16000 1620010
-3
10-2
10-1
100
101
102
103
Pilot
Tones
An
gu
lar
Ra
te (°/
se
c)
Frequency (Hz)
B. Boser 28
Without calibration
• Noise Floor:
0.03°/s/Hz
• Mismatch:
~400Hz (2.6%)
With Calibration
• Noise Floor:
0.004°/s/Hz
• Mismatch:
<< 50Hz (0.3%)
Capacitance resolution
• 1Hz bandwidth
0.3aF/12.5pF = 24ppb
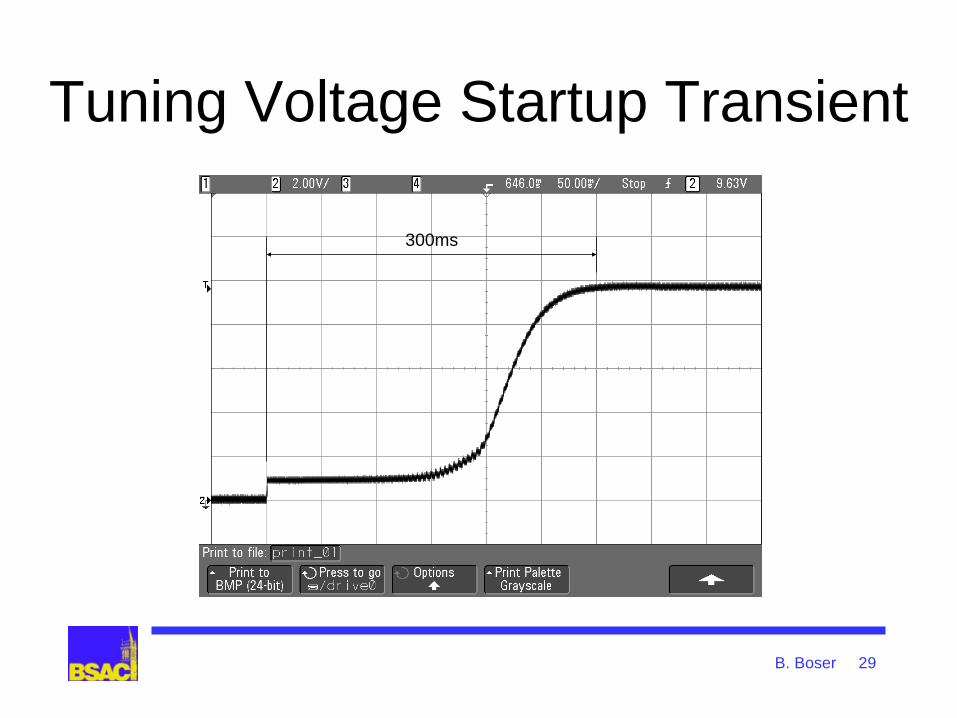
Tuning Voltage Startup Transient
300ms300ms
B. Boser 29
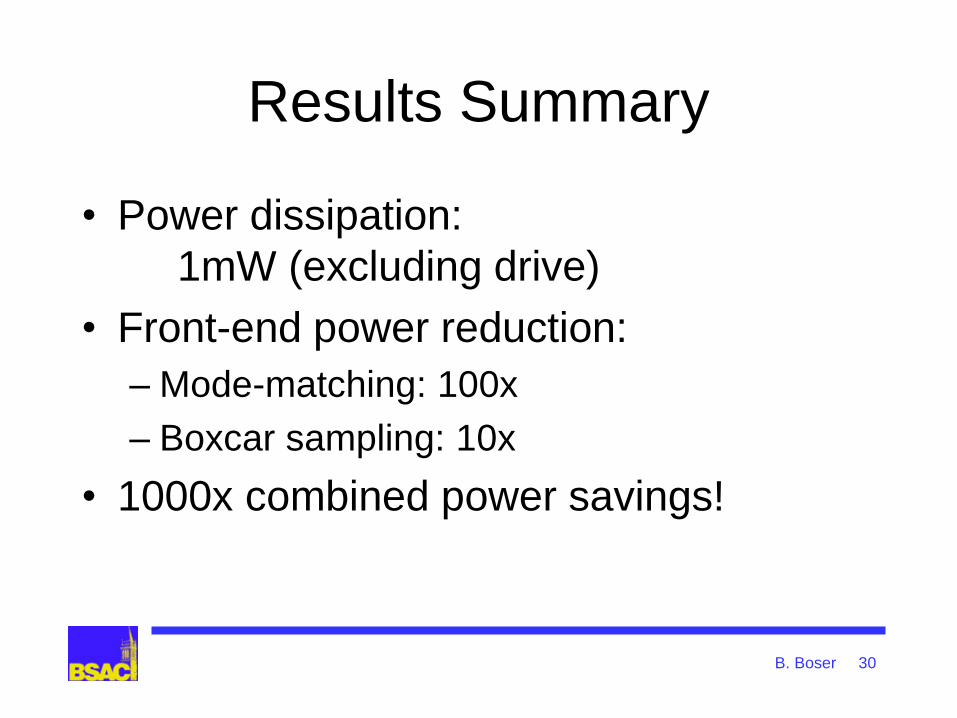
Results Summary
• Power dissipation:
1mW (excluding drive)
• Front-end power reduction:
– Mode-matching: 100x
– Boxcar sampling: 10x
• 1000x combined power savings!
B. Boser 30
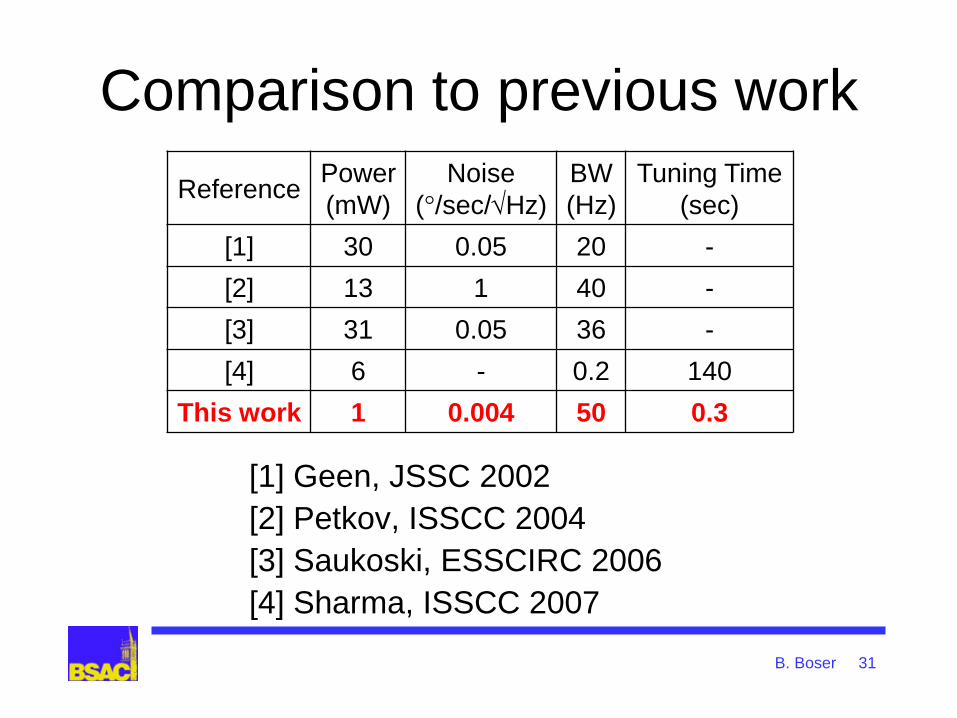
Comparison to previous work
Reference Power
(mW)
Noise
(°/sec/Hz)
BW
(Hz)
Tuning Time
(sec)
[1] 30 0.05 20 -
[2] 13 1 40 -
[3] 31 0.05 36 -
[4] 6 - 0.2 140
This work 1 0.004 50 0.3
[1] Geen, JSSC 2002
[2] Petkov, ISSCC 2004
[3] Saukoski, ESSCIRC 2006
[4] Sharma, ISSCC 2007
B. Boser 31
Conclusions
• Power savings
– Mechanical gain 100x reduction
– Open-loop charge amplifier 10x reduction
– Digital processing occurs minimum power overhead
• Techniques
– Background calibrated mode matching
insensitive to process variations
– Positive feedback
insensitive to parasitic modes
B. Boser 32
Acknowledgements
• Christoph Lang & Vladimir Petkov
• Robert Bosch Corporation
Gyroscope and financial support
B. Boser 33