Embed Size (px)
Citation preview

Digital Theremin Synthesizer and Visualizer
6.111 Final Project Lab Report
Jeffrey Chang, Daniel Rodgers, and Alexander Spicer
December 15, 2007
Abstract
The digital theremin and synthesizer simultaneously plays external music and generates tones while display-ing a visualization of the sound being produced. The tones generated depend on the positions of the usershand in front of a camera, with one hand controlling pitch and the other adjusting the volume. The systemtakes an external analog audio input, overlays an audio stream generated by the user and applies filteringeffects as selected by the user via keyboard. The theremin features a variety of filters and effects alongwith multiple tones that the user can select from. The visualization features three distinct modes for bothinternal and external audio and depends on the pitch and rhythm of the outputted audio stream. The finalproduct is a user-friendly and fun musical instrument which allows people with limited musical knowledgeto “play along” with or improvise on top of musical tracks of their choice, while enjoying an entertainingvisual display.

Contents
1 Overview 3
2 Description 62.1 Video Processing (Alexander Spicer) . . . . . . . . . . . . . . . . . . . . . . . . . . . . . . . . 6
2.1.1 Video Input . . . . . . . . . . . . . . . . . . . . . . . . . . . . . . . . . . . . . . . . . . 62.1.2 Frequency Conversion . . . . . . . . . . . . . . . . . . . . . . . . . . . . . . . . . . . . 72.1.3 Building and Debugging . . . . . . . . . . . . . . . . . . . . . . . . . . . . . . . . . . . 8
2.2 Audio Synthesis and Processing (Daniel Rodgers) . . . . . . . . . . . . . . . . . . . . . . . . . 92.2.1 lab4audio . . . . . . . . . . . . . . . . . . . . . . . . . . . . . . . . . . . . . . . . . . . 92.2.2 Tone Generator . . . . . . . . . . . . . . . . . . . . . . . . . . . . . . . . . . . . . . . . 92.2.3 Chorus . . . . . . . . . . . . . . . . . . . . . . . . . . . . . . . . . . . . . . . . . . . . 112.2.4 Flanging . . . . . . . . . . . . . . . . . . . . . . . . . . . . . . . . . . . . . . . . . . . . 122.2.5 Reverb . . . . . . . . . . . . . . . . . . . . . . . . . . . . . . . . . . . . . . . . . . . . . 122.2.6 Delay . . . . . . . . . . . . . . . . . . . . . . . . . . . . . . . . . . . . . . . . . . . . . 132.2.7 Audio Combiner . . . . . . . . . . . . . . . . . . . . . . . . . . . . . . . . . . . . . . . 132.2.8 Fast Fourier Transform . . . . . . . . . . . . . . . . . . . . . . . . . . . . . . . . . . . 132.2.9 Testing/Debugging . . . . . . . . . . . . . . . . . . . . . . . . . . . . . . . . . . . . . . 14
2.3 Visualizer (Jeffrey Chang) . . . . . . . . . . . . . . . . . . . . . . . . . . . . . . . . . . . . . . 152.3.1 Design . . . . . . . . . . . . . . . . . . . . . . . . . . . . . . . . . . . . . . . . . . . . . 172.3.2 Implementation . . . . . . . . . . . . . . . . . . . . . . . . . . . . . . . . . . . . . . . . 192.3.3 Testing and Debugging . . . . . . . . . . . . . . . . . . . . . . . . . . . . . . . . . . . 21
3 Conclusion 23
4 References 24
5 Appendix 25
1

List of Figures
1.1 Top Level Block Diagram . . . . . . . . . . . . . . . . . . . . . . . . . . . . . . . . . . . . . . 5
2.1 This block diagram shows the basic flow of information through the video processing logic . . 72.2 Audio Processing Block Diagram . . . . . . . . . . . . . . . . . . . . . . . . . . . . . . . . . . 102.3 Different Audio Effects Displayed on the Visualizer . . . . . . . . . . . . . . . . . . . . . . . . 112.4 Block diagram of visualizer module. Various sub-modules were used for the internal and
external visualizations, as well as to display sprites on the screen (hand position bars, circles,and lines . . . . . . . . . . . . . . . . . . . . . . . . . . . . . . . . . . . . . . . . . . . . . . . . 16
2.5 Fire Mode . . . . . . . . . . . . . . . . . . . . . . . . . . . . . . . . . . . . . . . . . . . . . . . 172.6 A horizontal line, orange in color, is displayed near the bottom of the screen in response to a
low frequency with sufficient magnitude. . . . . . . . . . . . . . . . . . . . . . . . . . . . . . . 182.7 Circle Mode . . . . . . . . . . . . . . . . . . . . . . . . . . . . . . . . . . . . . . . . . . . . . . 19
2

Chapter 1
Overview
The goal of the Digital Theremin Synthesizer and Visualizer is to mimic the feel of a real analog theremin,while allowing integrated features to a degree which wouldn’t be possible in an analog system. The DigitalTheremin is supposed to be a multipurpose instrument, which allows a player to perform over a backingtrack of his choice, while providing entertaining visualizations which correspond to the music. In designingthe instrument, we wanted seamless and lagless interaction between the video input and the audio output.And we wanted a real time visualizer which would respond fluidly to the background music. The design islaid out as shown in Figure 1.1.
The video input system is designed to replicate the experience of playing the Theremin. Neither handhas to physically touch anything to make music. The user wears a red glove on his right hand and a blueglove on his left hand. The right hand, which is detected in the Cr color space, is used to determine thepitch of the note being played, on a programmable scale between 90 and 1023 Hertz. This module includesa linear to exponential conversion lookup table, which takes linear increases in the x-coordinate of the handand converts it to exponential increases in frequency. The left hand is detected in the Cb color space and isused to control the mixing volume of the theremin.
The video module outputs a frequency and a volume, which are fed into the audio module. The audiomodule uses a lookup table to generate a tone at that frequency. The system features the ability to producemultiple tones for different audio effects. The user can enable and disable higher frequency harmonics of theroot tone, as well as produce either a major or minor chord based around the selected frequency. The systemcan generate both a sine tone and a violin tone, which was sampled from a live recording. The system alsoincludes a variety of time-domain effects: chorus, flanging, reverb and delay.
The audio stream is fed into a 1024 bucket streaming FFT, which constantly fills a ram with the outputfrequency information. This data is the basis for the visualization module, which features three main ‘modes’of visualization. It features a ‘fire’ mode, which is represented by bars corresponding to frequencies, a ‘circle’mode, which is a circle which responds to beats, and ‘line’ mode, which draws lines corresponding to noteswhich are held for a while in a piece of music.
A user interfaces the Digital Theremin through a computer keyboard. The number keys correspond tothe video effects, while the letters shown in Table 1 correspond to audio effects. The audio effect buttonsfunction as toggles while the video effect buttons change the display based on the button pressed. After theuser provides the system with keyboard input, the LED display flashes the current mode before sliding thetext off screen.
Throughout development, our team worked together on code, logic and ideas in each of the sections of
3

the project. Although we collaborated on each part, we divided up the work to complete the project in areasonable manner with the least amount of overlap possible. The person in charge of each section of theproject wrote the description of it.
Audio Effects Video EffectsC Chorus 1 Internal OffD Delay 2 Internal FireF Flanging 3 Internal CirclesR Reverb 4 Internal LinesN Chords 5 External OffM Major/Minor Toggle 6 External FireT Second Harmonic 7 External CirclesY Third Harmonic 8 External LinesU Fourth Harmonic 9 CameraI Fifth Harmonic 0 Camera Toggle (Y/Cr/Cb)V Violin
Table 1.1: Keyboard Control Guide
4
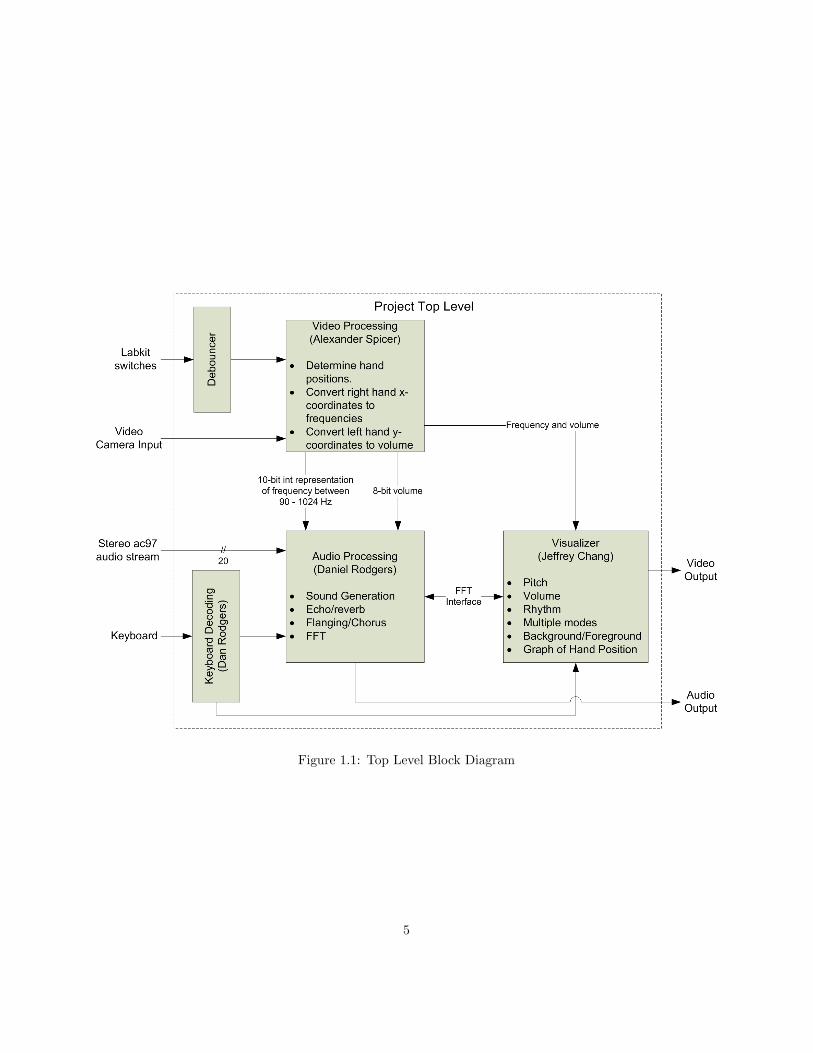
Figure 1.1: Top Level Block Diagram
5

Chapter 2
Description
2.1 Video Processing (Alexander Spicer)
The video input serves as the primary interface to our theremin system. Our goal was to create a streamlinedinterface which resembles an analog theremin, but returns quantized digital values for the right and left handposition. We decided on using a simple camera system to detect the horizontal (x) and vertical (y) coordinatesof two independent blue and red objects in the camera’s field of view. The red input is a weighted average ofthe x-positions of the pixels on the screen over a certain chrominance and luminance threshold. This valueis passed into a frequency calculation module, which allows the frequency to be centered around any valuein the range of 10 bits (0-1024) and for any range constraints to be set on the frequency output. The blueinput is calculated the same was as the red one, and is scaled in the range of 0-400. It is used to control thevolume of the theremin relative to the background music.
The data flow through the system is as shown in Figure 2.1.
2.1.1 Video Input
Our video input system is based on the ZBT ram display module provided by the 2005 6.111 lab staff.The camera stream is received through the labkit’s composite in port and processed through a number ofstaff provided modules which decode the signal into a YCrCb video stream. The Luminance information isthen stored in a frame buffer in ZBT ram, which is read back and output to the screen. The Cr and Cbinformation are processed in a similar way, but are never stored to memory.
Two modules, weighted avg and weighted avg red, take the incoming Cb and Cr data streams respectively.The weighted avg reg module scans through the data stream, looking at the values of field, vsync, and hsync,and only allow valid data pixels to be included in the calculations. As the screen refreshes, every pixel thathas a Chroma Red above 164 and a Luminance below 128 (basically a dark red color) is declared as red.Its x value is added to a running total and a counter increases by one for every pixel found. At the end ofthe screen refresh, these two values clocked into registers while the process starts again. The output of theweighted avg red module is a 10-bit value, which, on each screen refresh, corresponds to sum of x coordinates
number of red pixels .The blue module works in exactly the same fashion, using y coordinates and only selecting pixels with a
Chroma Blue greater than 140.Because the screen’s coordinate system is in the fourth quadrant, the blue coordinate is subtracted from
544, which is the effective maximum blue value due to random noise as the hand moves towards the bottom
6

Figure 2.1: This block diagram shows the basic flow of information through the video processing logic
of the screen. This volume is passed to the audio and visualizer module.
2.1.2 Frequency Conversion
In order to give the user more control over the range and precision with which they can play notes, we passthese raw pixel values through a frequency conversion module. This lets the user set the center and rangeof frequencies they can play on the theremin screen through a slightly convoluted procedure. When switch7 is on, the user can use switches 6 down to 0 to select the top 7 bits of a 10 bit frequency range. Whenthey press the third button, the device synchronously programs this value. If switch 7 is off, the switchesallow the user to select the top 7 bits of the frequency range and program it in the same way. After thisprocedure, the screen is programmed to play any note between center − range and center + range.
The conversion system is equipped with a ‘lowpass’ filter, which will not move the output frequency unlessthere has been a more than 3 pixel jump in the hand’s x coordinate. Due to random noise associated withthe camera input, this was a decent tradeoff between stability and a continuous spectrum of notes. After anupdate is triggered by the movement of a hand, a new frequency output is calculated. This is calculated as
7

(center− range) + (x∗range)512 , where x is the current x coordinate of the pitch hand. The volume is assigned
with less calculations, and is provided by 544− y.This output is fed through a lookup table, which effectively scaled the output to achieve the goal of
linearity - every octave is equally spaced.
2.1.3 Building and Debugging
I used the template for displaying video provided by the staff as the template for my design. The systemuses a ZBT-ram frame buffer for storing and displaying luminance data. The display mechanism remainsuntouched, and the screen outputs a grayscale picture to a subsection of the screen when camera mode isselected. As a debugging tool and as a visual aid, we overlay a vertical red line and a horizontal blue lineon the screen to show where the center of mass of the red and blue pixels currently lie. Also included in thefinal system is a Chroma Red and a Chroma Blue display mode, where all pixels above the thresholds areshown and all other pixels are blacked out.
This part of the project was easy to debug, since we could visually and numerically view the outputs ofthe system and monitor if they are giving the expected behavior.
While constructing the system, the first serious design choice was simply deciding what color thresholdwe should use for the pixels. While the system was still being designed, the cutoffs were programmablequantities, so we could experiment with different thresholds. The final choice for cutoff is a compromisebetween getting rid of random noise and picking up enough pixels of the glove to get a good quality average.
The first build of the video system had a nasty lag in tracking. It took about a second for the screen tofollow your hand, and when it did, it was very jerky. To solve this, we regenerated the Coregen dividerswith a 1 clock latency instead of an 8 clock latency. These dividers were massive resource hogs and perfectlysmoothed out the hand movements, but still had a 1 second delay. The red line would perfectly track theglove exactly one second after the hand moved. It took a while to sort out this bug, but we solved it byremoving the divider’s clock enable, which was essentially causing the divider to run off of a 48 KHz samplerate.
During the construction of the project, the x position of the red hand was linearly correlated to the pitchof the note. Due to the log2 scale of frequency to pitch, this means the user has to move their hand further totransition between notes at higher frequencies. Our original plan was to include a module which ’linearized’the hand movement, but the ability of the FPGA to calculate a logarithm in that range turned out to bepretty limited. Instead, we just included a look up table, which scaled the linear pixels values (0 through1023) to a logarithmic scale between 90 and 1023, ensuring that every octave is evenly spaced. In hindsight,we should have included subpixel precision for the frequencies to allow a more continuous scale. After wehad assembled our project, we found that moving your hands one pixel at higher frequencies often movesthe sound by two or three hertz, which begins to sound choppy.
After all of these modifications, we found that the camera input tracked a user’s hand almost flawlesslyand made for a very playable system.
8

2.2 Audio Synthesis and Processing (Daniel Rodgers)
The audio subsystem is responsible for processing and creating all of the audio and effects available to theuser of the theremin. It takes in a frequency value provided by the video processing subsystem, and generatesa base tone at that frequency. The system can generate either pure sine tones or violin tones, and is ableto switch between the two on the fly. A number of other options are available as well, such as major andminor chords calculated from the base tone and the addition of harmonic tones. The volume of the tonesbeing generated is also controlled by the video processing subsystem. Once the basic sound has been chosenby the user four audio effects can be enabled, individually or all at once, to alter and enhance the soundsbeing created by the theremin. These effects are chorus, flanging, reverb, and delay. The theremin audiocan also be combined with an external audio source which has been sampled by the ac97 chip on the labkit.The audio subsystem is capable of switching between outputting the combination of the theremin audio orsimply passing the external audio directly through. Every effect and audio filter in the audio subsystemis controlled by global enables that are set by the user via keyboard input. The audio system consists ofseven modules, which will be discussed below. The modules are: a slightly modified version of lab4audio, atone generator, modules for each of the effects (chorus, flanging, reverb, delay), and a module responsiblefor combining the internal and external audio streams. A block diagram showing the connections betweenthese modules is below. Please note that enables for each module are not shown, as well as the ac97 readysignal, which each module takes as an input.
2.2.1 lab4audio
The lab4audio module used by the audio system is essentially the same as the one provided for use duringlab 4. However, it has been modified to support stereo input and output. In addition, the audio streams foreach channel have been increased to 10-bits from their original 8. This change was made to prevent clippingon the sampled external audio.
2.2.2 Tone Generator
Inputs: clock 27mhz, ac97 ready, frequency[9:0], chords enable, chords enable, major enable, second enable,third enable, fourth enable, fifth enable, violin enableOutputs: theremin, theta small, theta current
The tone generator module takes the current frequency from the video processing subsystem and usesthis value to create the theremin audio. The user is able to select which tone is generated by using thekeyboard to enable or disable various effects. The tone generator takes in numerous enables and uses themto determine what the theremin audio will sound like. The audio is produced by the tone generator at arate of 48,000 samples per second.
The most basic tone that can be created is a sine wave at the current frequency. In order to create thissine wave, the module uses a look-up table which takes an 8-bit theta value and outputs the appropriatesine value. The value of theta is increased every sample (indicated by the ready signal going high) by anamount determined by the current frequency. The increase in theta is calculated by shifting the frequencyvalue left by 16 (to increase the precision), then dividing by 48,000. This increase is calculated constantly,so any change in the frequency is heard almost immediately. This results in a very pure single note, and canbe seen by Figure 2.3(a), the FFT analysis of a sine wave generated by the audio subsystem.
The tone generator is also capable of producing violin tones, using essentially the same method that isdescribed above. The single exception is that rather than using a look-up table containing sine values, one
9

Figure 2.2: Audio Processing Block Diagram
with the appropriate values for a violin waveform was created by sampling a violin recording using Matlab.The same theta is used as the input to this lookup table, and the user is able to switch between the violintone and the sine tone. The violin tone is richer than the pure sine wave, and this can be seen visually beobserving the FFT analysis of the violin tone provided in Figure 2.3(b).
In addition to creating the basic tones at the given frequency, the tone generator can add harmonics at 2,3, 4, and 5 times the frequency of the base note. These are created with more lookup tables, only their thetavalues increase at a more rapid rate. These can be added to the output sound at any time with a simplekeystroke on the keyboard. The effect of adding these harmonics can be seen in Figure 2.3(c), a photographof the FFT analysis of the theremin audio with harmonics enabled.
The last thing the tone generator is capable of doing is generating chords based off of the base frequency.Again, these are created by adding extra tones at different frequencies, but here the tones are at differentmultiples of the base frequency depending on whether major chords or minor chords have been selected.Enabling chords greatly increases the richness of the audio, as shown in Figure 2.3(d).
10

The audio stream output by the tone generator is 8 bits. The output is determined by evaluating thecurrent status of the enables. If chords are turned on, then the output audio is the current chord. Otherwisethe output is the sum of the main tone and the harmonics that are enabled. When two or more tones areadded together, they are shifted right by the appropriate number to prevent overflow in the output audiostream.
(a) Sine Input (b) Sine Input with all harmonics
(c) Violin Input (d) Violin Input with Chords Enabled
Figure 2.3: Different Audio Effects Displayed on the Visualizer
2.2.3 Chorus
Inputs: clock 27mhz, ac97 ready, frequency[9:0], theta increase[11:0], theremin in[7:0], violin enable, chorusenable, switches, reprogram
11

Outputs: theremin out [7:0]The chorus module adds a chorus effect to the input theremin audio stream and outputs the modified
audio. A chorus effect is intended to recreate the sensation of hearing similar sounds coming from multiplesources, such as in a choir or chorus. This effect is simulated in this module by adding a slightly pitch shiftedversion of the original tone and slowly changing the difference in pitch [1].
The chorus module has two lookup tables for both sine and violin waveforms, and it uses these to generatethe tones which are added to the input. The theta values for these lookup tables increase by the sameamount as the original tone since the chorus module takes in the current increase in theta as calculated bytone generator. This happens every ac97 ready signal, in the same way it does in the tone generator module.However, if an internal counter has reached its max value, then the theta value for one set of lookup tablesincreases faster by some amount and the theta value for the other increases slower by some amount. Thecounter max and the amount of increase or decrease are programmable by the user to provide the best soundpossible. This occasional increase or decrease in theta serves to modify the pitch of these tones by effectivelyincreases or decreasing their frequency. When chorus is enabled, the pitch modified versions of the sine orviolin tone are added to the original tone. Otherwise the original tone is passed through unmodified.
2.2.4 Flanging
Inputs: clock 27mhz, ac97 ready, current theta[11:0], theremin in[7:0], violin enable, flange enableOutputs: theremin out [7:0]
The flanging effect occurs when to identical signals are mixed together but with a very slight and graduallychanging time delay [2]. The flanging module accomplishes this by taking in the current value of theta asprovided by the tone generator and then modifying it slightly every ac97 ready signal by added a “theta mod”value to it. This slightly modified theta value is then sent to lookup tables for violin and sine tones andtheir tones are added to the input theremin tone. Since the signals produced by the tone generator are allperiodic, this has the same effect as adding a delayed copy. Theta mod is increased every 100 samples untilit hits a maximum value, then it is decreased every 100 samples until it hits a minimum value and the cyclerepeats. By varying the offset from the original signal, the module effectively increases and decreases theoverall delay of the two signals.
2.2.5 Reverb
Inputs: clock 27mhz, ac97 ready, theremin in[7:0], reverb enableOutputs: theremin out [7:0]
The reverb module uses a dual port ram that can store up to half a second of audio data in order to makecopies of the input delayed by a half second, a quarter of a second, an eighth of a second, and a sixteenth ofa second and add them to the original signal. This creates the effect of multiple reverberations coming atthe listener at once.
The delays are pulled from the ram by using a state machine that takes advantage of the fact that the ac97ready signals come very infrequently in comparison to the 27mhz clock. Once the ready signal is received,the state machine moves out of its waiting state and starts extracting a different delay every rising edge ofthe 27mhz clock by modifying the read address based on the current write address. Once all the delays havebeen saved to registers 8 clock cycles later, the state machine returns to waiting for the next ready signal torepeat the process again.
The delayed signals are added back into the main signal with their amplitude reduced to of its originalvalue.
12

2.2.6 Delay
Inputs: clock 27mhz, ac97 ready, theremin in[7:0], delay enableOutputs: theremin out[7:0]
The delay module is a very simple ram that saves 2 seconds of audio and constantly adds the delayedversion of the audio to the incoming version. The module consists of a dual port ram that saves the incomingaudio. The read and write addresses are increased by one every ac97 ready signal and start at values suchthat the read address is always 2 second behind the write address. The output of the ram is then added tothe input audio at a reduced amplitude.
2.2.7 Audio Combiner
Inputs: clock 27mhz, ac97 ready, from ac97 data l [9:0], from ac97 data r[9:0], theremin in [7:0], volume[9:0], theremin enableOutputs: to ac97 data l [9:0], to ac97 data r [9:0]
The audio combiner module is responsible for adding the sampled external audio to the generated internalaudio and sending the result back to the lab4audio module to be played over speakers. It does this by scalingthe external audio up by 512, and the internal audio up by a calculated volume. This calculated volumecomes from the volume generated by the video processing subsystem. Since the volume received by the videoprocessing subsystem is simply the average y position of the blue hand, we subtract this value from 544 sothat a y position closer to the top of the screen gives a higher volume.
The two scaled copies of each audio source are then added together whenever the ac97 ready signal goeshigh. The theremin is added to each channel, left and right, and the result is shifted right by 9 to preventoverflow. If the user wishes, the theremin can be disabled, and the external audio will be passed directlythrough.
2.2.8 Fast Fourier Transform
The FFT is the central to of all of the system’s visualizations. The goal was to get a frequency spacerepresentation of the waveform which updated frequently enough to accurately detect and display drumbeats and other interesting sounds. After experimenting with larger FFTs, we settled on a 1024 samplestreaming FPGA, which outputs new frequency data approximately every 21ms. Since the FFT was onlytaking in real streaming audio, we were automatically able to truncate half the output due to redundancy,and we settled on displaying the lowest 128 buckets of information, which afforded us more than enoughability to display frequencies in a normal musical spectrum.
We clocked the FFT with a clock enable from the ac97 chip, which went high whenever a new sample wasavailable. This caused the FFT to shift out data every 21ms, which allowed us more than enough time toperform any calculations on the output data we wanted before storing it into ram, sorted by bucket number.We decided to store the magnitude of the frequency information, which involves squaring the two outputs,adding them together, and then performing a square root. We used a slightly modified version of Terman’sFFT code to perform the square root, since it seemed more reliable than the Core generated IP.
This system took quite a few days to get working, due to problems with the square root module andarithmetic logic. There was half a week when our system, which had no visible bugs, was not displayingvalid FFT data. Instead it displayed bars of varying random heights. We tried to debug this, to noavail. Finally, through random luck, we found that the system only worked when we changed our mathto continuous assign statements, and we just gave the logic enough time to trickle through. The logic had
13

previously been divided into multiple steps, with each operation occurring between concurrent clock ticks.I would attribute this to one of the operations needing more than 37ns to complete.
The FFT data is stored in a dual port block ram as 10-bit magnitudes, which are freely read out by thevisualizer module. The dual ports are clocked at separate frequencies, which provides the transition betweenthe 27 MHz audio processing and the 65 MHz video processing.
2.2.9 Testing/Debugging
Testing of the audio subsystem was performed by simulating frequency and volume values by assigning themto the switches on the labkit. In this way we were able to ensure that the subsystem worked over a widerange of frequencies and was able to scale the volume as we wished. However, this did not simulate theeffect of the frequency value changing very rapidly and often, as it does when using the actual hand input.As a result, when the two subsystems were combined, it was discovered that chorus would not work as itwas originally envisioned, with the max and min values that the theta values were increased or decreased bybeing scaled with frequency. In order to do this we had originally been dividing the incoming frequency valueand then changing the max. However, when frequency changed very quickly strange sounds were introducedto the audio stream. To combat this, we let the user program a static maximum value.
Most problems encountered by the audio subsystem were not technical, but rather questions of how tocreate an effect and make it sound good. Many approaches to chorus and flanging were tried before settlingon the ones discussed here, but none gave the sound effect anticipated or as well as desired. The finalversions discussed here were simply the last and best sounding versions tried, though they are not ideal byany means.
14

2.3 Visualizer (Jeffrey Chang)
The visualizer module provided all the functionality required in drawing visual effects on a VGA-connectedmonitor for both internal (Theremin-simulated) and external (fed in from an mp3 player or microphone)audio streams. Data from the internal audio stream was generated from the video processing module,modified by the audio effects module, and then passed to the visualizer module. Data from the externalaudio stream was directly passed to the visualizer module after being fed in through the ac97 and processedby the FFT.
Other inputs to the visualizer module included keys 1-8 on the attached keyboard, which were used toenable and select amongst the various visualization modes. The visualizer module outputted 24 bits of pixelcolor information to the VGA connector of the labkit, which was connected to an external LCD monitor.The monitor and VGA output was set to a resolution of 1024 x 768 pixels. The visualization display alwaysshowed a vertical blue bar and a horizontal red bar on the left and bottom sides of the screen, respectively.These were used to show, in real-time, the hand positions of the simulated-Theremin user. The majorityof the screen displayed the actual audio visualization, which could toggle between three separate modes.Each of these three modes could be enabled for the internal and external audio streams simultaneously, andindependently.
Figure 2.4 below shows a top-level block diagram of the entire visualizer module, with all inputs andoutputs. It also shows the various sub-modules that were implemented. For clarity, Table 2.3 lists anddescribes each of the inputs to the main visualization module.
Input Description Number of bitsvclock 65 MHz clock 1reset high-enabled reset signal 1hcount horizontal index of current pixel 11 bits, unsignedvcount vertical index of current pixel 10 bits, unsignedhsync XVGA horizontal sync signal 1vsync XVGA vertical sync signal (falling edge occurs @ 60 Hz) 1blank XVGA blanking 1external audio left iPhone/microphone audio input, left speaker 10 bits, signedexternal audio right iPhone/microphone audio input, right speaker 10 bits, signedinternal audio Theremin audio input magnitude (mono) 8 bits, signedinternal audio volume Theremin audio input volume 10 bits, unsignedtheremin frequency Theremin audio input frequency value 10 bits, unsignedmode select external used to select visualization mode for iPhone/mic audio 2 bits, unsignedmode select internal used to select visualization mode for Theremin audio 2 bits, unsigneddpdata holds FFT data (in BRAM) 10 bits, unsigneddpaddr used to select FFT data being accessed (from BRAM) 10 bits, unsignedhand x x coordinate of horizontally moving hand 10 bits, unsignedhand y y coordinate of vertically moving hand 10 bits, unsigned
Table 2.1: List of inputs to the visualizer module, which was instantiated once in the top-level labkit file
15

Figure 2.4: Block diagram of visualizer module. Various sub-modules were used for the internal and externalvisualizations, as well as to display sprites on the screen (hand position bars, circles, and lines
16

2.3.1 Design
Fire ModeThis visualization mode was intended to simulate the music visualization feature that is present in Winamp,
the media player designed and distributed by Nullsoft [3]. Fire Mode makes extensive use of the data providedby the FFT. Frequencies values vary horizontally across the width of the screen, with low frequencies onthe left and high frequencies on the right. At each horizontal position, a vertical bar is displayed whichcorresponds to the magnitude of that particular frequency in the audio stream at that particular moment intime. Colors vary across the entire rainbow spectrum (ROYGBIV), with red on the left side and violet onthe right side. Finally, a “falling tips” effect was implemented by placing a small (one pixel in height) whitebar at the top of each of the larger multicolored bars. These tips would “fall” downward with an accelerationof their own, which was slower than the dropping off of the larger multicolored bars. The resulting effectwas visually pleasing, as not only did the jumping multicolored bars correspond with the frequencies andbeats heard in the audio stream, but the falling tips gave a physical, time-delayed effect to the motion.
Figures 2.5(a) and 2.5(b) show the Fire Mode visualization displaying a few stationary frequencies, and afew moving (increasing) frequencies, respectively.
(a) At this particular moment in time, a low frequency with highmagnitude is being detected, as well as a mid-range and a high-range frequency.
(b) This photo shows the Fire visualization displaying three fre-quencies which were increasing over time. Falling tips can be seentrailing behind the vertical bars that dropped off.
Figure 2.5: Fire Mode
The implementation of Fire Mode, which will be discussed in more detail below, did not require anyadditional sub-modules. However, both Line Mode and Circle Mode utilized separate sub-modules whichtreated horizontal lines and circles as sprites. These sub-modules will be discussed in their respectiveImplementation sections.
17

Line Mode (or “Rainbow Ladder” Mode)This visualization mode was relatively simple, compared to the other two modes. Data from the FFT
was once again used, this time to detect frequencies whose magnitude was above a certain threshold value(manually set in the Verilog code, but easily tweaked). Visually, frequencies varied from the bottom ofthe screen to the top of the screen, with low frequencies displayed near the bottom. For frequencies wherethe magnitude was above the threshold value, a horizontal line stretching the full width of the screen wasdisplayed. However, not all frequency values were checked, as nearby frequencies were skipped when anabove-threshold one was detected (more information on this is provided in the Implementation section).The colors of the lines varied over time - specifically, they toggled across a spectrum which began withgreen, and then moved through blue, red, and yellow, with intermediate shades in between. Figure 2.6below shows this mode in action with a relatively low frequency being detected.
Figure 2.6: A horizontal line, orange in color, is displayed near the bottom of the screen in response to alow frequency with sufficient magnitude.
Circle Mode (or “Kaleidoscope Mode”)In this visualization mode, frequency values varied radially from the center of the screen. Separate circles
were displayed (centered approximately in the center of the visualization display area), and the circles’ radiicorresponded with the frequency values they represented. The internal logic was similar to that of LineMode, since only frequencies above a certain magnitude threshold were displayed. The purpose of thisvisualization mode was to enable rough beat detection and provide visual feedback which was symmetricalaround the center of the screen and resembled that of an actual subwoofer or speaker (if one imagines thecircular driver in front). While I originally planned to utilize the magnitude value of the audio input streamitself, the magnitude values of the individual frequencies (obtained from the FFT) were sufficient to provideaccurate beat detection and an enjoyable visual display.
The color of the circles displayed varied somewhat randomly, as the RGB values were set in a mannerwhich depended on the particular horizontal and vertical positions of the pixels. The resulting visualizationcontained an interesting combination of blue, violet, aqua, green, and pink hues. Figures 2.7(a) and 2.7(b)below show the circle mode at two different points in time in a song.
18

(a) At this particular moment, the audio stream contained manylow frequencies, but not that many mid-to-high range frequencies.
(b) Here, a few mid-range frequencies are being detected, whilethe number of low frequencies has diminished.
Figure 2.7: Circle Mode
2.3.2 Implementation
The overall visualizer module utilized a pixel pipeline to pass pixel data from one sub-module to the next.Specifically, the visualize gen ext module, which displayed external visualizations depending on which modehad been selected by the keyboard, was given an initial pixel input of black background pixels. The pixelsoutputted from this module were passed as input to the visualize gen int module, which also displayedvisualizations according to the mode that had been selected. The pixels outputted from visualize gen int werethen given to display h bar, whose output was given to display v bar. Finally, the output from display v barwas wired to the pixel bits that were fed to the VGA display. Thus, the horizontal and vertical hand positionbars were purposely rendered on top of the visualizations being displayed.
The modules displaying the vertical and horizontal hand position bars were fairly straightforward. Eachbar was 24 pixels in width and their length depended on the values being inputted. I included logic to displaywhite tick marks on the horizontal bar along the bottom of the screen, one pixel wide, at the locations whichcorresponded to specific frequencies equaling musical notes (two scales of A through G, not including flatsand sharps). These values were obtained from a table found using Google Image Search [4].
Implementation of the various visualization modes varied a bit depending on the particular mode. I nowdiscuss implementation details and subtleties for each of the three modes.
Fire ModeThis mode was implemented by cycling through the applicable range of memory address values of a BRAM
which contained the FFT data (specifically, values 0 through 128). This range was adequate for visualizingfrequencies which occurred in speaking, whistling, our Theremin simulator, or music audio found in typicalsongs. The memory values were reset and incremented along with the value of hcount in such a way thatthey were continually cycled through, while the beginning of the FFT data (very low frequencies) wouldcorrespond to an hcount value of zero (the left side of the screen), and the end of the FFT data beingexamined (high frequencies) would correspond with the right side of the screen. Of course, the height of the
19

vertical bars at any given time depended on the value in the BRAM for that particular frequency. This wasobtained by looking at dpdata, since dpaddr already depended on the value of hcount.
One of the tricky parts to implement was the rainbow spectrum of colors across the width of the screen.Since I was feeding RGB values to the VGA, it was not as straightforward to generate a rainbow spectrum(compared to if I had used YUV). However, I was able to do it with only a handful of nested if/else statementsand by consulting the Microsoft Paint application. Essentially, a pleasing continuous rainbow spectrum canbe generated by starting with pure red (R:G:B = 255:0:0), and then doing the following:
• Increase green value until pure yellow is reached (255:255:0)
• Then decrease red value until pure green is reached (0:255:0)
• Then decrease green and increase blue value until pure blue is reached (0:0:255)
• Then increase red value until pure violet is reached (255:0:255)
To implement this, I calculated the values that each third of the pixel output needed to be dependingon their particular hcount value so that the entire spectrum was displayed as hcount varied between 0 and1023. Some of the calculations involving static arithmetic operations on hcount were hard-wired so as toavoid repeated computation time.
Finally, the “falling tip effect” used a separate BRAM to store the locations and downward “velocities”of 128 different tips. At each vsync falling edge, the height (location) of each of the tips would be comparedto the height of the vertical bar for that frequency. A rising bar would push the tip upward, setting theheight back to a great value (and the velocity back to zero). A bar that had fallen in height would notaffect the tip directly, but instead, the tips height would be decreased according to its current velocityvalue, while the velocity value would be increased (slightly) for next time. By increasing the velocity valueby three pixels each time, we achieved a reasonable, visually pleasing downward “acceleration.” As a finalnote, although I originally used an array of 128 registers to store and change the tips’ height and velocityvalues, this did not work for some reason. When a 128-location BRAM was used instead, with the samecalculations and logic, the effect performed quite impressively.
Line / “Rainbow Ladder” ModeThe Rainbow Ladder visualization mode utilized a separate draw horizontal line module, which took as
input (along with other VGA-related values) the particular frequency for which a horizontal line needed tobe drawn. At every falling edge of vsync, a different frequency value was simply passed into the sub-moduleand the corresponding line was drawn.
To obtain these frequency values, dpaddr (the memory address for the BRAM containing the FFT data)was continually cycled through, and dpdata (the magnitude value for a particular frequency) was comparedto a parameterized threshold value. If the magnitude did not exceed the threshold, the subsequent value ofdpaddr would be used next time. However, if the magnitude did meet the threshold, the frequency valueto be passed in to the sub-module was set accordingly (after appropriate scaling), and dpaddr was skippedahead by a few values. The reason for doing this was to have a small amount of visual space betweenlines being displayed, and particularly to detect “peaks” in the frequency magnitude levels more accurately.Scaling was done so that frequency values typically produced by the audio inputs would end up displayingon the screen, since it has a vertical resolution of 768 pixels.
Within the draw horizontal line module itself, the initial color was set to green, and a temporary ‘counterregister was used to measure half-second time intervals, using the falling edge of vsync. The colors were set
20

to appropriate shades within a green - blue - red - yellow spectrum according the value of the counter. Thehorizontal line was drawn across the entire width of the screen, at a vertical height corresponding to thefrequency value, and with a vertical width of two pixels. Calculations involving vcount and the frequencyvalue were set up carefully in order to make sure the lines vertical positions were relative to the top of thehorizontal hand position bar, not from the bottom of screen (and while keeping in mind the value of vcountincreases downward from the top of the screen).
Circle / “Kaleidoscope” ModeThis mode also utilized a separate module, draw circle, which took as input a scaled frequency value.
To obtain these frequency values, the code cycled through the BRAM containing FFT data and comparedthe magnitudes to a threshold value. Frequencies with a magnitude above the threshold were passed tothe draw circle module. As in Line Mode, the code skipped ahead a few frequency values when ones abovethe threshold were detected, to enable moderately effective “peak” detection as well as providing a bit ofspacing between circles. The frequencies were also scaled so that the circles’ radii would range from 0 toapproximately 500. Otherwise, circles with radii significantly larger than 500 would not be visible on ascreen with a resolution of 1024 x 768 pixels.
To draw the circles themselves, the draw circle module used the inequalities x2 + y2 ≤ r2 and x2 + y2 ≥(r − 3)2, where x and y are the appropriately calculated x and y coordinates centered on the middle of thevisualization area, and r is the desired radius of the circle. This resulted in circles of acceptable thickness. Ifthe comparison to r2 is solely used, only a few pixels actually display on the screen. To achieve a somewhatrandomized color scheme, various bits of hcount and vcount were concatenated to form the 24-bit pixel colordata.
2.3.3 Testing and Debugging
It was important to test the visualizer module as I went along, adding incremental functionality, in orderto make sure I did not realize I had a nonfunctioning system when integration with the other modules wasattempted. At first, I did much of my testing by manually inputting static values into the visualizer module(e.g., setting the frequency value to 500, setting the audio volume to 200, etc.). Later on, I enabled certainfrequency values by pressing specific labkit buttons, in order to test specific visualization properties. I alsoutilized buttons on the labkit to test changing register values (e.g., having the up/down buttons move thevertical hand position bar, and having the left/right buttons move the horizontal hand position bar).
Some of the bugs which arose in initial coding phases involved visual artifacts which would appear on thescreen during visualization. I assumed these were being caused by clocking issues, and sought to minimizecomputation whenever possible. Although I experimented with pipelining of the video, by being wise withcalculations (and also possibly due to rebooting/switching labkits), these unwanted visual artifacts wereeliminated.
Integration with the video processing and audio effects modules was not terribly difficult, as I had setup my module to accept a single set of clearly defined inputs. We discovered that the FFT would oftenoutput garbled, nonsensical data after a reprogramming of the FPGA. However, power cycling (rebooting)the labkit always solved this problem. By the end of the project, I had formed a habit of always rebootingthe labkit before programming the FPGA with a new .bit file.
Some of the final bugs that needed to be ironed out involved variables overflowing due to registers beingdeclared with too few bits. This happened because we ended up deviating slightly from the original designwe had for the various audio signals, but it was easily fixed by increasing the register bit sizes. In hindsight,this problem could have been avoided if I had simply overestimated the bit sizes of the variables needed from
21

the start, instead of trying to be overly frugal with register sizes. Finally, the various frequency scaling andmagnitude threshold values needed to be tweaked once we had the entire system working. In the end, wewere able to find values resulting in visualizations that were appealing to the eye.
22

Chapter 3
Conclusion
Our project provides a lot of integrated functionality in an end product we believe is fun to use and watch.It successfully simulates a musical Theremin, by allowing the user to control pitch and volume by simplymoving their hands while wearing colored gloves. Our system is also able to apply a wide variety of audioeffects to the tones generated by the Theremin simulator. Effects such as a violin sound, reverberation,chorus, harmonics, and even major and minor musical chords can be applied and enjoyed by the listener.Finally, a number of visualization modes can be enabled, each of which display multicolored, dynamic,real-time visualizations of the audio stream in a different way. The user can choose to visualize eitherthe Theremin-simulated audio or an external audio input stream or both simultaneously! For the tonesgenerated by the Theremin simulator, it is interesting to see the users hand motions and various audio filterscreate a visual effect as well. For music coming from an external audio source such as an mp3 player, it istons of fun to sit back and watch a particular song generate characteristic images and shapes on the screen.It is our hope that this project may inspire future students to create something which lies similarly at theintersection of music, engineering, and visual art.
23

Chapter 4
References
[1] http://en.wikipedia.org/wiki/Chorus effect
[2] http://en.wikipedia.org/wiki/Flanging
[3] http://www.winamp.com
[4] http://www.guitar-vacation-retreats.com/resources/images/note-frequencies.jpg
24

Chapter 5
Appendix
View http://web.mit.edu/aspicer/Public/final/ for a copy of our source code.
Edit [12/15/07 2:08 PM]: Uploaded a new copy after the deadline just to change a mistake in thetitle.
25