Embed Size (px)
Citation preview

1
1
Digital Terrain Analysiswith LiDAR for
Clean Water Implementation
May 11 2010May 11, 2010Mankato
2
Digital Terrain Analysis with LiDARfor Clean Water Implementation
Workshop Introduction
Adam Birr, Ph.D.Minnesota Department of Agriculture
Research [email protected]
507-206-2881
3
Identifying Critical Portions of the Landscapefor Water Quality Protection
Using Terrain Analysis
Adam Birr, Ph.D.
Barbara Weisman
Minnesota Department of Agriculture
David Mulla, Ph.D., Jake Galzki, and Joel Nelson
Department of Soil, Water, and Climate
University of Minnesota
In accordance with the Americans with Disabilities Act, an alternative form of communication is available upon request. TDD: 1-800-627-3529 An Equal Opportunity Employer and Provider

2
4
Clean Water Fund
• Constitutional Amendment provides much-needed funding for protection, restoration, enhancement
• Clean Water Fund implementation dollars should be spent on the most critical landscapes and sources of water quality degradationwater quality degradation
• There is a pressing need for tools to identify these critical areas
5
Precision Conservation
• “…set of spatial technologies and procedures to implement conservation management practices that integrates spatial and temporal variability across natural and agricultural systems.” (Berry et al. 2003)
• “Getting the right practices, in the right places, at the right time, and at the right scale is what makes conservation effective.” (Cox 2005)
6
Critical Areas
• Studies suggest that small areas of the agricultural landscape (5-25%) generate a disproportionately large amount of erosion or phosphorus
Photograph Courtesy of the Brown, Nicollet, Cottonwood Water Quality Board
or phosphorus
• Defined as the portion of the landscape where the least amount of BMP investment yield the most benefit (Maas et al. 1985)
In accordance with the Americans with Disabilities Act, an alternative form of communication is available upon request. TDD: 1-800-627-3529 An Equal Opportunity Employer and Provider

3
7
•• Two criteria:Two criteria:
–– Accumulation of Accumulation of surface flowsurface flow
–– Hydrologic Hydrologic connection toconnection to
Side Inlet
Gully
Critical Areas
connection to connection to surface waterssurface waters
y
8
Identifying Critical Areas• Challenging due to hydrologic complexity and
natural variability across landscapes
• Terrain analysis of Digital Elevation Models (DEMs) may be the key
• LiDAR data greatly enhances our ability to identify critical areas
9
• 25 Minnesota counties currently have LiDAR data
• Statewide LiDAR acquisition funded by Clean Water Fundby Clean Water Fund ($5.6 m)
• Acquisition to be completed in 2012
“The legislature got you the dollars, now go out and show us what you can do!”- Representative Rick Hanson
In accordance with the Americans with Disabilities Act, an alternative form of communication is available upon request. TDD: 1-800-627-3529 An Equal Opportunity Employer and Provider

4
10
Digital Terrain Analysis Characteristics
• Sacrifices physical sophistication for simple calculations describing soil moisture patterns
• Input requirements are readily accessible and appropriate for the precision with which many management questions need to and can be answered (Barling et al 1994)questions need to and can be answered (Barling et al., 1994)
• Several studies have demonstrated the use of topographic indices to characterize the spatial distribution of soil moisture and soil mapping components controlled by soil hydrology (Bell et al., 1994; Thompson et al., 1998; Fried et al., 2000)
11
Clean Water Legacy Pilot Study
• Developed a tool that uses terrain attributes to identify critical source areas vulnerable to surface water runoff
– Focused on near-stream UPLAND features
– Piloted at multiple scales (3,000 ac to 800,000 ac)
using different DEM sources and resolutionsusing different DEM sources and resolutions
• 30m DEM for Le Sueur Watershed 8-digit HUC
• 3m LiDAR-derived DEM for Beauford Ditch Watershed (Blue Earth County) and Seven Mile Creek Watershed (Nicollet County)
12
Clean Water Legacy Pilot Study
Overview of Methods
• Calculated a suite of primary and secondary terrain attributes in the pilot watersheds
• Conducted a field survey to related terrain attributes to critical source features in the field
• Determined which terrain attributes are most applicable
• Used statistics to define threshold values for prioritizing critical areas
In accordance with the Americans with Disabilities Act, an alternative form of communication is available upon request. TDD: 1-800-627-3529 An Equal Opportunity Employer and Provider

5
13Clean Water Legacy Pilot Study
Study Area2 pilot watersheds in Minnesota River Basin
14
Clean Water Legacy Pilot Study
Field Surveys
• Handheld Pocket PC with WAAS GPS
• Field mapping software
• Tape measure
• Digital camera
• Compass
• Log book
15Example: Using Flow Accumulation to Identify GulliesPilot Study Watershed: Seven Mile Creek (Nicollet County)
In accordance with the Americans with Disabilities Act, an alternative form of communication is available upon request. TDD: 1-800-627-3529 An Equal Opportunity Employer and Provider

6
16Example: Using Flow Accumulation to Identify GulliesPilot Study Watershed: Seven Mile Creek (Nicollet County)
17
Courtesy of the Brown, Nicollet, CottonwoodWater Quality Board
18Example: Using Flow Accumulation
to Identify Critical Source Areas (Side Inlets, Gullies, Open Intakes)
Pilot Study Watershed:Beauford Ditch (Blue Earth County)
In accordance with the Americans with Disabilities Act, an alternative form of communication is available upon request. TDD: 1-800-627-3529 An Equal Opportunity Employer and Provider

7
19Example: Using Flow Accumulation to Identify Critical Source Areas(Side Inlets, Gullies, Open Intakes)
Pilot Study Watershed: Beauford Ditch (Blue Earth County)
20
21
In accordance with the Americans with Disabilities Act, an alternative form of communication is available upon request. TDD: 1-800-627-3529 An Equal Opportunity Employer and Provider

8
22Clean Water Legacy Pilot Study
Field Survey Results• Confirmed that ordinal size of a feature is related to Stream Power Index• Though not a quantitative assessment of sediment delivery potential, values
suggest a relationship between terrain attribute values and magnitude of erosional features
• Further study—including water quality data—needed to quantify relationship
SDP Score Average Percentile of SPI
Average Percentiles of SPI for Gullies in Seven Mile Creek Watershed, summarized by SDP Score
Side Inlet Size Average Percentile of SPILarge (24 - 36 inches) 98.9
Medium (14 - 18 inches) 93.3Small (4 - 12 inches) 81
gHigh (SDP = 3) 97.4
Moderate (SDP = 2) 83.8Low (SDP = 1) 72.8
Average Percentiles of SPI for Side Inlets in Beauford Ditch Watershed, summarized by Inlet Size
23
Clean Water Legacy Pilot Study
Conclusions
• Terrain analysis can be a very fast and effective way to identify critical areas
• Terrain attribute values indicate the ordinal, or relative, size of erosional features
– Can help us target conservation efforts to the most severe erosion risks
• Terrain analysis is easy to employ and a valuable use of newly acquired LiDAR data
24
Questions?
Adam Birr, Ph.D.Research Scientist
Minnesota Department of Agriculture507-206-2881
In accordance with the Americans with Disabilities Act, an alternative form of communication is available upon request. TDD: 1-800-627-3529 An Equal Opportunity Employer and Provider

9
25
Digital Terrain Analysis with LiDARfor Clean Water Implementation
Workshop Lecture 1:LiDAR & Digital Elevation Models (DEMs)
Joel Nelson - instructor
26
Models of Topography:Elevation Data in General
• Stereo photography
• Topographic maps (elevation contours)
• Digital Elevation Models (DEMs)Digital Elevation Models (DEMs)– Stereophotograph models
– Ground survey (GPS, other)
– Interpolation from topographic maps
27
Stereo Photography
• View shape of topographic surface
• Overlapping photographs
• View from two perspectives V p p(parallax)
• Old technology – has been used extensively in Soil Survey and forestry
In accordance with the Americans with Disabilities Act, an alternative form of communication is available upon request. TDD: 1-800-627-3529 An Equal Opportunity Employer and Provider

10
28
Topographic/Contour Data
• Also called contour maps
• Contour line joins points of equal elevation
• Can interpret slope, relief, shape/size of valleys and hills
• Paper and digital
– Digital leaves visualizationup to the user
29
Digital Elevation ModelWhat is a DEM?
• Digital file that:
• Contains elevation of terrain over a specified area
• Is arranged as a fixed-grid g ginterval over the earth surface
• Is geo-referenced
• Can be manipulated to create other elevation-dependentdata products
30
Digital Elevation ModelWaseca, Minnesota
In accordance with the Americans with Disabilities Act, an alternative form of communication is available upon request. TDD: 1-800-627-3529 An Equal Opportunity Employer and Provider

11
31
Elevation
WasecaMinnesota
AgroecoResearch Farm,
100 m
HighLow
32
DEMSources
• USGS 7.5m series digitized contoursg
• Field survey
• Stereo photography
• GPS
• LiDAR (Light Detection and Ranging)
33
DEMCharacteristics
• ResolutionD it f l ti t– Density of elevation measurements
– Determines level of detail of surface representation
• Interpolation– Calculation used to find elevation of unspecified location
– Various techniques/algorithms: Kreiging, Theissen Polygons, Spline, IDW, Bilinear, Nearest Neighbor
In accordance with the Americans with Disabilities Act, an alternative form of communication is available upon request. TDD: 1-800-627-3529 An Equal Opportunity Employer and Provider
12
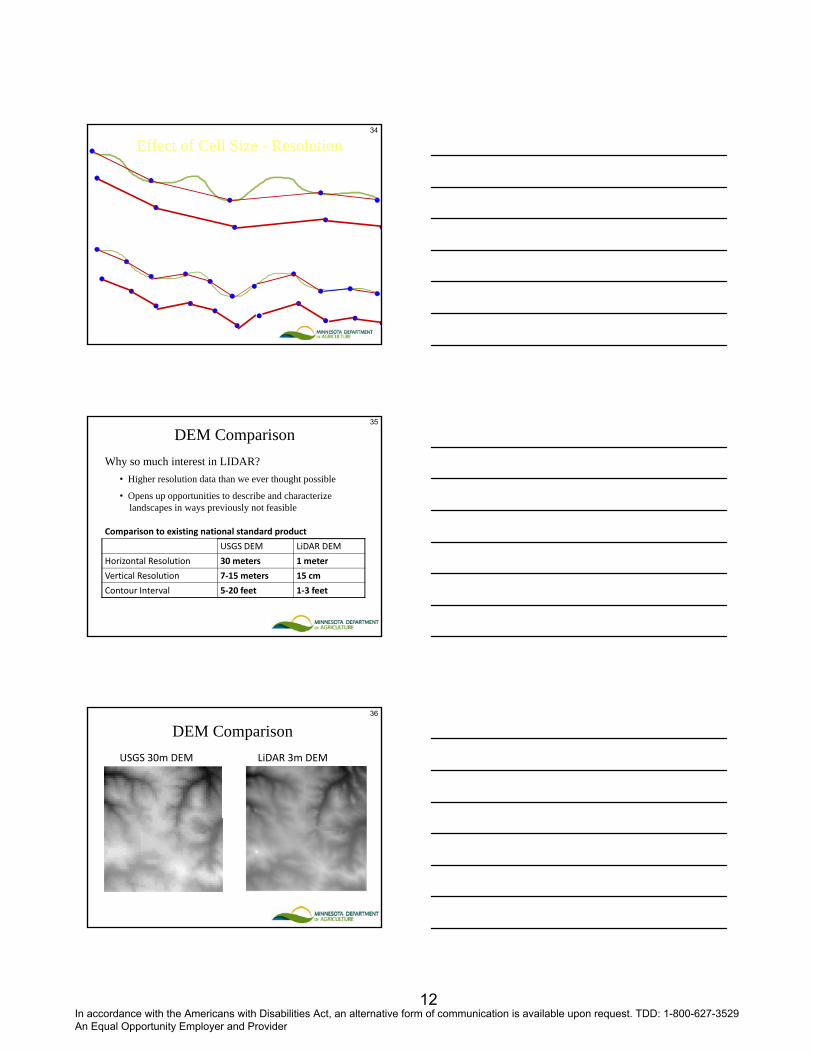
34
Effect of Cell Size - Resolution
35
DEM Comparison
Why so much interest in LIDAR?
• Higher resolution data than we ever thought possible
• Opens up opportunities to describe and characterize landscapes in ways previously not feasible
Comparison to existing national standard product
USGS DEM LiDAR DEM
Horizontal Resolution 30 meters 1 meter
Vertical Resolution 7‐15 meters 15 cm
Contour Interval 5‐20 feet 1‐3 feet
36
DEM Comparison
USGS 30m DEM LiDAR 3m DEM
In accordance with the Americans with Disabilities Act, an alternative form of communication is available upon request. TDD: 1-800-627-3529 An Equal Opportunity Employer and Provider

13
37
DEM Comparison
38
USGS 30 meter Elevation Data
39
LiDAR 3 meter Elevation Data
In accordance with the Americans with Disabilities Act, an alternative form of communication is available upon request. TDD: 1-800-627-3529 An Equal Opportunity Employer and Provider

14
40
41
Contour Comparison
2 ft contours created from LIDAR data
10 ft contours createdfrom standard 30m DEM data
42
LiDAR
What is LiDAR?
• Light Detection And Ranging – a remote sensing system used to collect topographic datap g p
• Used by agenciesand organizations to develop high-resolution elevation information
In accordance with the Americans with Disabilities Act, an alternative form of communication is available upon request. TDD: 1-800-627-3529 An Equal Opportunity Employer and Provider

15
43
LiDAR Resolution
• Bare earth resolutions– Vertical: 15cm
– Horizontal: 1m• Root Mean Square Error
(Reutebach et al 2005)(Reutebach, et al., 2005)
44
LiDAR Data Collection
• Aircraft mounted laser(s)
• LiDAR sensor records time difference between laser
How is LiDAR data collected?
difference between laser beam emission and return of reflected laser signal to aircraft
• Each pulse has an associatedreal-world GPS locationwww.esri.com/library/userconf/proc00/professional/papers/Pap808/p808.htm
45
How is LiDAR data collected?• End-product is accurate,
with geographically registered longitude, latitude, and elevation (x y z) for every data point
LiDAR Data Collection
(x,y,z) for every data point
• LiDAR data collection technology is rapidlyimproving
• Several file types and derivative productsavailable to end-users
www.esri.com/library/userconf/proc00/professional/papers/Pap808/p808.htm
In accordance with the Americans with Disabilities Act, an alternative form of communication is available upon request. TDD: 1-800-627-3529 An Equal Opportunity Employer and Provider

16
46
LiDAR Data CollectionLiDAR Returns: Multiple discrete return pulses
LiDAR Intensity: Magnitude or strength-of-return pulse
Metadata: Information about how data was collected—READ IT!
• All returns can be used• Forest canopy
I i i• Intensity image• Vegetation mapping
47
DEM Pre-Processing• Techniques/tools to prepare dataset for analysis
• LiDAR data is changing this step
• Pre-processing tools
– Pit Filling
Elevation
High
Low
– Filter
– HydrologicConditioning
48
Pit Filling• Artificially draws base elevation levels in “sinks”
or “peaks” to bank-height or surrounding elevation values
• Usefulness / appropriateness depends on landscape and datalandscape and data
In accordance with the Americans with Disabilities Act, an alternative form of communication is available upon request. TDD: 1-800-627-3529 An Equal Opportunity Employer and Provider

17
49
Pit Filling
• Useful for:– Removing anomalies and erroneous values– Closed-depression landscapes– Flood drainage scenarios – fills up depressions,
forcing water to flow over
• Caveats:– Data and drainage is being
altered, made artificial– Depicts accurate flow only
at flood stages or higher
50
Pit Filling
51
Filter Analysis
• Low Pass Filter – a moving-window analysis that performs neighborhood averaging (9-cell basis)
• Low-pass smoothes extremes, High-pass enhances them
In accordance with the Americans with Disabilities Act, an alternative form of communication is available upon request. TDD: 1-800-627-3529 An Equal Opportunity Employer and Provider

18
52
Filter Analysis• Useful for:
– Improving DEMs by eliminating spurious data– Smoothing out local variations, providing more
connectivity to results
• Caveats:– Averages out data extremes– “Dumbs down” the data– Results in “fuzzy effect” –
resolution appears reduced even though it is not
53
Hydrologic Conditioning• Any alteration that improves flow-thru/drainage
• Several types, from manual to fairly automated
• Common types:– Stream burning—uses stream data to force drainage
– Bridge/obstruction removal involves manual editing– Bridge/obstruction removal—involves manual editing,but becoming more automated
– Hydrologic breaklines—optional/additional data used toidentify sharp changes in relief
54
Hydrologic Conditioning• Useful for:
– Routing flow through an entire watershed ordrainage network
– Correcting erroneous river channel boundaries
• Caveats:– Stream data/other data used with
LiDAR must be same resolutionor spatial quality
– Flow/drainage is often site-specific and dependent upon the quality of the control structure
In accordance with the Americans with Disabilities Act, an alternative form of communication is available upon request. TDD: 1-800-627-3529 An Equal Opportunity Employer and Provider

19
55
End of Lecture 1
Questions?
56
Digital Terrain Analysis with LiDARfor Clean Water Implementation
Lecture 2:Terrain Analysis
Joel Nelson - instructor
57
Terrain AnalysisWhat is it? Many things:• Includes use of a DEM to model
the landscape
• Provides a quantitative, detailed, objective, repeatable process to accurately model real landscape processeslandscape processes
• Coupled with GIS/Remote Sensing technologies, allows us to quickly and accurately characterize large areas
• Helps describe, analyze, and interpret any feature related to topography – soils, vegetation, wildlife, etc.
In accordance with the Americans with Disabilities Act, an alternative form of communication is available upon request. TDD: 1-800-627-3529 An Equal Opportunity Employer and Provider

20
58
Terrain Analysis History
• Concept is over 20 years old
• Early pioneers Wilson, Gallant, Moore, Gessler
– Terrain Analysis: Principles andApplications (see references, last slide)Applications (see references, last slide)
• Early applications:– Soil Mapping
– Hydrologic Mapping
– Wildlife/Habitat Modeling
• LiDAR is creating renewed interest in terrain analysis
59
Advantages of Terrain Analysis
• Coupled with GIS/remote sensing, enables fast, accurate characterization of large areas (days vs. months)
• Quantitative, repeatable, and non-subjective
• Helps describe, analyze, and interpret any featurerelated to topography (soils, vegetation, wildlife, etc.)
• Results in spatial data, not just numerical data
• Fits the level of detail needed for conservation planning
60
Cost Benefits of Terrain AnalysisPilot Study Watershed – Seven Mile Creek
• Walking survey: 10 days, ~300 hours, 3 people
– Total cost was $9,500, or ~$413/ditch mile
• To field-survey the rest of Nicollet County would take about 10 years and ~$100,000 in labor
Source: Brown Nicollet Cottonwood Water Quality Board
In accordance with the Americans with Disabilities Act, an alternative form of communication is available upon request. TDD: 1-800-627-3529 An Equal Opportunity Employer and Provider

21
61
Cost Benefits of Terrain AnalysisPilot Study Watershed – Seven Mile Creek
• LiDAR-based GIS survey was completed ina matter of hours
• A county-wide survey identifying most of the largest contributing areas could be done in a matter of weeks
• Terrain analysis requires far less time and resources than field-based surveys
62
Terrain Attributes• Primary and secondary
• Primary attributes calculated directly from elevation data– Examples: Aspect, Slope, Flow Accumulation,
Profile Curvature, Plan Curvature
• Secondary (compound) attributes involve combinations of primary attributes – the are indices– Indices describing the spatial variability of specific landscape
processes, such as the potential for sheet erosion (Moore et al., 1991)
– Examples: Stream Power Index, Wetness Index
63
Digital Terrain Analysis Overview Example
DEM
Terrain
Point Elevationswith GPS/LiDAR
TerrainAttributes
SpatialInterpolation
AttributeCalculation
In accordance with the Americans with Disabilities Act, an alternative form of communication is available upon request. TDD: 1-800-627-3529 An Equal Opportunity Employer and Provider

22
64
Primary Terrain Attributes
Aspect• Describes the cardinal direction a surface
faces (0°-360°)
• Uses:
– Fire management
– Soil moisture andevapo-transpiration
– Flora and fauna distribution and abundance
65
Primary Terrain Attributes
Slope
• Describes overlandand subsurface flowvelocity and runoff raterate
• Quantifies maximum rate of change in value from each cell to its neighbors
66
Slope
Blue Earth CountyMi t
Beauford DitchSubwatershed,
HighLow
Minnesota
In accordance with the Americans with Disabilities Act, an alternative form of communication is available upon request. TDD: 1-800-627-3529 An Equal Opportunity Employer and Provider

23
67
Slope
– Overland and subsurface flow
– Velocity and runoff rate
– Precipitation
• Use/Significance
p
– Vegetation
– Geomorphology
– Soil water content
– Land capability class
68Primary Terrain Attributes
Curvature
Plan Curvature• Measured perpendicular to
direction of descent
• Describes convergingor diverging flow
Profile Curvature• Measured in direction of
maximum descent or aspect direction
• A measure of flow acceleration, i /d iti t• Contour curvature erosion/deposition rate
69
Plan
Curvature
Profile
Convex
Concave
In accordance with the Americans with Disabilities Act, an alternative form of communication is available upon request. TDD: 1-800-627-3529 An Equal Opportunity Employer and Provider

24
70
Curvature
Use/Significance
• Plan Curvature– Converging or
diverging flow
– Soil water contentSoil water content
– Soil characteristics
• Profile Curvature– Flow acceleration
– Erosion/deposition rate
– Geomorphology
71
Primary Terrain Attributes
Flow Accumulation• A measure of surface or
shallow subsurface runoff at any given point on the landscape
• Combines effects of upslope surface drainage area and convergence of runoff
• Also called Catchment Area
72
Primary Terrain Attributes
Flow Accumulation
• Represents drainage area of any given cell
• Indicates overland flow paths
• Also called Catchment Area or Upslope Contributing Area
Elevation
300 m
308 m
30
10,000
Flow Accumulation
In accordance with the Americans with Disabilities Act, an alternative form of communication is available upon request. TDD: 1-800-627-3529 An Equal Opportunity Employer and Provider

25
73
Flow Accumulation
Blue Earth
Beauford Ditch Subwatershed,
CountyMinnesota
HighLow
74
75
Primary Terrain Attributes
Flow Accumulation
– Runoff volume
– Steady-state runoff rate
Use/Significance
y
– Soil characteristics
– Soil-water content
– Geomorphology
In accordance with the Americans with Disabilities Act, an alternative form of communication is available upon request. TDD: 1-800-627-3529 An Equal Opportunity Employer and Provider

26
76
Secondary Terrain Attributes
• Second derivative calculations(combinations of primary terrain attributes)
C d T hi I d (CTI)Compound Topographic Index (CTI)
Stream Power Index (SPI)
77
Secondary Terrain Attributes
Stream Power IndexSPI = ln (A * Slope)
Compound Topographic IndexCompound Topographic IndexCTI = ln (A / Slope)
where A = Flow Accumulation
78
Secondary Terrain Attributes
Stream Power Index (SPI)
• Product of Slope and Flow Accumulation
• Quantifies the potential erosive power of overland flow
• Isolates areas with large catchments and steep slopes
ln (A * Slope) = Stream Power Index (SPI) SPIln (A Slope) Stream Power Index (SPI)
X =
High
Low
In accordance with the Americans with Disabilities Act, an alternative form of communication is available upon request. TDD: 1-800-627-3529 An Equal Opportunity Employer and Provider

27
79
Stream Power Index
• Measure of potentialerosive power of overland flow
• Combines Flow Accumulation (catchment area) with slope
• Steep slope with large drainage area results in high SPI value
– Indicator of where ephemeral gullies may form in a field
80
Secondary Terrain Attributes
Compound Topographic Index (CTI)
• Flow Accumulation divided by Slope
• Identifies areas where water collects or ponds on the landscape
• Also called Steady State Wetness Index or just Wetness Index
7
20
=
ln (A / Slope) = Compound Topographic Index (CTI)
81
Upland DepressionsCritical Areas
Compound Topographic Index
• Measure of potential wetness in the landscape
• Combines Flow Accumulation (catchment area) with slope
High CTI Value
• Low slope and/or high catchment equal high potential for water topond or collect– Indicator of potential
wetlands and varioussoil types
In accordance with the Americans with Disabilities Act, an alternative form of communication is available upon request. TDD: 1-800-627-3529 An Equal Opportunity Employer and Provider

28
82
End of Lecture 2
Questions?
83
Digital Terrain Analysis with LiDARfor Clean Water Implementation
Lecture 3:Performing Terrain Analysis
Joel Nelson - instructor
84
Performing Terrain Analysis – Principles
• Dependable method to quantify anddescribe the landscape
• Iterative process that builds on what’slearned in previous steps
• Adaptable – dependent on landscape feature of interest
R l i i ib i di• Relative – terrain attributes are indices
• Dynamic – improvements to algorithms and software enable solutions to previous problems and issues– There’s an overall process, but individual detailed steps
not necessarily the same each time
– Should always be supplemented with field visits, ancillary data, or site-specific knowledge
In accordance with the Americans with Disabilities Act, an alternative form of communication is available upon request. TDD: 1-800-627-3529 An Equal Opportunity Employer and Provider

29
85
Process
Planning/Goals
Pre-Processing
No
Calculate Primary Ancillary Data
Yes
Calculate Primary
• Pit Fill• Filter• Stream Burn• Other
Terrain Attributes
Calculate Secondary Terrain Attributes
Ancillary Data
Ground Truth
Comparison
Prioritizing
Visualize/Report
DECISION
Terrain Attributes
Calculate Secondary Terrain Attributes
86
Pre-Planning Strategies
Analysis goals? Develop these first.
• Pre-processing steps and progression of calculations may differ depending on:
– Landscape p
– End products – e.g., flow network of watershed vs. specific erosion problem areas
– Focus – e.g., uplands, lowlands, or both
– In-house vs. public audience – presentation of terrain attributes can be complex
87
Pre-Planning Strategies
• Landscape – physiographic characteristics of thelandscape modeled willinfluence decisions
• High-relief, dendriticnatural drainage– Flow networks are
fairly contiguous
– Pit filling may be appropriate(few natural pits in this landscape)
In accordance with the Americans with Disabilities Act, an alternative form of communication is available upon request. TDD: 1-800-627-3529 An Equal Opportunity Employer and Provider

30
88
Pre-Planning Strategies• Landscape – physiographic
characteristics of thelandscape modeled willinfluence decisions
• Low relief,depression-filled landscape– Flow networks often
irregular local
Restorable Wetland Polygons
Upland Depressions Critical Areas
irregular, local– Pit filling, stream
burning can mimicflood stage flow, nottypical conditions
– Run both filled and unfilled
Data source: Ducks Unlimited, Inc. MN DNR, & MN LMIC
89
Ancillary Data
• Terrain attributes are based solely on topography
• Use other information to aid decision-making– Land use data
– Land management data
A i l h t h– Aerial photography
– Existing conservation
practices
– Distance to water
90
Ancillary Data
Aerial Photography• Particularly useful
• In limited situations, can useto validate/verify groundconditions
• Higher quality orthophotosf fl i h i doften flown with LiDAR data
• Can also clarify unexplainedanomalies or uneven terrain
• Does not replace ground-truthing
• Dated product
In accordance with the Americans with Disabilities Act, an alternative form of communication is available upon request. TDD: 1-800-627-3529 An Equal Opportunity Employer and Provider

31
91
Ground Truthing• Very necessary to relate mapping to planning goals• Important step in comparing terrain attribute threshold values to real-
world conditions• Strategies
B i d hi– Basic ground truthingoverall
– Randomly select areas to do exhaustive surveys
• Windshield surveys
• Detailed surveys
92
Comparison
• Identify points where terrain attributes indicate area of interest
• Compare attribute
GIS based survey points
Stream
SPI ≥ 85th percentile
Compare attribute values with ground truth data at same location
93
Comparison• Compare real-world features to those identified by
terrain analysis (e.g., gullies, depressions, etc.)
• Create table/matrix to record errors• Type I Error / False Positive – terrain analysis indicated a
feature that wasn’t there
• Type II Error / False Negative – terrain analysis indicated no feature, but one existed
In accordance with the Americans with Disabilities Act, an alternative form of communication is available upon request. TDD: 1-800-627-3529 An Equal Opportunity Employer and Provider

32
94Prioritizing
Percentile Ranking• Terrain attributes converted to percentiles and ranked
• Allows comparison among all values within a given area (watershed, county, etc.)
• Comparison is more uniform than guessing random values
• Visually depicts spatial distribution of upper X% of specific terrain attribute valuesterrain attribute values
95
Prioritizing
Percentile Ranking
• Plot of all SPI values in watershed
• Side Inlet locationsSide Inlet locations correspond to upper-endSPI values
96Prioritizing
Percentile Ranking• How-to • First extract all individual cell records – export point• Several methods
– Statistical Software Package– Excel 2007 Percentile command – very simple
• Limited to a little over 1 million records• LiDAR-derived terrain attributes often have more than 1 million records
In accordance with the Americans with Disabilities Act, an alternative form of communication is available upon request. TDD: 1-800-627-3529 An Equal Opportunity Employer and Provider

33
97
Prioritizing• Big-picture analysis to account for all that
terrain analysis doesn’t– Proximity to water– Landscape position relative to ancillary data of interest– Location within the watershed– Costs: Survey, Remediation/Attenuation, Labor
98
Visualization• GIS – Terrain Analysis
• Identify via combination of attributesand your own criteria– Alter symbology for attributes
– Display upper X% of valuesthat satisfy goals/needs
0 500 1,000250Meters
0 5 102.5Kilometers
Ravine Critical Areas
Minnesota River
Minnesota River Tributaries
99
Terrain Analysis Caveats/Limitations
• Same limitations as LiDAR data in general– Cost– File Size/Computing Power– Expertise/Training
• Terrain analysis does NOTTerrain analysis does NOT……Replace local knowledge…Make fieldwork unnecessary or obsolete…Transfer well to non-like landscapes when comparing terrain
attribute values…Differentiate between man-made and “natural” structures
In accordance with the Americans with Disabilities Act, an alternative form of communication is available upon request. TDD: 1-800-627-3529 An Equal Opportunity Employer and Provider

34
100
Terrain Analysis Caveats/Limitations
• Pertains to surface flow only
• No automated or one-size-fits-all process
• Results only as good as what you put into itD– Data
– Assumptions
– Effort
– Ground truthing / Error checking
101
End of Lecture 3
Questions?
102
Credits/Acknowledgements• Minnesota Dept. Agriculture
– Dr. Adam Birr– Barbara Weismann– Mike Dolbow– Jim Gonsoski– Karl Hillstrom– Brian WilliamsBrian Williams
• Jake Galzki – U of MN
• Dr. David Mulla – U of MN
• Dr. Jay Bell – U of MN
• Brown/Nicollet Cottonwood Water Quality Board
• Blue Earth County – Information Technology Department
• Goodhue County Survey/GIS Department
In accordance with the Americans with Disabilities Act, an alternative form of communication is available upon request. TDD: 1-800-627-3529 An Equal Opportunity Employer and Provider

35
103
References• Gallant, J.C. and J.P. Wilson. 2000. Primary topographic attributes.
p. 51 - 85. In J.P. Wilson and J.C. Gallant (eds.) Terrain analysis: Principles and applications. John Wiley and Sons, Inc., New York.
• Gessler, P.E., I.D. Moore, N.J. McKenzie, and P.J. Ryan. 1995.Soil-landscape modeling and spatial prediction of soil attributes. International Journal of GIS. Vol 9, No 4, 421-432.
• Moore, I.D., P.E. Gessler, G.A. Nielsen, G.A. Peterson. 1993. Soil attribute prediction using terrain analysis. Soil Sci. Soc. Am. J. 57:443-452452.
• Moore, I.D., R.B. Grayson, and A.R. Ladson. 1991. Digital terrain modeling: A review of hydrological, geomorphological, and biological applications. Hydrol. Processes. 5:3-30.
• Tomer, M.D., D.E. James, and T.M. Isenhart. 2003. Optimizing the placement of riparian practices in a watershed using terrain analysis. J. Soil Water Conserv. 58:198-206.
• Wilson, J.P. and J.C. Gallant. 2000. Secondary topographic attributes. p. 87-132. In J.P. Wilson and J.C. Gallant (eds.) Terrain analysis: Principles and applications. John Wiley and Sons, Inc., New York.
In accordance with the Americans with Disabilities Act, an alternative form of communication is available upon request. TDD: 1-800-627-3529 An Equal Opportunity Employer and Provider