Embed Size (px)
Citation preview

Digital Image Representation and Color FundamentalsRODNEY DOCKTER
APRIL 2018
1

Outline• Digital Image Representation• Sampling, Quantization
• Color Fundamentals• Color Transformation
2

Digital Image Representation• Digital Image Pipeline
3

Digital Image Representation• Digital Image Pipeline
4

Digital Image Representation• Two major factors determine digital image quality:
• Spatial Resolution – Controlled by spatial sampling
• Color Depth – Controlled by the number of colors or grey levels allocated for each pixel
• Increasing either of these factors results in a higher quality image at the expense of larger image file size, larger storage requirements, longer display/processing time.
5
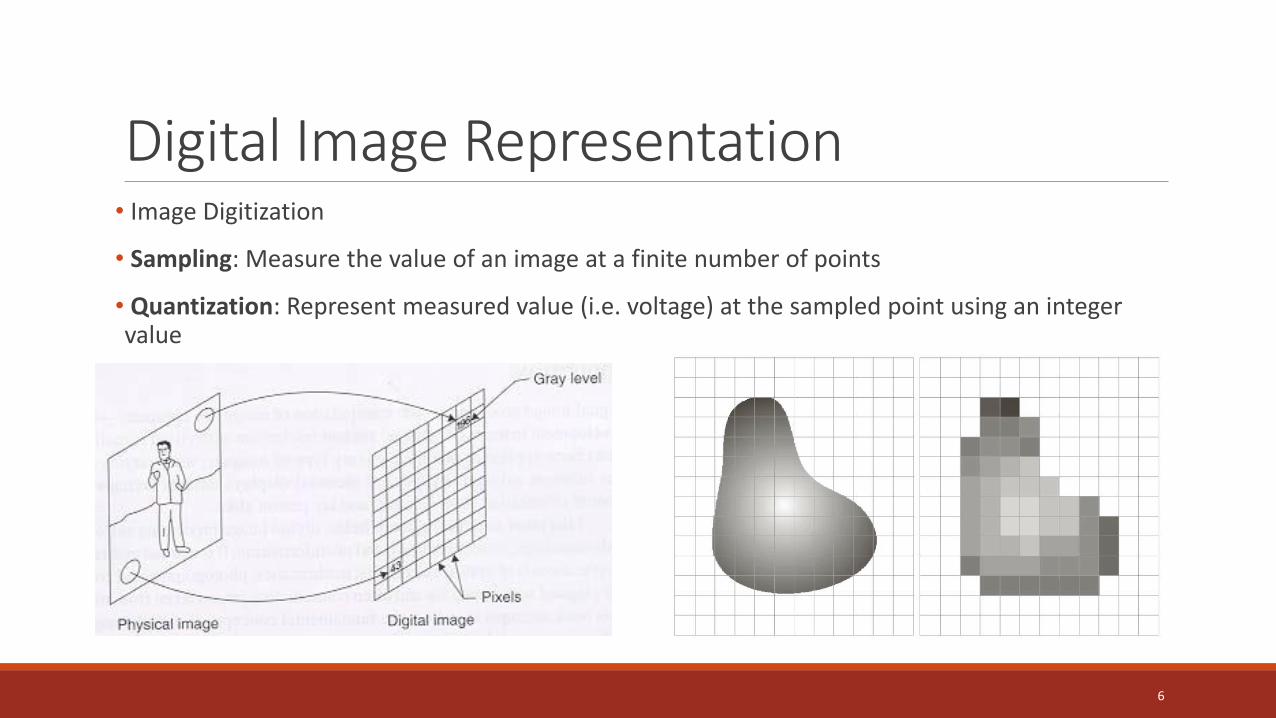
Digital Image Representation• Image Digitization
• Sampling: Measure the value of an image at a finite number of points
• Quantization: Represent measured value (i.e. voltage) at the sampled point using an integer value
6
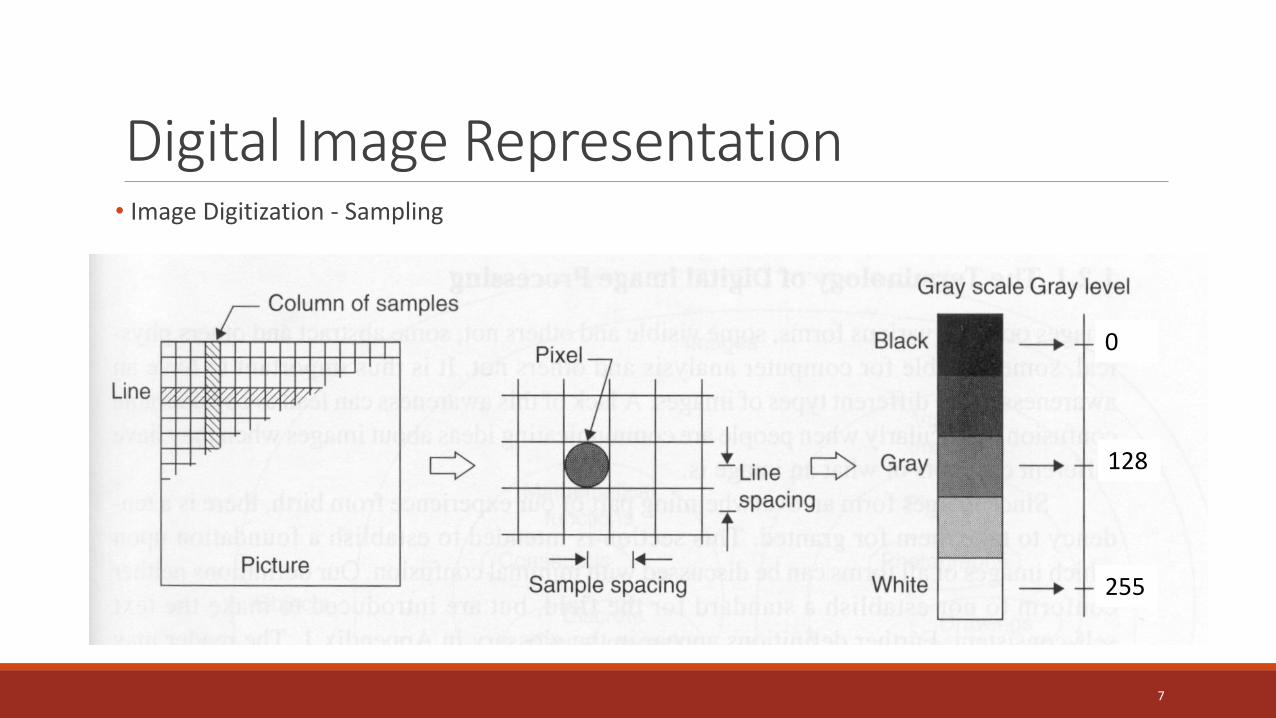
Digital Image Representation• Image Digitization - Sampling
7
0
255
128
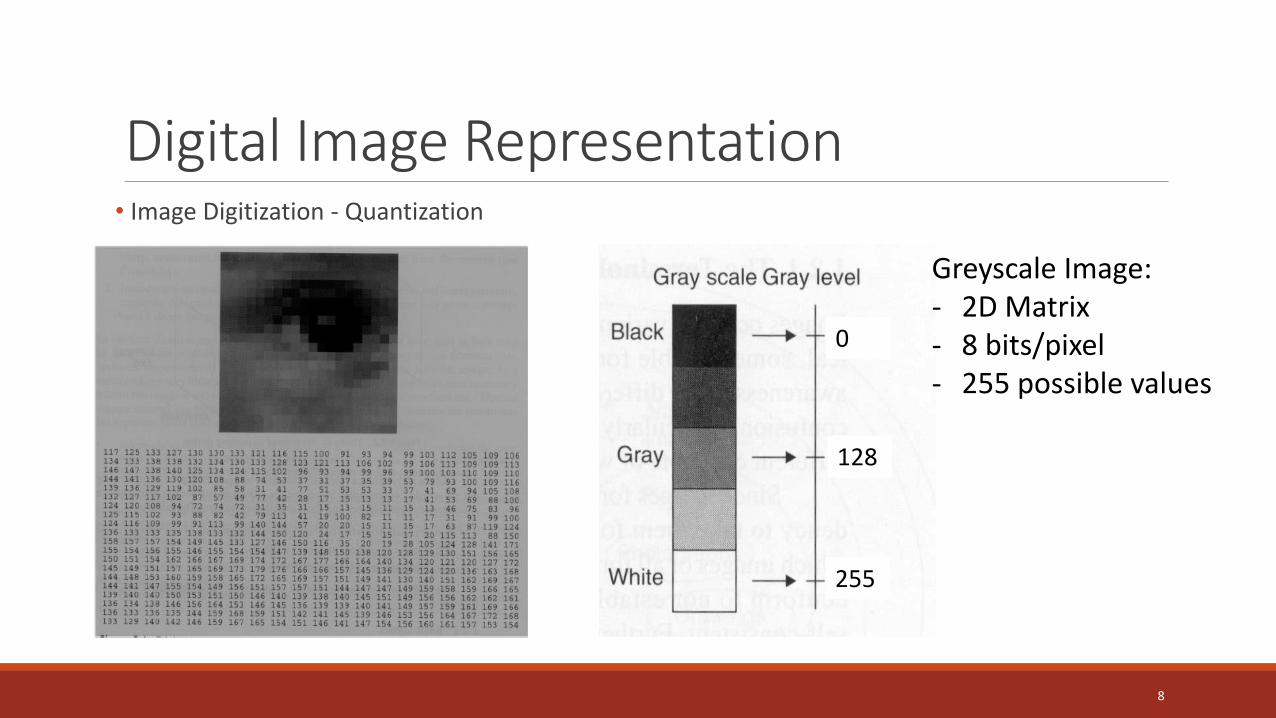
Digital Image Representation• Image Digitization - Quantization
8
0
128
255
Greyscale Image:- 2D Matrix- 8 bits/pixel- 255 possible values

Digital Image Representation• Digital images are a 2D rectilinear array of pixels (picture element)
• FIXED number of samples (pixels): NxM
9
N = M = 256 N = M = 30Sub Sample

Digital Image Representation• No continuous variables in digital images
• Quantization is represented by the number of bits per pixel
10
L = 2 (1 bit/pixel) = Binary L = 256 (8 bits/pixel) = GreyscaleL = 4 (2 bits/pixel) L = 16 (4 bits/pixel)
[ 0 0 ] = 0[ 0 1 ] = 1[ 1 0 ] = 2[ 1 1 ] = 3
[ 0 0 0 0 ][ 0 0 0 1 ]. . . . . . .
[ 1 1 1 1 ]
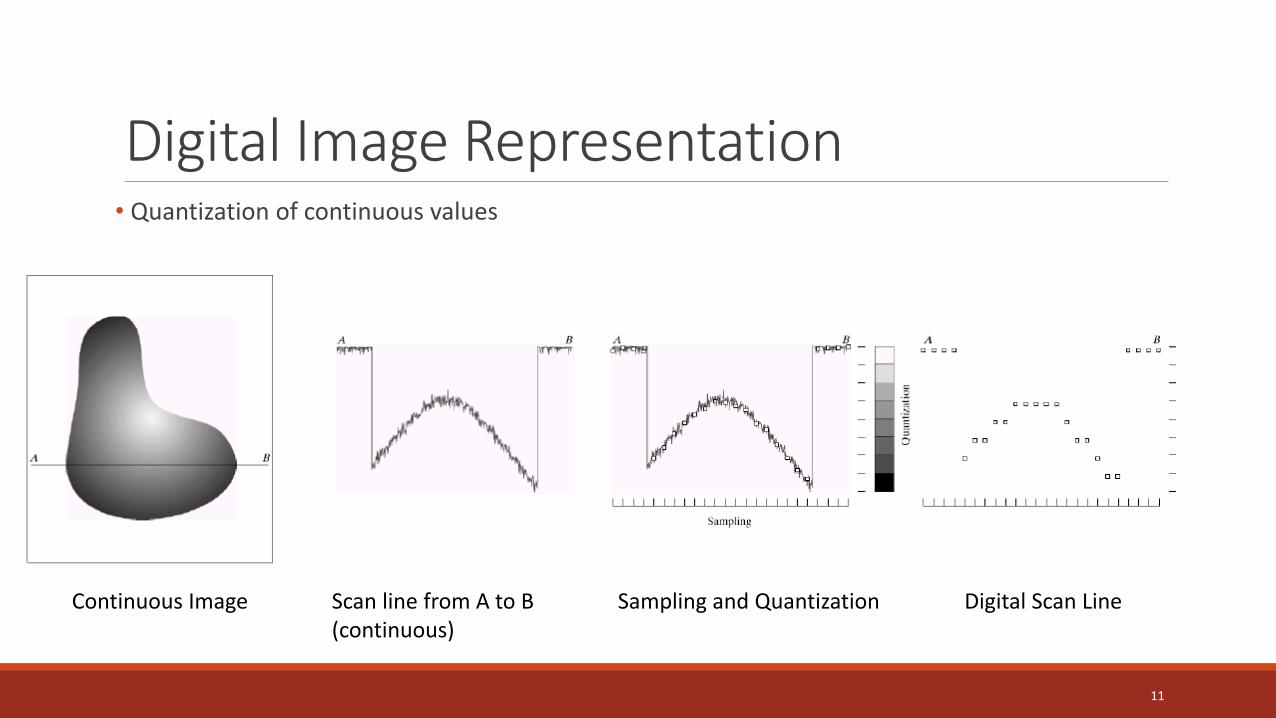
Digital Image Representation• Quantization of continuous values
11
Continuous Image Scan line from A to B(continuous)
Sampling and Quantization Digital Scan Line

Digital Image Representation• Uniform Sampling: Digitized in spatial domain (𝐼𝑀𝑥𝑁)
• M and N are usually integer powers of two
• Nyquist theorem and Aliasing…
• Non-Uniform sampling• Spatial Communication
• Taking signal samples at instants of “importance”
12

Digital Image RepresentationImage Sampling
13
Original ImageSampled byfactor of 2
Sampled byfactor of 4
Sampled byfactor of 8

Digital Image Representation• Image Decimation and Interpolation
• Decimation is the reduction in dimension or resolution of the image (subsampling)• Decimation of 2, results in half the size of the original image
• Simplest method is skipping of every other pixel
• Interpolation is the increase in dimension or resolution of the image by averaging or other mathematical operations• Interpolation of 2, results in double the resolution of the original image
• Simplest method is the duplication of pixels
• More complicated method is to take the average of neighboring pixels and inserting
14

Digital Image Representation• Image Pyramids
• Represent NxN images as a “Pyramid” of 1x1, 2x2, 4x4, … , NxN images (𝑁 = 2𝑘)
• Also known as a “Gaussian Pyramid” or a “Mip Map”
15

Digital Image Representation• Effect of Sampling
• Simple example: a sine wave
16

Digital Image Representation• Under-sampling
• What if we “missed” things between samples?
• Example: Under-sampling a sine wave• Result: Information is lost
17

Digital Image Representation• Under-sampling
• What if we “missed” things between samples?
• Example: Under-sampling a sine wave• Result: Information is lost
• Bigger problem: Indistinguishable from lower frequencies:
18

Digital Image Representation• Under-sampling
• What if we “missed” things between samples?
• Example: Under-sampling a sine wave• Result: Information is lost
• Bigger problem: Indistinguishable from lower frequencies
• Always indistinguishable from higher frequencies…
19

Digital Image Representation
20
Input Signal: Plot as Image:
AliasNot Enough Samples!

Digital Image Representation• What can we do about aliasing?
• Sample more often• Join the Mega-Pixel enhancement of the photo industry … (8K TVs, etc )
• But this can’t go on forever
• Make the signal less wiggly• Get rid of some high frequencies
• Will still lose information, but we can be selective
• Still better than aliasing
21
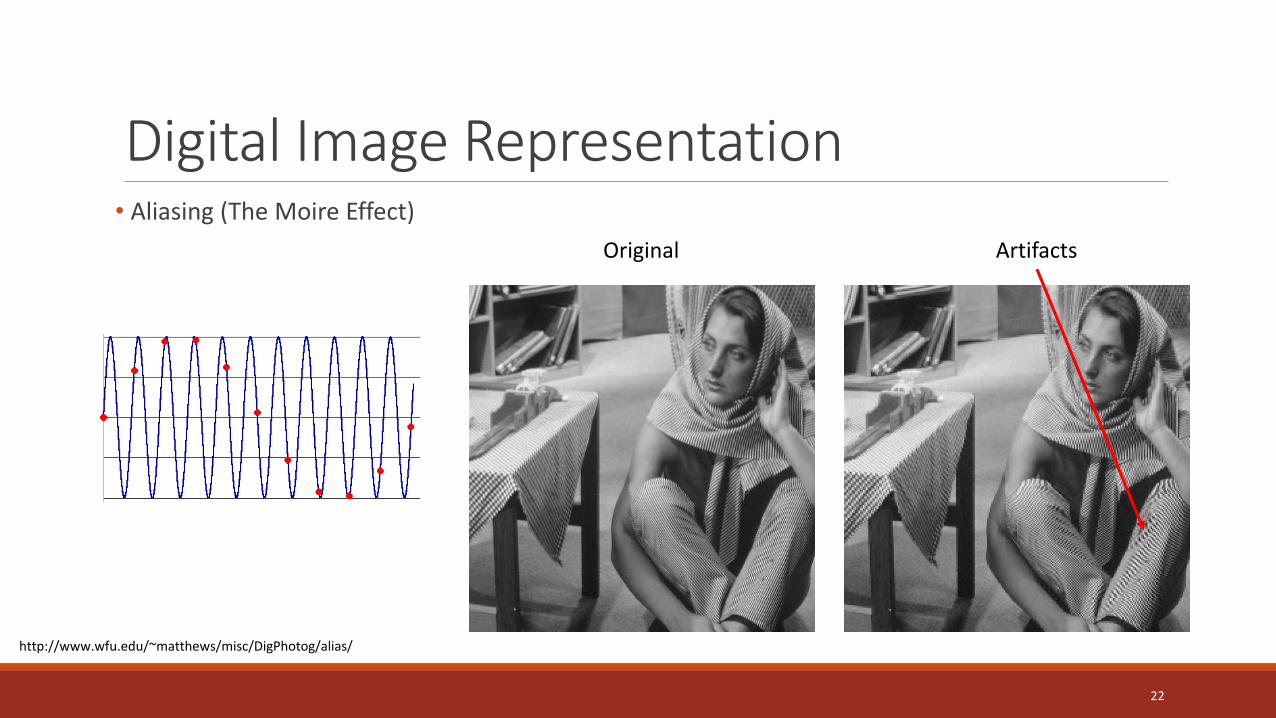
Digital Image Representation• Aliasing (The Moire Effect)
22
ArtifactsOriginal
http://www.wfu.edu/~matthews/misc/DigPhotog/alias/
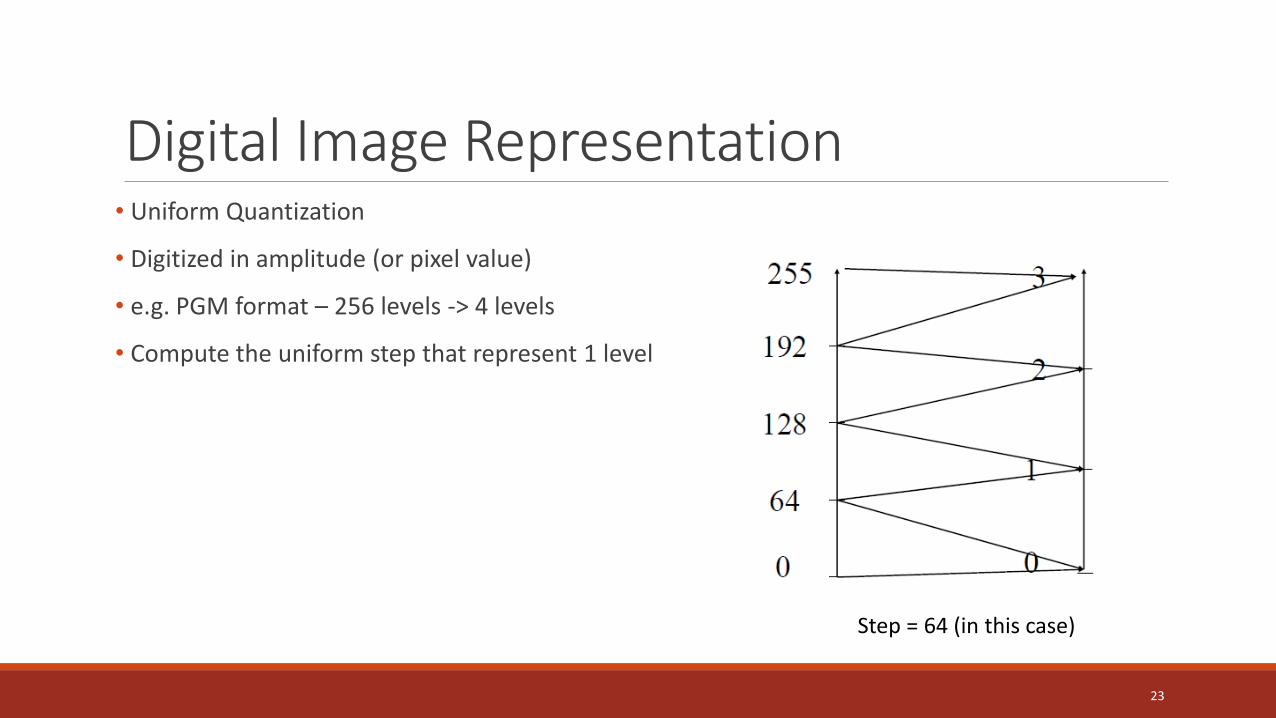
Digital Image Representation• Uniform Quantization
• Digitized in amplitude (or pixel value)
• e.g. PGM format – 256 levels -> 4 levels
• Compute the uniform step that represent 1 level
23
Step = 64 (in this case)

Digital Image Representation
24
256 gray levels (8 bits/pixel) 32 gray levels (5 bits/pixel) 16 gray levels (4 bits/pixel)
8 gray levels (3 bits/pixel) 4 gray levels (2 bits/pixel) 2 gray levels (1 bit/pixel)

Digital Image Representation• The real world has High Dynamic Range (HDR)
• Uniform sampling is not optimal, especially with complex scenes
• Typical HDR methods combine multiple standard images with varying luminance
25

Color Image Processing• Color Images• Simplified object extraction and identification
• Human vision: ~10 million of distinguishable colors
• Digital representation: 16 million possible colors
• Color spectrum• White light with a prism (1666, Newton)
26
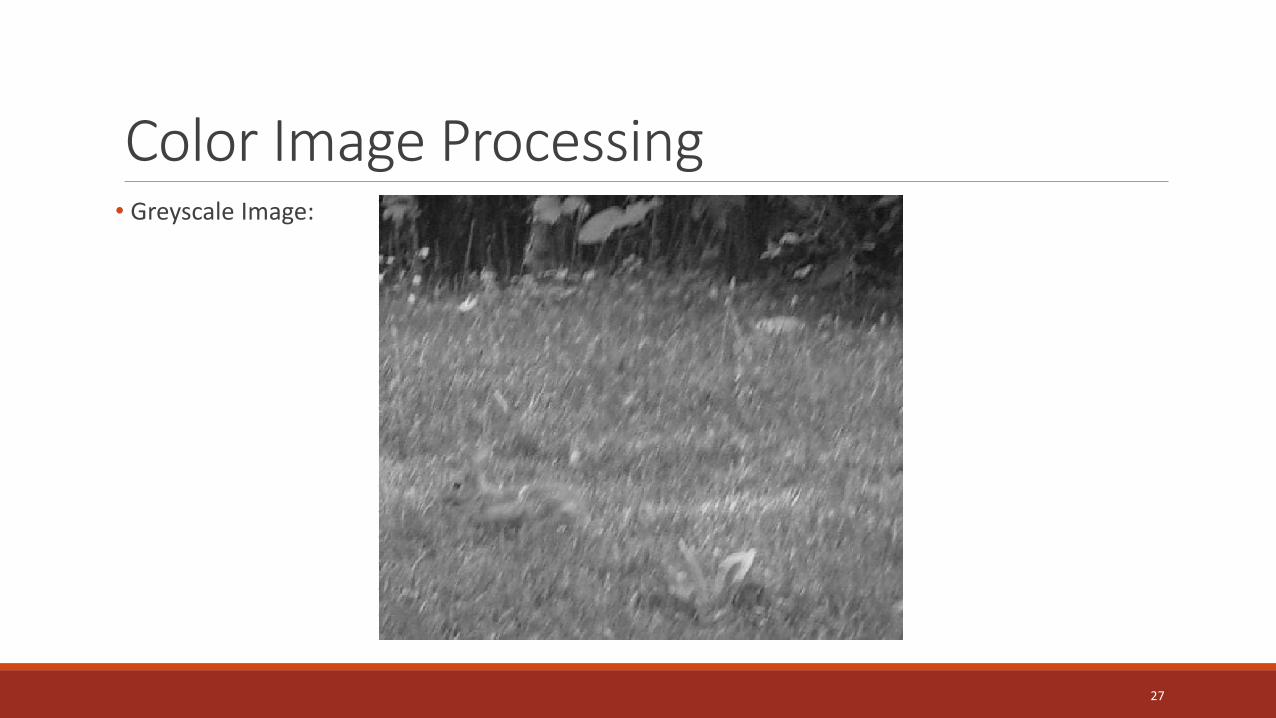
Color Image Processing• Greyscale Image:
27

Color Image Processing• Color Image:
28

Color Image Processing• Mini-physics review: What is light?
• The visible portion of the electromagnetic (EM) spectrum
• It occurs between wavelength of approximately 400 – 700 nanometers
29
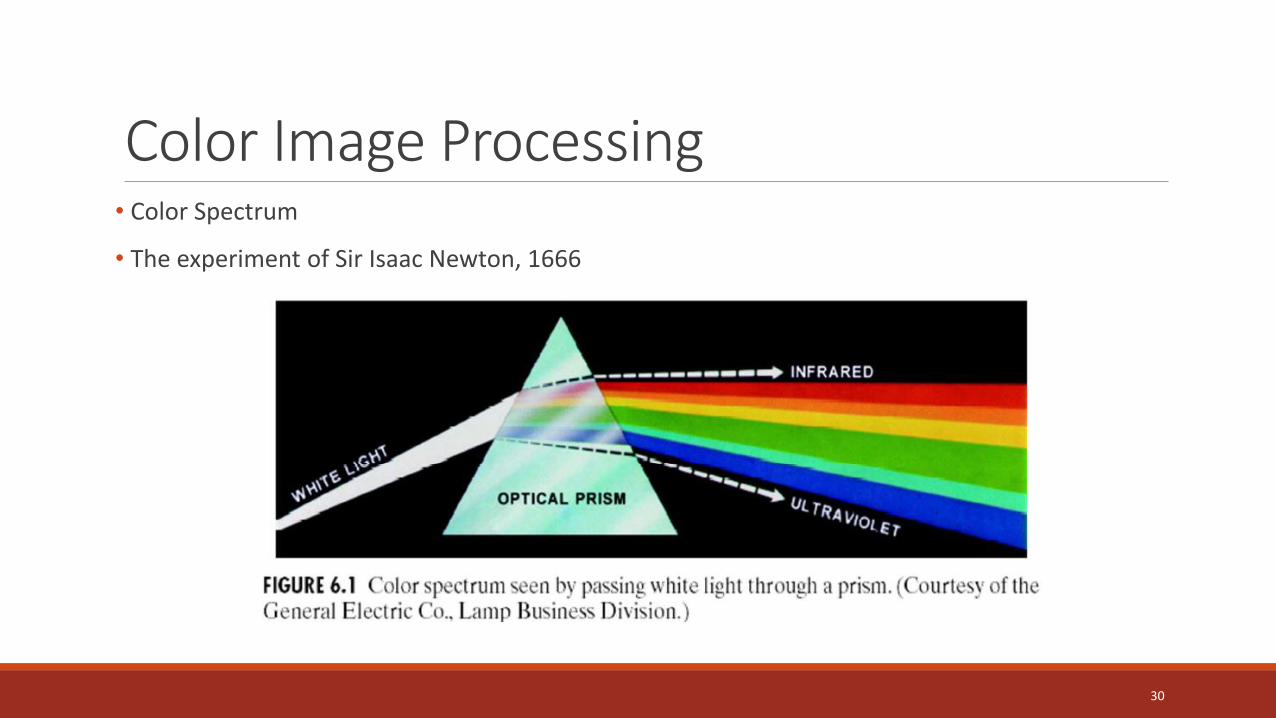
Color Image Processing• Color Spectrum
• The experiment of Sir Isaac Newton, 1666
30

Color Image Processing• Color Spaces
• How can we represent color?
31

Color Image Processing• Human Eye
• Three different types of cones. Each cone has a special pigment making it sensitive to specific ranges of wavelengths:• Short (S) corresponds to blue
• Medium (M) corresponds to green
• Long (L) corresponds to red
• Ratio of L to M to S cones:• Approximately 10:5:1
• Approximately 6 million cones
32

Color Image Processing• Color representation is based on the theory of T. Young (1802) which states that any color can be produced by mixing three primary colors 𝐶1, 𝐶2, 𝐶3:
• It is therefore possible to characterize a psycho-visual color by specifying the amounts of three primary colors: red, green, and blue, mixed together
• This leads to the standard RGB space used in television, computer monitors, LED screens, etc
33
𝐶 = 𝑎𝐶1 + 𝑏𝐶2 + 𝑐𝐶3

Color Image Processing• Color Fundamentals
• Standard wavelengths for the primary colors:
34

Color Image Processing• Color Fundamentals
• Tri-Stimulus values: The amount of red, green, and blue needed to form any particular color
• Denoted by X, Y, Z
• Tri-chromatic coefficient
35
𝑥 =𝑋
𝑋 + 𝑌 + 𝑍𝑦 =
𝑌
𝑋 + 𝑌 + 𝑍𝑧 =
𝑍
𝑋 + 𝑌 + 𝑍
𝑥 + 𝑦 + 𝑧 = 1

Color Image Processing• Color Fundamentals
• Any patch of light can be completely described physically by its spectrum: the number of photons (per time unit) at each wavelength (400-700 nm)
36
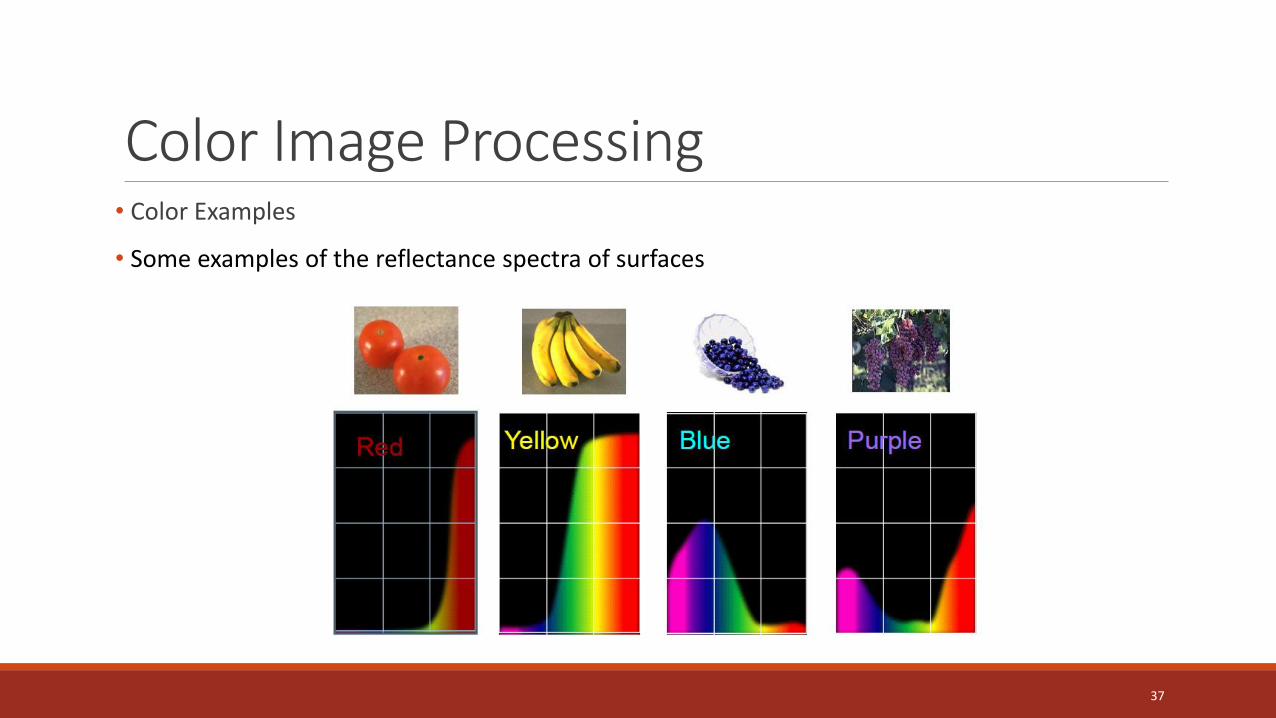
Color Image Processing• Color Examples
• Some examples of the reflectance spectra of surfaces
37

Color Image Processing• Tetrachromatism – 4 independent color channels
• Most birds and many other animals have cones for ultraviolet light
• Some humans, mostly female, also have slight tetrachromatism
38
Bird Cone Responses

Color Image Processing• More spectra examples:
39
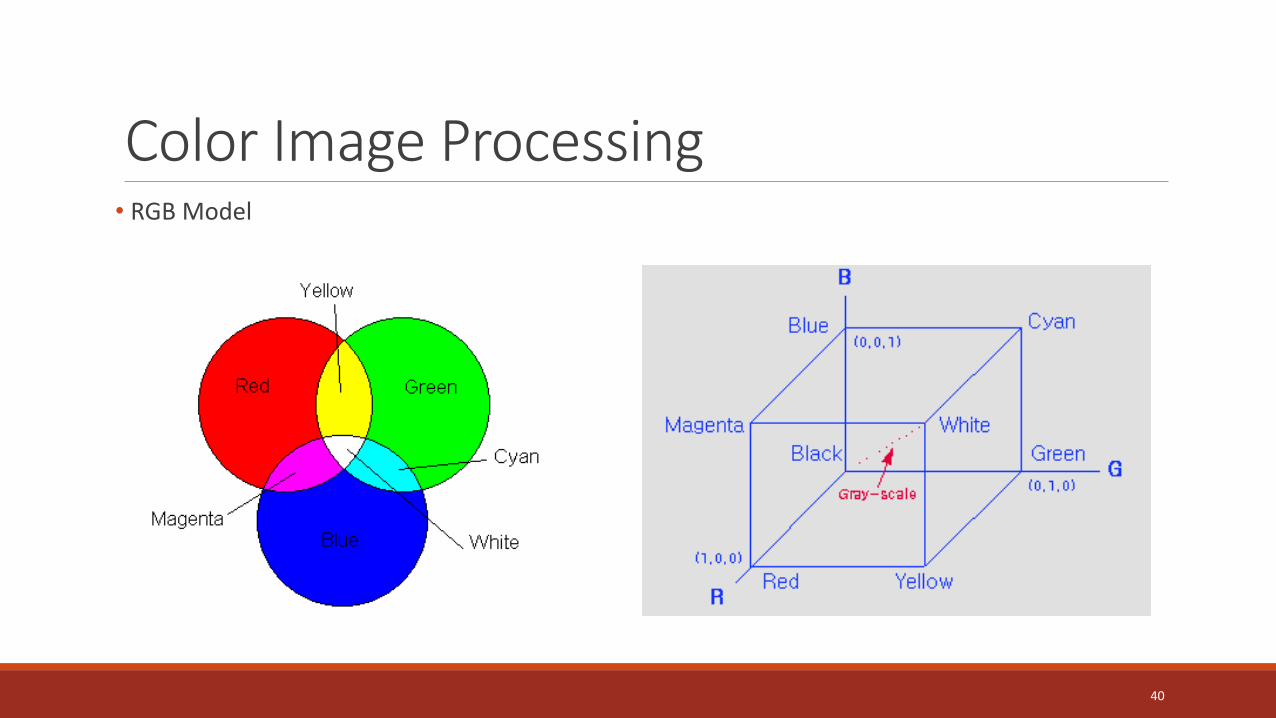
Color Image Processing• RGB Model
40

Color Image Processing• Usually we specify the levels of R, G, and B in the range [0, 255]
• 8 bits, per pixel, per channel.
41
(256)3= 16,777,216 𝐶𝑜𝑙𝑜𝑟𝑠
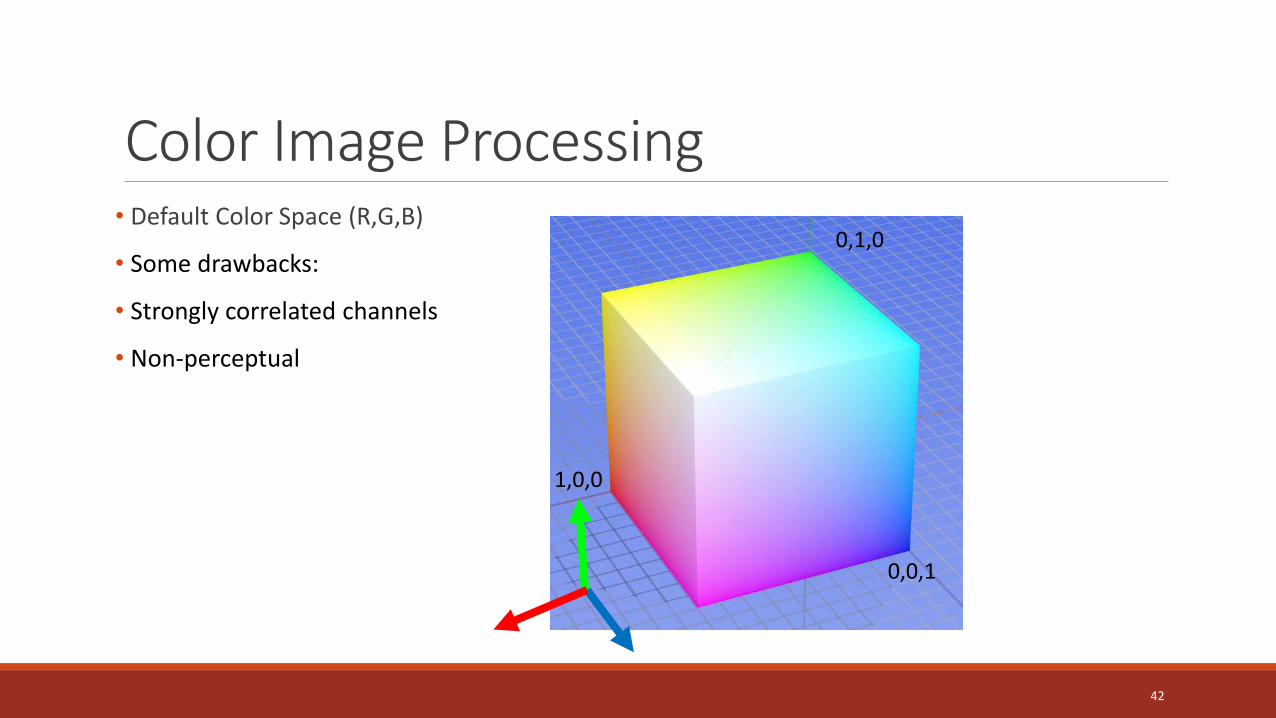
Color Image Processing• Default Color Space (R,G,B)
• Some drawbacks:
• Strongly correlated channels
• Non-perceptual
42
1,0,0
0,1,0
0,0,1
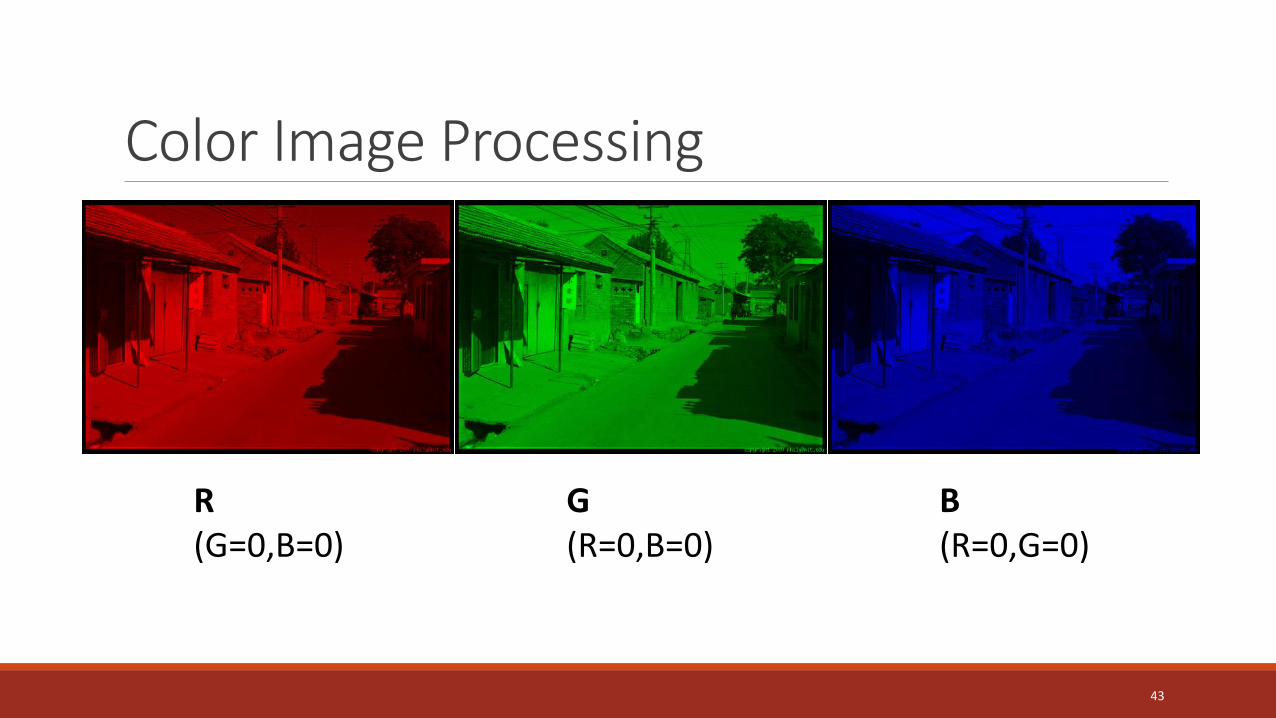
Color Image Processing
43
R(G=0,B=0)
G(R=0,B=0)
B(R=0,G=0)
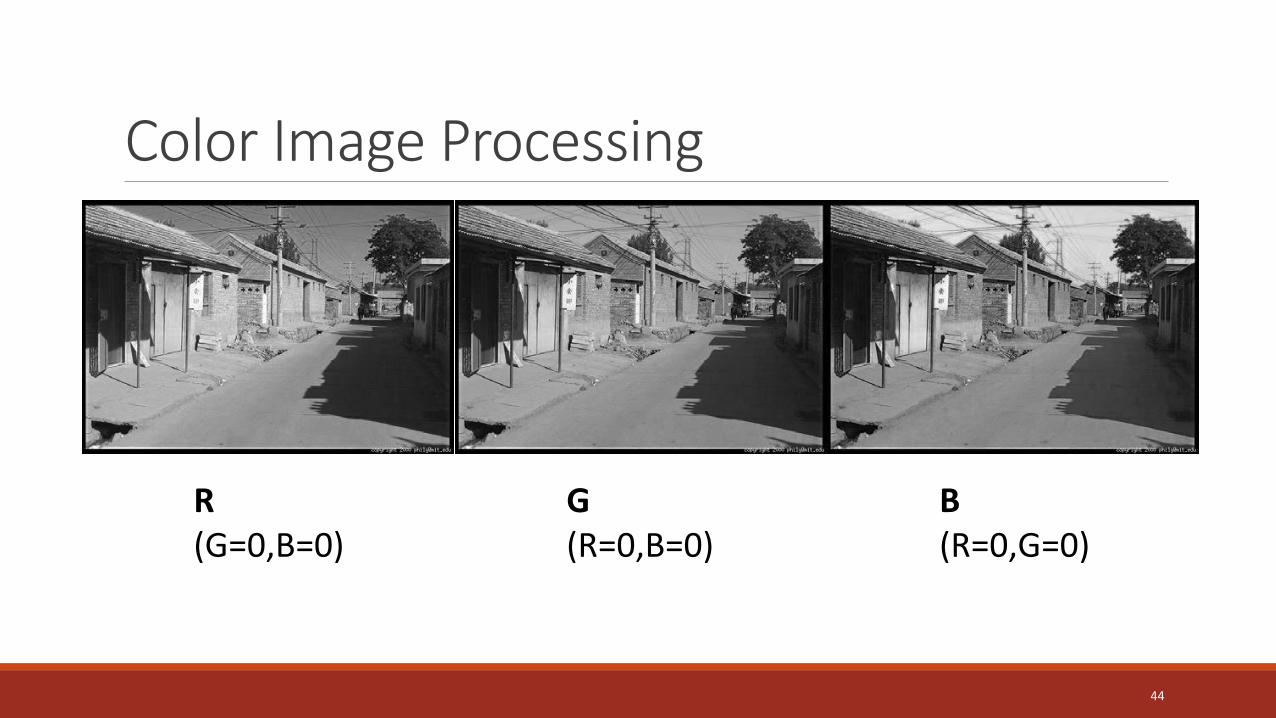
Color Image Processing
44
R(G=0,B=0)
G(R=0,B=0)
B(R=0,G=0)

Color Image Processing
45
R G B

Color Image Processing• Alternate color spaces
• Various color representations can be used other than RGB
• This can be done for:• De-correlating the color channels e.g. principal component
• Separating color information from lighting:• Hue, Saturation, Value
46
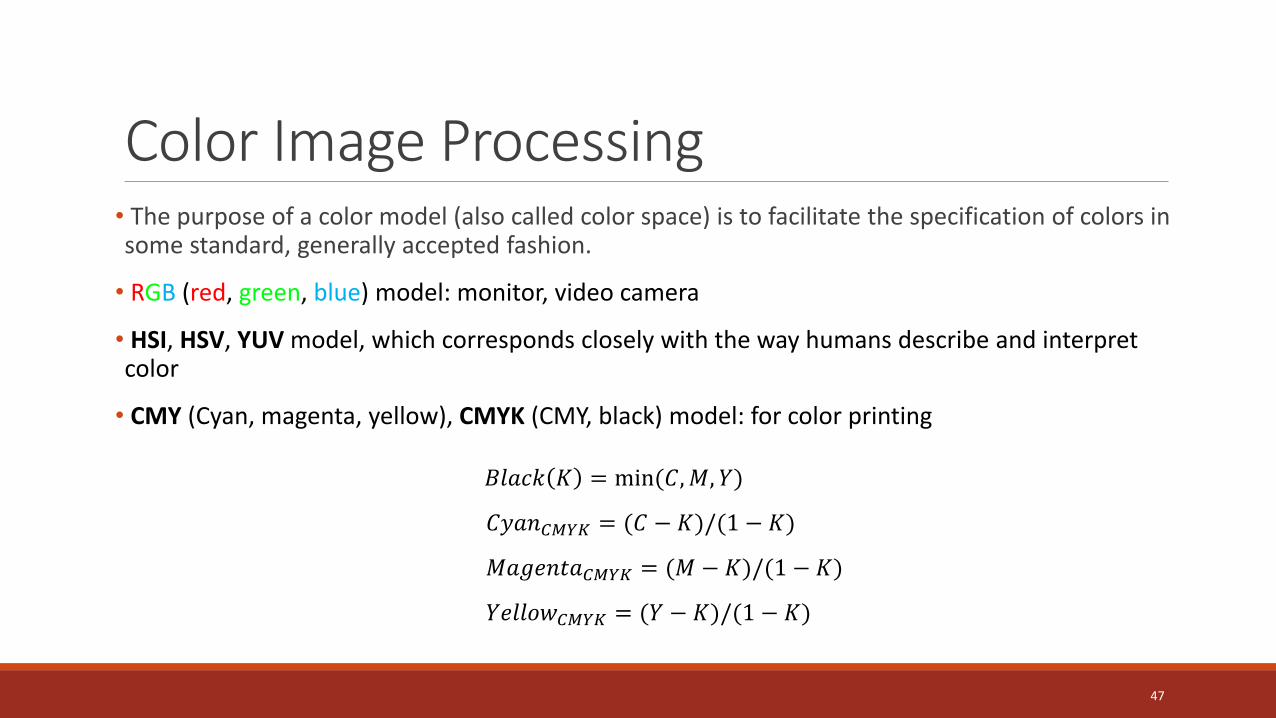
Color Image Processing• The purpose of a color model (also called color space) is to facilitate the specification of colors in some standard, generally accepted fashion.
• RGB (red, green, blue) model: monitor, video camera
• HSI, HSV, YUV model, which corresponds closely with the way humans describe and interpret color
• CMY (Cyan, magenta, yellow), CMYK (CMY, black) model: for color printing
47
𝐵𝑙𝑎𝑐𝑘 𝐾 = min(𝐶,𝑀, 𝑌)
𝐶𝑦𝑎𝑛𝐶𝑀𝑌𝐾 = (𝐶 − 𝐾)/(1 − 𝐾)
𝑀𝑎𝑔𝑒𝑛𝑡𝑎𝐶𝑀𝑌𝐾 = (𝑀 − 𝐾)/(1 − 𝐾)
𝑌𝑒𝑙𝑙𝑜𝑤𝐶𝑀𝑌𝐾 = (𝑌 − 𝐾)/(1 − 𝐾)
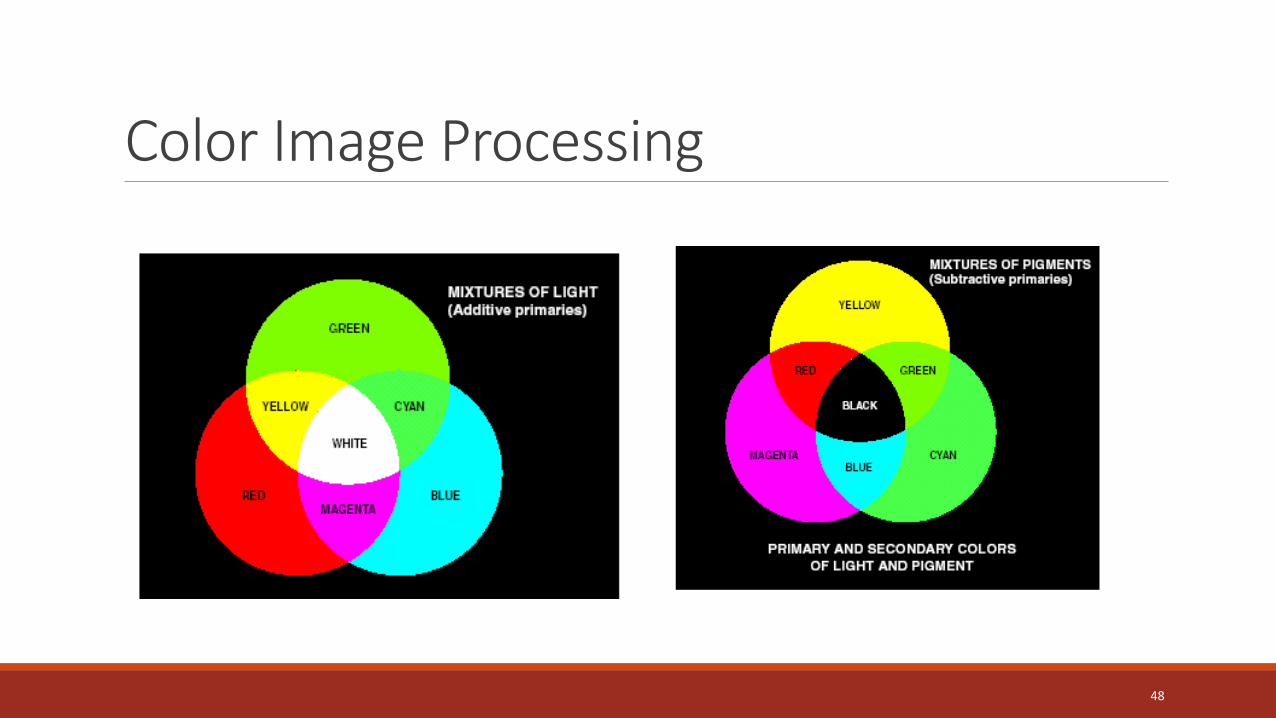
Color Image Processing
48

Color Image Processing• The characteristics generally used to distinguish one color from another are Brightness, Hue, and Saturation• Hue: Represents dominant color as perceived by an observer
• Saturation: Relative purity or the amount of white light mixed with the hue
• Brightness: Amount of total light present
• Hue and Saturation taken together are called Chromaticity and therefore a color may characterized by its Brightness and Chromaticity
49

Color Image Processing• HSI Model: Hue and Saturation
50

Color Image Processing• HSI Model
• Hue corresponds to color, Saturation corresponds to the amount of white in color, and Intensity is related to brightness.
• For Example: a deep, bright orange color would have a large intensity (bright), a hue of “orange”, a high value of saturation (deep).
• In terms of RGB components, this “Orange” color would have the values as R=245, G=110, and B= 20
51

Color Image Processing• HSV Model: Hue, Saturation, Value
52
RGB HSV
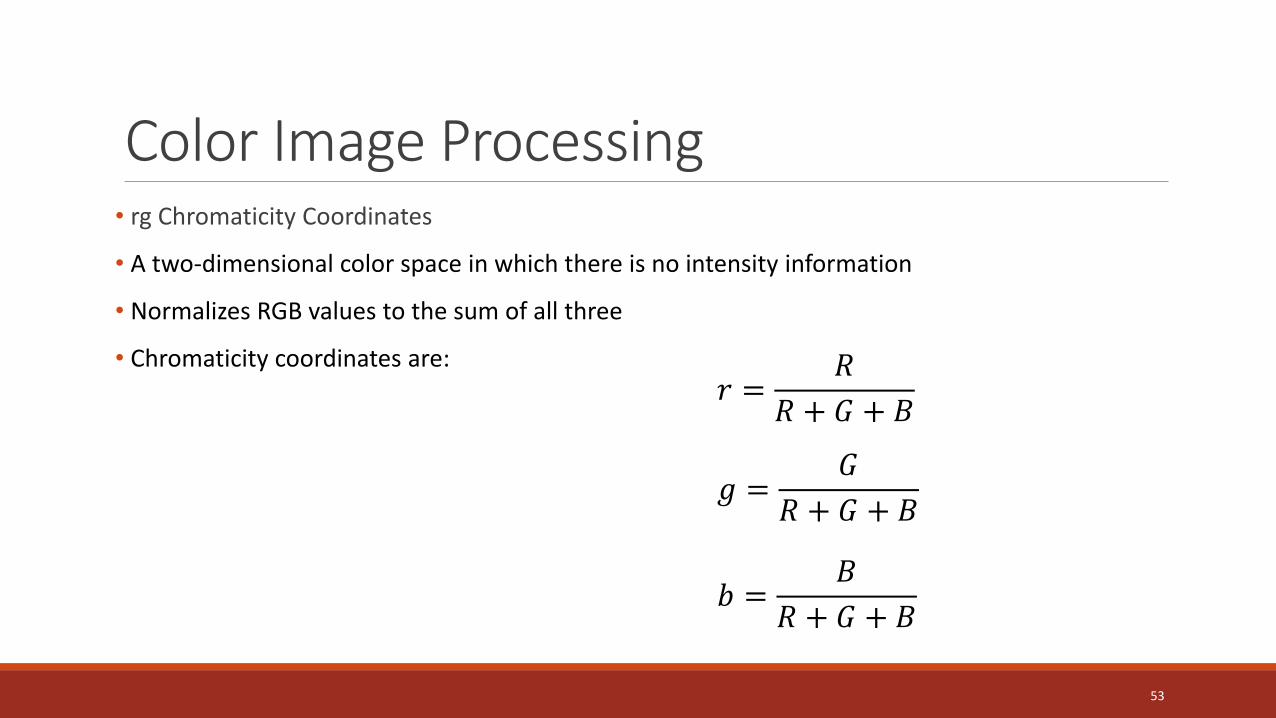
Color Image Processing• rg Chromaticity Coordinates
• A two-dimensional color space in which there is no intensity information
• Normalizes RGB values to the sum of all three
• Chromaticity coordinates are:
53
𝑟 =𝑅
𝑅 + 𝐺 + 𝐵
𝑔 =𝐺
𝑅 + 𝐺 + 𝐵
𝑏 =𝐵
𝑅 + 𝐺 + 𝐵
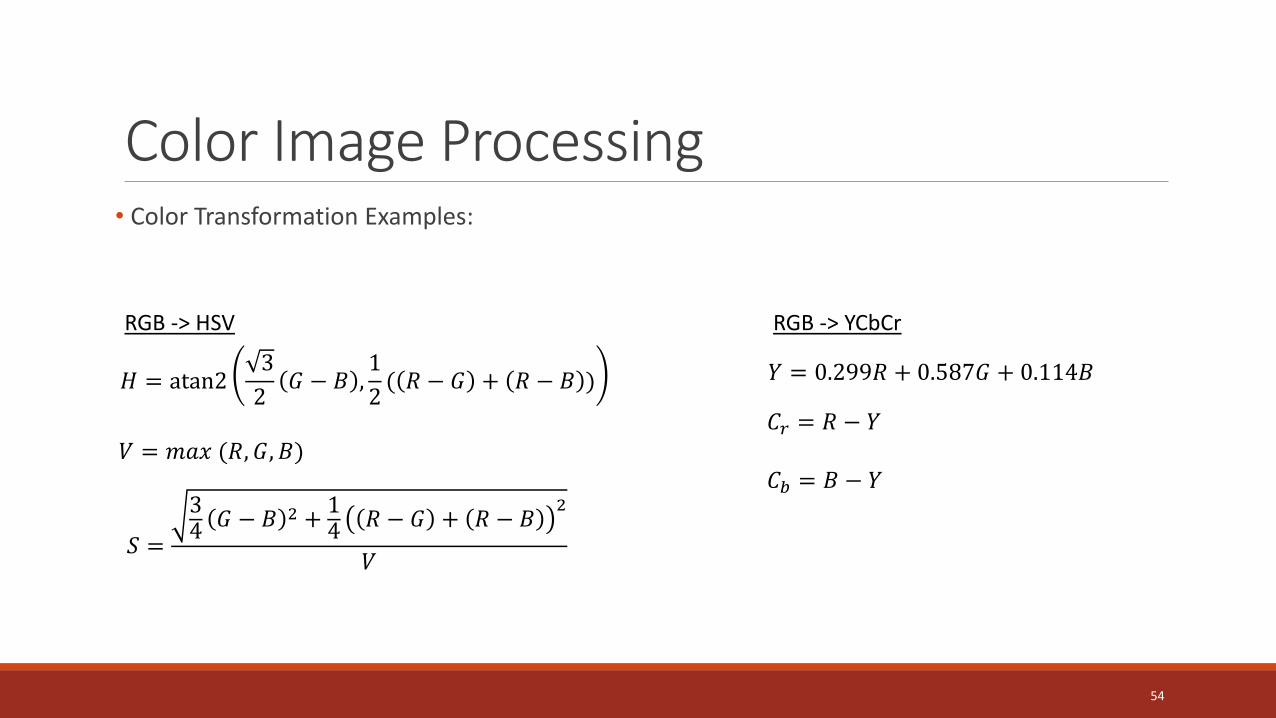
Color Image Processing• Color Transformation Examples:
54
𝐻 = atan23
2𝐺 − 𝐵 ,
1
2( 𝑅 − 𝐺 + 𝑅 − 𝐵 )
𝑆 =
34𝐺 − 𝐵 2 +
14
𝑅 − 𝐺 + 𝑅 − 𝐵2
𝑉
𝑉 = 𝑚𝑎𝑥 (𝑅, 𝐺, 𝐵)
𝑌 = 0.299𝑅 + 0.587𝐺 + 0.114𝐵
𝐶𝑟 = 𝑅 − 𝑌
𝐶𝑏 = 𝐵 − 𝑌
RGB -> HSV RGB -> YCbCr

Color Image Processing• Color Transformation YCrCb
• Fast to compute, good for compression, used by TV
55
YCb=0.5Cr=0.5
CbY=0.5Cr=0.5
CrY=0.5Cb=0.5
Color Image Processing• Other Color Spaces:
• RGB (CIE), RnGnBn (TV - National Television Standard Committee)
• XYZ (CIE)
• YUV, YIQ, YCbCr
• YDbDr
• DSH, HSV, HLS, HIS
• Munsel color space (cylindrical representation)
• CIELuv
• etc….
56

Color Image Processing• Color Image: Full Description
57
Original Image

Color Image Processing• Intensity Image: Most Information, Simplest Representation
58
Only intensity shown, constant color

Color Image Processing• Scaled Color Image: Few Features
59
Only color shown, constant intensity

Color Image Processing• Color Tracking Example: Skin Color
60
RGB
r
g
rg
𝑟 =𝑅
𝑅 + 𝐺 + 𝐵𝑔 =
𝐺
𝑅 + 𝐺 + 𝐵𝑏 =
𝐵
𝑅 + 𝐺 + 𝐵

Color Image Processing• Color Tracking Example: Skin Color
61
M. Jones and J. Rehg, Statistical Color Models with Application to SkinDetection, International Journal of Computer Vision, 2002.

Image File Formats• GIF (Graphics Interchange Format)
• PNG (Portable Network Graphics)
• JPEG (Joint Photographic Experts Group)
• TIFF (Tagged Image File Format)
• PGM (Portable Gray Map)
• FITS (Flexible Image Transport System)
62
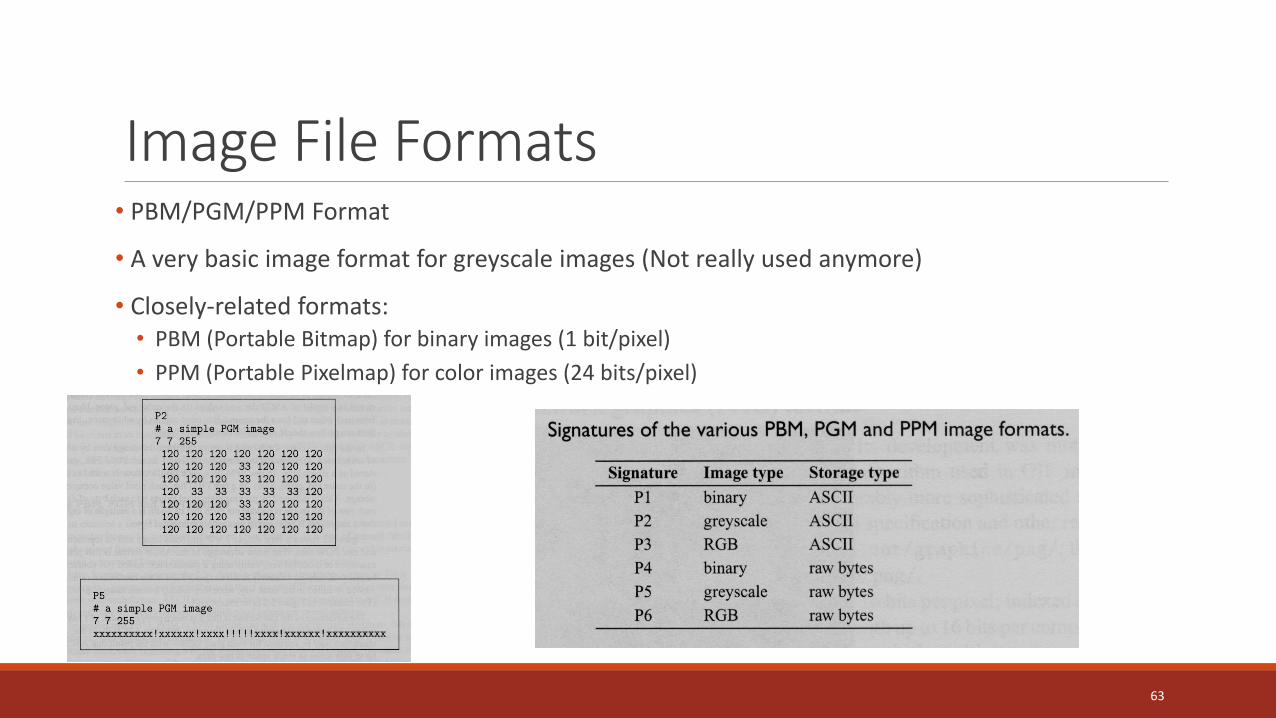
Image File Formats• PBM/PGM/PPM Format
• A very basic image format for greyscale images (Not really used anymore)
• Closely-related formats:• PBM (Portable Bitmap) for binary images (1 bit/pixel)
• PPM (Portable Pixelmap) for color images (24 bits/pixel)
63

Image File Formats• Images in Matlab
• Images represented as a matrix
• Suppose we have a NxM RGB images called “im”• im(1,1,1)=top-left pixel value in R-channel
• im (y, x, b) = y pixels down, x pixels to right in the bth channel
• im (N, M, 3) = bottom-right pixel in B-channel
• imread(filename) returns a uint8 image (values 0 to 255)• Convert to double format (values 0 to 1 if you need to scale)
64

Image File Formats• Images in Matlab
65

Image Representation• Mathematically, an image can be represented by a 2-D matrix
• Each entry (i,j) represents the value at the corresponding location, which is called a pixel
• The value of a pixel can be different types, depending on the image types• Unsigned char (8 bits per pixel or 256 levels)
• Int
• Float
• A vector (Color image, for example)
66

Image File Formats• Image file headers: A set of parameters found at the start of the file image and contains information regarding:• Number of rows (height)
• Number of columns (width)
• Number of bands
• Number of bits per pixel (bpp)
• File type
67