Embed Size (px)
Citation preview

Segmentation
Digital Image Processing

Topics
Introduction
Segmentation of Binary Images
Blob Coloring
Segmentation of Images with Multiple Gray Levels
Thresholding
Region Growing
Split and Merge
Texture-based Segmentation
Using Motion for Segmentation

Introduction
• Image segmentation is the process of partitioning
the digital image into multiple regions that can be
associated with the properties of one or more
objects
• It is an initial and vital step in pattern recognition-a
series of processes aimed at overall image
understanding.

Definition
In mathematical sense the segmentation of the
image I, which is a set of pixels, is partitioning I
into n disjoint sets R1,R2, . . . , Rn, called segments
or regions such that the union of all regions equals
I.
I =R1 U R2 U….. U Rn

Segmentation of Binary Images
Since binary images contain only black or white pixels,
segmenting objects from the background is trivial.
Separating objects from each other is based on the
neighborhood relationship of the pixels.

Blob Coloring
Blob coloring is applied to a binary image for segmenting and
labeling each object using a different color.
4-neighborhood or 8-neighborhood can be used for
segmentation
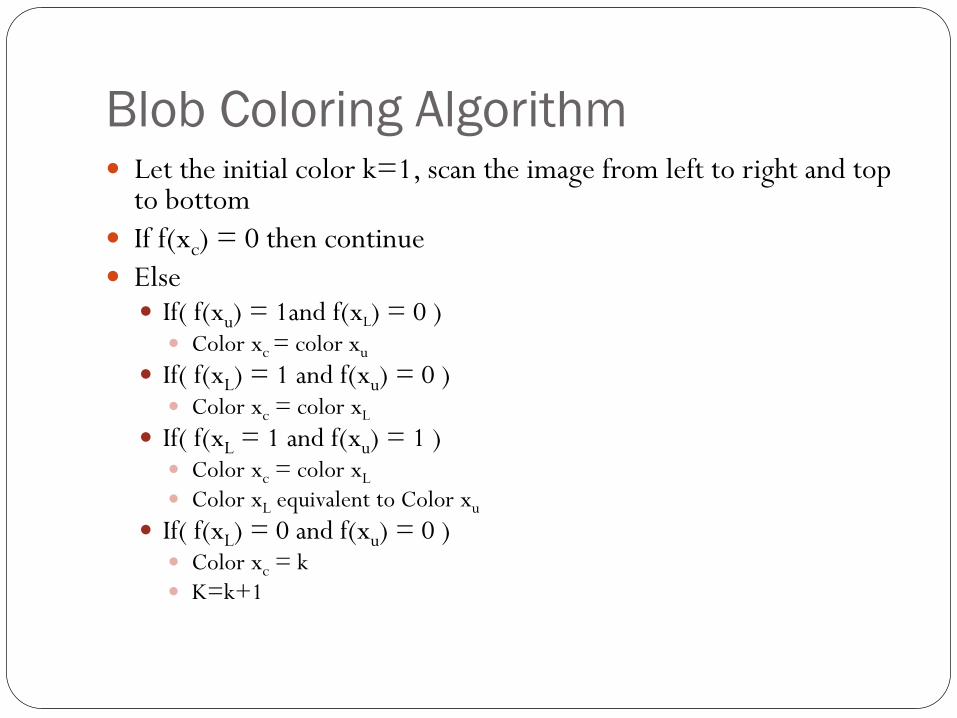
Blob Coloring Algorithm Let the initial color k=1, scan the image from left to right and top
to bottom
If f(xc) = 0 then continue
Else If( f(xu) = 1and f(xL) = 0 )
Color xc = color xu
If( f(xL) = 1 and f(xu) = 0 ) Color xc = color xL
If( f(xL = 1 and f(xu) = 1 ) Color xc = color xL
Color xL equivalent to Color xu
If( f(xL) = 0 and f(xu) = 0 ) Color xc = k
K=k+1

Segmentation by Thresholding
Thresholding: segment scalar images by creating a binary
partitioning of the image intensities.
All pixels with a value greater than a threshold value are
classified as pixels of the object and the others as the
background (or vice-versa)
Finding a suitable threshold value is not always simple

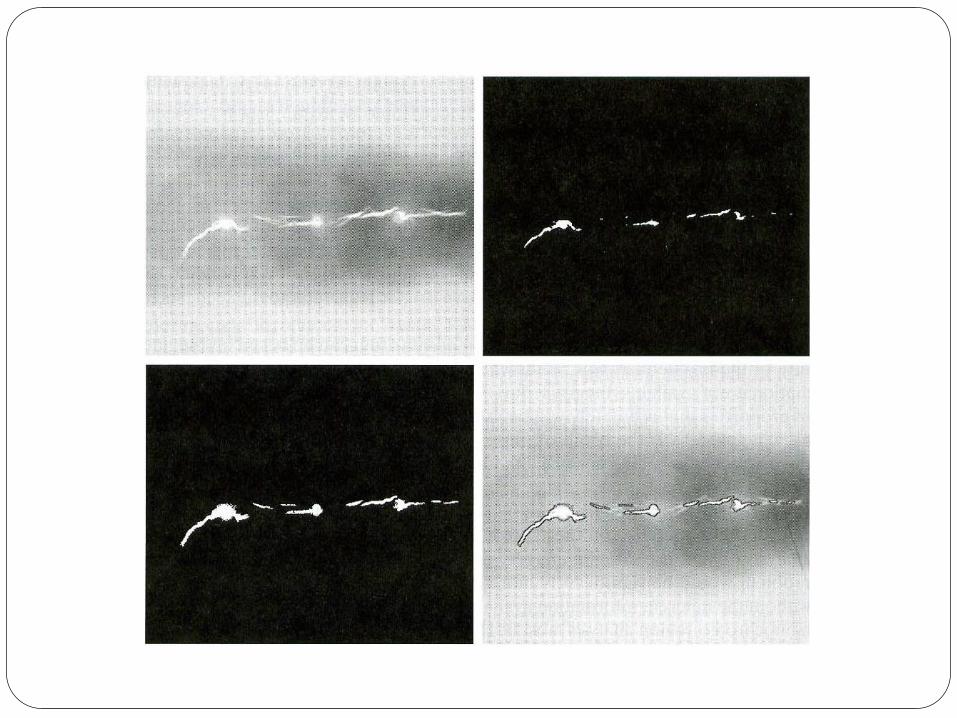
Using Histogram for Selecting the
Threshold Value

Example
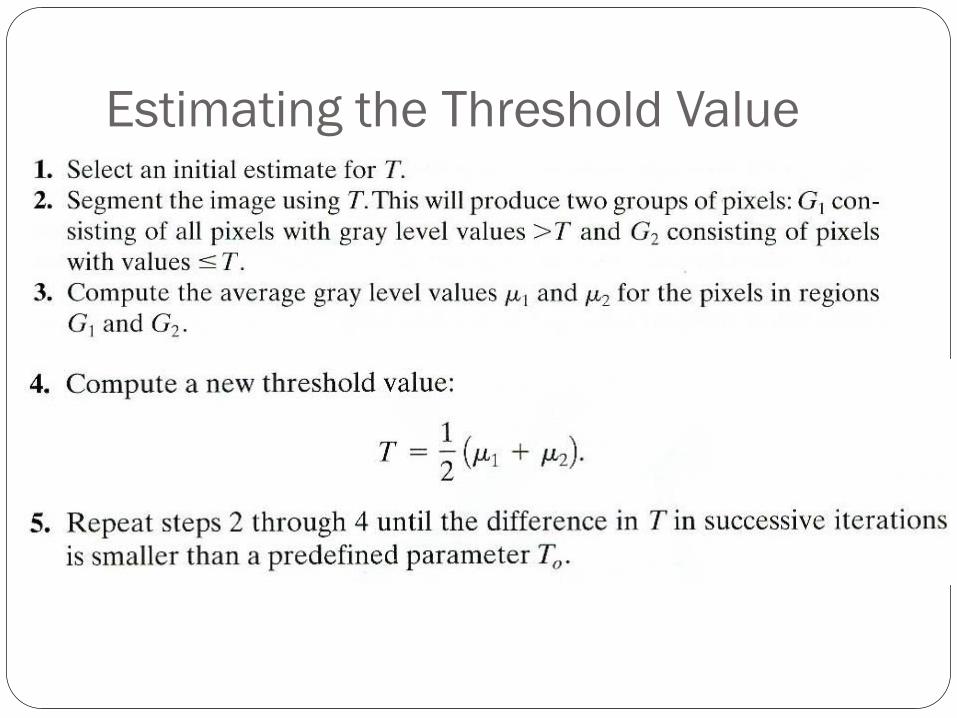
Estimating the Threshold Value

Adaptive Thresholding
A single (global) threshold value may not be available for all
images.
A local threshold can be found from the local processing of
the image.


Region Growing
Begins with a set of seed points and from them
grows regions by appending neighboring pixels
that have properties similar to initial seed.
Gray level, texture, color, and other local features
are used for measuring the similarity
Region Growing Problems
Selecting initial seed
Selecting suitable properties for including points
Example: In military applications using infra red images, the
target of interest is slightly hotter than its environment

Region Split and Merge Divide the image into a set of arbitrary disjoint regions.
Merge/split the regions
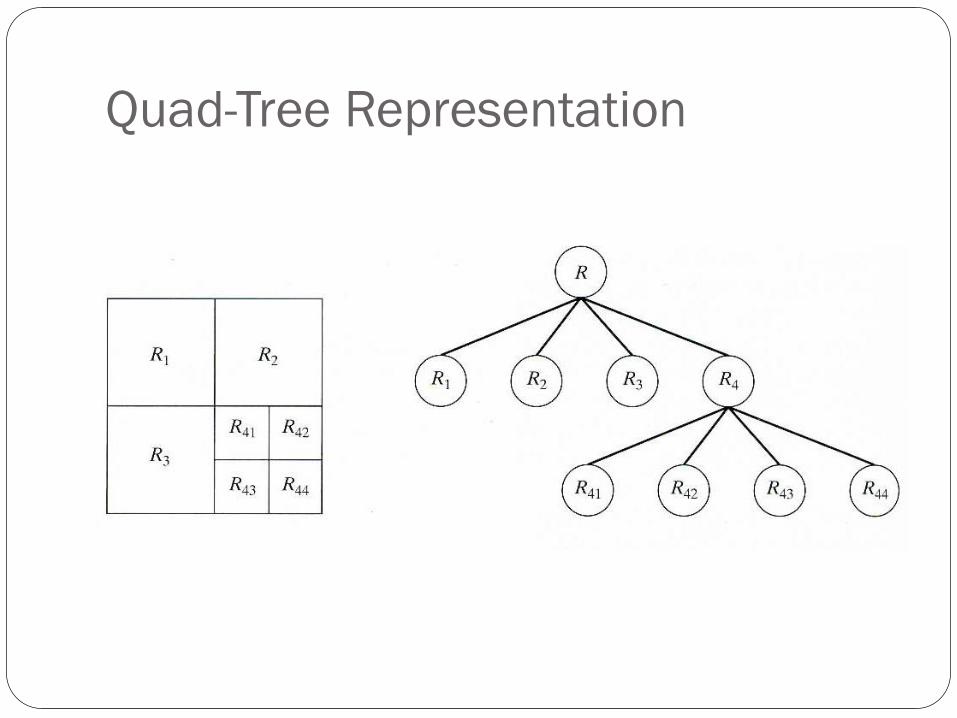
Quad-Tree Representation

Texture
Texture provides measures of properties such as smoothness,
coarseness, and regularity.

Texture Based Segmentation

Co-Occurance Matrix
Let P be a position operator, and A a k x k matrix.
aij shows the number of times that pixels with gray level zi
occur at position given by P relative to points with gray level
zj.
Matrix A is called co-occurance matrix and can provide
statistical properties of the texture.
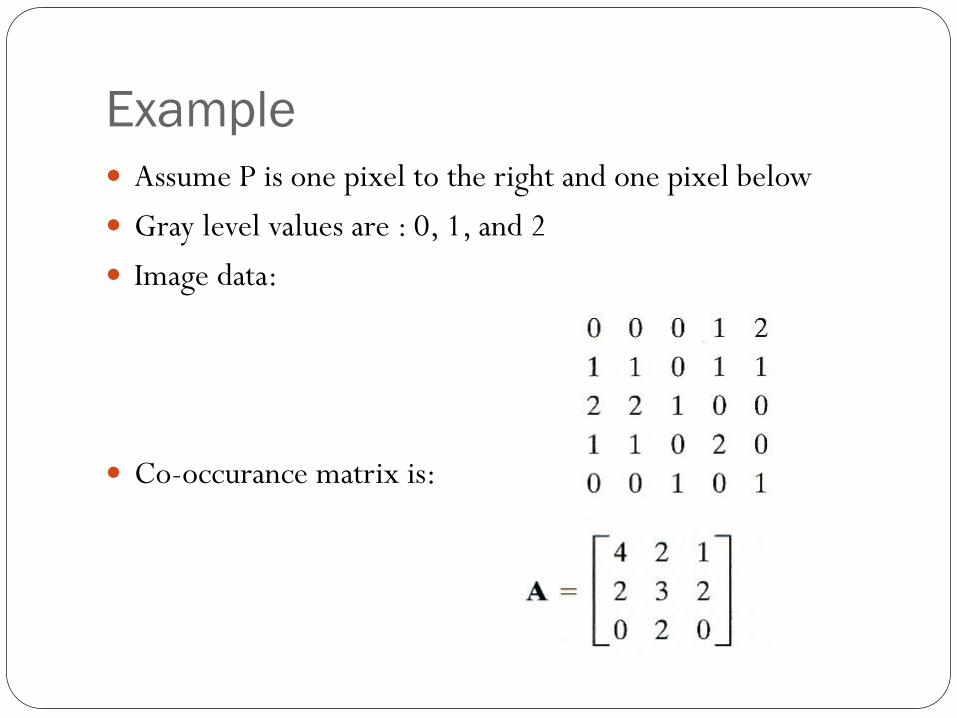
Example
Assume P is one pixel to the right and one pixel below
Gray level values are : 0, 1, and 2
Image data:
Co-occurance matrix is:

Statistical Moments of Texture Let Matrix C be formed by dividing every element of A by the number of point pairs
that satisfy P.
The following moments are defined to compare textures:

The Use of Motion in Segmentation Compare two image taken at times t1 and t2 pixel by pixel
(difference image)
Non-zero parts of the difference image corresponds to the
non-stationary objects
dij(x,y)= 1 if |f(x,y,t1) – f(x,y,t2)| > θ
0 otherwise

Accumulating Differences
A difference image may contain isolated entries that are the
result of the noise
Thresholded connectivity analysis can remove these points
Accumulating difference images can also remove the isolated
points

Questions?