Embed Size (px)
Citation preview

The 29th Annual ARRL and TAPR Digital Communications Conference
DSP Short CourseSession 3: How to use DSP
Rick Muething, KN6KB/AAA9WK
Half Time Recap
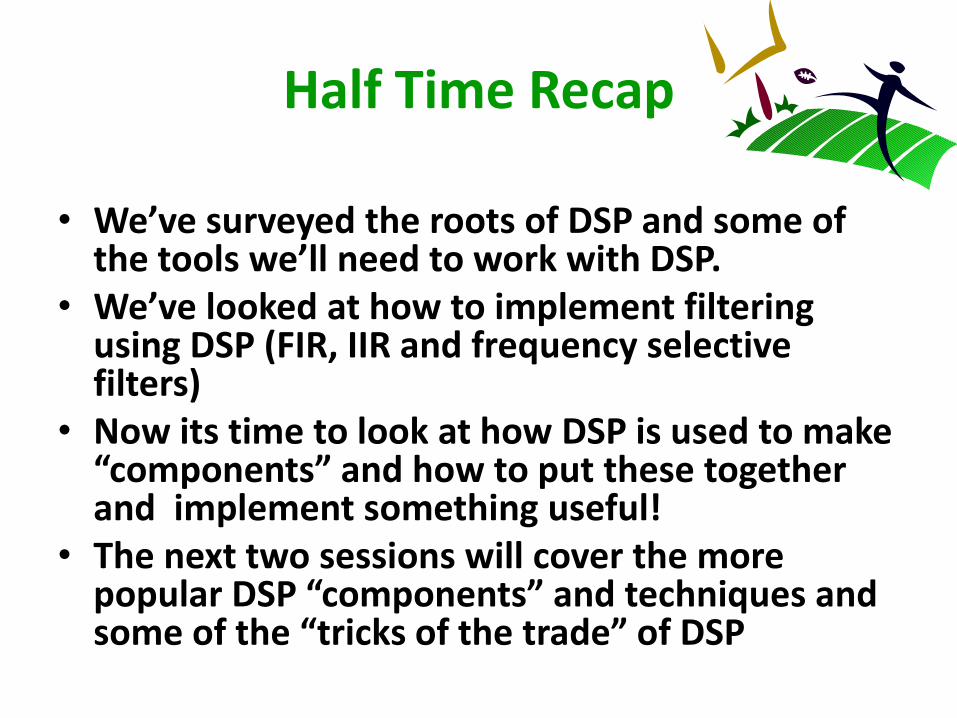
• We’ve surveyed the roots of DSP and some of the tools we’ll need to work with DSP.
• We’ve looked at how to implement filtering using DSP (FIR, IIR and frequency selective filters)
• Now its time to look at how DSP is used to make “components” and how to put these together and implement something useful!
• The next two sessions will cover the more popular DSP “components” and techniques and some of the “tricks of the trade” of DSP
Session 3 Overview
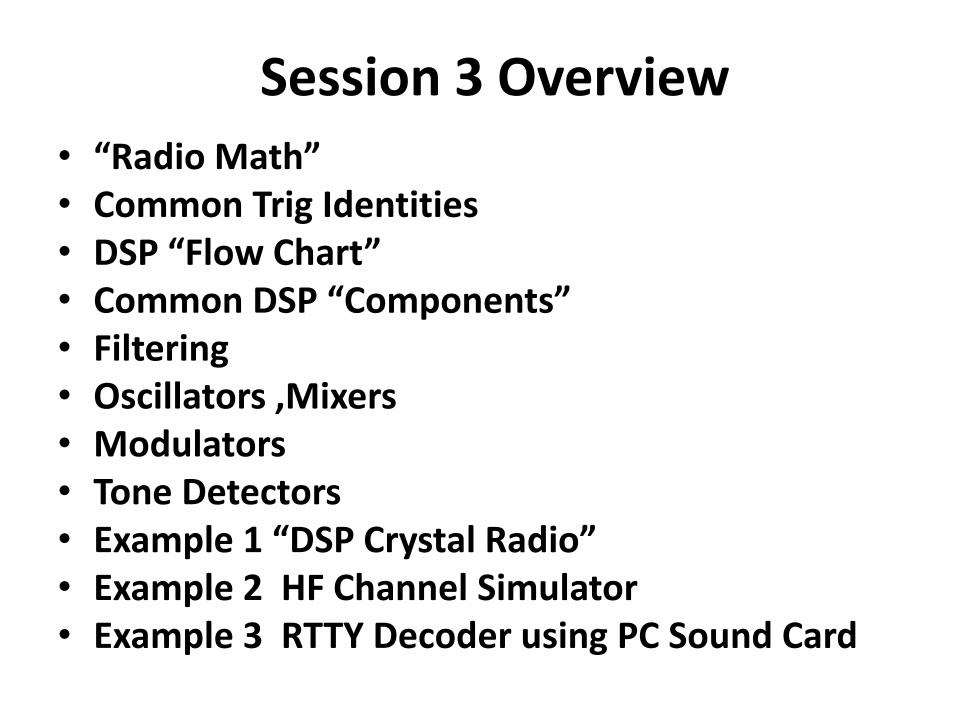
• “Radio Math”• Common Trig Identities• DSP “Flow Chart”• Common DSP “Components”• Filtering• Oscillators ,Mixers• Modulators• Tone Detectors• Example 1 “DSP Crystal Radio”• Example 2 HF Channel Simulator• Example 3 RTTY Decoder using PC Sound Card

“Radio Math”
• We all know traditional radios use components (inductors, capacitors, transistors, Xtals etc)
• These components are arranged in “circuits” to perform some operation on the signal at the antenna.
• The operations we do (tuning, detection, mixing, amplification, filtering etc) all can be expressed mathematically (not always simple math!)
• In DSP we will do something equivalent:– Use DSP to make components …we’ve already looked at
filter “components” in Session 2– Use the digital computer and DSP techniques to perform
the math operations.

Important Trig Identities
http://en.wikipedia.org/wiki/List_of_trigonometric_identities
Trig Identities ad nauseum at:
Mixing
Modulation and Phase Detection
=

DSP Flow Charts
• Just like a radio has a block diagram and a schematic showing the function and interconnections of its various components we need a similar DSP Signal Flow chart for DSP implementations.
• The DSP Flow chart shows:– what DSP components are used
– How data flows between these components
– May also have some information about the sequence of some DSP operations

Example DSP Flow Chart
This chart describes how data flows and interacts with various DSP components and processes to implement an 8PSK Pragmatic Trellis Code Modulation Decoder
Continuous or “Batch” DSP Flow
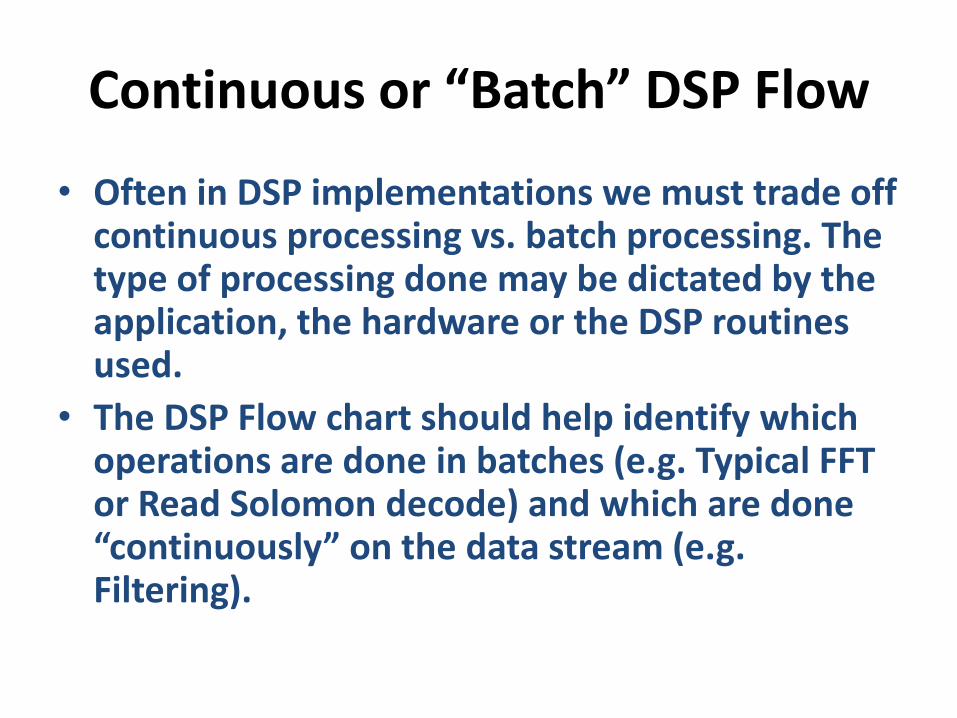
• Often in DSP implementations we must trade off continuous processing vs. batch processing. The type of processing done may be dictated by the application, the hardware or the DSP routines used.
• The DSP Flow chart should help identify which operations are done in batches (e.g. Typical FFT or Read Solomon decode) and which are done “continuously” on the data stream (e.g. Filtering).
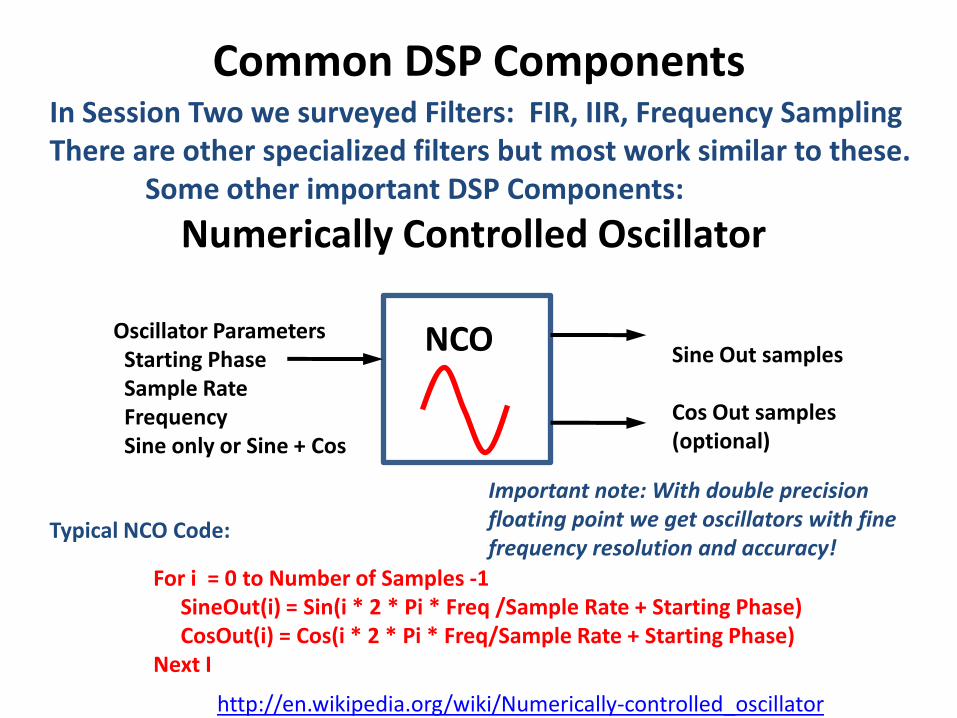
Common DSP Components In Session Two we surveyed Filters: FIR, IIR, Frequency SamplingThere are other specialized filters but most work similar to these.
Some other important DSP Components:
Numerically Controlled Oscillator
Oscillator ParametersStarting PhaseSample RateFrequencySine only or Sine + Cos
NCO
For i = 0 to Number of Samples -1SineOut(i) = Sin(i * 2 * Pi * Freq /Sample Rate + Starting Phase)CosOut(i) = Cos(i * 2 * Pi * Freq/Sample Rate + Starting Phase)
Next I
Sine Out samples
Cos Out samples (optional)
Typical NCO Code:
Important note: With double precision floating point we get oscillators with finefrequency resolution and accuracy!
http://en.wikipedia.org/wiki/Numerically-controlled_oscillator

Common DSP Components
Balanced Mixer
I and Q samples of Signal to be mixes
MIXER
For j = 0 to Number of Samples -1USB Out I (j) = NCOCos(j) * I(j) – NCOSine(j) * Q(j)USB Out Q(j) = NCOSin(j) * I(j) + NCOCos(j) * Q(j)
Next j
Upper Sideband samples
Lower Sideband samples
Typical Balanced Mixer Code:
I
Q
Sine Cos(from NCO)
The Trig identities are used to generate these sum and difference functions.
Reverse Signs for opposite sideband!

Common DSP Components
Phase Modulator
Sample Rate, Samples/symbol,Number of carriers (OFDM)
O MOD Phase Modulated samples
Typical Phase Modulator Code:RealFFT Freq(i) = Cos (Phase Angle)ImagFFTFreq(i) = Sin (Phase Angle)Do INVERSE FFT to get time samples (I and Q)
Phase Modulation Data Clever use of FFT can generate multiple carrier
Modulation (frequency bins I,j, …) SimultaneouslyWith just ONE inverse FFT !
Remember the FFT can go back and forth from Time to Frequency!!!

Common DSP Components
Tone Detector
Input samples (In Noise)
Tone
Detector
F0 Detect
Typical Phase Modulator Code:Compute FFT of (Input samples)For j as integer = 0 to n
Mag(j) = Sqrt( RealF(j) ^2 + ImF(j) ^2)If Mag(j) > MaxMag then ToneDetect = j
next j
F1 Detect
F2 Detect
Fn Detect
The more input samples we process the better the S/N
How could we easilyreduce the CPU loadof this simple routine?
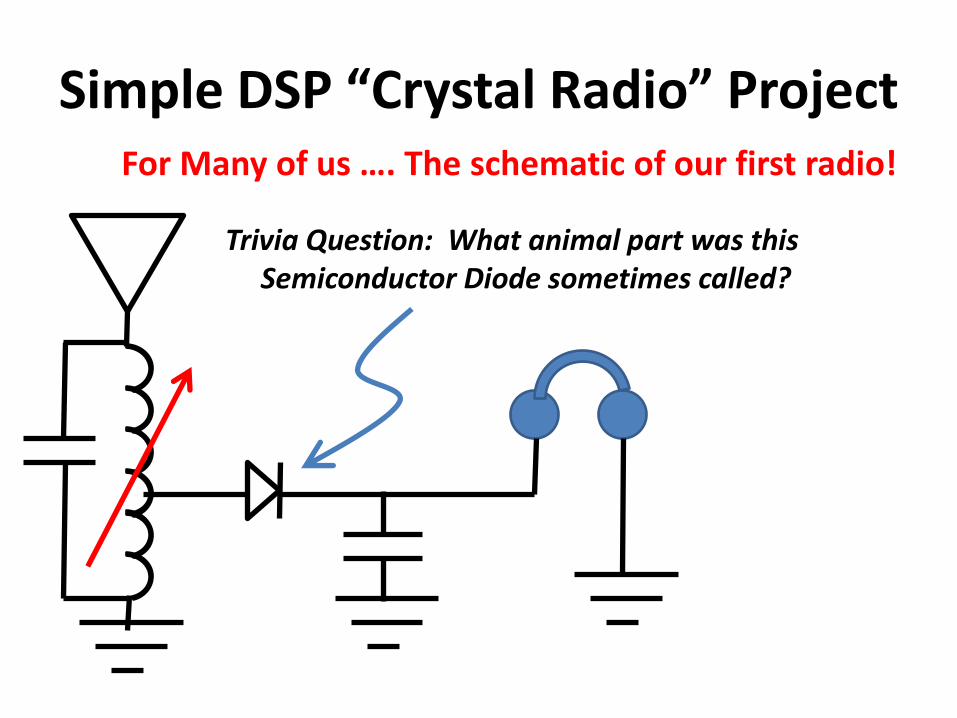
Simple DSP “Crystal Radio” ProjectFor Many of us …. The schematic of our first radio!
Trivia Question: What animal part was this Semiconductor Diode sometimes called?

Simple DSP “Crystal Radio” ProjectNow the DSP Radio!
High SpeedA/D
FIR Band Pass Filter
Envelope Detector
IIR LowPass Filter
PC SoundCard
Sample atMinimum of2x highestFreq
Number of Taps a functionof selectivityand bandwidthdesired
Env =Sqrt(I^2 + Q^2)
Simple IIRlow passwill suffice
Channel Selection
With Only a few hundred dollars in parts A humming DSP CPU and 3 months of Programming we can duplicate a $2 radio!
It works…but whatare some of the challenges with this approach???

HF Channel SimulatorIn working with HF/VHF channel propagation a channel simulator is an invaluable Tool that allows measurement and comparison of modems and performance.
C.C. Watterson developed a HF channel model that is fairly easy to implement Using DSP. (The Watterson Model)
We can use this model and standard CCIR channel definitions to build A very useful DSP based channel simulator application on a PC.
OutputSamples
(e.g. received Signal)
White GaussianNoise
InputSamples
(e.g. Modem output)
Time varyingTap coefficients
http://www.hfindustry.com/HF%20Simulator/chansim.pdf

VAC HF/VHF Channel Simulator
Input StreamSelection
List of all Installed SoundDevices and VAC
(Virtual Audio Cables)
Tap coefficientGenerator
hj(t)
User SelectedS/N Ratio
User SelectedCCIR Channel Type
(multi path poor, flat fading etc)
User SelectedStream Source
WaveStream
Output WaveStream (VAC compatible)
One nice feature of this approach is The channel simulator can be madeto look just like a “cable” connectinga source and sink of sound data
(paper for DCC 2011???)
Watterson Propagation Model

RTTY Decoder Using PC Sound Card(Nominal 45.5 baud, 170Hz shift)
Some challenges here! (not uncommon with DSP!) For true synchronous detection we would like the shift to bean integral number of the baud rate. 170/45.5 = 3.736 Since we can’t change these #s we’ll have to compromise here!
The sound card only samples at certain standard rates…( most common: 8000, 11025, 12000, 44,100, 48000, 96000)Our sample rate should be an integer multiple of the baud rate None of the standard rates is an exact multiple of 45.5 48000/45.5 = 1054.94 1055 samples/symbol is close enough.
But 1055 is not a power of 2 so we’ll have to handle that somehow!But if it were always easy everyone could do it!

RTTY Decoder Using PC Sound Card
PC SoundCard @48000 sps
Goertzel Tone Decoder N= 1055m= 30(1364.9 Hz)
Symbol Framing
Signal SlicerAnd auto threshold
Goertzel Tone Decoder N= 1055m= 34(1546.9 Hz)
Baudot to ASCII Decoder
PC Tuning Display
Note feedback path To keep symbol Correctly framed
Note trick using Goertzel Tone Detector which can Implement arbitraryLength transform
Real world DSP solutions often involve hardwareAnd user interface issues and require“tricks of the trade” to make them practical!

Session 3 Summary• We saw that DSP uses math functions to model the familiar
functions of radio components and circuits.• We examined Common Trig Identities with links to many more.• We saw how the DSP “Flow Chart” is analogous to the familiar
schematic diagram.• Several Common DSP “Components” were described in addition
to the filters covered in session 2.• Example 1 “DSP Crystal Radio”• Example 2 HF Channel Simulator• Example 3 RTTY Decoder using PC Sound Card
• Now in Session 4 we’ll look into some of the finer points of DSP and some of the necessary “Tricks of the Trade” as the way we make DSP really practical!