Embed Size (px)
Citation preview

Queensland Government Enterprise Architecture
Current state: Architecture classificationDigital and ICT strategic planning framework
Final
October 2018
v1.0.0
OFFICIAL - Public

QGEA OFFICIAL – Public Current state: architecture classification
Document details
Security classification OFFICIAL - Public
Date of review of security classification
October 2018
Authority Queensland Government Chief Information Officer
Author Queensland Government Chief Information Office
Documentation status Working draft Consultation release Final version
Contact for enquiries and proposed changesAll enquiries regarding this document should be directed in the first instance to:
Queensland Government Chief Information [email protected]
AcknowledgementsThis version of the Digital and ICT strategic planning framework was developed and updated by Queensland Government Chief Information Office.
Feedback was also received from a number of agencies, which was greatly appreciated.
CopyrightDigital and ICT strategic planning framework
© The State of Queensland (Queensland Government Chief Information Office) 2018
Licence
This work is licensed under a Creative Commons Attribution 4.0 International licence. To view the terms of this licence, visit http://creativecommons.org/licenses/by/4.0/. For permissions beyond the scope of this licence, contact [email protected].
To attribute this material, cite the Queensland Government Chief Information Office.
The licence does not apply to any branding or images.
Information securityThis document has been security classified using the Queensland Government Information Security Classification Framework (QGISCF) as OFFICAL - Public and will be managed according to the requirements of the QGISCF.
Final | v1.0.0 | October 2018 Page OFFICIAL – Public

QGEA OFFICIAL – Public Current state: architecture classification
PurposeClassification of services, processes, information, applications and technology assets/services against domains contained in Enterprise Architecture (EA) Classification Models provides a consistent and convenient method for logically grouping elements of an enterprise architecture to reflect the nature of the business being supported or the function of assets/services.
Classification enables analysis to be performed by domain, on a group of like elements rather than individual elements. It highlights the number of supporting information, application and technology assets used by the business and the capability they deliver. Potential gaps in services or technology capability as well as areas of possible duplication are identified. This may result in actions that can be carried forward into the planning activities with the business.
Seven EA-Classification models are used as part of the Queensland Government Enterprise Architecture (QGEA) to classify business services, business processes, information management functions, information security classifications, information assets, applications and technologies into manageable but meaningful categories. Agencies may also have additional models, or have extended the domains with the QGEA EA-Classification models to reflect specific agency needs.
AudienceA practitioner in the context of this guideline can include one or more of the following roles:
Enterprise architects Digital and ICT strategic planners
Final | v1.0.0 | October 2018 Page OFFICIAL – Public
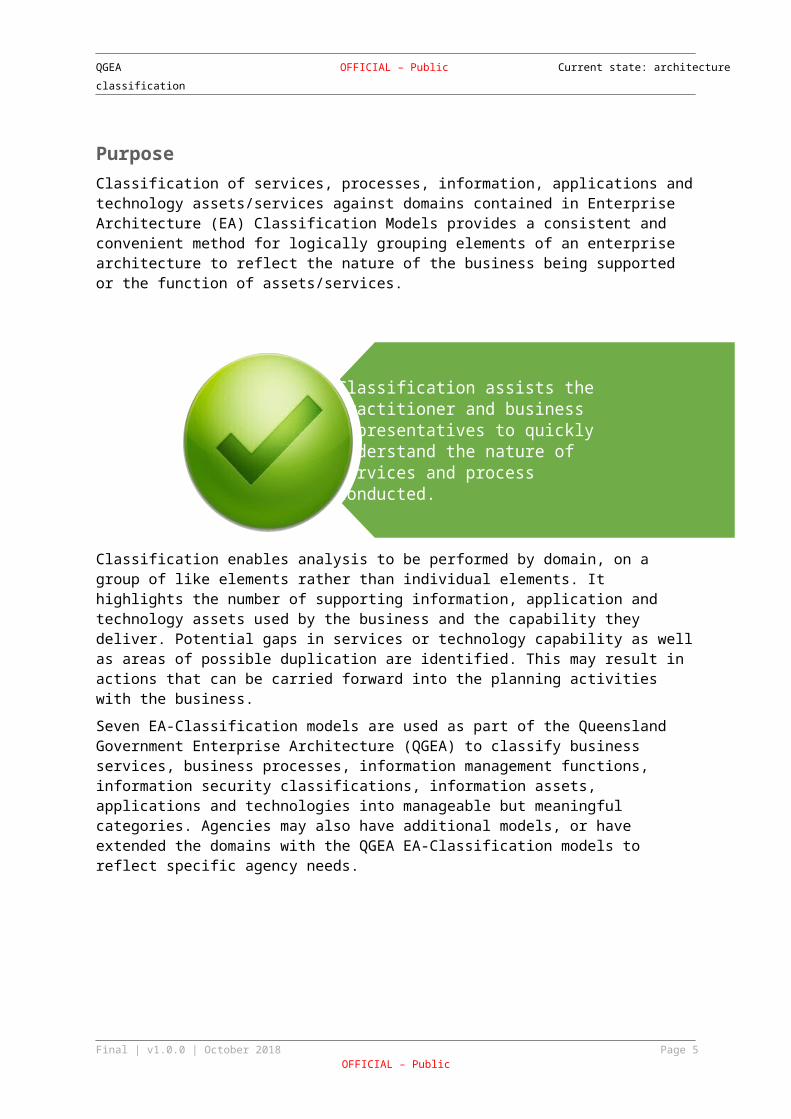
Classification assists the practitioner and business representatives to quickly understand the nature of services and process conducted.
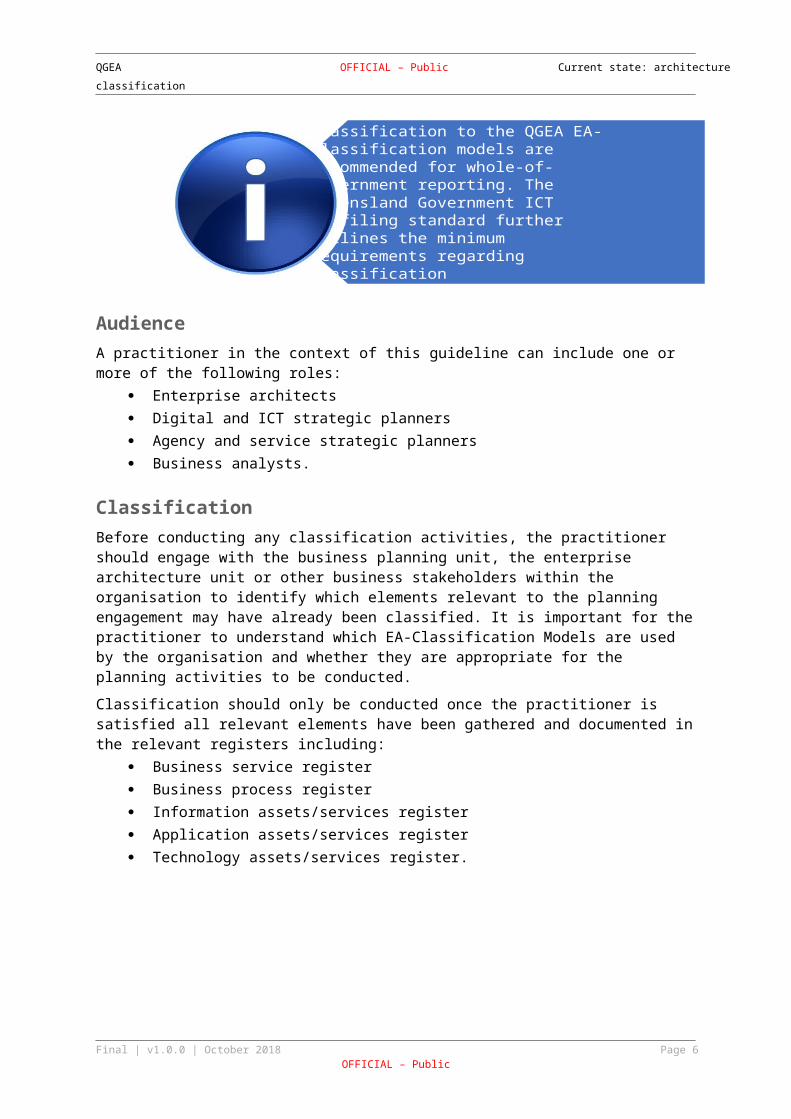
Classification to the QGEA EA-Classification models are recommended for whole-of-government reporting. The Queensland Government ICT Profiling standard further outlines the minimum requirements regarding classification

QGEA OFFICIAL – Public Current state: architecture classification
Agency and service strategic planners Business analysts.
ClassificationBefore conducting any classification activities, the practitioner should engage with the business planning unit, the enterprise architecture unit or other business stakeholders within the organisation to identify which elements relevant to the planning engagement may have already been classified. It is important for the practitioner to understand which EA-Classification Models are used by the organisation and whether they are appropriate for the planning activities to be conducted.
Classification should only be conducted once the practitioner is satisfied all relevant elements have been gathered and documented in the relevant registers including:
Business service register Business process register Information assets/services register Application assets/services register Technology assets/services register.
Please note: EA-Classification models used for planning purposes should be meaningful to the business, have clearly defined definitions for each domain and be applied consistently across business areas within the agency.
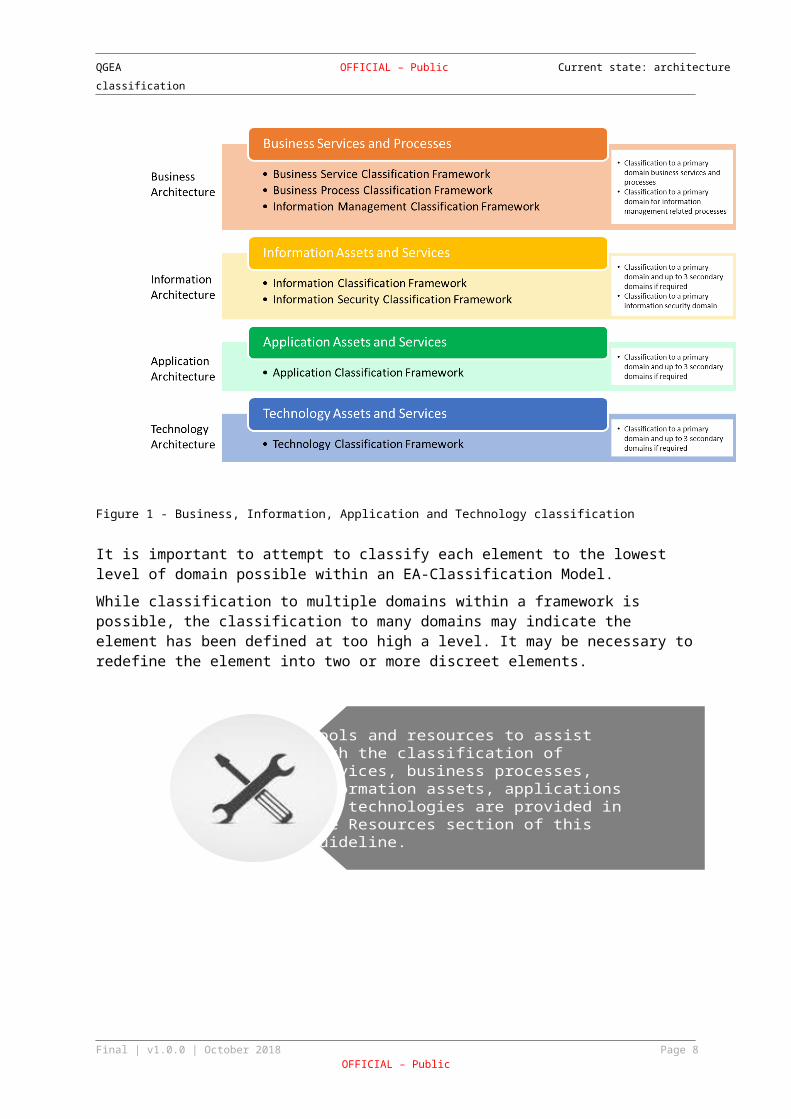
Figure 1 demonstrates how elements are classified to domains within each layer of the QGEA EA-Classification models.
Final | v1.0.0 | October 2018 Page OFFICIAL – Public
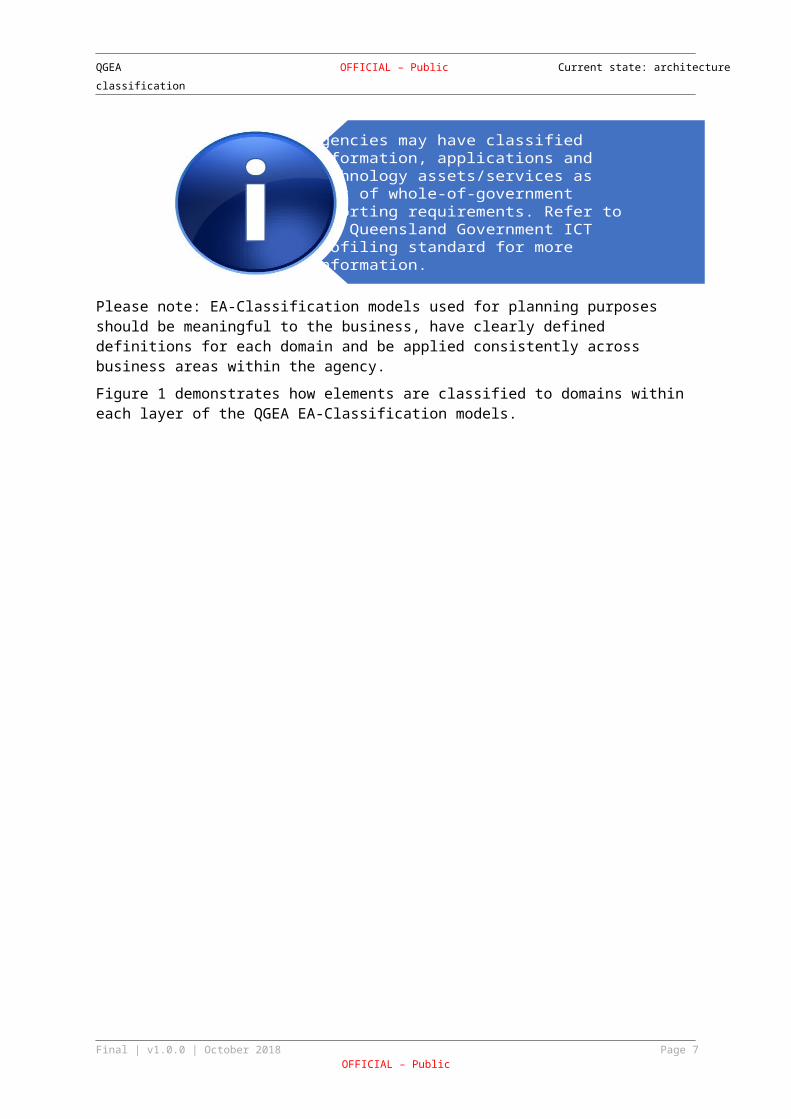
Agencies may have classified information, applications and technology assets/services as part of whole-of-government reporting requirements. Refer to the Queensland Government ICT Profiling standard for more information.
QGEA OFFICIAL – Public Current state: architecture classification
Figure 1 - Business, Information, Application and Technology classification
It is important to attempt to classify each element to the lowest level of domain possible within an EA-Classification Model.
While classification to multiple domains within a framework is possible, the classification to many domains may indicate the element has been defined at too high a level. It may be necessary to redefine the element into two or more discreet elements.
Final | v1.0.0 | October 2018 Page OFFICIAL – Public
Tools and resources to assist with the classification of services, business processes, information assets, applications and technologies are provided in the Resources section of this guideline.
QGEA OFFICIAL – Public Current state: architecture classification
AnalysisClassification to EA-Classification models results in three key analysis areas including Coverage, Gaps and Duplicates. When combined with cost information about elements such as the annual cost of operation or replacement cost, spend per domain analysis can also be conducted. Table 1 below explains the key outcomes resulting from classifying elements to their respective EA-Classification Models.
Analysis Area Description Interpretation
Coverage The extent to which elements are spread across the business or functional domains of the EA-Classification Models.
Coverage is a general indicator of how the services, business processes and assets are distributed across the relevant domains of the EA-Classification Model. For example, is there a concentration of processes or assets in a particular line of business or area of capability.
Gaps The proportion of domains in each of the EA-Classification Models have no elements classified to them.
Gaps are particularly important for domains in frameworks that directly support the line of business or strategic direction of the organisation. Gaps indicate the organisation may have failed to adequately invest in services, processes and assets that directly support line of business of the organisation and its customers.
Duplicates The proportion of domains in each of the EA-Classification Models have multiple elements classified to them.
Duplication may indicate the organisation has over invested in assets or services in particular domains and is duplicating processes and functions.
The organisation may question, ‘What is the extent of potential duplicate processes and ICT assets/services in the organisation and what is the extent to which the portfolio of processes and ICT assets can be rationalised?’
Spend per domain
The proportion of spend in each domain of the EA-Classification Models based on the annual estimated cost of operation of each asset or service or proportion of each asset or service classified to
Spend per domain represents the level of investment in resources and ICT assets/services that directly supports the line of business or strategic intent of the organisation versus the level of spend to support the business imperatives and other functions conducted by the
Final | v1.0.0 | October 2018 Page OFFICIAL – Public
QGEA OFFICIAL – Public Current state: architecture classification
Analysis Area Description Interpretation
each domain. organisation.
Questions to consider include, ‘Is the level of spend in particular business and functional domains appropriate for the nature of business conducted by the organisation?’ and ‘Are there opportunities to rationalise spend in some domains and move some business and ICT services to cheaper delivery and management platforms?’
Table 1 - Outcomes resulting from classification
Where there is coverage across domains that do not directly support the line of business or business imperatives of the organisation, opportunities may exist to rationalise the cost of the elements or the number of elements in those domains.
Where duplication exists, opportunities may exist to decrease activity in those domains. Particularly in domains that do not directly support the line of business or business imperatives of the organisation. Investigate opportunities to outsource these services or processes or retire any redundant processes, information assets and related applications and technology for example.
Opportunities may also exist to rationalise the information, applications or technologies in a domain where duplication exists. Particularly if the cost of supporting those information, application and technology assets/services is high.
Gaps may represent new opportunities both in terms of new services and supporting processes as well as additional capability in terms of information, applications and technologies. Consider the domains that may support the strategic objectives of the organisation for example. What is the level of capability or investment already in those domains? Are there opportunities that can be can be carried forward to the planning engagement as potential objectives or strategies?
Final | v1.0.0 | October 2018 Page OFFICIAL – Public
A bar chart could be used to demonstrate the Domains by Total Spend. The X axis would represent the amount of spend and the Y axis would list the domain names from the relevant EA-Classification Model to which the elements have been classified.
QGEA OFFICIAL – Public Current state: architecture classification
Diagrams can be useful when analysing classifications. These can include graphs or heat maps that depict the number of assets/services or the cost of assets/services in particular domains.
Next stepsThe results of the analysis of classifications can be presented back to the planning sponsor as well as the business representatives as part of the planning workshops conducted as part of the planning engagement.
It may be appropriate to suggest recommended management strategies that should be considered when developing the digital or ICT strategy or plan.
Alternatively, some recommendations may need to be carried forward into operational planning activities.
Resources
Resource Link
ICT resources profiling tool
Template - https://www.qgcio.qld.gov.au/services/analytics-and-research/ICT-profiling-templates
Application classification framework
Diagram – https://www.qgcio.qld.gov.au/documents/application-classification-framework-definitionsDefinitions - https://www.qgcio.qld.gov.au/documents/application-classification-framework-definitions
Business process classification framework
Definitions: https://www.qgcio.qld.gov.au/documents/business-process-classification-framework
Business service classification framework
Diagram - https://www.qgcio.qld.gov.au/documents/business-services-classification-framework-diagramGuideline - https://www.qgcio.qld.gov.au/documents/business-services-classification-framework-guideline
Information classification
Definitions - https://www.qgcio.qld.gov.au/documents/information-
Final | v1.0.0 | October 2018 Page OFFICIAL – Public
Opportunities may exist to invest in services, applications and technologies in domains where there are gaps. Particularly in domains where mappings have revealed that objectives and strategies are not currently supported by services or applications.

QGEA OFFICIAL – Public Current state: architecture classification
Resource Link
framework classification-framework-definitions2Diagram - https://www.qgcio.qld.gov.au/documents/information-classification-framework-diagram
Information management classification framework
Framework - https://www.qgcio.qld.gov.au/documents/information-management-strategic-framework
Information security policy framework
Framework - https://www.qgcio.qld.gov.au/documents/information-security-policy-framework-qgispf
Technology classification framework
Diagram - https://www.qgcio.qld.gov.au/documents/technology-classification-framework-diagramDefinitions - https://www.qgcio.qld.gov.au/documents/technology-classification-framework
Final | v1.0.0 | October 2018 Page OFFICIAL – Public


![THE HERITAGE ARCHITECTURE OF QUEENSLAND213079/s00855804_1968_1… · THE HERITAGE ARCHITECTURE OF QUEENSLAND [By R. E. NEWELL] (Read at a meeting of the Society on 24 July 1969) QUEENSLAND,](https://img.dokumen.tips/doc/110x75/5f03d0067e708231d40ae50f/the-heritage-architecture-of-queensland-213079s0085580419681-the-heritage-architecture.jpg)