Embed Size (px)
Citation preview

PHYSICS REVIEW
Diffusion Tensor MR Imaging and FiberTractography: Theoretic Underpinnings
P. MukherjeeJ.I. BermanS.W. Chung
C.P. HessR.G. Henry
SUMMARY: In this article, the underlying theory of clinical diffusion MR imaging, including diffusiontensor imaging (DTI) and fiber tractography, is reviewed. First, a brief explanation of the basic physicsof diffusion-weighted imaging (DWI) and apparent diffusion coefficient (ADC) mapping is provided. Thisis followed by an overview of the additional information that can be derived from the diffusion tensor,including diffusion anisotropy, color-encoded fiber orientation maps, and 3D fiber tractography. Thisarticle provides the requisite background for the second article in this 2-part review to appear nextmonth, which covers the major technical factors that affect image quality in diffusion MR imaging,including the acquisition sequence, magnet field strength, gradient amplitude and slew rate, andmultichannel radio-frequency coils and parallel imaging. The emphasis is on optimizing these factorsfor state-of-the-art DWI and DTI based on the best available evidence in the literature.
Diffusion MR imaging of the brain was first adopted for usein clinical neuroradiology during the early 1990s and was
found to have immediate utility for the evaluation of sus-pected acute ischemic stroke. Since that time, enormousstrides forward in the technology of diffusion imaging havegreatly improved image quality and enabled many new clinicalapplications. These include the diagnosis of intracranial pyo-genic infections, masses, trauma, and vasogenic-versus-cyto-toxic edema. Furthermore, the advent of diffusion tensor im-aging (DTI) and fiber tractography has opened an entirely newnoninvasive window on the white matter connectivity of thehuman brain. DTI and fiber tractography have already ad-vanced the scientific understanding of many neurologic andpsychiatric disorders and have been applied clinically for thepresurgical mapping of eloquent white matter tracts beforeintracranial mass resections.
This 2-part review explores the current state of the art forthe acquisition and analysis of clinical diffusion imaging, in-cluding DTI and fiber tractography. This first article beginswith an explanation of the basic physics and underlying theoryof diffusion-weighted imaging (DWI) and apparent diffusioncoefficient (ADC) mapping. This is followed by an overview ofthe additional information that can be derived from the diffu-sion tensor, including diffusion anisotropy, color-encoded fi-ber-orientation maps, and 3D fiber tractography. This articleprovides the necessary background for the second article,which focuses on the major technical factors that affect imagequality in diffusion imaging, with an emphasis on optimizingthese factors for state-of-the-art DWI and DTI based on thebest available evidence in the literature.
Theoretic Underpinnings of Diffusion Imaging
Brownian Motion and Tissue UltrastructureDiffusion, also known as “Brownian motion,” refers to con-stant random microscopic molecular motion due to heat. At afixed temperature, the rate of diffusion can be described by the
Einstein equation1:
1) �r2� � 6Dt,
where �r2� refers to the mean squared displacement of themolecules, t is the diffusion time, and D is the diffusion con-stant, a constant of proportionality for the particular sub-stance being measured. In clinical diffusion imaging, the typeof diffusion being investigated is water self-diffusion, meaningthe thermal motion of water molecules in a medium that itselfconsists mostly of water.2-5 The diffusion constant, typicallyexpressed in units of square millimeters per second, relates theaverage displacement of a molecule over an area to the obser-vation time, with higher values of this constant indicatingmore mobile water molecules. The ADC is the diffusion con-stant measured in the clinical setting, reflecting the limitationthat in vivo diffusion cannot be separated from other sourcesof water mobility, such as active transport, flow along pressuregradients, and changes in membrane permeability.
Imaging molecular water diffusion confers the ability toprobe the microstructural properties of biologic tissues. Thetypical diffusion times used for clinical DWI are 10 –50 ms,corresponding to average molecular displacements on the or-der of 10 �m. This microscopic spatial scale is in the samerange as that of cellular dimensions. This sensitivity to cellularprocesses has been exploited clinically for improving the de-tection of acute cerebral ischemia,4,6-10 distinguishing vaso-genic from cytotoxic edema,11-16 identifying foci of axonalshearing injury after acute head trauma,17-19 characterizingcellularity in brain tumors,20-27 discriminating between me-tastases and gliomas22,27 and between tumor recurrence andpostsurgical injury,28 differentiating pyogenic abscesses fromtumors,29-31 and for the noninvasive mapping of white matterconnectivity by using the diffusion tensor model,32-36 amongother applications.
Stejskal-Tanner Diffusion EncodingA diffusion-weighted pulse sequence is constructed by the ad-dition of a pair of diffusion-sensitizing gradients, also knownas motion-probing gradients, to a T2-weighted spin-echo se-quence. The diffusion gradients are applied along the samedirectional axis both before and after the 180° refocusing pulse(Fig 1). This is known as Stejskal-Tanner diffusion encoding.37
Molecular motion thus results in loss of signal intensity due toincomplete rephasing of water proton spins, which change
From the Department of Radiology, University of California, San Francisco, San Francisco,Calif.
Please address correspondence to Pratik Mukherjee, MD, PhD, Department of Radiology,Box 0628, University of California, San Francisco, 505 Parnassus Ave, L-358, San Francisco,CA 94143-0628; e-mail: [email protected]
DOI 10.3174/ajnr.A1051
PHYSICS
REVIEW
AJNR Am J Neuroradiol ● :● � ● 2008 � www.ajnr.org 1
Published March 13, 2008 as 10.3174/ajnr.A1051
Copyright 2008 by American Society of Neuroradiology.

position between and during the applications of the 2 diffu-sion-sensitizing gradients. This diffusion-weighted contrastcan be fit to an exponential model:
2) Si � S0 � e�b � ADCi.
In the above expression, Si is the diffusion-weighted signalintensity observed at a given voxel with the diffusion-sensitiz-ing gradients applied along direction i, S0 is the signal intensityat the same voxel measured without diffusion-sensitizing gra-dients, and ADCi is the ADC in the i direction. Within theexponential term, the b factor is a measure of diffusion-weighting that is a function of the strength, duration, and tem-poral spacing of the diffusion-sensitizing gradients, assumingrectangular gradient pulses:
3) b � �2G2�2(� � �/3),
where � is a physical constant known as the gyromagneticratio, G is the amplitude of the diffusion gradient typicallymeasured in milliteslas per meter, � is the duration of eachdiffusion gradient in milliseconds, and � is the interval be-tween the onset of the diffusion gradient before the refocusingpulse and that after the refocusing pulse, measured in millisec-onds (Fig 1). The units of b are seconds per square millimeter,reciprocal to the units of ADC. It can be seen from equation 2that raising b increases the degree of diffusion-weighting (ie,the loss of signal intensity Si along direction i produced byapplication of the diffusion gradients). From equation 3, it isapparent that boosting the gradient amplitude G and the gra-dient duration � are the most effective ways of increasing thediffusion-weighting, due to the quadratic dependence of b onthese 2 parameters. Typical values of b used in clinical appli-cations range from 600 to 1500 seconds per square millimeter.The lowest values of b are used for imaging of fetuses in uteroor premature neonates, due to the very high ADC values ofthese structurally immature brains.38,39 The highest b factorshave been advocated for hyperacute stroke imaging in adultsat 1.5T, to maximize sensitivity to the often subtle reductionsin ADC in this very early stage of cerebral ischemia,40,41
though a recent 3T study42 found no benefit of b � 1500s/mm2 DWI for stroke detection compared with the tradi-tional adult b-value of 1000 s/mm2.
Diffusion-Weighted Image Contrast and ADC CalculationIn equation 2, ADCi is the ADC of water along the direction ofthe diffusion-sensitizing gradient. Higher ADC values, reflect-ing greater rates of water diffusion in the tissue under investi-
gation, result in lower signal intensity Si in the diffusion-weighted image (Fig 2). Conversely, reduced ADC valuesresult in higher observed signal intensity on DWI. The directcalculation of ADC values has assumed considerable clinicalimportance because of the T2-weighting inherent in the longTE of a DWI pulse sequence:
4) Si � k � e�TE/T2 � e�b � ADCi,
where k is a proportionality constant and T2 is the transverserelaxation time of the interrogated tissue. Hence, T2 prolon-gation within pathologic tissues may cause DWI signal hyper-intensity, even in the absence of reduced ADC values. This T2shinethrough effect renders DWI hyperintensity less specificfor clinical diagnosis than decreases of ADC that are con-firmed on an ADC map (Fig 3). Conversely, decreases in T2may mask a true reduction in ADC values; this phenomenonhas been referred to as “T2 blackout”.43 T2 blackout may be atleast in part responsible for the relatively low sensitivity ofDWI signal intensity compared with ADC maps for the detec-tion of acute hypoxic-ischemic injury in neonatal white matterbecause such lesions typically reduce the very long T2 relax-ation times of white matter in neonates. However, T2 effectscan also be beneficial: The “lightbulb” brightness of DWI sig-nal intensity in acute infarcts of the adult brain is caused by themultiplicative effect of T2 prolongation and reduced ADC(equation 4). Therefore, DWI has better sensitivity than ADCmaps for small acute ischemic lesions in children beyond in-fancy and in adults.
ADC values may be calculated from DWI by solving forADC in equation 2:
5) ADCi � �ln�Si/S0)/b,
where ln is the natural logarithm. The signal intensity S0 in theabsence of a diffusion-sensitizing gradient can be derived froman image acquired at b � 0 s/mm2. In general, ADC maps canbe derived from a set of diffusion-weighted images acquired ata high b factor and a second set of images acquired with a lowb factor, which can be zero. This only applies in the range of b-values used clinically, because for b-values greatly exceeding1000 s/mm2, DWI signal intensity Si no longer conforms to themonoexponential relationship with b described in equation2.44,45
Another popular way of examining diffusion images with-out the contaminating influence of T2 effects is with an atten-uation coefficient (AC) map, also known as the exponentialdiffusion-weighted image,46 the exponential image, or the at-tenuation factor map (Fig 2). The AC map can be computed bydividing the diffusion-weighted image Si by the T2-weightedb � 0 s/mm2 image S0. This yields
6) SACi � Si/S0
� e�b � ADCi.
Note from the last expression, compared with equation 4,that only the diffusion-related exponential term remains,eliminating the T2-weighting effects. Like DWIs, areas of re-duced diffusion appear bright on AC maps and areas of ele-vated diffusion appear dark. This is the opposite of the con-trast polarity of ADC images. However, like ADC maps, ACmaps remain less sensitive than DWI signal hyperintensity for
Fig 1. Pulse sequence diagram for a diffusion-weighted acquisition shows that 2 diffusion-sensitizing gradients (dark gray) are added to a spin-echo sequence, 1 before and 1 afterthe 180° refocusing pulse. The diffusion-weighting factor b depends on the amplitude ofthe diffusion gradient (G), the duration of each diffusion gradient (�), and the intervalbetween the onset of the diffusion gradient before the refocusing pulse and that followingthe refocusing pulse (�). RF indicates radiofrequency pulses; Gz, gradient pulses.
2 Mukherjee � AJNR ● � ● 2008 � www.ajnr.org

detecting small acute infarcts because they lack the multipli-cative effect of T2 prolongation combined with reduced diffu-sion that produces the “lightbulb” effect on DWI.
Isotropy, Anisotropy, and Rotational InvarianceIn isotropic diffusion, molecular motion is equal in all direc-tions. Pure water at body temperature demonstrates isotropicdiffusion, with an ADC of approximately 3.0 � 10�3 mm2/s.In the human brain, isotropic diffusion may be found in theCSF spaces, except in areas of bulk flow such as the jets ema-nating from the foramina of Monro or through the cerebralaqueduct. Due to its complex microarchitecture, the gray mat-ter of the cerebral cortex in adults is also thought to exhibitisotropic diffusion at the clinical range of b-values,33,47 thoughsome studies differ.48 When diffusion is isotropic, the choiceof direction for the diffusion-sensitizing gradient is not im-portant because ADCi is identical for all directions i.
In anisotropic diffusion, molecular mobility is not equalfor all directions. White matter tracts with tightly packed co-herently oriented fiber bundles hinder water displacementperpendicular to the direction of the fibers, resulting in larger
ADCi values parallel to the tracts ratherthan orthogonal to them.49 Hence, morethan 1 diffusion-encoding direction is re-quired to characterize regions of aniso-tropic diffusion. If only a single diffusiondirection was probed, interpretation ofthe DWIs would be complicated by vari-able signal intensity in white mattertracts, depending on their orientation rel-ative to the direction of the diffusion gra-dient, which could also be affected bychanges in the orientation of the patient’shead. Although this anisotropy can be ex-ploited in DTI, to be discussed in detailbelow, it is not desirable for routine clin-ical DWI. To avoid this problem, one cancompute parameters with the property ofrotational invariance from the originalDWI data because these measures math-ematically eliminate any directional de-pendence that might confuse clinicalinterpretation.
Computation of commonly used rota-tionally invariant measures, such as thegeometric mean DWI and the trace ADC,requires at least 4 separate image acquisi-
tions: 1 without diffusion-sensitizing gradients (b � 0 s/mm2),labeled S0, and 3 probing motion along 3 mutually orthogonaldirections, labeled S1, S2, and S3, respectively. The DWIs sub-mitted to the radiologist for interpretation are not typically thesets of unidirectional DWIs S1, S2, and S3 but rather the rota-tionally invariant geometric mean computed from these 3 im-age sets, also known as the “isotropic DWI” or the “combinedDWI”:
7) SDWI � (S1 � S2 � S3)1/3
� S0 � e�b � (ADC1 � ADC2 � ADC3)/3)
� S0 � e�b � ADC,
where ADC1, ADC2, and ADC3 are the ADCs along the direc-tions of the 3 diffusion-sensitizing gradients and, in the finalexpression, ADC � (ADC1 � ADC2 � ADC3)/3. This lastvariable, ADC, is the average of the ADCi values along the 3orthogonal directions and is also rotationally invariant. It isvariously known as the mean diffusivity, the trace ADC, Dav,or, simply, the ADC. Henceforth in this discussion, as is typicalin the clinical setting when the acronym ADC is used, it willrefer to this averaged value.
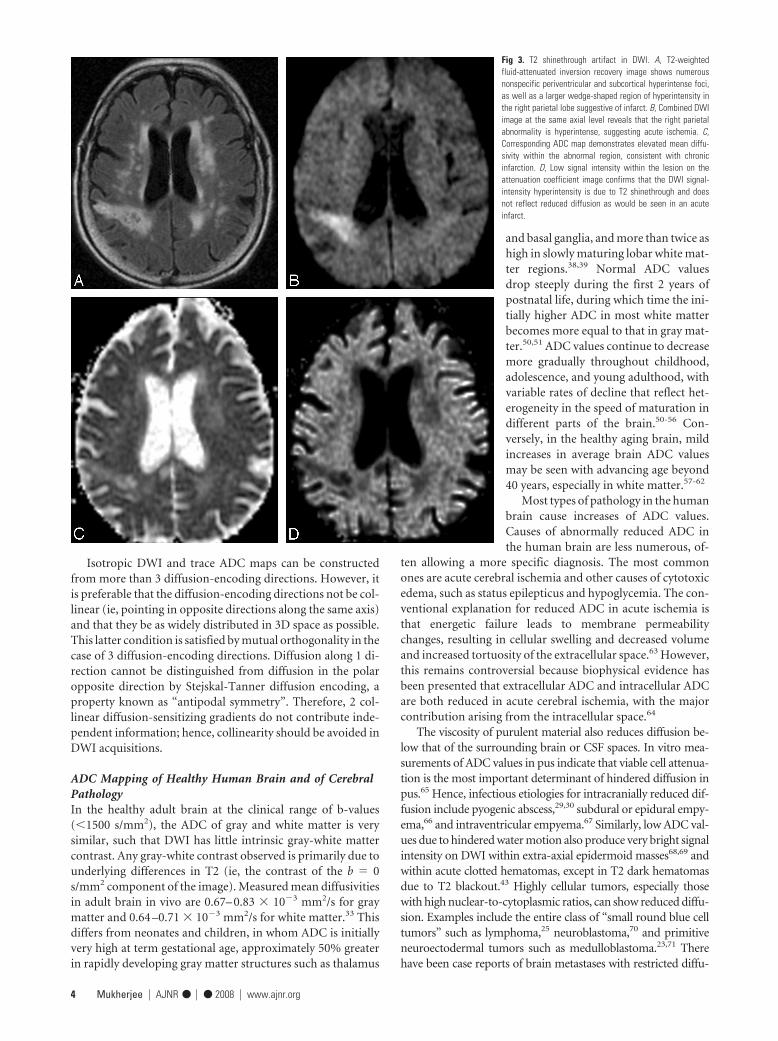
Fig 2. DWI enables more sensitive and specific diagnosis ofacute cerebral ischemia in a case of embolic infarcts due toendocarditis. A, Conventional spin-echo T2-weighted imageshows only nonspecific white matter foci of signal hyperin-tensity. B, Combined DWI image at the same axial levelreveals 3 punctuate hyperintense white matter lesions (ar-rows) that are suggestive of embolic infarcts. C, Correspond-ing ADC map confirms that there is reduced diffusion in theselesions (arrows), consistent with acute ischemia. D, Attenu-ation coefficient image, also known as the exponential dif-fusion image, shows these lesions as remaining hyperintense(arrows). This demonstrates that the hyperintensity on thecombined DWI image is not due to T2 shinethrough artifact.
AJNR Am J Neuroradiol ● :● � ● 2008 � www.ajnr.org 3
Isotropic DWI and trace ADC maps can be constructedfrom more than 3 diffusion-encoding directions. However, itis preferable that the diffusion-encoding directions not be col-linear (ie, pointing in opposite directions along the same axis)and that they be as widely distributed in 3D space as possible.This latter condition is satisfied by mutual orthogonality in thecase of 3 diffusion-encoding directions. Diffusion along 1 di-rection cannot be distinguished from diffusion in the polaropposite direction by Stejskal-Tanner diffusion encoding, aproperty known as “antipodal symmetry”. Therefore, 2 col-linear diffusion-sensitizing gradients do not contribute inde-pendent information; hence, collinearity should be avoided inDWI acquisitions.
ADC Mapping of Healthy Human Brain and of CerebralPathologyIn the healthy adult brain at the clinical range of b-values(�1500 s/mm2), the ADC of gray and white matter is verysimilar, such that DWI has little intrinsic gray-white mattercontrast. Any gray-white contrast observed is primarily due tounderlying differences in T2 (ie, the contrast of the b � 0s/mm2 component of the image). Measured mean diffusivitiesin adult brain in vivo are 0.67– 0.83 � 10�3 mm2/s for graymatter and 0.64 –0.71 � 10�3 mm2/s for white matter.33 Thisdiffers from neonates and children, in whom ADC is initiallyvery high at term gestational age, approximately 50% greaterin rapidly developing gray matter structures such as thalamus
and basal ganglia, and more than twice ashigh in slowly maturing lobar white mat-ter regions.38,39 Normal ADC valuesdrop steeply during the first 2 years ofpostnatal life, during which time the ini-tially higher ADC in most white matterbecomes more equal to that in gray mat-ter.50,51 ADC values continue to decreasemore gradually throughout childhood,adolescence, and young adulthood, withvariable rates of decline that reflect het-erogeneity in the speed of maturation indifferent parts of the brain.50-56 Con-versely, in the healthy aging brain, mildincreases in average brain ADC valuesmay be seen with advancing age beyond40 years, especially in white matter.57-62
Most types of pathology in the humanbrain cause increases of ADC values.Causes of abnormally reduced ADC inthe human brain are less numerous, of-
ten allowing a more specific diagnosis. The most commonones are acute cerebral ischemia and other causes of cytotoxicedema, such as status epilepticus and hypoglycemia. The con-ventional explanation for reduced ADC in acute ischemia isthat energetic failure leads to membrane permeabilitychanges, resulting in cellular swelling and decreased volumeand increased tortuosity of the extracellular space.63 However,this remains controversial because biophysical evidence hasbeen presented that extracellular ADC and intracellular ADCare both reduced in acute cerebral ischemia, with the majorcontribution arising from the intracellular space.64
The viscosity of purulent material also reduces diffusion be-low that of the surrounding brain or CSF spaces. In vitro mea-surements of ADC values in pus indicate that viable cell attenua-tion is the most important determinant of hindered diffusion inpus.65 Hence, infectious etiologies for intracranially reduced dif-fusion include pyogenic abscess,29,30 subdural or epidural empy-ema,66 and intraventricular empyema.67 Similarly, low ADC val-ues due to hindered water motion also produce very bright signalintensity on DWI within extra-axial epidermoid masses68,69 andwithin acute clotted hematomas, except in T2 dark hematomasdue to T2 blackout.43 Highly cellular tumors, especially thosewith high nuclear-to-cytoplasmic ratios, can show reduced diffu-sion. Examples include the entire class of “small round blue celltumors” such as lymphoma,25 neuroblastoma,70 and primitiveneuroectodermal tumors such as medulloblastoma.23,71 Therehave been case reports of brain metastases with restricted diffu-
Fig 3. T2 shinethrough artifact in DWI. A, T2-weightedfluid-attenuated inversion recovery image shows numerousnonspecific periventricular and subcortical hyperintense foci,as well as a larger wedge-shaped region of hyperintensity inthe right parietal lobe suggestive of infarct. B, Combined DWIimage at the same axial level reveals that the right parietalabnormality is hyperintense, suggesting acute ischemia. C,Corresponding ADC map demonstrates elevated mean diffu-sivity within the abnormal region, consistent with chronicinfarction. D, Low signal intensity within the lesion on theattenuation coefficient image confirms that the DWI signal-intensity hyperintensity is due to T2 shinethrough and doesnot reflect reduced diffusion as would be seen in an acuteinfarct.
4 Mukherjee � AJNR ● � ● 2008 � www.ajnr.org

sion, even those without intralesional hemorrhage.72 Reduceddiffusion has been described in the acute phase of primary demy-elinating diseases,73,74 metabolic disorders,74,75 and toxic expo-sures.76-78 Rare causes of reduced ADC include Creutzfeldt-Jakobdisease.79-82
The Diffusion TensorAs discussed previously, variations in diffusion-weighted sig-nal intensity due to the anisotropy of white matter tracts canbe troublesome for the interpretation of clinical DWI, unlessrotationally invariant geometric mean DWI and trace ADCmaps are computed. However, the anisotropic diffusion ofcoherently oriented axonal fibers can also be exploited forquantitative characterization and anatomic mapping of whitematter tracts. If at least 6 diffusion-encoded image sets areacquired along noncollinear directions, in addition to at leastone b � 0 s/mm2 (or low b) image set, the diffusion tensor canbe calculated.32,83
The diffusion tensor, a 3 � 3 matrix of vectors, is a math-ematic model of the 3D pattern of diffusion anisotropy ofwhite matter tracts. The tensor, D, can be related to the diffu-sion-weighted signal intensity, S, and the b � 0 s/mm2 signalintensity, S0, as follows:
8)S
S0� e�
� �i � x,y,z
�j � x,y,z
bi, jDi, j�, where
bi, j � �2GiGj ��2�� ��
3�� .
In this formalism, the diffusion-weighting factor, b, incor-porates the direction and magnitude of the applied diffusiongradient vector (Gx, Gy, Gz). Six or more measurements of Sby using noncollinear diffusion gradients are necessary to es-timate D by using linear regression methods.32,83
The most intuitive way to conceptualize the informationprovided by the diffusion tensor is to view it geometrically (Fig4). The tensor effectively fits the angular variation of the ADC
values to the shape of a 3D ellipsoid. Thediffusion ellipsoid is a shape defined by 6variables that describes the ADC of watermolecules in each direction at a particulartime. For isotropic diffusion, the diffusionellipsoid is a sphere, because the ADC inevery direction is equal. Anisotropic diffu-sion is modeled with an elongated ellipsoid,indicating a greater mean diffusion dis-tance along the longest axis of the ellipsoid.The elements of the tensor above the diag-onal are always equal to those below thediagonal (Fig 4, bottom row), a character-istic termed “conjugate symmetry”, whichreflects the antipodal symmetry of Brown-ian motion. Thus, there are only 6 indepen-dent elements of the tensor, necessitating aminimum of 6 noncollinear diffusion-en-
coding measurements to solve for the tensor elements. Thediagonal terms of the tensor indicate the magnitude of diffu-sivity in each of 3 orthogonal directions. In the case of aniso-tropic diffusion, the off-diagonal terms of the diffusion tensorindicate the magnitude of diffusion along 1 direction arisingfrom a concentration gradient in an orthogonal direction.
Diffusion Tensor ParametersA number of diffusion tensor metrics are used to characterizethe dimensions and shape of the diffusion ellipsoid associatedwith the microstructure of a particular voxel. The 3 principalaxes of the diffusion tensor, termed the “eigenvectors,” can becalculated by diagonalizing the diffusion tensor:
9) � � �1 0 00 �2 00 0 �3
� � R � D � RT.
The diffusion tensor is rotated by matrix R to produce thediagonal matrix, . The columns of R are composed of theeigenvectors of the system, and RT is the matrix transpose of R.The 3 eigenvectors and rotationally invariant eigenvalues �1,�2, �3 describe the directions and lengths of the 3 diffusionellipsoid axes, respectively, in descending order of magnitude(Fig 5, top row). The largest eigenvector, termed the “primaryeigenvector,” and its associated eigenvalue �1 indicate, respec-tively, the direction and magnitude of greatest water diffusion.The primary eigenvector is important for fiber tractographyalgorithms because this vector indicates the orientation of ax-onal fiber bundles. Therefore, �1 is also termed “longitudinaldiffusivity,” because it specifies the rate of diffusion along theorientation of the fibers. The second and third eigenvectors areorthogonal to the primary eigenvector, and their associatedeigenvalues �2 and �3 give the magnitude of diffusion in theplane transverse to axonal bundles. Hence, the mean of �2 and�3 is also known as “radial diffusivity”.
A number of additional rotationally invariant diffusionmetrics, derived from the 3 eigenvalues, are commonly used todescribe the microstructure in a particular voxel. The mean
Fig 4. The diffusion ellipsoids and tensors for isotropic unre-stricted diffusion, isotropic restricted diffusion, and anisotropicrestricted diffusion are shown.
AJNR Am J Neuroradiol ● :● � ● 2008 � www.ajnr.org 5

diffusivity (Dav) is the mean of the 3 eigenvalues and describesthe directionally averaged diffusivity of water within a voxel:
10) Dav ��1��2��3
3� trace (D)/3.
The trace of D is the sum of the 3 eigenvalues and is anothermeasure of orientationally averaged diffusion. The fractionalanisotropy (FA) and relative anisotropy (RA) indices measurethe degree of directionality of intravoxel diffusivity:
11) FA ����1 � �2
2 � ��2 � �32 � ��3 � �1
2
�2��12 � �2
2 � �32
12) RA ����1 � �2
2 � ��2 � �32 � ��3 � �1
2
�1 � �2 � �3.
FA and RA can both also be defined by equivalent formulaswhere the numerators are expressed in terms of the differenceof each eigenvalue from the mean diffusivity:
13)
FA � �3
2
���1 � Dav2 � ��2 � Dav
2 � ��3 � Dav2
��12 � �2
2 � �32
14)
RA ����1 � Dav
2 � ��2 � Dav2 � ��3 � Dav
2
�3Dav
.
When the primary eigenvalue is much larger than the sec-ond and third eigenvalues, anisotropy measures such as FAand RA will be high, indicating a preferred direction of diffu-sion. This corresponds to a prolate (cigar) shape of the diffu-
sion ellipsoid (Fig 4, right column), with the preferred direc-tion of diffusion indicated by the long axis of the ellipsoid or,equivalently, by the primary eigenvector of the tensor. In thebrain, prolate diffusion within a voxel usually indicates a singlecoherently organized white matter fiber bundle, with the ax-onal orientation coincident with the primary eigenvector. FAhas become by far the most widely used measure of anisotropyin the DTI literature, and its value varies from zero, in the caseof isotropic diffusion, up to a maximum of 1, indicating per-fectly linear diffusion occurring only along the primary eigen-vector. The fiber orientation information inherent in the pri-mary eigenvector can be visualized on 2D images by assigninga color to each of 3 mutually orthogonal axes,84 typically red toleft-right, green to anteroposterior, and blue to up-down (Fig5, bottom right).
DTI Fiber Tracking: MethodologyThe objective of DTI fiber tracking is to determine intervoxelconnectivity on the basis of the anisotropic diffusion of wa-ter.34-36,85,86 The clinical and scientific utility of DTI fibertracking is found in both the localization and the quantitativeassessment of specific neuronal pathways, as applied to basicneuroscience,87 cognitive neuroscience,88,89 and diagnosticneuroradiology.90-92 In each brain voxel, the dominant direc-tion of axonal tracts can be assumed to be parallel to the pri-mary eigenvector of the diffusion tensor. Fiber tracking usesthe diffusion tensor of each voxel to follow an axonal tract in3D from voxel to voxel through the human brain. Because DTIprovides only microstructural information at relatively lowspatial resolution, DTI fiber tracking is often combined withfunctional and/or higher resolution anatomic information todelineate specific pathways.34,91,93 In this way, 3D DTI tractog-
Fig 5. Top row: The first, second, and third eigenvalues areshown with the same intensity scaling. Note that the eigen-values are always ordered in descending order of intensity withthe first eigenvalue being the greatest. Bottom left: The direc-tionally averaged diffusivity is the mean of the 3 eigenvalues.Bottom middle: The FA indicates the coherence of white matterbundles. Bottom right: The FA map can be colorized to show theorientation of the primary eigenvector with left-to-right orientedaxonal fibers green, anterior-to-posterior fibers red, and inferi-or-to-superior fibers blue. Colors are additively mixed to repre-sent fiber populations oriented between these 3 cardinal axes.
6 Mukherjee � AJNR ● � ● 2008 � www.ajnr.org

raphy has opened up a whole new dimension to the ability todepict human neuroanatomy noninvasively. This new ana-tomic connectivity information has been summarized in re-view articles,94,95 as well as presented in a book-length DTIatlas.96
DTI fiber tracking algorithms can be divided into deter-ministic and probabilistic methods. Fiber assignment by con-tinuous tracking (FACT) is a deterministic method, which ini-tiates fiber trajectories from user-defined voxels (Fig 6).35
Fiber trajectories, also known as “streamlines”, follow the pri-mary eigenvector from voxel to voxel in 3 dimensions. Whenthe fiber trajectory reaches the edge of the voxel, the directionof the trajectory is changed to match the primary eigenvectorof the next voxel. Constraints on the maximum turning angleof the streamline between voxels and on the minimum FAwithin a voxel for propagation of the streamline can be appliedto contain the fiber tracks to regions of the brain where thediffusion tensor model realistically represents the white matterpathways. Figure 7 shows how user-defined regions of interest,based on prior anatomic knowledge, can be used to restrictfiber tracks to the corticospinal tract.34 This multiple region-of-interest technique for isolating anatomically specific fiberpathways by using DTI tractography has been called “virtualdissection”.97
Noise, patient movement, and distortion from imagingartifacts produce uncertainty in the orientation of the dif-fusion ellipsoid and are detrimental to deterministicstreamline fiber tracking.98,99 Probabilistic fiber trackingmethods incorporate the expected uncertainty into thetracking algorithm and can be used to produce a connec-tivity metric for each voxel. The probability density func-tion of the orientation of a neuronal fiber can be estimatedwith an empiric function based on the FA,86 a Bayesianmodel,100 or bootstrap statistics.101 Probabilistic DTI fibertracking techniques tend to disperse trajectories more thandeterministic methods and have the potential to delineate agreater portion of a white matter tract. However, the accu-racy of these probabilistic methods is still limited by theinformation contained in the diffusion tensor and themethod of constructing the probability density function.Another fundamental limitation of diffusion tractography
is that it cannot distinguish antegrade from retrogradealong a fiber pathway, due to the antipodal symmetry in-herent to the diffusion process.
DTI Fiber Tracking: Clinical ApplicationsThe visualization of an entire white matter tract in 3D hasclinical and scientific value for detecting gross changes to theanatomic course and the microstructural integrity of specificpathways. DTI has recently been used to identify and charac-terize novel defects in axonal growth and guidance in devel-opmental disorders, such as the absence of normally decussat-ing pontocerebellar fibers in horizontal gaze palsy withprogressive scoliosis due to mutation of the ROBO3 gene102
and the ectopic location of pontocerebellar fibers in pontinetegmental cap dysplasia.103 An aberrant fiber pathway knownas the “asymmetric sigmoid bundle” was first identified withDTI fiber tracking in individuals with dysgenesis of the corpuscallosum.104,105 Brain tumors and other intracranial mass le-sions are capable of dramatically altering the position of thecorticospinal tract; hence, knowledge of the location of thisimportant tract within deep white matter is critical for resect-ing mass lesions without postoperative motor deficit (Fig8).90-92,106 DTI fiber tracks can be used in conjunction withstereotactic navigation to identify a safety margin of approxi-mately 1 cm around the motor tract, which can be used forsurgical planning.107,108
In addition to basic 3D visualization, many studies haveused fiber tracking to delineate specific white matter tracts forquantitative analysis. Quantitative DTI tractography studieshave examined the microstructure of white matter tracts inpediatric subjects,109-112 in elderly subjects,113 and in patientswith schizophrenia,114 brain tumors,115 Alzheimer disease,116
and many other disorders. DTI fiber tracking can objec-tively create 3D regions of interest specific to an entirewhite matter tract. However, most white matter tracts haveheterogeneous structural characteristics, and fiber trackingcan be used to segment a pathway into several regions forquantitative analysis. Figure 9 shows the optic radiations ina premature infant color-coded according to the underly-ing FA values in the voxels contained within the tracts. Theanterior portion of the optic radiation adjacent to the thal-amus was observed to have significantly higher FA than theposterior portions of the tract.117 The spatial and temporalheterogeneity of DTI metrics has also been observed withfiber tracking of sensorimotor tracts in premature infants,indicating the maturation of the delineated tract and theemergence of other tracts crossing the sensorimotor path-way in the centrum semiovale.111
ConclusionThis review article has explored the theoretic backgroundneeded to understand clinical DWI and DTI, including fibertractography, and their application to neuroradiology. Thesediffusion MR imaging techniques provide microstructural in-formation about biologic tissues that is not available fromother imaging techniques. In the central nervous system, thishas yielded important new tools for diagnosis in ischemia,infection, tumors, and demyelinating disease, among otherpathologies, as well as for presurgical mapping of white matterpathways to avoid postoperative injury.
Fig 6. Schematic demonstrating the FACT algorithm. Arrows represent primary eigenvec-tors in each voxel. Red lines are FACT trajectories.
AJNR Am J Neuroradiol ● :● � ● 2008 � www.ajnr.org 7

However, even as sophisticated a mathematic construct asthe diffusion tensor is an oversimplification of the propertiesof water diffusion in the brain. The limitations of the diffusiontensor in areas of complex white matter architecture, wherefiber tracts intersect, branch, or are otherwise partial volumeaveraged within a voxel, affect the ability of DTI fiber tractog-raphy to fully delineate an axonal pathway and may also leadto the generation of spurious tracks.95 Measurements of quan-titative DTI parameters such as FA are also difficult or impos-sible to interpret in regions of complex white matter. Theseproblems have led to the introduction of more advancedmethods such as high angular resolution diffusion imaging118-120
and diffusion spectrum imaging,121 which promise to over-come many of the inadequacies of the tensor model. Thesenewer methods take better advantage of ongoing technical de-velopments, including the synergistic combination of ultra-high field diffusion122 with highly accelerated parallel imag-ing,123-125 and lead to new scientific and clinical applications
such as probabilistic tractography126-128 and whole-brain con-nectivity networks.129 Hence, these newer techniques thattranscend the diffusion tensor are likely to be adopted in clin-ical neuroradiology during the years to come.
References1. Einstein A. Investigations on the Theory of the Brownian Movement. New York:
Dover; 19562. Le Bihan D, Breton E, Lallemand D, et al. MR imaging of intravoxel incoherent
motions: application to diffusion and perfusion in neurologic disorders. Radiol-ogy 1986;161:401–07
3. Le Bihan D, Breton E, Lallemand D, et al. Separation of diffusion and perfusion inintravoxel incoherent motion MR imaging. Radiology 1988;168:497–505
4. Thomsen C, Henriksen O, Ring P. In vivo measurement of water self diffusion inthe human brain by magnetic resonance imaging. Acta Radiol 1987;28:353–61
5. Turner R, Le Bihan D, Maier J, et al. Echo-planar imaging of intravoxel incoher-ent motion. Radiology 1990;177:407–14
6. Moseley ME, Cohen Y, Mintorovitch J, et al. Early detection of regional cerebralischemia in cats: comparison of diffusion- and T2-weighted MRI and spectros-copy. Magn Reson Med 1990;14:330–46
7. Chien D, Kwong KK, Gress DR, et al. MR diffusion imaging of cerebral infarctionin humans. AJNR Am J Neuroradiol 1992;13:1097–102, discussion 1103–05
8. Warach S, Chien D, Li W, et al. Fast magnetic resonance diffusion-weightedimaging of acute human stroke. Neurology 1992;42:1717–23. Erratum in: Neurol-ogy 1992;42:2192
9. Marks MP, De Crespigny A, Lentz D, et al. Acute and chronic stroke: navigatedspin-echo diffusion-weighted MR imaging. Radiology 1996;199:403–08
10. Gonzalez RG, Schaefer PW, Buonanno FS, et al. Diffusion-weighted MR imaging:diagnostic accuracy in patients imaged within 6 hours of stroke symptom onset.Radiology 1999;210:155–62
11. Ebisu T, Naruse S, Horikawa Y, et al. Discrimination between different types ofwhite matter edema with diffusion-weighted MR imaging. J Magn Reson Imaging1993;3:863–68
Fig 7. Multiple regions of interest are used with the FACTalgorithm to delineate the corticospinal tract. Left: Fiber tracks(red) are generated from a region drawn in the cerebral pedun-cle (yellow voxels). Middle: Streamlines also passing through aregion drawn in the posterior limb of the internal capsule (greenvoxels) are retained. Right: The final set of streamlines mostclosely corresponding to the corticospinal tract passes throughthe centrum semiovale (blue) in addition to the internal capsuleand cerebral peduncle regions.
Fig 8. DTI fiber tracks reveal the course of the corticospinal tract along the border of a braintumor (blue). Streamlines were launched from wrist (green) and shoulder (red) motorstimulation sites on the cortex. The wrist and shoulder motor streamlines twist about eachother as they descend from the cortex through the internal capsule to the cerebralpeduncle.
Fig 9. DTI fiber tracks of the optic radiation in a 35-week gestational age premature infant.Streamlines were generated with the FACT algorithm and are colored according to theunderlying FA in the voxels that the streamlines pass through. The proximal segment of theoptic radiations, near the lateral geniculate nucleus, has the highest anisotropy.
8 Mukherjee � AJNR ● � ● 2008 � www.ajnr.org

12. Schaefer PW, Buonanno FS, Gonzalez RG, et al. Diffusion-weighted imaging dis-criminates between cytotoxic and vasogenic edema in a patient with eclampsia.Stroke 1997;28:1082–85
13. Schwartz R, Mulkern R, Gudbjartsson H, et al. Diffusion-weighted MR imaging inhypertensive encephalopathy: clues to pathogenesis. AJNR Am J Neuroradiol1998;19:859–62
14. Ay H, Buonanno FS, Schaefer PW, et al. Posterior leukoencephalopathy withoutsevere hypertension: utility of diffusion-weighted MRI. Neurology.1998;51:1369–76
15. Mukherjee P, McKinstry RC. Reversible posterior leukoencephalopathysyndrome: evaluation with diffusion-tensor MR imaging. Radiology2001;219:756–65
16. Provenzale JM, Petrella JR, Cruz LCH Jr, et al. Quantitative assessment of diffu-sion abnormalities in posterior reversible encephalopathy syndrome. AJNRAm J Neuroradiol. 2001;22:1455–61
17. Arfanakis K, Haughton VM, Carew JD, et al. Diffusion tensor MR imaging indiffuse axonal injury. AJNR Am J Neuroradiol. 2002;23:794–802
18. Hergan K, Schaefer PW, Sorensen AG, et al. Diffusion-weighted MRI in diffuseaxonal injury of the brain. Eur Radiol 2002;12:2536–41
19. Huisman TA, Sorensen AG, Hergan K, et al. Diffusion-weighted imaging for theevaluation of diffuse axonal injury in closed head injury. J Comput Assist Tomogr2003;27:5–11
20. Tien R, Felseberg G, Friedman H, et al. MR imaging of high-grade cerebralgliomas: value of diffusion-weighted echoplanar pulse sequences. AJR Am JRoentgenol 1994;162:671–77
21. Brunberg J, Chenevert T, McKeever P, et al. In vivo MR determination of waterdiffusion coefficients and diffusion anisotropy: correlation with structural alter-ation in gliomas of the cerebral hemispheres. AJNR Am J Neuroradiol.1995;16:361–71
22. Krabbe K, Gideon P, Wagn P, et al. MR diffusion imaging of human intracranialtumours. Neuroradiology 1997;39:483–89
23. Gauvain KM, McKinstry RC, Mukherjee P, et al. Evaluating pediatric brain tumorcellularity with diffusion-tensor imaging. AJR Am J Roentgenol 2001;177:449–54
24. Kono K, Inoue Y, Nakayama K, et al. The role of diffusion-weighted imaging inpatients with brain tumors. AJNR Am J Neuroradiol 2001;22:1081–88
25. Guo AC, Cummings TJ, Dash RC, et al. Lymphomas and high-gradeastrocytomas: comparison of water diffusibility and histologic characteristics.Radiology 2002;224:177–83
26. Chenevert TL, Sundgren PC, Ross BD. Diffusion imaging: insight to cell statusand cytoarchitecture. Neuroimaging Clin N Am 2006;16:619–32
27. Lu S, Ahn D, Johnson G, et al. Peritumoral diffusion tensor imaging of high-grade gliomas and metastatic brain tumors. AJNR Am J Neuroradiol2003;24:937–41
28. Smith JS, Cha S, Mayo MC, et al. Serial diffusion-weighted magnetic resonanceimaging in cases of glioma: distinguishing tumor recurrence from postresectioninjury. J Neurosurg 2005;103:428–38
29. EbisuT,TanakaC,UmedaM,etal. Discrimination of brain abscess from necroticor cystic tumors by diffusion-weighted echo planar imaging. Magn Reson Imag-ing 1996;14:1113–6
30. Kim Y, Chang K, Kim H, et al. Brain abscess and necrotic or cystic brain tumor:discrimination with signal intensity on diffusion-weighted MR imaging. AJRAm J Roentgenol 1998;171:1487–90
31. Leuthardt EC, Wippold FJ 2nd, Oswood MC, et al. Diffusion-weighted MR imag-ing in the preoperative assessment of brain abscesses. Surg Neurol2002;58:395–402
32. Basser PJ, Mattiello J, Le Bihan D. Estimation of the effective self-diffusion-tensorfrom the NMR spin echo. J Magn Reson B 1994;103:247–54
33. Pierpaoli C, Jezzard P, Basser PJ, et al. Diffusion tensor MR imaging of the humanbrain. Radiology 1996;201:637–48
34. Conturo TE, Lori NF, Cull TS, et al. Tracking neuronal fiber pathways in theliving human brain. Proc Natl Acad Sci U S A 1999;96:10422–27
35. Mori S, Kaufmann WE, Pearlson GD, et al. Three-dimensional tracking of axonalprojections in the brain by magnetic resonance imaging. Ann Neurol1999;45:265–69
36. Basser PJ, Pajevic S, Pierpaoli C, et al. In vivo fiber tractography using DT-MRIdata. Magn Reson Med 2000;44:625–32
37. StejskalEO,Tanner JE. Spin diffusion measurements: spin echoes in the presenceof a time-dependent field gradient. J Chem Phys 1965;42:288–92
38. Huppi PS, Maier SE, Peled S, et al. Microstructural development of human new-born cerebral white matter assessed in vivo by diffusion tensor magnetic reso-nance imaging. Pediatr Res 1998;44:584–90
39. Neil JJ, Shiran SI, McKinstry RC, et al. Normal brain in human newborns: appar-ent diffusion coefficient and diffusion anisotropy measured by using diffusiontensor MR imaging. Radiology 1998;209:57–66
40. DeLano MC, Cao Y. High b-value diffusion imaging. Neuroimaging Clin N Am2002;12:21–34
41. Kim HJ, Choi CG, Lee DH, et al. High-b-value diffusion-weighted MR imaging ofhyperacute ischemic stroke at 1.5T. AJNR Am J Neuroradiol 2005;26:208–15
42. Chen PE, Simon JE, Hill MD, et al. Acute ischemic stroke: accuracy of diffusion-weighted MR imaging— effects of b value and cerebrospinal fluid suppression.Radiology 2006;238:232–39
43. Maldjian JA, Listerud J, Moonis G, et al. Computing diffusion rates in T2-darkhematomas and areas of low T2 signal. AJNR Am J Neuroradiol 2001;22:112–18
44. Mulkern RV, Gudbjartsson H, Westin CF, et al. Multi-component apparent dif-fusion coefficients in human brain. NMR Biomed 1999;12:51–62
45. Mulkern RV, Vajapeyam S, Robertson RL, et al. Biexponential apparent diffusioncoefficient parameterization in adult vs newborn brain. Magn Reson Imaging2001;19:659–68
46. Provenzale JM, Engelter ST, Petrella JR, et al. Use of MR exponential diffusion-weighted images to eradicate T2 “shine-through” effect. AJR Am J Roentgenol1999;172:537–39
47. Shimony JS, McKinstry RC, Akbudak E, et al. Quantitative diffusion-tensor an-isotropy brain MR imaging: normative human data and anatomic analysis. Ra-diology 1999;212:770–84
48. Sorensen AG, Wu O, Copen WA, et al. Human acute cerebral ischemia: detectionof changes in water diffusion anisotropy by using MR imaging. Radiology1999;212:785–92
49. Chenevert TL, Brunberg JA, Pipe JG. Anisotropic diffusion in human whitematter: demonstration with MR techniques in vivo. Radiology 1990;177:401–05
50. Mukherjee P, Miller JH, Shimony JS, et al. Normal brain maturation duringchildhood: developmental trends characterized with diffusion-tensor MR imag-ing. Radiology 2001;221:349–58
51. Mukherjee P, McKinstry RC. Diffusion tensor imaging and tractography of hu-man brain development. Neuroimaging Clin N Am 2006;16:19–43
52. Mukherjee P, Miller JH, Shimony JS, et al. Diffusion-tensor MR imaging of grayand white matter development during normal human brain maturation. AJNRAm J Neuroradiol 2002;23:1445–56
53. McGraw P, Liang L, Provenzale JM. Evaluation of normal age-related changes inanisotropy during infancy and childhood as shown by diffusion tensor imaging.AJR Am J Roentgenol 2002;179:1515–22
54. Schneider JF, Il’yasov KA, Hennig J, et al. Fast quantitative diffusion-tensor im-aging of cerebral white matter from the neonatal period to adolescence. Neuro-radiology 2004;46:258–66
55. Snook L, Paulson LA, Roy D, et al. Diffusion tensor imaging of neurodevelop-ment in children and young adults. Neuroimage 2005;26:1164–73
56. Hermoye L, Saint-Martin C, Cosnard G, et al. Pediatric diffusion tensor imaging:normal database and observation of the white matter maturation in early child-hood. Neuroimage 2006;29:493–504
57. Gideon P, Thomsen C, Henriksen O. Increased self-diffusion of brain water innormal aging. J Magn Reson Imaging 1994;4:185–88
58. Chun T, Filippi CG, Zimmerman RD, et al. Diffusion changes in the aging humanbrain. AJNR Am J Neuroradiol 2000;21:1078–83
59. Engelter ST, Provenzale JM, Petrella JR, et al. The effect of aging on the apparentdiffusion coefficient of normal-appearing white matter. AJR Am J Roentgenol2000;175:425–30
60. Chen ZG, Li TQ, Hindmarsh T. Diffusion tensor trace mapping in normal adultbrain using single-shot EPI technique: a methodological study of the agingbrain. Acta Radiol 2001;42:447–558
61. Nusbaum AO, Tang CY, Buchsbaum MS, et al. Regional and global changes incerebral diffusion with normal aging. AJNR Am J Neuroradiol 2001;22:136–42
62. Moseley ME. Diffusion tensor imaging and aging: a review. NMR Biomed2002;15:553–60
63. Sotak CH. Nuclear magnetic resonance (NMR) measurement of the apparentdiffusion coefficient (ADC) of tissue water and its relationship to cell volumechanges in pathological states. Neurochem Int 2004;45:569–82
64. Duong TQ, Ackerman JJ, Ying HS, et al. Evaluation of extra- and intracellularapparent diffusion in normal and globally ischemic rat brain via 19F NMR.Magn Reson Med 1998;40:1–13
65. Mishra AM, Gupta RK, Saksena S, et al. Biological correlates of diffusivity in brainabscess. Magn Reson Med 2005;54:878–85
66. Tsuchiya K, Osawa A, Katase S, et al. Diffusion-weighted MRI of subdural andepidural empyemas. Neuroradiology 2003;45:220–23
67. Pezzullo JA, Tung GA, Mudigonda S, et al. Diffusion-weighted MR imaging ofpyogenic ventriculitis. AJR Am J Roentgenol 2003;180:71–75
68. Tsuruda JS, Chew WM, Moseley ME, et al. Diffusion-weighted MR imaging of thebrain: value of differentiating between extraaxial cysts and epidermoid tumors.AJNR Am J Neuroradiol 1990;11:925–31, discussion 932–34
69. Tsuruda JS, Chew WM, Moseley ME, et al. Diffusion-weighted MR imaging ofextraaxial tumors. Magn Reson Med 1991;19:316–20
70. Uhl M, Altehoefer C, Kontny U, et al. MRI-diffusion imaging of neuroblastomas:first results and correlation to histology. Eur Radiol 2002;12:2335–38. Epub 2002Mar 19
71. Erdem E, Zimmerman RA, Haselgrove JC, et al. Diffusion-weighted imaging andfluid attenuated inversion recovery imaging in the evaluation of primitive neu-roectodermal tumors. Neuroradiology 2001;43:927–33
72. Hartmann M, Jansen O, Heiland S, et al. Restricted diffusion within ring en-hancement is not pathognomonic for brain abscess. AJNR Am J Neuroradiol2001;22:1738–42
73. Mader I, Wolff M, Niemann G, et al. Acute haemorrhagic encephalomyelitis(AHEM): MRI findings. Neuropediatrics 2004;35:143–46
74. Sagar P, Grant PE. Diffusion-weighted MR imaging: pediatric clinical applica-tions. Neuroimaging Clin N Am 2006;16:45–74
AJNR Am J Neuroradiol ● :● � ● 2008 � www.ajnr.org 9
75. Sener RN. Diffusion magnetic resonance imaging patterns in metabolic andtoxic brain disorders. Acta Radiol 2004;45:561–70
76. Teksam M, Casey SO, Michel E, et al. Diffusion-weighted MR imaging findings incarbon monoxide poisoning. Neuroradiology 2002;44:109–13
77. Sandoval C, Kutscher M, Jayabose S, et al. Neurotoxicity of intrathecalmethotrexate: MR imaging findings. AJNR Am J Neuroradiol 2003;24:1887–90
78. McKinney AM, Filice RW, Teksam M, et al. Diffusion abnormalities of the globipallidi in manganese neurotoxicity. Neuroradiology 2004;46:291–95
79. Bahn M, Kido D, Lin W, et al. Brain magnetic resonance diffusion abnormalitiesin Creutzfeldt-Jakob disease. Arch Neurol 1997;54:1411–15
80. Demaerel P, Baert AL, Vanopdenbosch L, et al. Diffusion-weighted magnetic res-onance imaging in Creutzfeldt-Jakob disease. Lancet 1997;349:847–48
81. Bahn MM, Parchi P. Abnormal diffusion-weighted magnetic resonance imagesin Creutzfeldt-Jakob disease. Arch Neurol 1999;56:577–83
82. Demaerel P, Heiner L, Robberecht W, et al. Diffusion-weighted MRI in sporadicCreutzfeldt-Jakob disease. Neurology 1999;52:205–08
83. Basser PJ, Mattiello J, LeBihan D. MR diffusion tensor spectroscopy and imaging.Biophys J 1994;66:259–67
84. Pajevic S, Pierpaoli C. Color schemes to represent the orientation of anisotropictissues from diffusion tensor data: application to white matter fiber tract map-ping in the human brain. Magn Reson Med 1999;42:526–40. Erratum in: MagnReson Med 2000;43:921
85. Gossl C, Fahrmeir L, Putz B, et al. Fiber tracking from DTI using linear state spacemodels: detectability of the pyramidal tract. Neuroimage 2002;16:378–88
86. Parker GJ, Haroon HA, Wheeler-Kingshott CA. A framework for a streamline-based probabilistic index of connectivity (PICo) using a structural interpreta-tion of MRI diffusion measurements. J Magn Reson Imaging 2003;18:242–54
87. Mori S, Zhang J. Principles of diffusion tensor imaging and its applications tobasic neuroscience research. Neuron 2006;51:527–39
88. ffytche DH, Catani M. Beyond localization: from hodology to function. PhilosTrans R Soc Lond B Biol Sci 2005;360:767–79
89. Catani M. Diffusion tensor magnetic resonance imaging tractography in cogni-tive disorders. Curr Opin Neurol 2006;19:599–606
90. Holodny AI, Schwartz TH, Ollenschleger M, et al. Tumor involvement of thecorticospinal tract: diffusion magnetic resonance tractography with intraoper-ative correlation. J Neurosurg 2001;95:1082
91. Berman JI, Berger MS, Mukherjee P, et al. Diffusion-tensor imaging-guidedtracking of fibers of the pyramidal tract combined with intraoperative corticalstimulation mapping in patients with gliomas. J Neurosurg 2004;101:66–72
92. Nimsky C, Ganslandt O, Hastreiter P, et al. Preoperative and intraoperative dif-fusion tensor imaging-based fiber tracking in glioma surgery. Neurosurgery2005;56:130–37
93. Guye M, Parker GJ, Symms M, et al. Combined functional MRI and tractographyto demonstrate the connectivity of the human primary motor cortex in vivo.Neuroimage 2003;19:1349–60
94. Wakana S, Jiang H, Nagae-Poetscher LM, et al. Fiber tract-based atlas of humanwhite matter. Radiology 2004;230:77–87
95. Hess CP, Mukherjee P. Visualizing white matter pathways in the living humanbrain: diffusion tensor imaging and beyond. Neuroimaging Clin N Am2007;17:407–26
96. Mori S, Wakana S, Nagae-Poetscher LM, et al. MRI Atlas of Human White Matter.Amsterdam: Elsevier; 2005
97. Catani M, Howard RJ, Pajevic S, et al. Virtual in vivo interactive dissection ofwhite matter fasciculi in the human brain. Neuroimage 2002;17:77–94
98. Anderson AW. Theoretical analysis of the effects of noise on diffusion tensorimaging. Magn Reson Med 2001;46:1174–88
99. Lazar M, Alexander AL. An error analysis of white matter tractography methods:synthetic diffusion tensor field simulations. Neuroimage 2003;20:1140–53
100. Behrens TE, Woolrich MW, Jenkinson M, et al. Characterization and propaga-tion of uncertainty in diffusion-weighted MR imaging. Magn Reson Med2003;50:1077–88
101. Lazar M, Alexander AL. Bootstrap white matter tractography (BOOT-TRAC).Neuroimage 2005;24:524–32. Epub 2004 Nov 24
102. Sicotte NL, Salamon G, Shattuck DW, et al. Diffusion tensor MRI shows abnor-mal brainstem crossing fibers associated with ROBO3 mutations. Neurology2006;67:519–21
103. Barth PG, Majoie CB, Caan MW, et al. Pontine tegmental cap dysplasia: a novelbrain malformation with a defect in axonal guidance. Brain 2007;130 (Pt 9):2258–66. Epub 2007 Aug 9
104. Tovar-Moll F, Moll J, de Oliveira-Souza R, et al. Neuroplasticity in human callosaldysgenesis: a diffusion tensor imaging study. Cereb Cortex 2007;17:531–41
105. Paul LK, Brown WS, Adolphs R, et al. Agenesis of the corpus callosum: genetic,
developmental and functional aspects of connectivity. Nat Rev Neurosci2007;8:287–99
106. Hendler T, Pianka P, Sigal M, et al. Delineating gray and white matter involve-ment in brain lesions: three-dimensional alignment of functional magnetic res-onance and diffusion-tensor imaging. J Neurosurg 2003;99:1018–27
107. Bello L, Gambini A, Castellano A, et al. Motor and language DTI fiber trackingcombined with intraoperative subcortical mapping for surgical removal of glio-mas. Neuroimage 2008;39:369–82. Epub 2007 Aug 29
108. Berman JI, Berger MS, Chung SW, et al. Accuracy of diffusion tensor magneticresonance imaging tractography assessed using intraoperative subcortical stim-ulation mapping and magnetic source imaging. J Neurosurg 2007;107:488–94
109. Glenn OA, Henry RG, Berman JI, et al. DTI-based three-dimensional tractogra-phy detects differences in the pyramidal tracts of infants and children with con-genital hemiparesis. J Magn Reson Imaging 2003;18:641–48
110. Partridge SC, Mukherjee P, Berman JI, et al. Tractography-based quantitation ofdiffusion tensor imaging parameters in white matter tracts of preterm new-borns. J Magn Reson Imaging 2005;22:467–74
111. Berman JI, Mukherjee P, Partridge SC, et al. Quantitative diffusion tensor MRIfiber tractography of sensorimotor white matter development in premature in-fants. Neuroimage 2005;27:862–71
112. Dubois J, Hertz-Pannier L, Dehaene-Lambertz G, et al. Assessment of the earlyorganization and maturation of infants’ cerebral white matter fiber bundles: afeasibility study using quantitative diffusion tensor imaging and tractography.Neuroimage 2006;30:1121–32
113. Sullivan EV, Adalsteinsson E, Pfefferbaum A. Selective age-related degradation ofanterior callosal fiber bundles quantified in vivo with fiber tracking.CerebCortex2006;16:1030–39
114. Jones DK, Catani M, Pierpaoli C, et al. Age effects on diffusion tensor magneticresonance imaging tractography measures of frontal cortex connections inschizophrenia. Hum Brain Mapp 2006;27:230–38
115. Roberts TP, Liu F, Kassner A, et al. Fiber density index correlates with reducedfractional anisotropy in white matter of patients with glioblastoma. AJNR Am JNeuroradiol 2005;26:2183–86
116. Taoka T, Iwasaki S, Sakamoto M, et al. Diffusion anisotropy and diffusivity ofwhite matter tracts within the temporal stem in Alzheimer disease: evaluation ofthe “tract of interest” by diffusion tensor tractography. AJNR Am J Neuroradiol2006;27:1040–45
117. Berman JI, Glass HC, Miller SP, et al. Quantitative Fiber Tracking Analysis of theOptic Radiations in Premature Newborns. Proceedings of the Fifteenth AnnualMeeting of the International Society of Magnetic Resonance in Medicine, Berlin, Ger-many, May 19-25, 2007
118. Tuch DS, Reese TG, Wiegell MR, et al. Diffusion MRI of complex neural archi-tecture. Neuron 2003;40:885–95
119. Tournier JD, Calamante F, Gadian DG, et al. Direct estimation of the fiber orien-tation density function from diffusion-weighted MRI data using spherical de-convolution. Neuroimage 2004;23:1176–85
120. Hess CP, Mukherjee P, Han ET, et al. Q-ball reconstruction of multimodal fiberorientations using the spherical harmonic basis. Magn Reson Med2006;56:104–17
121. Wedeen VJ, Hagmann P, Tseng WY, et al. Mapping complex tissue architecturewith diffusion spectrum magnetic resonance imaging. Magn Reson Med2005;54:1377–86
122. Mukherjee P, Hess CP, Xu D, et al. Development and initial evaluation of 7-Tq-ball imaging of the human brain. Magn Reson Imaging 2008; 26:171-80. Epub2007 Aug 9
123. Ohliger MA, Grant AK, Sodickson DK. Ultimate intrinsic signal-to-noise ratiofor parallel MRI: electromagnetic field considerations. Magn Reson Med2003;50:1018–30
124. Wiesinger F, Van de Moortele PF, Adriany G, et al. Parallel imaging performanceas a function of field strength: an experimental investigation using electrody-namic scaling. Magn Reson Med 2004;52:953–64
125. Wiesinger F, Van de Moortele PF, Adriany G, et al. Potential and feasibility ofparallel MRI at high field. NMR Biomed 2006;19:368–78
126. Behrens TE, Berg HJ, Jbabdi S, et al. Probabilistic diffusion tractography withmultiple fibre orientations: what can we gain? Neuroimage 2007;34:144–55. Epub2006 Oct 27
127. Dyrby TB, Søgaard LV, Parker GJ, et al. Validation of in vitro probabilistic trac-tography. Neuroimage 2007;37:1267–77
128. Berman JI, Chung S, Mukherjee P, et al. Probabilistic streamline q-ball tractog-raphy using the residual bootstrap. Neuroimage 2008;39:215–22
129. Hagmann P, Kurant M, Gigandet X, et al. Mapping human whole-brain struc-tural networks with diffusion MRI. PLoS ONE 2007;2:e597
10 Mukherjee � AJNR ● � ● 2008 � www.ajnr.org