Embed Size (px)
Citation preview

1 UNDER REVIEW: DO NOT DISTRIBUTE
Diffusion Tensor Imaging of the Brain
Andrew L. Alexander *, †, ‡, §, Ph.D., Jee Eun Lee †,
‡, §, Ph.D., Aaron S. Field ¶, M.D., Ph.D., Departments of †Medical Physics, ‡Psychiatry, Radiology, ¶University of Wisconsin, Madison, WI §Waisman Laboratory for Brain Imaging and Behavior, Waisman Center, Madison, WI *Corresponding Author: Andrew L. Alexander, Ph.D. Waisman Laboratory for Brain Imaging and Behavior Waisman Center 1500 Highland Ave. Madison, WI 53705 Tel: (608)265-8233 Fax: (608)262-9440 e-mail: [email protected] Abstract Diffusion tensor imaging (DTI) is a promising method for characterizing microstructural changes or differences with neuropathology and treatment. The diffusion tensor may be used to characterize the magnitude, anisotropy and orientation of the diffusion tensor. This paper reviews the biological mechanisms, acquisition and analysis methodology of DTI measurements. The relationships between DTI measures and white matter pathologic features (ischemia, myelination, axonal damage, inflammation, and edema) are summarized. Applications of DTI to tissue characterization in neurotherapeutic applications are reviewed. The interpretations of common DTI measures – mean diffusivity (MD), fractional anisotropy (FA), radial diffusivity (Dr) and axial diffusivity (Da) – are discussed. In particular, FA is highly sensitive to microstructural changes, but not very specific to the type of changes (e.g., radial or axial). In order to maximize the specificity, it is recommended that future studies use multiple diffusion tensor measures (e.g., MD and FA, or Da and Dr) to better characterize the tissue microstructure.
Introduction
The broad spectrum of MR contrast mechanisms makes MRI one of the most powerful and flexible imaging tool for diagnosis in the CNS. Measurement of the signal attenuation from water diffusion is one of the most important contrast mechanisms. In particular, diffusion tensor imaging (DTI) may be used to map and characterize the
three-dimensional diffusion of water as a function of spatial location.1,2 The diffusion tensor describes the magnitude, the degree of anisotropy, and the orientation of diffusion anisotropy. Estimates of white matter connectivity patterns in the brain from white matter tractography may be obtained using the diffusion anisotropy and the principal diffusion directions.3-5
Many developmental, aging and pathological processes of the central nervous system influence the microstructural composition and architecture of the affected tissues. The diffusion of water within the tissues will be altered by changes in the tissue microstructure and organization; consequently, diffusion-weighted MRI methods including diffusion tensor imaging (DTI) are potentially powerful probes for characterizing the effects of disease and aging on microstructure. Indeed, the applications of DTI are rapidly increasing because it is highly sensitive changes at the cellular and microstructural level.
Methods for the acquisition and analysis of DTI are rapidly evolving. These improvements have greatly improved the accuracy of diffusion tensor measurements in recent years and further improvements are expected. New pulse sequences and diffusion tensor encoding schemes are continuously being developed to improve the spatial resolution and accuracy, and decrease artifacts in diffusion tensor measurements. The high dimensionality of the diffusion tensor presents both challenges and novel opportunities for describing, visualizing and analyzing the measurements.
In this paper, the principles, methodology, interpretation, and applications of diffusion tensor imaging will be reviewed. The strengths and weaknesses of the approach will be discussed and current extensions of the technology will be summarized.
Biological Diffusion
Diffusion is a random transport phenomenon, which describes the transfer of material (e.g., water molecules) from one spatial location to other locations over time. In three dimensions, the Einstein diffusion equation6:
tn2r
D2
∆
∆=
(1)
states that the diffusion coefficient, D (in mm2/s), is proportional to the mean squared-

2 UNDER REVIEW: DO NOT DISTRIBUTE
displacement, 2r∆ divided by the number of
dimensions, n, and the diffusion time, ∆t. The diffusion coefficient of pure water at 20oC is roughly 2.0 x 10⁻³mm2/s and increases at higher temperatures. In the absence of boundaries, the molecular water displacement is described by a Gaussian probability density
( ) ( ) { }tD4rtD21trP 23 ∆∆−∆=∆∆ exp, π (2)
The spread in this distribution increases with the diffusion time, ∆t, as illustrated in Figure 1.
Figure 1. Left: Illustration of the diffusion random-walk for a single water molecule from the green location to the red location. The displacement is shown by the yellow arrow. Right three frames: Diffusion describes the displacement probability with time for a group or ensemble of water molecules. For short diffusion times (e.g., τ1), the predicted spread is compact, but increases with longer diffusion times (τ2 and τ3).
The diffusion of water in biological tissues occurs inside, outside, around, and through cellular structures. Water diffusion is primarily caused by random thermal fluctuations. The behavior is further modulated by the interactions with cellular membranes, and subcellular and organelles. Cellular membranes hinder the diffusion of water, causing water to take more tortuous paths, thereby decreasing the mean squared displacement. The diffusion tortuosity and corresponding apparent diffusivity may be increased by either cellular swelling or increased cellular density. Conversely, necrosis, which results in a breakdown of cellular membranes, decreases tortuosity and increases the apparent diffusivity. Intracellular water tends to be more restricted (as opposed to hindered) by cellular membranes. Restricted diffusion also decreases the apparent diffusivity, but plateaus with increasing diffusion time.7 Both hindered and restricted diffusion reduce the apparent diffusivity of water.
In fibrous tissues including white matter, water diffusion is relatively unimpeded in the direction
parallel to the fiber orientation. Conversely, water diffusion is highly restricted and hindered in the directions perpendicular to the fibers. Thus, the diffusion in fibrous tissues is anisotropic. Early diffusion imaging experiments used measurements of parallel ( ||D ) and perpendicular ( ⊥D ) diffusion components to characterize the diffusion anisotropy.8,9
The application of the diffusion tensor to describe anisotropic diffusion behavior was introduced by Basser et al.1,2 In this elegant model, diffusion is described by a multivariate normal distribution
( )( )
∆∆∆−
∆=∆∆
−Τ
t4rr
t41trP
1
3
rrr D
Dexp,
π
(3)
where the diffusion tensor is a 3x3 covariance matrix
=
zzzyzx
yzyyyx
xzxyxx
DDDDDDDDD
D ,
(4)
which describes the covariance of diffusion displacements in 3D normalized by the diffusion time. The diagonal elements (Dii > 0) are the diffusion variances along the x, y and z axes, and the off-diagonal elements are the covariance terms and are symmetric about the diagonal (Dij = Dji). Diagonalization of the diffusion tensor yields the eigenvalues (λ1, λ2, λ3) and corresponding eigenvectors ( 321 ˆ,ˆ,ˆ eee ) of the diffusion tensor, which describe the directions and apparent diffusivities along the axes of principle diffusion. The diffusion tensor may be visualized using an ellipsoid with the eigenvectors defining the directions of the principle axes and the ellipsoidal radii defined by the eigenvalues (see Figure 2). Diffusion is considered isotropic when the eigenvalues are nearly equal (e.g., λ1 ~ λ2 ~ λ3). Conversely, the diffusion tensor is anisotropic when the eigenvalues are significantly different in magnitude (e.g., λ1 > λ2 > λ3). The eigenvalue magnitudes may be affected by changes in local tissue microstructure with many types of tissue injury, disease or normal physiological changes (i.e., aging). Thus, the diffusion tensor is an extremely sensitive probe for characterizing both normal and abnormal tissue microstructure.
3 UNDER REVIEW: DO NOT DISTRIBUTE
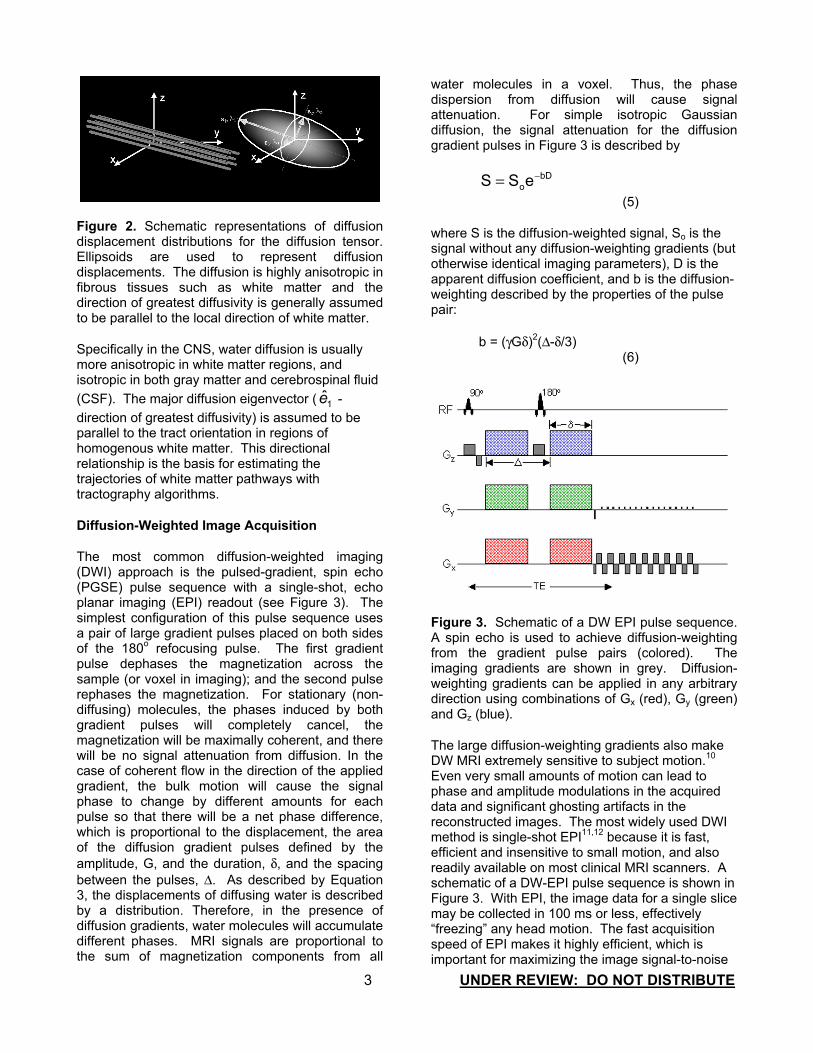
Figure 2. Schematic representations of diffusion displacement distributions for the diffusion tensor. Ellipsoids are used to represent diffusion displacements. The diffusion is highly anisotropic in fibrous tissues such as white matter and the direction of greatest diffusivity is generally assumed to be parallel to the local direction of white matter.
Specifically in the CNS, water diffusion is usually more anisotropic in white matter regions, and isotropic in both gray matter and cerebrospinal fluid (CSF). The major diffusion eigenvector ( 1e - direction of greatest diffusivity) is assumed to be parallel to the tract orientation in regions of homogenous white matter. This directional relationship is the basis for estimating the trajectories of white matter pathways with tractography algorithms.
Diffusion-Weighted Image Acquisition
The most common diffusion-weighted imaging (DWI) approach is the pulsed-gradient, spin echo (PGSE) pulse sequence with a single-shot, echo planar imaging (EPI) readout (see Figure 3). The simplest configuration of this pulse sequence uses a pair of large gradient pulses placed on both sides of the 180o refocusing pulse. The first gradient pulse dephases the magnetization across the sample (or voxel in imaging); and the second pulse rephases the magnetization. For stationary (non-diffusing) molecules, the phases induced by both gradient pulses will completely cancel, the magnetization will be maximally coherent, and there will be no signal attenuation from diffusion. In the case of coherent flow in the direction of the applied gradient, the bulk motion will cause the signal phase to change by different amounts for each pulse so that there will be a net phase difference, which is proportional to the displacement, the area of the diffusion gradient pulses defined by the amplitude, G, and the duration, δ, and the spacing between the pulses, ∆. As described by Equation 3, the displacements of diffusing water is described by a distribution. Therefore, in the presence of diffusion gradients, water molecules will accumulate different phases. MRI signals are proportional to the sum of magnetization components from all
water molecules in a voxel. Thus, the phase dispersion from diffusion will cause signal attenuation. For simple isotropic Gaussian diffusion, the signal attenuation for the diffusion gradient pulses in Figure 3 is described by
bDoeSS −=
(5)
where S is the diffusion-weighted signal, So is the signal without any diffusion-weighting gradients (but otherwise identical imaging parameters), D is the apparent diffusion coefficient, and b is the diffusion-weighting described by the properties of the pulse pair:
b = (γGδ)2(∆-δ/3) (6)
Figure 3. Schematic of a DW EPI pulse sequence. A spin echo is used to achieve diffusion-weighting from the gradient pulse pairs (colored). The imaging gradients are shown in grey. Diffusion-weighting gradients can be applied in any arbitrary direction using combinations of Gx (red), Gy (green) and Gz (blue).
The large diffusion-weighting gradients also make DW MRI extremely sensitive to subject motion.10 Even very small amounts of motion can lead to phase and amplitude modulations in the acquired data and significant ghosting artifacts in the reconstructed images. The most widely used DWI method is single-shot EPI11,12 because it is fast, efficient and insensitive to small motion, and also readily available on most clinical MRI scanners. A schematic of a DW-EPI pulse sequence is shown in Figure 3. With EPI, the image data for a single slice may be collected in 100 ms or less, effectively “freezing” any head motion. The fast acquisition speed of EPI makes it highly efficient, which is important for maximizing the image signal-to-noise

4 UNDER REVIEW: DO NOT DISTRIBUTE
ratio (SNR) and the accuracy of the diffusion measurements. Thus, single-shot EPI is the most common acquisition method for diffusion-weighted imaging. However, the disadvantages of single shot EPI can also be significant. First, both magnetic field inhomogeities13 and eddy currents14 can warp the image data, thereby compromising the spatial fidelity. The distortions from diffusion-gradient eddy currents cause misalignments in the diffusion-weighted images that can lead to subsequent errors in the calculated diffusion maps. These distortions can be described using a combination of translation, scaling and shear in the phase encoding direction.14,15 To a certain degree, the eddy currents may be reduced using bipolar diffusion-weighting schemes.16,17 The distortions may also be retrospectively corrected using image registration methods.14,18,19
The image distortion from magnetic field inhomogeneities cause the anatomy of the brain to be warped nonlinearly in the phase-encoding direction. These effects can be particularly severe in regions near bone/air/brain interfaces, such as the skull base, prefrontal areas and the inferior temporal lobe near the auditory canal. The degree of this distortion is related to the local field variations, the echo spacing or readout bandwidth of the sampling in the phase-encoding direction, the direction of phase encoding, and the field of view. These image distortions are proportional to the magnetic field strength so that the distortions at 3T can be quite severe. Unfortunately, nearly all published studies of DW-EPI do not use any form of distortion correction. EPI image distortion can be corrected by measuring a map of the magnetic field strength and correcting the images retrospectively.13 Field maps are estimated by measuring the phase difference between gradient echo image data at two different echo times. The acquisition of field map data covering the whole brain can easily be performed in 2-3 minutes. Field maps have been used to correct the EPI disortion in DTI data, which improves the correspondence to non-EPI anatomical image data. This is important for applications such as intraoperative surgical guidance and white matter tractography. Image distortions may also be decreased by a factor of 2-3 by using parallel imaging methods such as SENSE.20-22 Note that even though the level of distortion is decreased with parallel imaging, it is not completely eliminated and correction methods are still needed to improve geometric fidelity of diffusion imaging.
The spatial resolution of 2D EPI pulse sequences also tends to be limited. At 1.5T, it is possible to acquire 2.5 mm isotropic voxels over the entire
brain in roughly 15 minutes.23 Smaller voxel dimensions may be achieved using either more sensitive RF coils or by going to higher field strengths. A recent study by Alexander et al.21 demonstrated that the variance in DTI measures (FA and mean diffusivity) was roughly reduced by a factor of two at 3T relative to 1.5T although the distortions were greater at 3T.
.
Diffusion Tensor Encoding & Protocols
A minimum of six non-collinear diffusion encoding directions are required to measure the full diffusion tensor.24,25 A wide variety of diffusion-tensor encoding strategies with six or more encoding directions have been proposed.25-29 The selection of tensor encoding directions is critical for accurate and unbiased assessment of diffusion tensor measures. Hasan et al.29 performed a comprehensive comparison of various heuristic, numerically optimized and natural polyhedra encoding sets. This study demonstrated that encoding sets with uniform angular sampling yield the most accurate diffusion tensor estimates. Recent studies have provided mounting evidence that more diffusion encoding directions causes the measurement errors to be independent of the tensor orientation.30
Protocol Considerations: There are a number of considerations that should be made when prescribing a diffusion tensor protocol. This is moderately complicated by the wide spectrum of pulse sequence parameters that must be configured. As discussed above, diffusion-weighted, spin-echo, single-shot EPI is the most common pulse sequence for DTI. The optimum diffusion-weighting (also called b-value) for the brain is roughly between 700 and 1300 s/mm2 with a b-value of 1000 s/mm2 being most common. The selection of the number of encoding directions is dependant upon the availability of encoding direction sets, the desired scan time and the maximum number of images that can be obtained in a series. Measurements of diffusion anisotropy tend to be quite sensitive to image noise, which can also lead to biases in the anisotropy estimates.31The accuracy of DTI measures may be improved by either increasing the number of encoding directions or increasing the number of averages. Unfortunately, this increases the scan time for DTI data collection. The image SNR can also obviously be improved by using larger voxels, although this will increase partial volume averaging of tissues, which can lead to errors in the fits to the diffusion tensor model.32 The specific parameters

5 UNDER REVIEW: DO NOT DISTRIBUTE
for a protocol will depend upon the application. For many routine clinical applications (brain screening, stroke, brain tumors), a fairly coarse spatial resolution can be used with a small number of encoding directions. However, for applications requiring accurate quantification (i.e., quantifying changes in M.S. plaques, comparing DTI measures between different neurological or psychiatric groups, quantifying DTI measures in very small white matter tracts, or estimating white matter trajectories with white matter tractography) high spatial resolution is much more important and a large number of diffusion encoding directions or averaging is desirable. High quality DTI data with whole brain coverage, 2.5 mm isotropic resolution and 64 diffusion encoding directions may be obtained in approximately 15 minutes on clinical 1.5T scanners.23 Similar DTI data quality may be achieved in almost one quarter of the time at 3.0T, except the image distortions are roughly double.21
Diffusion Tensor Image Processing
Maps of DTI measures are estimated from the raw DW images. As discussed above, the images may be distorted and misregistered from a combination of eddy currents, subject motion, and magnetic field inhomogeneities. Ideally, these distortions and sources of misregistration should be corrected before calculating any subsequent quantitative diffusion maps. Methods for image correction and co-registration are discussed briefly above.
Calculation of Apparent Diffusivities and Diffusion Tensor Element Maps (Decoding): The first step is to estimate the apparent diffusivity maps, Di,app, for each encoding direction. Equation (5) has to be adjusted to describe the signal attenuation for anisotropic diffusion with the diffusion tensor:
appiiii Dbo
ggboi eSeSS ,ˆˆ −− ==
ΤD (7)
where Si is the DW signal in the ith encoding direction, ig is the unit vector describing the DW encoding direction, and bi is the amount of diffusion weighting in Equation (6). For the case of single diffusion-weighting (b-value) and an image with very little or no diffusion-weighting (So), the apparent diffusivity maps are estimated via:
( ) ( )
i
oiappi b
SSD lnln,
−=
(8)
Subsequently, the six independent elements of the diffusion tensor (Dxx, Dyy, Dzz, Dxy = Dyx, Dxz=Dzx, and Dyz=Dzy) may be estimated from the apparent diffusivities using multiple linear least squares methods1,29 or nonlinear modeling.33
Diffusion Tensor Image Measures
The display, meaningful measurement, and interpretation of 3D image data with a 3x3 diffusion matrix at each voxel is a challenging or impossible task without simplification of the data. Consequently, it is desirable to distill the image information into simpler scalar maps. The two most common measures are the trace and anisotropy of the diffusion tensor. The trace of the tensor (Tr), or sum of the diagonal elements of D, is a measure of the magnitude of diffusion and is rotationally invariant. The mean diffusivity, MD, (often called the apparent diffusion coefficient or ADC) is used in many published studies and is simply the trace divided by three (MD = Tr/3), which is equivalent to the average of the eigenvalues. The degree to which the diffusivities are a function of the DW encoding direction is represented by measures of diffusion anisotropy. Many measures of anisotropy have been described, most of which are rotationally invariant.34-38 Currently, the most widely used invariant measure of anisotropy is the Fractional Anisotropy (FA) described originally by Basser and Pierpaoli33
( ) ( ) ( )( )2
32
22
1
23
22
21
2MDMDMDFA
λλλλλλ
++−+−+−=
(8)
Note that the diffusion anisotropy does not describe the full tensor shape or distribution. This is because different eigenvalue combinations can generate the same values of FA.39 Although FA is likely to be adequate for many applications and appears to be quite sensitive to a broad spectrum of pathological conditions, the full tensor shape cannot be simply described using a single scalar measure.39 However, the tensor shape can be described completely using a combination of spherical, linear and planar shape measures.36,39
Several recent studies have also suggested that the eigenvalue amplitudes or combinations of the eigenvalues (e.g., the radial diffusivity, Dr = (λ2 + λ3)/2) demonstrate more specific relationships to white matter pathology. For example, the radial diffusivity appears to be modulated by myelin in white matter, whereas the axial diffusivity (Da = λ1)

6 UNDER REVIEW: DO NOT DISTRIBUTE
is more specific to axonal degeneration.40 Consequently, it is important to consider alternative quantitative methods when trying to interpret DTI measurements (see below).
Another important measure is the tensor orientation described by the major eigenvector direction. For diffusion tensors with high anisotropy, the major eigenvector direction is generally assumed to be parallel to the direction of white matter tract, which is often represented using an RGB (red-green-blue) color map to indicate the eigenvector orientations.41,42 The local eigenvector orientations can be used to identify and parcellate specific WM tracts; thus DT-MRI has an excellent potential for applications that require high anatomical specificity. The ability to identify specific white matter tracts on the eigenvector color maps has proven useful for mapping white matter anatomy relative to lesions
for preoperative planning43 and post-operative follow-up.44 Recently, statistical methods have been developed for quantifying the distributions of tensor orientation in specific brain regions.45 Example maps of the mean diffusivity, fractional anisotropy, major eigenvector direction, and eigenvalues are shown in Figure 4.
Histograms of FA, MD, Da and Dr in healthy gray matter (GM), white matter (WM) and CSF are plotted in Figure 5. The histograms demonstrate considerable overlap in the measurement distributions of the major tissue groups. The FA (ranges between 0 and 1) measurements in WM have a very broad distribution with considerable skew and kurtosis. The other measures in GM and WM appear more Normally distributed (not tested) with the biggest difference between tissue types in the radial diffusivity (Dr) measure.
Figure 4. Quantitative maps from a DTI experiment. The images include the T2-weighted (T2W) “reference” (or b=0) image from DTI data; the mean diffusivity (MD - note similar contrast to T2W image with CSF appearing hyperintense); fractional anisotropy (FA - hyperintense in white matter); the major eigenvector direction indicated by color (red = R/L, green = A/P, blue = S/I) weighted by the FA (note that specific tract groups can be readily identified); the major, medium and minor eigenvectors (λ1, λ 2, and λ 3, respectively). A conventional T1-weighted (from a 3D MP-RAGE) at the same anatomical location is also displayed.

7 UNDER REVIEW: DO NOT DISTRIBUTE
Figure 5. Histogram distribution plots of FA, MD, Da (= λ1)) and Dr (=(λ2 + λ3)/2) for whole brain GM (blue), WM (red) and CSF (green).
Effects of Noise on DT-MRI: The measures derived from the diffusion tensor are moderately sensitive to noise. The use of multiple noisy images for the estimation is the primary cause. The effects of Gaussian random noise on the tensor trace and anisotropy measures has been studied using Monte Carlo noise simulation studies.31 The noise and eigenvalue sorting process tend to cause overestimation of the major eigenvalue and underestimation of the minor eigenvalue and an increase in the uncertainty of all the eigenvalues. In addition, the eigenvector orientations tend to be highly sensitive to noise.46 Consequently, for applications where quantitative accuracy are important, it is critical to acquire DTI data with adequate SNR.
White Matter Tractography
The orientation of the diffusion tensor major eigenvector is generally assumed to be parallel to the local white matter fascicles. These directional patterns may be simply visualized using the color maps representing the major eigenvector direction
similar to the example in Figure 13. These color maps are very useful for surveying the organization of white matter in the brain and for identifying major white matter tracts in 2D sections.42,43 Another approach for appreciating the white matter connection patterns in 3D is using white matter tractography, which follows coherent spatial patterns in the major eigenvectors of the diffusion tensor field.3-5 White matter patterns are estimated by starting at a specified location (also called the “seed” point), estimating the direction of propagation (often defined as the major eigenvector), and moving a small distance in that direction (called tract integration). The tract direction is then re-evaluated and another small step is taken, and so on until the tract is terminated. Tracts may be constraining by using one or more regions of interest.47,48 Most algorithms use the major eigenvector to estimate the tangent of the trajectory for a white matter fiber bundle, though tracing methods based upon the full diffusion tensor field have also been developed.36,49
Using these methods, tractography algorithms are capable of generating anatomically plausible

8 UNDER REVIEW: DO NOT DISTRIBUTE
estimates of white matter trajectories in the human brain. Tractography methods have been used to generate anatomically plausible tract reconstructions of major projection pathways (e.g., corticospinal tract, internal capsule, corona radiata), commisural pathways (corpus callosum, anterior commisure), and association pathways (e.g., arcuate fasciculus, inferior longitudinal fasciculus, uncinate fasciculus, etc.).47,48,50-52 The primary
applications of tractography to date have been the visualization of WM trajectories in 3D (particularly in relation to brain pathology) and segmentation of specific brain regions. An example tractogram of the corona radiata (projection fibers from brainstem to cortex) in a healthy subject is shown in Figures 6. A demonstration tractography based segmentation is shown in Figure 7.
Figure 6. Example tractography image of corona radiata in healthy subject. Color was used to label tract termination at cortex (blue to yellow corresponds to anterior to posterior).
Figure 7. WM parcellation of major tracts for one subject using tractography. DTI data was collected with 2.3 mm isotropic resolution. The tracts shown include the superior longitudinal fasciculus (red); corpus callosum (purple); inferior occipital fasciculus (light blue); inferior longitudinal fasciculus (yellow); uncinate fasciculus (orange); fornix/stria terminalis (dark orange); corona radiata (green).

9 UNDER REVIEW: DO NOT DISTRIBUTE
Despite the promising results obtained in these studies, there are several limitations of tractography. Estimates of the eigenvector directions, and hence the local tract directions, are sensitive to thermal noise, physiologic fluctuations and image artifacts. Algorithms based upon the major eigenvector are unable to resolve regions of crossing white matter pathways. New diffusion imaging methods, such as QBI (q Ball Imaging)53; HARDI (High Angular Diffusion Imaging)54,55; CHARMED (Combined Hindered and Restricted Diffusion)56; DSI (Diffusion Spectrum Imaging)57, may be able to better resolve intersecting crossing white matter regions more accurately. However, these methods require higher diffusion-weighting (typically 3,000-15,000 s/mm2) and take much more time to acquire. Tractography results with these methods are promising.58
INTERPRETATION OF DTI MEASURES
Diffusion tensor imaging has been reported in a broad spectrum of applications. The primary reason is that water diffusion in tissues is extremely sensitive to differences in the microstructural architecture of cellular membranes. Increases in the average spacing between membrane layers will increase the apparent diffusivity, whereas smaller spaces will lead to lower apparent diffusivities. This high sensitivity makes DTI a powerful method for detecting microscopic differences in tissue properties.
However, the interpretation of changes in the measured diffusion tensor is complex and should be performed with care. Many research studies primarily focus on the diffusion anisotropy (usually the FA measure), which may not be enough to characterize the tissue changes. For example, white matter (WM) neuropathology often causes the anisotropy to decrease, which may result from either increased radial (perpendicular) diffusivity and/or reduced axial (parallel) diffusivity. Measurements of the mean diffusivity or trace may help to better understand how the diffusion tensor is changing. Alternatively, more recent studies have started to examine measurements of either the eigenvalues or the radial and axial diffusivities directly to provide more specific information about the diffusion tensor.40,59
The interpretation is further complicated by the sensitivity of the diffusion tensor, and the anisotropy in particular, to a broad spectrum of other factors including image noise (both thermal and
physiologic)31,46,60, artifacts (i.e., misregistration of DW images from eddy currents or head motion), partial volume averaging between tissues in large voxels (i.e., signal mixing of gray matter, WM and CSF)32, and regions of crossing WM tracts32,61. The last confound is unfortunately unavoidable as many areas of the brain have considerable areas of fiber crossing (e.g., the centrum semiovale, uncinate fasciculi and transpontine fibers), which have corresponding low FA. Consequently, changes in the angle and relative fractions of crossing WM fiber groups can result in significant anisotropy changes without any white matter abnormalities. Within healthy WM, FA can range between values of 0.1 to almost 1.0 (peaked at around 0.3 – see Figure 5) and much of this variation is caused by crossing WM fibers. The variability in FA can be reduced considerably by focusing on white matter tracts in specific anatomic regions, particularly with less white matter crossings, e.g., homogeneous areas with a single fiber population like the pyramidal tracts and the corpus callosum (before intersection within the centrum semiovale).
Consequently, in the absence of other information, FA is an extremely sensitive but fairly non-specific biomarker of neuropathology and microstructural architecture. This imposes challenges on the interpretation of DTI measurements for diagnostic and therapeutic applications. Many studies imply that FA is a marker of so-called white matter integrity, yet these claims are far from definitive.
However, despite these limitations, DTI is certainly a sensitive marker of neuropathology. Hundreds of research studies have observed reduced FA in a broad spectrum of diseases, with increases rarely reported. Furthermore, if the neuropathologic basis for a specific disease is understood, then the results may be interpreted with greater specificity. For example, demyelination might cause the radial diffusivity to increase, with minimal influence on the axial diffusivity. Increased tissue water in edema will increase the mean diffusivity, whereas cell proliferation in neoplasia may decrease the mean diffusivity. Conversely, in complex diseases like multiple sclerosis, brain regions may experience an unpredictable combination of demyelination, axon loss, gliosis, and inflammation, which could result in competing influences on the diffusion tensor. The combination with other imaging measures (e.g., T1, T2, magnetization transfer, perfusion, fast/slow diffusion, spectroscopy) may help to improve the specificity of DTI in complex diseases. In relatively homogenous (single-fiber), well-characterized white matter tissues, the diffusion tensor appears to have the following relationships to neuropathology.

10 UNDER REVIEW: DO NOT DISTRIBUTE
Ischemic Stroke. The clinical diagnosis and characterization of acute ischemic lesions in the CNS is by far the largest clinical application of DWI. In the acute phase of brain ischemia, the mean diffusivity (or trace) significantly decrease in the lesion.62 After several days (~5-7), the mean diffusivity starts to renormalize (appear normal). However, chronic ischemic lesions (> 2 weeks) typically demonstrate significantly increased mean diffusivity as encephalomalacia ensues. Recent studies have also shown that the FA appears to increase in acute lesions and decrease below baseline levels in the chronic phase.63-65 Investigations of specific eigenvalues appear to show decreases in the first and second (largest and medium) eigenvalues during acute ischemia relative to the contralateral hemisphere.64
Demyelination/Dysmyelination. Early studies demonstrated that the parallel organization of white matter fiber bundles is the basis for diffusion anisotropy, whereas myelin appears to modulate the amount of anisotropy.66 Nearly all studies of myelination with normal brain development67 or demyelination with disease related processes have found less diffusion anisotropy when axons are less myelinated. During early brain development, all three eigenvalues appear to decrease with aging although the decline in diffusivity is more substantial in the radial diffusion orientations (medium and minor eigenvalues), consistent with the development of myelination68 (though many other processes are also occurring during brain maturation). Recently, Song et al.40 examined the radial and axial diffusivities of white matter in a mouse model of dysmyelination and found that the absence of myelin appeared to increase the radial diffusivity, but did not significantly effect the axial diffusivity. Subsequent studies have confirmed increased radial diffusivity in models of dysmyelination69 and demyelination70,71, although a few studies69,71 observed decreased axial diffusivity with dys/de-myelination though these differences were less significant. Axonal damage and loss may also have modulatory effects on these measures and recent studies71,72 have suggested that the axial diffusivity may be a more specific marker of axonal damage. It should be noted that these studies focused on homogeneous parallel WM regions, which are not significantly confounded by crossing WM fibers. Regardless of the specific mechanisms, in comparison to the diffusion anisotropy, the axial and radial diffusivities (or diffusion eigenvalues) provide more specific information about diffusion tensor changes or differences. Recently, more studies have started to examine the axial and radial diffusivities using DTI. Increased radial diffusivities have been observed in
high anisotropy WM of patients with relapsing-remitting multiple sclerosis73, in periventricular frontal WM in early Alzheimer’s disease74, in periventricular WM of patients with hydrocephalus75, in remaining corpus callosum WM tracts post corpus collosotomy76, in extratemporal WM in patients with temporal lobe epilepsy77, in the genu of the corpus callosum of cocaine addicts77, and in the corpus callosum of subjects with autism59. In many of these cases, myelination may play a significant modulatory role in the radial diffusivity.
Inflammation. To date, very little work has been done to characterize the relationships between DTI measures and inflammation. Generally, the increased tissue water engendered by inflammation also increases the mean diffusivity, which will result in a decrease in the diffusion anisotropy. In one study, the mean diffusivity appeared to be highly elevated in acute multiple sclerosis lesions, whereas chronic and sub-acute lesions demonstrated less elevated mean diffusivities.79 In a separate study, Werring et al.80 found that destructive T1 hypointense lesions showed the greatest elevation in mean diffusivity and the contrast-enhancing lesions (inflammatory) showed the largest decrease in FA.
Edema. The effects of edema on DTI measurements are similar to that of inflammation, as one would expect. The mean diffusivity is increased and the anisotropy is decreased. This pattern of DTI measures is a general hallmark of many disease and injury processes, which as discussed above, limits the specificity of DTI measurements. One interesting observation is that although the anisotropy is reduced, the directional patterns of the affected WM tracts appear unaltered, whereas glioma infiltration may cause alterations in the WM fiber orientations.45,81
Neoplasia. Possibly the second largest clinical application of DTI is for the characterization of white matter in patients with brain tumors. Much of this work focuses on using DTI maps and tractography to help localize WM fiber tracts that are important for critical functions such as motion, language and vision.43,44,52 Armed with this information, the neurosurgeon can plan surgical procedures that will minimize injury to critical tracts such as the corticospinal tract.82
DTI has also been applied to characterize tissues, albeit with limited success. The heterogeneity of brain tumors in the presences of complex environments (e.g. edema, mass effects) and the inherent heterogeneity of diffusion anisotropy in

11 UNDER REVIEW: DO NOT DISTRIBUTE
normal white matter reduces the overall specificity of DTI measures. In general, it is assumed that increased cellular densities will decrease the mean diffusivity and in areas of tissue necrosis, the mean diffusivity will be significantly elevated. A recent study of pediatric tumor patients83 observed relationships between mean diffusivity and both tumor grade and cellularity. Another study compared mean diffusivity measurements in lymphomas and high grade astrocytomas (much higher cellular densities) and found that the diffusivities were significantly reduced in the astrocytomas.84 Alternatively, Beppu et al.85,86 reported correlations between FA and cell density and proliferation in both astrocytomas and glioblastomas with higher FA values corresponding to higher cell densities.
Investigators have also attempted to use DTI to differentiate between gliomas and edema, which is challenging with conventional MRI methods. As discussed above, tract orientations appear to be highly affected by infiltrating gliomas, whereas the directions appear to be preserved in regions of edema. Lu et al.87 developed a criterion (the Tumor Infiltration Index) based upon the relationships between FA and mean diffusivity to classify neoplasia and peritumoral edema. Other studies have found the differentiation between tumor types and edema to be not significant using DTI.88,89 The type of edema may also influence the diffusion properties. In one recent study, peritumoral edema from high grade tumors (relative to low grade) appeared to have higher diffusivity possibly from the destruction of the extracellular tissue matrix.90
Role of DTI in Neurotherapeutics.
The high sensitivity but low specificity of DTI measures presents challenges for its application in the diagnosis of neuropathology. However, it is a potentially powerful technique for monitoring the response of the brain to different therapies. Since each subject serves as their own baseline reference, it is possible to follow subjects longitudinally to determine how the microstructural properties of the tissue change over time. Further, if the type of injury is well-characterized or the therapeutic effects are predictable, the specificity of the measured changes may be greatly increased. Some of the potential applications in the assessment and management of patients with neuropathology are surveyed here.
Disease/Response Predictors. Image-based prognostic indicators of disease course and response to therapy would be extremely valuable. Predictive imaging measures would enable earlier
interventions and would be useful for assessing which patients are most likely to respond to specific therapies. Several recent studies have examined DTI measures for predicting disease risk and response factors. Conventional imaging is particularly challenging in newborns and young children. DTI offers unique contrast in WM that may be more sensitive to injury and abnormal development. A study of low birth weight preterm infants found that the FA in the posterior limb of the internal capsule was significantly reduced in the most neurologically abnormal infants. At the other end of the aging range, DTI has been used to characterize patients at risk for Alzheimer’s disease and late-onset depression. In a small pilot study of patients with mild cognitive impairment, the mean diffusivity of the hippocampus was a better predictor than the hippocampus volume for patients who progressed to Alzheimer’s disease.91 Diminished FA in patients with late life depression was found to be a strong predictor of poor response to the antidepressant Citalopram.92
DTI measures have also been evaluated as prognostic indicators of disease progression and response to therapy in lesion-based neuropathology. Mean diffusivity of normal appearing white matter was found to correlate with cognitive performance (IQ and executive function) measures in patients with ischemic leukoaraiosis.93 Similarly in CADASIL, a recent study demonstrated that increased mean diffusivity was the largest predictor of future clinical progression.94 Conversely, in the case of ischemic stroke, changes in either the mean diffusivity or apparent diffusion abnormality during the acute phase were not found to be predictive of the clinical outcome.95 However, in chronic stroke patients, FA measurements of the corticospinal tract were found to be correlated with motor functional recovery.96 In the latter study, fMRI and WM tractography were used to localize the corticospinal tract. This unique ability of DTI for mapping the trajectories of specific WM tracts is also promising for mapping abnormalities to functionally specific anatomy. One interesting recent study used tractography to study the corpus callosum and the corticospinal tracts in relapsing-remitting M.S. patients.97 The mean diffusivity of the cortical spinal tract correlated with the pyramidal FSS clinical score, which is related to motor function. The mean diffusivity of the corpus callosum, however, correlated with the PASAT score, which characterized function associated with auditory attention and processing speed.
Surgical Interventions. DTI has been used widely for mapping WM anatomy prior to surgery.43,52,98 This assists the clinical intervention team with

12 UNDER REVIEW: DO NOT DISTRIBUTE
localization of critical white matter pathways to minimize damage to these areas. These pathways may be visualized either using the color eigenvector maps (Figure x – also see Witwer et al.43) or tractography44. A recent study by Powell et al.99 found that tractography was able to predict visual field deficits that occurred after resection of the temporal lobe. DTI and tractography have also been implemented in the intraoperative setting to facilitate real-time WM tract mapping to compensate for shifting tissues during the surgery.100-103 These visualization techniques have also been applied after surgical intervention to assess the impact of the surgery on the WM tracts.44,82,98 In addition to the visualization of the WM tracts, DTI has also been used to study the effects of surgery on WM pathways. A small DTI study of patients with hemispherectomies revealed no significant changes in either the mean diffusivity or FA in the contralateral corticospinal tract.104 However, the ipsilateral pontene and cerebral peduncle fiber regions demonstrated increased mean diffusivity and reduced FA likely from Wallerian degeneration. Similar Wallerian degeneration changes in the DTI measures were observed in the optic radiations following temporal lobectomy.105 Detailed DTI studies of patients following corpus collosotomy observed reduced FA following the surgical intervention (the anterior 2/3 of the corpus callosum is bisected). However, one week post surgery the FA decrease was attributed to increased axial diffusivity (from axonal fragmentation), whereas 2-4 months after the surgery, the FA decrease was caused by increases in the radial diffusivity (consistent with demyelination).76
Radiation Treatment in Neoplasia. Several studies have demonstrated that radiation therapy decreases the FA of affected WM regions.106-108 This decrease in FA appears to be related to the overall radiation dose, which may be used to assess dose distribution.107 The mean diffusivity and FA measures also appear to be promising for differentiating between recurrent brain tumors and radiation injury in regions of new constrast-enhancing lesions.108 Two recent studies have also examined the relationships between DTI changes from radiation and cognitive function as measured by IQ.109,110 Both studies report a correlation between decreased FA and decreased IQ. The Mabbott et al.109 study also observed that increased mean diffusivity in WM correlated with decreased IQ.
Other Treatments. DTI has also been used to follow the response of neuropathology to pharmacological therapies. One example is a
longitudinal study of dystonia patients after botulinum toxin treatment.111 FA measurements in the posterior limb of the interior capsule appeared to normalize after four weeks of treatment. DTI has also been used to investigate the effects of steroid hormone dexamethasone treatment on peritumoral edema.112 This study demonstrated a reduction in the mean diffusivity of the edematous region with no significant changes in other tissues (normal appearing WM or tumor). DTI also appears to be promising for following the response to stem cell therapies in the CNS. A study of neural progenitor cells transplanted in a mouse model after acute ischemic stroke demonstrated an increase in the FA in the ischemic boundary region, which was consistent with new axonal projections in these regions.113
Acknowledgements. The background and data for this paper were generated with support from the Dana Foundation, the National Multiple Sclerosis Society, and NIH grants MH62015, HD35476 and NS050466. The authors are also grateful for the contributions from Mariana Lazar, Yu-Chien Wu and other members of the Waisman Laboratory for Brain Imaging and Behavior.

13 UNDER REVIEW: DO NOT DISTRIBUTE
References
1. Basser PJ, Mattiello J, LeBihan D. Estimation of the effective self-diffusion tensor from the NMR spin echo. J Magn Reson B 1994;103:247-54.
2. Basser PJ, Mattiello J, LeBihan D. MR diffusion tensor spectroscopy and imaging. Biophys J 1994;66:259-67.
3. Conturo TE, Lori NF, Cull TS, et al. Tracking neuronal fiber pathways in the living human brain. Proc Natl Acad Sci USA 1999;96:10422-10427.
4. Mori S, Crain BJ, Chacko VP, van Zijl PC. Three-dimensional tracking of axonal projections in the brain by magnetic resonance imaging. Ann Neurol 1999;45:265-9.
5. Basser PJ, Pajevic S, Pierpaoli C, Duda J, Aldroubi A. In vivo tractography using DT-MRI data. Magn Res Med 2000;44:625-632.
6. Einstein A. Investigations on the Theory of the Brownian Movement. Dover Publications, Inc. 1956; p. 17.
7. Le Bihan D. Molecular diffusion, tissue microdynamics and microstructure. NMR Biomed. 1995;8:375-86.
8. Moseley ME, Cohen Y, Kucharczyk J, et al. Diffusion-weighted MR imaging of anisotropic water diffusion in cat central nervous system. Radiology 1990;176:439-45.
9. Chenevert T, Brunberg J, Pipe J. Anisotropic diffusion in human white matter: demonstration with MR techniques in vivo. Radiology 1990;177:401-405.
10. Norris DG. Implications of bulk motion for diffusion-weighted imaging experiments: effects, mechanisms, and solutions. J Magn Reson Imaging 2001;13(4):486-95.
11. Mansfield P. Real-time echo-planar imaging by NMR. Br Med Bull 1984;40:187-90.
12. Turner R, Le Bihan D, Maier J, Vavrek R, Hedges LK, Pekar J. Echo-planar imaging of intravoxel incoherent motion. Radiology 1990;177:407-14.
13. Jezzard P, Balaban RS. Correction for geometric distortion in echo planar images from B0 field variations. Magn Reson Med 1995;34:65-73.
14. Haselgrove JC, Moore JR. Correction for distortion of echo-planar images used to calculate the apparent diffusion coefficient. Magn Reson Med 1996;36:960-4.
15. Jezzard P, Barnett AS, Pierpaoli C. Characterization of and correction for eddy current artifacts in echo planar diffusion imaging. Magn Reson Med 1998;39:801-12.
16. Alexander AL, Tsuruda JS, Parker DL. Elimination of eddy current artifacts in diffusion-weighted echo-planar images: the use of bipolar gradients. Magn Reson Med 1997;38:1016-1021.
17. Reese TG, Heid O, Weisskoff RM, Wedeen VJ. Reduction of eddy-current-induced distortion in diffusion MRI using a twice-refocused spin echo. Magn Reson Med 2003;49:177-82.
18. Andersson JL, Skare S. A model-based method for retrospective correction of geometric distortions in diffusion-weighted EPI. Neuroimage 2002;16:177-99.
19. Rohde GK, Barnett AS, Basser PJ, Marenco S, Pierpaoli C. Comprehensive approach for correction of motion and distortion in diffusion-weighted MRI. Magn Reson Med. 2004;51:103-14.
20. Pruessmann KP, Weiger M, Scheidegger MB, Boesiger P. SENSE: sensitivity encoding for fast MRI. Magn Reson Med 1999;42:952-62.
21. Alexander AL, Lee JE, Wu YC, Field AS. Comparison of diffusion tensor imaging measurements at 3.0 T versus 1.5 T with and without parallel imaging. Neuroimaging Clin N Am. 2006;16:299-309
22. Jaermann T, Crelier G, Pruessmann KP, et al. SENSE-DTI at 3 T. Magn Reson Med. 2004;51:230-6.
23. Jones DK, Williams SC, Gasston D, Horsfield MA, Simmons A, Howard R. Isotropic resolution diffusion tensor imaging with whole brain acquisition in a clinically acceptable time. Hum Brain Mapp. 2002;15:216-30.
24. Shrager RI, Basser PJ. Anisotropically weighted MRI. Magn Reson Med 1998;40:160-5.
25. Papadakis NG, Xing D, Huang CL, Hall LD, Carpenter TA. A comparative study of acquisition schemes for diffusion tensor imaging using MRI. J Magn Reson 1999;137:67-82.
26. Basser PJ, Pierpaoli C. A simplified method to measure the diffusion tensor from seven MR images. Magn Reson Med 1998;39:928-934.
27. Jones DK, Horsfield MA, Simmons A. Optimal strategies for measuring diffusion in anisotropic systems by magnetic resonance imaging. Magn Reson Med. 1999;42(3):515-25.
28. Shimony JS, McKinstry RC, Akbudak E, et al. Quantitative diffusion-tensor anisotropy brain MR imaging: normative human data and anatomic analysis. Radiology 1999;212:770-84.
29. Hasan K, Parker DL, Alexander AL. Comparison of gradient encoding schemes for diffusion-tensor MRI. J Magn Reson Imaging 2001;13:769-780.
30. Jones DK. The effect of gradient sampling schemes on measures derived from diffusion tensor MRI: a Monte Carlo study. Magn Reson Med. 2004;51(4):807-15.
31. Pierpaoli C, Basser PJ. Toward a quantitative assessment of diffusion anisotropy. Magn Reson Med 1996;36:893-906.
32. Alexander AL, Hasan K, Lazar M, Tsuruda JS, Parker DL. Analysis of partial volume effects in diffusion-tensor MRI. Magn Reson Med 2001;45:770-780.
33. Koay CG, Chang LC, Carew JD, Pierpaoli C, Basser PJ. A unifying theoretical and algorithmic framework for least squares methods of estimation in diffusion tensor imaging. J Magn Reson. 2006;182(1):115-25.
34. Basser PJ, Pierpaoli C. Microstructural and physiological features of tissues elucidated by quantitative-diffusion-tensor MRI. J Magn Reson B 1996;111:209-219.

14 UNDER REVIEW: DO NOT DISTRIBUTE
35. Conturo TE, McKinstry RC, Akbudak E, Robinson BH. Encoding of anisotropic diffusion with tetrahedral gradients: a general mathematical diffusion formalism and experimental results. Magn Reson Med 1996;35:399-412.
36. Westin CF, Maier SE, Mamata H, Nabavi A, Jolesz FA, Kikinis R. Processing and visualization for diffusion tensor MRI. Med Image Anal 2002;6:93-108.
37. Pierpaoli C, Jezzard P, Basser PJ, Barnett A, Di Chiro G. Diffusion tensor MR imaging of the human brain. Radiology 1996;201:637-648.
38. Ulug AM, van Zijl PJ. Orientation-independent diffusion imaging without tensor diagonalization: anisotropy definitions based on physical attributes of the diffusion ellipsoid. J Magn Reson Imaging 1999;9:804-13.
39. Alexander AL, Hasan K, Kindlmann G, Parker DL, Tsuruda JS. A geometric comparison of diffusion anisotropy measures. Magn Reson Med 2000;44:283-91.
40. Song SK, Sun SW, Ramsbottom MJ, Chang C, Russell J, Cross AH. Dysmyelination revealed through MRI as increased radial (but unchanged axial) diffusion of water. Neuroimage. 2002;17(3):1429-36.
41. Makris N, Worth AJ, Sorensen AG, et al. Morphometry of in vivo human white matter association pathways with diffusion-weighted mag-netic resonance imaging. Ann Neurol 1997;42:951-962.
42. Pajevic S, Pierpaoli C. Color schemes to represent the orientation of anisotropic tissues from diffusion tensor data: Application to white matter fiber tract mapping in the human brain. Magn Reson Med 1999;42:526-540.
43. Witwer BP, Moftakhar R, Hasan KM, et al. Diffusion-tensor imaging of white matter tracts in patients with cerebral neoplasm. J Neurosurg. 2002;97(3):568-75.
44. Lazar M, Alexander AL, Thottakara PJ, Badie B, Field AS. White matter reorganization after surgical resection of brain tumors and vascular malformations. AJNR Am J Neuroradiol. 2006;27(6):1258-71.
45. Wu YC, Field AS, Chung MK, Badie B, Alexander AL. Quantitative analysis of diffusion tensor orientation: theoretical framework. Magn Reson Med. 2004;52(5):1146-55.
46. Basser PJ, Pajevic S. Statistical artifacts in diffusion tensor MRI (DT-MRI) caused by background noise. Magn Reson Med. 2000;44(1):41-50.
47. Mori S, Kaufmann WE, Davatzikos C, et al.. Imaging cortical association tracts in the human brain using diffusion-tensor-based axonal tracking. Magn Reson Med 2002;47:215-223.
48. Catani M, Howard RJ, Pajevic S, Jones DK. Virtual in vivo interactive dissection of white matter fasciculi in the human brain. Neuroimage 2002;17:77-94.
49. Lazar M, Weinstein DM, Tsuruda JS, et al. White Matter Tractography Using Tensor Deflection. Hum Brain Mapp 2003;18:306-321.
50. Stieltjes B, Kaufmann WE, van Zijl PCM, et al. Diffusion tensor imaging and axonal tracking in the human brain. Neuroimage 2001;14:723-735.
51. Wakana S, Jiang H, Nagae-Poetscher LM, van Zijl PC, Mori S. Fiber tract-based atlas of human white matter anatomy. Radiology. 2004;230(1):77-87.
52. Jellison BJ, Field AS, Medow J, Lazar M, Salamat MS, Alexander AL. Diffusion tensor imaging of cerebral white matter: a pictorial review of physics, fiber tract anatomy, and tumor imaging patterns. AJNR Am J Neuroradiol. 2004;25(3):356-69.
53. Tuch DS, Reese TG, Wiegell MR, Wedeen VJ. Diffusion MRI of complex neural architecture. Neuron 2003;40(5):885-95.
54. Frank LR. Characterization of anisotropy in high angular resolution diffusion-weighted MRI. Magn Reson Med. 2002;47(6):1083-99.
55. Alexander DC, Barker GJ, Arridge SR. Detection and modeling of non-Gaussian apparent diffusion coefficient profiles in human brain data. Magn Reson Med 2002;48(2):331-40.
56. Assaf Y, Basser PJ. Composite hindered and restricted model of diffusion (CHARMED) MR imaging of the human brain. Neuroimage. 2005 1;27(1):48-58.
57. Wedeen VJ, Hagmann P, Tseng WY, Reese TG, Weisskoff RM. Mapping complex tissue architecture with diffusion spectrum magnetic resonance imaging. Magn Reson Med. 2005;54(6):1377-86.
58. Hagmann P, Reese TG, Tseng WYI, Meuli R, Thirian JP, Wedeen VJ. Diffusion spectrum imaging tractography in complex cerebral white matter: an investigation of the centrum semiovale. Proc ISMRM (Kyoto) 2004; 623 Abstract.
59. Alexander AL, Lee JE, Lazar M, et al. Diffusion tensor imaging of the corpus callosum in Autism. Neuroimage. 2007 1;34(1):61-73.
60. Skare S, Andersson JL. On the effects of gating in diffusion imaging of the brain using single shot EPI. Magn Reson Imaging. 2001;19(8):1125-8.
61. Frank LR. Anisotropy in high angular resolution diffusion-weighted MRI. Magn Reson Med 2001;45(6):935-9.
62. van Gelderen P, de Vleeschouwer MH, DesPres D, et al. Water diffusion and acute stroke. Magn Reson Med 1994;31:154-163.
63. Liu Y, D'Arceuil HE, Westmoreland S, et al. Serial diffusion tensor MRI after transient and permanent cerebral ischemia in nonhuman primates. Stroke. 2007;38(1):138-45.
64. Sorensen AG, Wu O, Copen WA, et al. Human acute cerebral ischemia: detection of changes in water diffusion anisotropy by using MR imaging. Radiology. 1999;212(3):785-92.
65. Yang Q, Tress BM, Barber PA, et al. Serial study of apparent diffusion coefficient and anisotropy in patients with acute stroke. Stroke. 1999;30(11):2382-90.
66. Beaulieu C, Allen PS. Determinants of anisotropic water diffusion in nerves. Magn Reson Med. 1994;31(4):394-400.
67. Neil JJ, Shiran SI, McKinstry RC, et al. Normal brain in human newborns: apparent diffusion coefficient and diffusion anisotropy measured by using diffusion tensor MR imaging. Radiology. 1998;209(1):57-66.
68. Suzuki Y, Matsuzawa H, Kwee IL, Nakada T. Absolute eigenvalue diffusion tensor analysis for human brain maturation. NMR Biomed. 2003;16(5):257-60.

15 UNDER REVIEW: DO NOT DISTRIBUTE
69. Tyszka JM, Readhead C, Bearer EL, Pautler RG, Jacobs RE. Statistical diffusion tensor histology reveals regional dysmyelination effects in the shiverer mouse mutant. Neuroimage. 2006 15;29(4):1058-65.
70. Song SK, Yoshino J, Le TQ, et al. Demyelination increases radial diffusivity in corpus callosum of mouse brain. Neuroimage. 2005 15;26(1):132-40.
71. Harsan LA, Poulet P, Guignard B, et al. Brain dysmyelination and recovery assessment by noninvasive in vivo diffusion tensor magnetic resonance imaging. J Neurosci Res. 2006 15;83(3):392-402.
72. Sun SW, Liang HF, Trinkaus K, Cross AH, Armstrong RC, Song SK. Noninvasive detection of cuprizone induced axonal damage and demyelination in the mouse corpus callosum. Magn Reson Med. 2006;55(2):302-8.
73. Henry RG, Oh J, Nelson SJ, Pelletier D. Directional diffusion in relapsing-remitting multiple sclerosis: a possible in vivo signature of Wallerian degeneration. J Magn Reson Imaging. 2003;18(4):420-6.
74. Choi SJ, Lim KO, Monteiro I, Reisberg B. Diffusion tensor imaging of frontal white matter microstructure in early Alzheimer's disease: a preliminary study. J Geriatr Psychiatry Neurol. 2005;18(1):12-9.
75. Assaf Y, Ben-Sira L, Constantini S, Chang LC, Beni-Adani L. Diffusion tensor imaging in hydrocephalus: initial experience. AJNR Am J Neuroradiol. 2006;27(8):1717-24.
76. Concha L, Gross DW, Wheatley BM, Beaulieu C. Diffusion tensor imaging of time-dependent axonal and myelin degradation after corpus callosotomy in epilepsy patients. Neuroimage. 2006;32(3):1090-9.
77. Gross DW, Concha L, Beaulieu C. Extratemporal white matter abnormalities in mesial temporal lobe epilepsy demonstrated with diffusion tensor imaging. Epilepsia. 2006;47(8):1360-3.
78. Moeller FG, Hasan KM, Steinberg JL, et al. Diffusion tensor imaging eigenvalues: Preliminary evidence for altered myelin in cocaine dependence. Psychiatry Res. 2007 (in press)
79. Tievsky AL, Ptak T, Farkas J. Investigation of apparent diffusion coefficient and diffusion tensor anisotrophy in acute and chronic multiple sclerosis lesions. AJNR Am J Neuroradiol. 1999;20(8):1491-9.
80. Werring DJ, Clark CA, Barker GJ, Thompson AJ, Miller DH. Diffusion tensor imaging of lesions and normal-appearing white matter in multiple sclerosis. Neurology. 1999 12;52(8):1626-32.
81. Field AS, Alexander AL. Diffusion tensor imaging in cerebral tumor diagnosis and therapy. Top Magn Reson Imaging. 2004;15(5):315-24.
82. Laundre BJ, Jellison BJ, Badie B, Alexander AL, Field AS. Diffusion tensor imaging of the corticospinal tract before and after mass resection as correlated with clinical motor findings: preliminary data. AJNR Am J Neuroradiol. 2005;26(4):791-6.
83. Gauvain KM, McKinstry RC, Mukherjee P, et al. Evaluating pediatric brain tumor cellularity with diffusion-tensor imaging. AJR Am J Roentgenol 2001;177:449-454.
84. Guo AC, MacFall JR, Provenzale JM. Multiple sclerosis: diffusion tensor MR imaging for evaluation of normal-appearing white matter. Radiology 2002:222(3):729-36.
85. Beppu T, Inoue T, Shibata Y, et al. Measurement of fractional anisotropy using diffusion tensor MRI in supratentorial astrocytic tumors. J Neurooncol. 2003;63(2):109-16.
86. Beppu T, Inoue T, Shibata Y, et al. Fractional anisotropy value by diffusion tensor magnetic resonance imaging as a predictor of cell density and proliferation activity of glioblastomas. Surg Neurol. 2005;63(1):56-61
87. Lu S, Ahn D, Johnson G, Law M, Zagzag D, Grossman RI. Diffusion-tensor MR imaging of intracranial neoplasia and associated peritumoral edema: introduction of the tumor infiltration index. Radiology. 2004;232(1):221-8.
88. Tropine A, Vucurevic G, Delani P, et al. Contribution of diffusion tensor imaging to delineation of gliomas and glioblastomas. J Magn Reson Imaging. 2004;20(6):905-12.
89. Tsuchiya K, Fujikawa A, Nakajima M, Honya K. Differentiation between solitary brain metastasis and high-grade glioma by diffusion tensor imaging. Br J Radiol. 2005;78(930):533-7.
90. Morita K, Matsuzawa H, Fujii Y, Tanaka R, Kwee IL, Nakada T. Diffusion tensor analysis of peritumoral edema using lambda chart analysis indicative of the heterogeneity of the microstructure within edema. J Neurosurg. 2005;102(2):336-41.
91. Muller MJ, Greverus D, Weibrich C, et al. Diagnostic utility of hippocampal size and mean diffusivity in amnestic MCI. Neurobiol Aging. 2007;28(3):398-403.
92. Alexopoulos GS, Kiosses DN, Choi SJ, Murphy CF, Lim KO. Frontal white matter microstructure and treatment response of late-life depression: a preliminary study. Am J Psychiatry. 2002;159(11):1929-32.
93. O'Sullivan M, Morris RG, Huckstep B, Jones DK, Williams SC, Markus HS. Diffusion tensor MRI correlates with executive dysfunction in patients with ischaemic leukoaraiosis. J Neurol Neurosurg Psychiatry. 2004;75(3):441-7.
94. Holtmannspotter M, Peters N, Opherk C, et al. Diffusion magnetic resonance histograms as a surrogate marker and predictor of disease progression in CADASIL: a two-year follow-up study. Stroke. 2005;36(12):2559-65.
95. Wardlaw JM, Keir SL, Bastin ME, Armitage PA, Rana AK. Is diffusion imaging appearance an independent predictor of outcome after ischemic stroke? Neurology. 2002 12;59(9):1381-7.
96. Stinear CM, Barber PA, Smale PR, Coxon JP, Fleming MK, Byblow WD. Functional potential in chronic stroke patients depends on corticospinal tract integrity. Brain. 2007;130(Pt 1):170-80.
97. Lin X, Tench CR, Morgan PS, Niepel G, Constantinescu CS. 'Importance sampling' in MS: use of diffusion tensor tractography to quantify pathology related to specific impairment. J Neurol Sci. 2005 15;237(1-2):13-9.
98. Yu CS, Li KC, Xuan Y, Ji XM, Qin W. Diffusion tensor tractography in patients with cerebral tumors: a helpful technique for neurosurgical planning and postoperative assessment. Eur J Radiol. 2005;56(2):197-204.
99. Powell HW, Parker GJ, Alexander DC, et al. MR tractography predicts visual field defects following temporal lobe resection. Neurology. 2005 23;65(4):596-9.
100. Mamata Y, Mamata H, Nabavi A, et al. Intraoperative diffusion imaging on a 0.5 Tesla interventional scanner. J Magn Reson Imaging. 2001;13(1):115-9.

16 UNDER REVIEW: DO NOT DISTRIBUTE
101. Nimsky C, Ganslandt O, Hastreiter P, et al. Intraoperative diffusion-tensor MR imaging: shifting of white matter tracts during neurosurgical procedures--initial experience. Radiology. 2005;234(1):218-25.
102. Nimsky C, Ganslandt O, Merhof D, Sorensen AG, Fahlbusch R. Intraoperative visualization of the pyramidal tract by diffusion-tensor-imaging-based fiber tracking. Neuroimage. 2006 1;30(4):1219-29.
103. Salvan CV, Ulmer JL, Mueller WM, Krouwer HG, Prost RW, Stroe GO. Presurgical and intraoperative mapping of the motor system in congenital truncation of the precentral gyrus. AJNR Am J Neuroradiol. 2006;27(3):493-7
104. Wakamoto H, Eluvathingal TJ, Makki M, Juhasz C, Chugani HT. Diffusion tensor imaging of the corticospinal tract following cerebral hemispherectomy. J Child Neurol. 2006;21(7):566-71.
105. Wieshmann UC, Symms MR, Clark CA, et al. Wallerian degeneration in the optic radiation after temporal lobectomy demonstrated in vivo with diffusion tensor imaging. Epilepsia. 1999;40(8):1155-8.
106. Khong PL, Kwong DL, Chan GC, Sham JS, Chan FL, Ooi GC. Diffusion-tensor imaging for the detection and quantification of treatment-induced white matter injury in children with medulloblastoma: a pilot study. AJNR Am J Neuroradiol. 2003;24(4):734-40.
107. Qiu D, Leung LH, Kwong DL, Chan GC, Khong PL. Mapping radiation dose distribution on the fractional anisotropy map: applications in the assessment of treatment-induced white matter injury. Neuroimage. 2006 15;31(1):109-15.
108. Sundgren PC, Fan X, Weybright P, et al. Differentiation of recurrent brain tumor versus radiation injury using diffusion tensor imaging in patients with new contrast-enhancing lesions. Magn Reson Imaging. 2006;24(9):1131-42.
109. Mabbott DJ, Noseworthy MD, Bouffet E, Rockel C, Laughlin S. Diffusion tensor imaging of white matter after cranial radiation in children for medulloblastoma: correlation with IQ. Neuro-oncol. 2006;8(3):244-52.
110. Khong PL, Leung LH, Fung AS, et al. White matter anisotropy in post-treatment childhood cancer survivors: preliminary evidence of association with neurocognitive function. J Clin Oncol. 2006 20;24(6):884-90.
111. Blood AJ, Tuch DS, Makris N, Makhlouf ML, Sudarsky LR, Sharma N. White matter abnormalities in dystonia normalize after botulinum toxin treatment. Neuroreport. 2006 21;17(12):1251-5.
112. Sinha S, Bastin ME, Wardlaw JM, Armitage PA, Whittle IR. Effects of dexamethasone on peritumoural oedematous brain: a DT-MRI study. J Neurol Neurosurg Psychiatry. 2004;75(11):1632-5.
113. Jiang Q, Zhang ZG, Ding GL, et al. MRI detects white matter reorganization after neural progenitor cell treatment of stroke. Neuroimage. 2006;32(3):1080-9.