Embed Size (px)
Citation preview

1
Discussion Paper No. 58
DIFFUSION OF HIGH YIELDING VARIETY OF COFFEE: A STUDY OF CHANDRAGIRI VARIETY
IN KARNATAKA, INDIA
K.J. Joseph
P.K. Viswanathan
Sajitha A

2

3
NRPPD Discussion Paper
58
DIFFUSION OF HIGH YIELDING VARIETY OF COFFEE:
A STUDY OF CHANDRAGIRI VARIETY IN KARNATAKA, INDIA
K.J. Joseph
P.K. Viswanathan
Sajitha A
2019

4
These Discussion Papers are produced by the National Research Programme on
Plantation Development (NRPPD) Sponsored by the Ministry of Commerce,
Government of India, at Centre for Development Studies (CDS). The papers in this
series aim to provide a platform for publishing preliminary results of the policy
oriented research and it is meant for encouraging discussion and debate.
The views expressed in this publication are those of the authors’ and do not
necessarily reflect the views and policies of the NRPPD/CDS or the Ministry of
Commerce. When reporting or citing this paper, the authors’ names should be
stated clearly.
The paper has been presented at an NRPPD Workshop at the Centre and has been
subjected to an open refereeing process. The paper is one of the last in the series of
NRPPD Discussion Papers.
Copyright © 2019, NRPPD, Centre for Development Studies, Trivandrum.
All rights reserved

5
ABSTRACT
With a view to address the issue of decline in the yield of Arabica coffee on account of various
factors, the Central Coffee Research Institute (CCRI) in India introduced Chandragiri variety.
This study examines the diffusion pattern of Chandragiri variety amongst the coffee growers and
the factors underlying the observed pattern. The field survey conducted in three major coffee
growing regions in Karnataka (Chickmagalur, Hassan and Kodagu) showed that about 50 per
cent of the sample growers have adopted Chandragiri variety, albeit with a notable interregional
variation. The extent of adoption is found to be the highest in Chickmaglur (61%) followed by
Kodagu (55%) and Hassan (33%). Regarding the pattern of adoption, most of the growers have
partially adopted (91%) the variety with full adoption being as low as 9%. An econometric
analysis using logistic regression has identified certain factors underlying the observed pattern
and provided plausible direction for future policy interventions for upscaling the adoption of the
variety. The study also brings out certain important concerns in the adoption of the variety
relating to yield level, management of diseases, labour shortage, seed provision at subsidised
rates, strengthening the extension support and IT enabled information delivery services, setting
up of testing labs, revamping the marketing and trade support systems for increasing the share of
small coffee producers in the value chain.

6
The Issue and Background
The importance of technological innovations for increasing production and productivity and
thereby improving the livelihood of farmers is a well-researched area in the innovation literature
(Feder et.al. 1985; Just and Zilberman 1988; Asfaw et.al. 2012 among others). Like other
plantation crops in India, an elaborate research and extension system is in place under the Coffee
Board, wherein the Central Coffee Research Institute (CCRI), over the last nine decades, has
been engaged into promoting technological innovations for the coffee sector. The R&D and
technological innovations offered by the CCRI included various aspects of planting, harvesting
and processing of coffee.1 However, notwithstanding the R&D and extension efforts, the
combined yield of the two major varieties of coffee (CoffeaArabica and Robusta)declined from
814 kg per hectare in 1970-71 to 773 kg per hectare in 2016-17 registering a decline of -0.11%
per annum, mainly on account of the decline in the yield of Arabica2. More specifically, the yield
of Arabica witnessed a decline from 725 kg per hectare in 1970-71 to 492 kg per hectare in
2016-17 at the rate of -0.84% per annum. An important step undertaken by the CCRI in this
regard was the introduction of the high yielding varieties of coffee3 among others. One such
variety introduced was Chandragiri, which is a new Arabica coffee cultivar4 released for
commercial cultivation on 28th
December, 2007 after twenty-one years of research and field
trials. Unlike other Arabica varieties, Chandragiri is characterized by, larger beans, high yield
potential5, superior beverage quality and higher resistance to the widely prevalent leaf rust
(Jayarama 2007). Thus, the introduction of Chandragiri variety could be considered as a
technological innovation by the CCRI towards bringing about a turnaround in productivity, inter-
alia by addressing the high incidence of white stem borer (WSB) leaf rust disease6.
1 Refer to http://chickmagalur.nic.in/htmls/ccri_main.htm for detailed information
2 The yield of Robusta increased from 943 kg per ha in 1970-71 to 1028 kg per ha in 2016-17 at the rate of 0.2%.
3 Since coffee is a perennial crop, the use of plant variety plays an important role in influencing the yield of the crop.
4a cross between Villa Sarchi and Hibrido de Timor
5 Chandragiri variety could yield 1150 kg to 1800 kg per hectare of coffee.
6A recent study by Gana Shruthy (2018) observed a radical shift from Arabica to Robusta cultivation due to the
heavy infestation of white stem borer.

7
From an analytical perspective, the present study is an attempt at understanding the farmer
adoption of the Chandragiri variety and considers it as the outcome of the new R&D innovation
with respect to its turnaround in productivity and adoption of the associated farm management
activities among the coffee growers in three major coffee growing regions in Karnataka
(Chickmagalur, Hassan and Kodagu)
The rest of the paper is organised as follows. It presents a discussion on the trends in the in area,
production and productivity of two major varieties of coffee- Arabica and Robusta (Section 2).
Section 3, presents a critical review of the different perspectives in analyzing the process of
technology diffusion followed by a brief description of the data and method used in the study in
section 4. Section 5 presents the empirical evidence based on the field survey followed by
concluding observations and policy pointers in Section 6.
2. Emerging Trends in Area, Production and Productivity of Coffee
There are over 125 countries that consume coffee and about 50% of them are coffee producers as
well. Globally, coffee is the second largest traded commodity after petroleum and with a clear
distinction of a product, which is being produced in the developing countries but is largely being
consumed in the developed world. The major coffee-growing geographies of the world are
mainly located in the four regions, viz., Africa, North and Central America, South America, Asia
and Oceania. The major coffee producing countries are Brazil (34%), Vietnam (18%), Indonesia
(6%), Colombia (9%), Mexico (13%), India (3%), Ethiopia (4%), Honduras (4%), Uganda (3%),
which together accounted for almost 94% of the global coffee output during 2018. Latin
American countries are the largest producers and exporters of coffee in the world occupying
about 2/3rd of the world production and exports. During 2012-13, the global coffee production
was 144.4 million bags (87 lakh MT) and consumption was 142 million bags (85.2 lakh MT),
with almost 30% of the coffee being consumed within the producing countries. As per the
estimates of the International Coffee Organization (ICO), global coffee production had increased
by about 10% since 2015 from 153529 (‘000 bags of 60 kg) in 2015 to 169531 (‘000 bags of 60
kg) in 2018. The increase in production was due mainly to increase in production in Brazil
(17.91%), Mexico and Central America (26%) and Africa (12.72%). India’s share in the global
production hovered around 3.4% during the period between 2015 and 2018. At the global level,
coffee sector employs about 100 million, including 26 million small growers (Coffee Board,
2014)signifying its importance in rural livelihoods in developing countries along with its crucial

8
bearing on achieving key sustainable development goals (SDGs) like no poverty, no hunger,
reduction in inequality, etc among others.
Coffee occupies a prime place of importance in India’s plantation sector ever since the colonial
era. India is the only country that grows almost all of its coffee under shade7 and is grown under
diverse climatic conditions well suited for cultivation of different varieties of coffee. While some
coffee growing regions with high elevation are ideally suited for growing Arabica of mild
quality, those with warm humid conditions are best suited for Robusta. In the global scale, India
occupies hardly 2% of the coffee area with about 4% of production. While Robusta coffee is
ranked third, Arabica coffee is ranked 5th
in the global coffee production map. As per 2017-18
data, there are a total of 3.66 lakh coffee holdings in India with a coffee bearing area of 4.13 lakh
ha and the average size of coffee holdings was 1.13 ha. India exports almost 25% of its coffee
output and during 2016-17, the country exported 80.84 thousand tons of coffee with export
earnings of Rs. 926.85 crores. The coffee sector employs about 6.59 lakh workers on a daily
basis (Coffee Board, 2018).
In terms of regional concentration of area and production, the three South Indian states, viz.,
Karnataka (53%), Kerala (28%) and Tamilnadu (11%) together account for almost 92% of the
total coffee production and rest of the states,viz., Andhra Pradesh, Orissa, Assam and Tripura,
account for 8%. Hilly terrains and good monsoon in this region make it the best place for
important varieties of coffee plantation. Chikmagalur, one of the famous hill stations in
Karnataka state located in the foothills of Mullayanagiri range, also known as the coffee land
of Karnataka, is the place in India where coffee was first introduced. Its geography and climate
make it one of the largest coffee estates in Karnataka followed by Kodagu, Coorg and Hassan.
Trends in coffee area and production reveal that both the dominant varieties of coffee, viz.,
Arabica and Robusta have grown almost equally in terms of area, while the share of Robusta
coffee had grown faster over time. For instance, in terms of area, both Arabica and Robusta are
7India cultivates its entire coffee under a well-defined two-tier mixed shade canopy, comprising evergreen
leguminous trees with nearly 50 different types of shade trees found in coffee plantations. Shade trees prevent soil
erosion on a sloping terrain and enrich the soil by recycling nutrients from deeper layers, protect the coffee plant
from seasonal fluctuations in temperature, and play host to diverse flora and fauna (Coffee Board).

9
grown in 50% of the total coffee area, whereas, the share of Robusta in total production had
significantly increased from mere 18% during 1950-51 to 70% during 2017-18 (Figure 1).
Figure 1: Trends in Coffee Area and Production (type-wise) in India
Source: Coffee Board, India
Table 1 presents the type-wise distribution of coffee production across the major states.
Accordingly, Karnataka state dominates (70%) in terms of production of Arabica (73%) and
Robusta (69%) coffee, followed by Kerala (21%) and Tamilnadu (5.5%). Nevertheless, as
evident from the Table, coffee production in India had declined between the two periods and the
observed decline is more pronounced in case of Karnataka in the production of both the coffee
varieties (Arabica -12% and Robusta -11%).
Table 1: Status of Coffee Production – state-wise (2015-16 and 2017-18) [in MT]
State
2015-16 2017-18 Change in production
Arabica Robusta Total Arabica Robusta Total Arabica Robusta Total
Karnataka 78650 172870 251520 69025 153275 222300 -12.2 -11.3 -11.6
Kerala 2200 67030 69230 2160 63575 65735 -1.8 -5.2 -5.0
Tamilnadu 12810 4485 17295 13400 4040 17440 4.6 -9.9 0.8
Others (NT) 9840 115 9955 10415 110 10525 5.8 -4.3 5.7
All India 103500 244500 348000 95000 221000 316000 -8.2 -9.6 -9.2
Note: NT – Indicates Non-traditional coffee growing states.
Source: Estimated based on Coffee Board Data
The long-term trends in coffee production as presented in Figure 2shows that production of
Arabica had declined drastically after the triennium 1999-2000 and slowly started recovering

10
only after 2008-10 and remained stagnant over the recent years at about less than 1 lakh tonnes.
On the other hand, the production of Robusta had increased ever since the early 1990s and
peaked during the triennium 1998-2000 followed by a decline thereafter till 2007-09.
A simple decadal growth trend in the production of coffee for the period 1990-91 to 20017-18,
reveals that the production of both the Robusta and Arabica coffees had increased during the
period 1990-2000, the simple triennial growth rate being 7.9% for Robusta and 4.3% for
Arabica. However, the period between 2001 and 2010 witnessed a drastic decline in the growth
of coffee output, the triennial average growth rate becoming negative in case of Arabia (-1.6%)
and 1.2% in case of Robusta. Further, over the next decade, the growth in coffee output had
slightly improved, the average triennial growth rate being 0.2% in case of Arabica and 1.8% in
case of Robusta during the period 2010-2017.
Figure 2: Trends in Coffee Production in India (three year moving average) (in ‘000 MT)
Source: Estimated based on Coffee Statistics, Coffee Board, India.
The growth in area and production of Robusta in India as observed may be attributed to the
relatively higher productivity of Robusta coffee varieties. At the aggregate level, a comparison of
type-wise productivity of coffee reveals that the productivity of Robusta coffee (1000-1100
kg/ha) is more than double that of Arabica (400-500 kg/ha). The trends in the productivity of
Robusta and Arabica coffee as reported from Karnataka state, which accounts for almost 70% of
the total Robusta production in India, reflects the distinct productivity differences observed
between the two coffee varieties (Figure 3).
It is evident from Figure 3 that the yield per hectare of Robusta was significantly higher than that
of Arabica. More importantly, in case of Robusta, declining yield since 2015-16 notwithstanding,

11
there has been an increasing trend in the yield; from about 1100 Kgs per ha in 2007-08 to 1480
Kgs per ha in 2015-16. But in case of Arabica, yield declined from 801 Kgs per ha in 2011-12 to
692 Kgs per ha in 2017-18. To the extent that Arabica cultivation is more labour intensive and
involves higher cost of cultivation (GanaShruthy, 2018), as the plant is less sturdy and prone to
diseases, the decline in yield would have its adverse effect on the fortunes of Arabica cultivators.
Figure 3: Productivity of Coffee by type in Karnataka, 2007-08 to 2017-18
Source: Estimated based on Coffee Statistics, Coffee Board, India.
The recent trend in the shift in the area under cultivation in favour of Robusta, especially, the
introduction of Chandragiri variety by the CCRI needs to be seen in this context. For the present
paper, the point of concern is to ‘understand to what extent the new variety has been helpful in
making a turnaround in the yield of Arabica which in turn depends on the adoption of the new
variety by the grower?’
From Figure 4, it may be seen that the Arabica variety always enjoyed a price advantage over
Robusta. For instance, the difference in prices was in favour of Arabica and it remained very
high all through the period, except the years 2008 and 2013. However, compared to Robusta, the
Arabica prices experienced greater fluctuations after 2011, when there was a steep fall during
2013, followed by a steep rise in 2014, which again shown a declining trend thereafter,
narrowing down the differences at Chikmagalur. The price advantage of Arabica has also seemed
to have been adversely affected in view of the wider fluctuations in recent years. For instance,
the intra-year fluctuations in the farm gate prices of Arabica were much higher in comparison to
the Robusta, as evident from the lower growth in prices of Arabica in relation to Robusta as well
as the declining ratio between Arabica and Robusta prices in the recent years.

12
Figure 4: Trends in Farm Gate Prices of Coffee Varieties at Chikmagalur, Karnataka
Source: Estimated based on Coffee Board data.
At this juncture, an examination of the coffee holding structure may be relevant. In sync with
the general trend in India’s plantation sector, wherein small growers are the dominant producers
including in tea, data presented in Table 2 suggests that coffee is also a crop with small-holder
domination. As per the data available from the Coffee Board of India, smallholders(holdings
below 10 ha) account for almost 99% of the total coffee production area across all regions as
evident from Table 2.
Thus, viewed in the context of declining production and productivity coupled with heightened
international competition and their bearing on the livelihood of small holders who dominate the
sector, the Coffee Board ‘initiative to develop a new variety (ie., Chandragiri) with the twin
desirable attributes – high productivity and disease resistance, especially to leaf rust, is
commendable indeed. The point of contention, however, is to what extent this new variety has
been diffused such that this innovation could be instrumental in bringing about a paradigm shift
in coffee productivity and the factors that influence its adoption and upscaling.
40 4054
6881 85
98
135 139
203
160
128
200
182
162 158
2432 37
49 5568
91 97
69
97
132
117
141
113 110
126
16 1724
41 40 4251 53
62
9783
66
9785
7381
12 15 1624
32 3645
37 39
5360 59
6859 60
69
0
25
50
75
100
125
150
175
200
225
2002 2003 2004 2005 2006 2007 2008 2009 2010 2011 2012 2013 2014 2015 2016 2017
Rs.
/ K
g
Chikmagalur Arabica Parchment Chikmagalur Robusta Parchment
Chikmagalur Arabica Cherry Chikmagalur Robusta Cherry

13
Table 2: Region and State-wise Distribution of coffee holdings in India, 2017-18
Region/ State Number of Landholdings Relative
share of the
state/ region Below 10 Ha Share of <10ha Above 10 ha Total
(a) Chikmagalur 20513 94.0 1338 21851 6.0
(b) Hassan 13763 97.3 387 14150 3.9
(c) Madikeri 21492 99.0 245 21737 5.9
(d) Virajpet 21203 99.0 242 21445 5.9
1. Total for Karnataka 76971 97.2 2212 79183 21.6
2. Kerala 77584 99.6 277 77861 21.3
3. Tamil Nadu 17656 98.1 350 18006 4.9
4. Total for Traditional Areas 172211 98.4 2839 175050 47.8
5. Non Traditional Areas 178689 100.0 26 178715 48.8
6. NER Region 12466 99.9 11 12477 3.4
Grand Total 363366 99.2 2876 366242 100.0
Source: Coffee Board, Coffee Statistics.
3. The Analytics of Technological Diffusion
Technological diffusion is often considered as the process by which innovations - new products,
new processes or new management methods - spread within and across economies. To the extent
that it is the application of innovations (diffusion) rather than the generation of innovations
(invention or R & D) that leads to the realization of benefits from technological advance, public
policy has given much importance to the diffusion of innovations Given the importance of
innovations in agriculture in expanding the opportunities to increase production and income,
there exists a vast literature discussing the theoretical and empirical explanations for varied
patterns of adoption behaviour by the farmers. Following Rogers (1962), the process of
diffusion has been understood as involving different stages as depicted in Figure 5. In the case of
most innovations, diffusion is also a process to begin with and catches up over time and as most
of the users have adopted the rate of diffusion declines. Depending on the nature of behaviour of
adopters they are divided into innovators and early adopters who adopt the innovation in the
early stage itself, early majority, late majority and the laggards. Understanding this process and
factors governing the behaviour of adopters has attracted much scholarly attention in the
literature.

14
Figure5: Stages in the diffusion of innovations
Theoretically, there are three broad perspectives on adoption of innovations, viz., (a) neo-
classical perspective (Rogers, 1962, Stoneman 1981; Griliches 1957; Binswanger et al, 1978);
(b) adaption (economic history) perspective (Brown, 1981; Rosenberg, 1972); and (c) innovation
system/adoption perspective (Spielman, 2005; Biggs and Clay, 1981; Hall and Clark, 1995),
which also takes into account the role of diffusion agents or the actors facilitating diffusion like
those involved in extension.
The neoclassical approach that considers technological change as a linear process, involves three
stages – invention, innovation and diffusion, wherein diffusion is viewed broadly as individual
and aggregate adoption. Individual adoption is defined as "the mental process an individual
passes from first hearing about an innovation to final adoption" (Rogers, 1962 p. 17). Aggregate
adoption/diffusion could be understood in terms of the aggregate level of use of a specific new
technology within a given geographical area or a given population (Feder et al, 1985). The
traditional neo-classical approach builds on epidemic models of diffusion, understands adoption
in terms of decision making of the farmers about the extent and intensity of use of new
technology at each point throughout the adoption process. There are subjective (on account of
unfamiliar technologies/risk aversion) and objective factors (farm size, credit, insufficient human
capital, labour availability, supply constraints) that influences the farmer’s adoption behaviour
(Feder et al, 1985). Thus, farm and farmer characteristics along with demand conditions assume
importance here. While the neo-classical perspective assumes that innovation is the same over
time, economic history perspective analyses adoption of technologies focusing on the process of

15
change in the innovations, thus giving emphasis to supply-side factors. Going beyond the
conventional linear approach of innovation and diffusion, the Innovation System (IS) approach
highlights the role of interactive learning between actors involved in the generation,
dissemination and use of knowledge wherein institutions play a significant role. Thus, viewed
unlike the earlier approaches, the IS approach explicitly recognizes the role of institutional
context as well as the role of diffusion agents in governing innovation and diffusion process.
There exists a vast empirical literature on farmers’ behaviour related to the adoption of
innovation which by and large emphasizes on specific technological innovations in particular
crops, regions and countries. However, except for a few studies, much of the empirical work has
not paid due attention to the theoretical framework that specifies structural relationships and
interdependencies. Thus the insights drawn from such studies may not correspond to any
reasonable underlying decision behaviour of the farmers (Feder et al, 1985), especially, coffee
farmers in this specific context. As mentioned earlier, akin to other plantation crops in India, in
case of coffee too, the state through the Coffee Board and CCRI has been actively engaged in the
generation and diffusion of technological innovations underlying the relevance of innovation
system perspective. To the extent, the Chandragiri variety has not been subjected to any change
since its introduction, the relevance of adaption (economic history perspective) appears to be
limited. Hence, in what follows we shall explore diffusion of Chandragiri variety by drawing
insights from the neoclassical perspective and the innovation system (IS) perspectives.
4. Data and Methods
To explore the issue in detail, the study used both primary and secondary data for analysis. The
secondary data has been collected from the coffee board statistics in a historic perspective. To
understand the adoption of Chandragiri variety among the growers, a primary survey was
undertaken at three major coffee-growing districts in Karnataka, viz., Chickamaglur, Hassan and
Kodagu. A sample of 600 coffee growers was selected for the study based on random sampling
method and the number of sample households covered was 201 from Chikamagalur, 199 from
Hassan and 200 from Kodagu.
Using a structured questionnaire, the primary survey gathered the farm household information,
production, adoption and the institutional interventions with respect to the diffusion of coffee
variety. The survey, administered in close collaboration with the Coffee Board, has been
16
supplemented with two focused group discussions (FGDs) with coffee growers organized in
association with the Coffee Board in Coorg and Chickmagalur. The data was analysed in terms
of descriptive statistics and an econometric analysis involving logistic regression was used to
understand the role of farmer, farm, crop and institutional characteristics on the adoption of
Chandragiri variety by the farmers.
5. Adoption of Chandragiri Variety: Analysis of Empirical Evidence and Discussion
As discussed in the foregoing section, coffee varieties in India are broadly classified as Arabica
and Robusta. Arabica is considered as a mild coffee, which has higher market value as compared
to Robusta beans. On the other hand, Robusta has more strength, which is used for making
several blends. Unlike Robusta, the Arabica varieties are more susceptible to pests and diseases
such as leaf rust, white stem borer etc. and requires more shade to grow (Sood, 2017). Further,
while, the extent of international competition from low-cost producers like Vietnam is higher in
case of Robusta, the extent of competition is lower in Arabica.
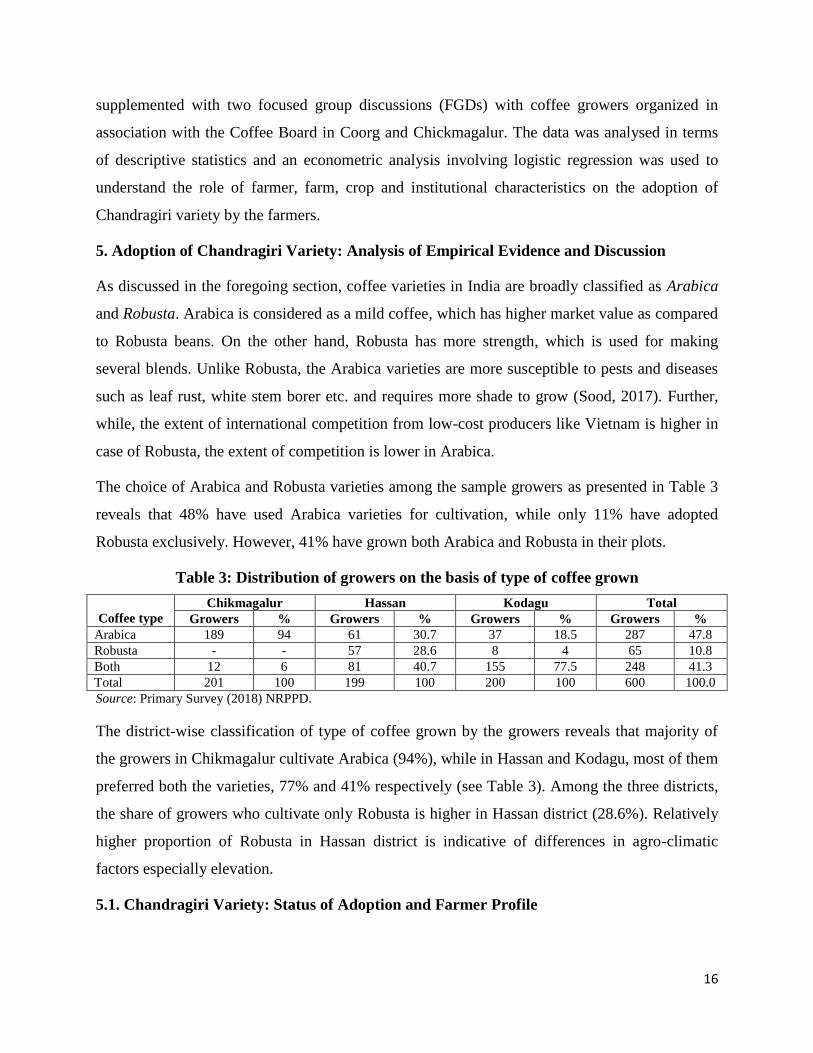
The choice of Arabica and Robusta varieties among the sample growers as presented in Table 3
reveals that 48% have used Arabica varieties for cultivation, while only 11% have adopted
Robusta exclusively. However, 41% have grown both Arabica and Robusta in their plots.
Table 3: Distribution of growers on the basis of type of coffee grown
Coffee type
Chikmagalur Hassan Kodagu Total
Growers % Growers % Growers % Growers %
Arabica 189 94 61 30.7 37 18.5 287 47.8
Robusta - - 57 28.6 8 4 65 10.8
Both 12 6 81 40.7 155 77.5 248 41.3
Total 201 100 199 100 200 100 600 100.0
Source: Primary Survey (2018) NRPPD.
The district-wise classification of type of coffee grown by the growers reveals that majority of
the growers in Chikmagalur cultivate Arabica (94%), while in Hassan and Kodagu, most of them
preferred both the varieties, 77% and 41% respectively (see Table 3). Among the three districts,
the share of growers who cultivate only Robusta is higher in Hassan district (28.6%). Relatively
higher proportion of Robusta in Hassan district is indicative of differences in agro-climatic
factors especially elevation.
5.1. Chandragiri Variety: Status of Adoption and Farmer Profile

17
As stated, the focus of the study is to understand the status of adoption of Chandragiri variety
over other Arabica varieties8 in particular, and Robusta in general. Chandragiri is a new
Arabica coffee, a cultivar developed from the cross between VilllaSarchi and Hibrido de Timor,
and released for cultivation in India on 28 December 2007. This cultivar produces plants with
drooping branches covering the entire main stem. The loose clusters in these plants facilitate the
uniform development of berries and harvesting. Chandragiri is characterized by larger beans and
superior beverage quality compared to other Arabicas. The yield of 5 to 7year-old Chandragiri
plants in experimental and private plantations ranges between 1000 and 1875 kg/ha. More than
93-95% of Chandragiri plants derived from self-pollinated seeds are resistant to existing coffee
rust (Hemileiavastatrix) races. However, the incidence of leaf rust disease in open-pollinated
seed progenies is as high as 25-27%. Chandragiri plants also exhibit resistance to white stem
borer [Xylotrechusquadripes], mainly due to the drooping branches and high foliage retention
that act as barriers (Jayarama, 2007).
At the outset, the analysis contained in this paper needs to be taken with a caveat, because, the
Chandragiri variety has been introduced only 10 years prior to the survey. Being a plantation
crop with a gestation lag of about 5-7 years, it may be too early to comment on the results of the
impact of the diffusion process. This is because timeframe plays a crucial role in the adoption of
any innovation, making it not possible in this case to draw a clear distinction between three
categories of adopters - early adopters, early majority, late majority and the laggards.
Table 4 indicates that within a period of just 10 years after the introduction of Chandragiri,
almost half (50.5%) of the growers have adopted this variety with inter-regional variation. The
adoption is found highest in Chickmagalur district (61%), where Arabica grows in plenty,
followed by Kodagu (54.5) and Hassan (32.7) being the lowest.
Table 4: Distribution of growers on the basis of adoption of Chandragiri Variety
Chandragiri
Adoption
Chickmagalur Hassan Kodagu Total
Growers % Growers % Growers % Growers %
Non Adopters 78 38.8 134 67.3 91 45.5 303 50.5
Adopters 123 61.2 65 32.7 109 54.5 297 49.5
Total 201 100 199 100 200 100 600 100
Source: Primary Survey (2018), NRPPD.
8The major Arabica varieties grown in India are coffee, S.795 coffee, S.6 coffee Cauvery coffee and Chandragiri.

18
Adoption of any new plant variety, especially in case of a perennial plantation crop, involves
considerable risk because of the uncertainty associated with its adoption. Notably, the adoption
of the new variety will be undertaken only by those who intend to do replanting or new planting
following the introduction of the new variety. Here the growers will have the option of either full
adoption (doing the entire replanting or replanting with the new variety) or partial adoption.
Hence to get a better understanding of the adoption behaviour, we have classified the sample
growers into two sub-groups, viz., full adopters and partial adopters. It is observed from Table
5that only about 9% of the total adopted growers across districts have fully adopted only
Chandragiri, while majority (91%) have adopted the Chandragiri along with other coffee
varieties.
Table 5: Distribution of growers on the basis of selection of different
varieties along with Chandragiri
Adoption of
Chandragiri
Chickmagalur Hassan Kodagu Total
No of
Growers %
No. of
Growers %
No. of
Growers %
No. of
Growers %
Full Adopters 11 8.9 13 20.0 2 1.8 26 8.8
Partial Adopters 112 91.1 52 80.0 107 98.2 271 91.2
Total Adopters 123 - 65 - 109 - 297 -
Source: Primary Survey (2018) NRPPD.
Despite being a region where Arabica varieties grow in plenty, Chikmagalur has only 11 sample
growers (out of 123), who have fully adopted Chandragiri. While in Kodagu district, number of
growers is only two (out of 109), which is only 1.8 per cent. In short, majority of the sample
growers remained partial adopters, which suggests that the growers in general, are not fully
convinced about the superiority of the new clone over the existing ones. To substantiate this, it
was understood from the FGD with the growers that the new variety with larger number of plants
per hectare and shorter gestation lag has had a yield of 1796kg per ha in the 5th
year, which went
down to 700-800 kg/ ha at the time of the survey. What is being offered now from the private
nurseries, on account of the absence of any system of certification in place, the new variety being
sold are the poor cousins of the original Chandragiri. It was also stated that the package of
practices has not been modified to consider the changing climatic conditions and that the coffee
growers are still waiting for a ‘wonder clone’ in Arabica that will bring about a turnaround in
productivity. In what follows, we explore the farm and farmer characteristics along with the
institutional arrangements, to discern the observed diffusion pattern.

19
5.2. Farm Household Characteristics
Table 6 provides a summary of the characteristics of the sample households disaggregated by
their adoption status of Chandragiri variety.
Table 6: Characteristics of the coffee households by adoption status of Chandragiri variety
Variable Non – Adopters
(n =303)
Full Adopters
(n=26)
Partial Adopters
(n=271)
Total
(n=600)
1. Age in years
Up to 45 56 (18.5) 0 44 (16.2) 100 (16.7)
46 to 65 221 (72.9) 22 (84.6) 185 (63.5) 428 (71.3)
Above 65 26 (8.6) 4 (15.4) 42 (15.5) 72 (12)
2. Gender (% of growers)
Male 266 (87.8) 23 (88.5) 249 (91.9) 538 (89.7)
Female 37 (12.2) 3 (11.5) 22 (8.1) 62 (10.3)
3. Family Size (members per family)
One member 7.6 15.4 14 10.8
Two members 15.2 11.5 10.3 12.8
Three members 19.8 19.2 20.7 20.2
4 members & above 57.4 53.8 55.0 56.2
4. Educational Status (years)
Up to 5 16 (5.3) 2 (7.7) 8 (4.6) 26 (4.3)
6 to 10 138 (45.5) 16 (61.5) 123 (45.4) 277 (46.2)
11 and above 149 (49.2) 8 (30.7) 140 (51.7) 297 (49.5)
5. Earning members in % to growers
One member 90.8 100 83.8 88
Two or more members 9.3 - 16.2 12.1
6.Primary Occupation (% of growers)
Cultivation 96.4 96.2 98.2 97.0
Livestock/Poultry/others 1.7 3.8 0.4 1.2
Non Agricultural income 1.9 - 1.6 1.8
7.Annual Income share (% of growers)
Below 25,000 65.3 69.2 45.8 56.7
25 to 50,000 24.1 19.2 21.4 22.7
50 to 75,000 5.9 7.7 13.7 9.5
75,000 & above 4.6 3.8 19.2 11.2
8. Coffee income share to total income (% of growers)
Below 25 per cent 4 3.8 3.3 3.7
25 to 50 per cent 9.6 7.7 18.5 13.5
50 to 75 per cent 26.4 19.2 32.8 29.0
Above 75 per cent 60.1 69.2 45.4 53.8
9. Coffee cultivation started (% of growers)
Before 1950 204 (67.3) 20 (76.9) 173 (63.8) 397 (66.2)
1950 to 2000 88 (29) 4 (15.4) 89 (32.8) 181 (30.2)
After 2000 11 (3.6) 2 (7.7) 9 (3.3) 22 (3.7)
Note: *Figures in parentheses shows percentage to subtotal of growers; ** Figures in parentheses shows percentage
to subtotal of gender.
Source: Primary Survey (2018) NRPPD.
20
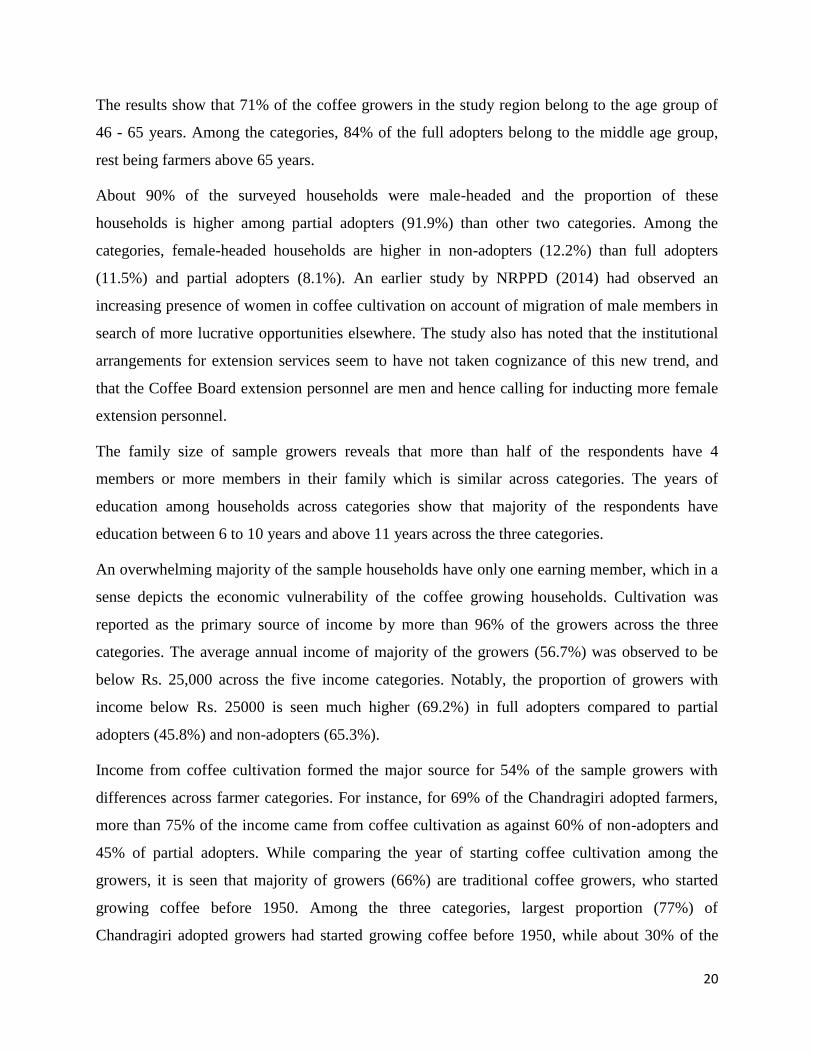
The results show that 71% of the coffee growers in the study region belong to the age group of
46 - 65 years. Among the categories, 84% of the full adopters belong to the middle age group,
rest being farmers above 65 years.
About 90% of the surveyed households were male-headed and the proportion of these
households is higher among partial adopters (91.9%) than other two categories. Among the
categories, female-headed households are higher in non-adopters (12.2%) than full adopters
(11.5%) and partial adopters (8.1%). An earlier study by NRPPD (2014) had observed an
increasing presence of women in coffee cultivation on account of migration of male members in
search of more lucrative opportunities elsewhere. The study also has noted that the institutional
arrangements for extension services seem to have not taken cognizance of this new trend, and
that the Coffee Board extension personnel are men and hence calling for inducting more female
extension personnel.
The family size of sample growers reveals that more than half of the respondents have 4
members or more members in their family which is similar across categories. The years of
education among households across categories show that majority of the respondents have
education between 6 to 10 years and above 11 years across the three categories.
An overwhelming majority of the sample households have only one earning member, which in a
sense depicts the economic vulnerability of the coffee growing households. Cultivation was
reported as the primary source of income by more than 96% of the growers across the three
categories. The average annual income of majority of the growers (56.7%) was observed to be
below Rs. 25,000 across the five income categories. Notably, the proportion of growers with
income below Rs. 25000 is seen much higher (69.2%) in full adopters compared to partial
adopters (45.8%) and non-adopters (65.3%).
Income from coffee cultivation formed the major source for 54% of the sample growers with
differences across farmer categories. For instance, for 69% of the Chandragiri adopted farmers,
more than 75% of the income came from coffee cultivation as against 60% of non-adopters and
45% of partial adopters. While comparing the year of starting coffee cultivation among the
growers, it is seen that majority of growers (66%) are traditional coffee growers, who started
growing coffee before 1950. Among the three categories, largest proportion (77%) of
Chandragiri adopted growers had started growing coffee before 1950, while about 30% of the

21
sample growers had started coffee cultivation between 1950 and 2000. Interestingly, the share of
growers who started coffee cultivation after 2000 was hardly 4%, indicating that new growers
are not attracted to coffee cultivation anymore.
5.3. Farm, Crop Characteristics and Practices
The coffee holdings in India can be classified into marginal (< 2 ha), small (2 -10 ha), medium
(10-25 ha) and large holdings (>25 ha). Following this national level classification, Table
7shows that marginal and smallholdings together accounts for almost 83% of the total sample
growers, whereas, about 6% operate coffee holdings above 25 ha. It was also observed that
almost 90% of the total sample growers have coffee as the major source of income, as the share
of coffee in total land area was above 50%.
Table: 7: Distribution of sample growers on the basis of area under coffee cultivation
Coffee area holdings
Non - Adopters
(n =303)
Full Adopters
(n=26)
Partial Adopters
(n=271)
Total
(n=600)
Marginal (Up to 2 ha) 119 (39.3) 14 (53.8) 51 (18.8) 184 (30.7)
Small (2.01 to 10 ha) 151(49.8) 11 (42.3) 149 (55.0) 311 (51.8)
Medium (10.01 to 25 ha) 24 (7.9) 0 46 (17.0) 70 (11.7)
Large (Above 25 ha) 9 (3.0) 1 (3.8) 25 (9.2) 35 (5.8)
Share of coffee area to total land owned
Below 50 Per cent 13.9 26.9 4.4 10.1
Above 50 Per cent 86.1 73.1 95.5 89.8
Source: Primary Survey (2018) NRPPD.
At the aggregate level, it is observed that an overwhelming majority (65%) of the marginal
growers are not adopting Chandragiri variety plausibly indicating their low risk-taking attitude.
However, out of the 26 growers reporting full adoption of Chandragiri, 14 growers (53.8%) are
with marginal holdings having a coffee area close to 2 hectares.
Quite interestingly, almost half (48%) of the small growers (149 out of 311), 66% of medium
growers (46 out of 70) as well as 71% of the large growers (25 out of 35), have partially adopted
Chandragiri variety. In contrast, only 28% of the marginal growers (51 out of 184) have partially
adopted Chandragiri variety. This suggests that landholding size has a direct bearing on the
partial adoption of Chandragiri variety as also evident from Figure 6.
Figure 6: Partial Adoption of Chandragiri Variety by different farm size Classes

22
Source: Primary Survey (2018) NRPPD.
Given that majority of the coffee growers operate smaller parcels of land, it is also observed that
73% of the full adopters operate only a single coffee plot, as against the partial adopters, 70% of
whom, own multiple plots (40% own 2 plots, 18% own 3 plots, 11% own more than 4 plots).
To explore the age structure of the coffee plants across categories, the age of the plants has been
grouped on the basis of the year 2007, when Chandragiri variety has been introduced for
commercial cultivation. It is observed that only about 14% of the partial adopters own relatively
younger coffee plant stock up to 10 years, while the rest (86%) own coffee plots having more
than 10 years of plant stock. This shows that the proportion of Chandragiri variety plants over
other coffee varieties may be less, which may be explained in terms of the fact that partial
adopters are still trying to experiment the performance of Chandragiri variety and adopt it
gradually. Among the non-adopters’ category, only about 13 per cent have recently done
replantation or new plantation and they preferred other varieties overChandragiri.
Figure 7presents the important reasons as to why the coffee growers did not consider the
Chandragiri variety for replantation and new plantation. Amongst the various reasons indicated,
high cost of maintenance of the plot was reported by almost 54% of the respondents. Another
22% of the growers were unsatisfied with a yield of the Chandragiri and hence decided not to
choose it for planting. Further, they have stated that the variety is more prone to pests and
diseases such as coffee leaf rust, white stem borer etc.

23
Figure 7: Reasons for not considering Chandragiri variety for replanting &newplanting
Source: Primary Survey (2018) NRPPD.
It is observed that 65% of the full adopters have not done soil testing as against 54% of non-
adopters and 32% of the partial adopters. With respect to the usage of fertilizer, almost 73% of
the growers have used fertilizers and this proportion seemed the highest in case of full adopters
(85%) compared to non-adopters (78) and partial adopters (66%). By and large, majority of the
coffee growers reported higher levels of fertilizer usage irrespective of the variety being adopted.
About 50% of the growers had reported undertaking various soil conservation measures and
quite interestingly, majority of the Chandragiri adopters (65%) reported not undertaking any soil
conservation measure. It is observed that full adopters have utilized up to 500 working days,
whereas, this proportion was a little lower in the case of the other two categories of farmers.
Notably, the usage of hired male labour and female labour was reported to be considerably lower
in the case of partially adopted farmers.
5.4. Perceptions about Chandragiri and Other Varieties
Respondents were asked to express their perceptions about the attributes of the Chandragiri and
other varieties that could have influenced while choosing the specific varieties. In case of
Unsatisfied with respect to yield, 21.5
High cost of maintenance, 53.8
Price difference, 3.2
Other reasons, 21.5

24
Chandragiri variety, a notable proportion of partially adopted farmers have reported the specific
attributes of the variety, such as increase in yield (21%), higher quality of beans (19.6%), rust
resistance of coffee leaves (16.5%), pest resistance (14%), adaptability to local climatic
conditions (16%) and drought resistance (13%), that have influenced their adoption of the variety
(Table 8). However, the proportion of growers reporting their perceptions about Chandragiri
variety was very low in the case of fully adopted growers.
Table 8: Growers’ perceptions about the attributes of Chandragiri and other varieties
Perceptions Chandragiri Other varieties
Fully Adopted Partially Adopted Not Adopted Partially Adopted
a) Increase in yield 9.8 (1) 21.2 (1) 29.8 (1) 30.8 (1)
b) Higher quality of beans 7.0 (2) 19.6 (2) 15.5 (4) 21.2 (2)
c) Pest resistant 7.0 (2) 13.7 (5) 9.6 (6) 7.4 (6)
d) Coffee leaf rust resistant 6.5 (3) 16.5 (3) 17.4 (2) 15.4 (4)
e) Drought resistant 6.0 (4) 12.8 (6) 11.7 (5) 9.0 (5)
f) Adapted to local climatic conditions 6.5 (3) 16.1 (4) 16.0 (3) 16.3 (3)
Note: Figures in brackets represent the respective rankings.
Source: Primary Survey (2018) NRPPD.
In the case of other varieties, both the categories of partially adopted and not adopted growers
had expressed their perceptions about the varieties and the proportion of growers were quite
significant in both the cases (ranging from 10-21% in case of not adopted growers and 7-31% in
case of partially adopted growers.
5.5. Institutional Interventions and Adoption
The questions on technological innovations included the status of awareness of the growers
about coffee varieties, especially, the Chandragiri variety, followed by questions on the adoption
of it, sources of information about the variety, the reasons for its adoption and non-adoption, etc.
The summary results are presented in Table 9.
Table 9: Institutional interventions inducing adoptionof Chandragiri Variety Variable Non adopters Full Adopters Partial Adopters Total
Awareness of Chandragiri (% to total growers) 63 100 100 81.3
1. Source of information (% of respondent growers)
a) Other growers 2.3 0 4.8 3.7
b) Training Programme 19.8 2.9 3.9 8.7
c) Extension agent visit 9.9 17.1 5.0 7.3
d) Reading Extension booklet 1.2 0.0 3.6 2.7
e) Mass contact programmes 42.4 60.0 47.9 47.0
f) Demonstration plots 5.8 8.6 9.0 8.0
g) Group meetings 7.6 2.9 8.7 8.0
h) Family and friends 2.9 2.9 7.0 5.5

25
i) Other sources 8.1 5.7 10.1 9.2
2. Reasons for Adoption
a) Higher yield - 45.5 35.6 36.3
b) Resistant to pests and diseases - 20.5 21.8 21.7
c) Larger beans - 13.6 14.3 14.3
d) Superior Quality - 11.4 6.2 6.6
e) Compatible with current farm practices - 4.5 6.4 6.2
f) suitable for climate - 4.5 10.5 10.1
g) other reasons - 0 5.3 4.9
3. Reasons for non-adoption
a) Not familiar 36.0 - - -
b) Risk averse 8.1 - - -
c) Lack of financial resources 5.1 - - -
d) Pests and disease attack 13.1 - - -
e) Labour shortage 8.1 - - -
f) Higher wages 9.1 - - -
g) Lack of technical advice 22.2 - - -
h) Unavailability of information 5.1 - - -
i) Not suitable for land terrain 29.3 - - -
Source: Primary Survey (2018) NRPPD.
Regarding the awareness about the Chandragiri variety, while both the full as well as partial
adopters were completely aware of, only 63% of the non-adopters were having knowledge about
the variety. This raises an important question, as to why about 37% of the non-adopters were not
aware of the variety and what reasons could be attributed to this lack of awareness? Is it related
to lack of extension services available or anything else that resulted in the lack of awareness? - It
is also important to consider that ‘had proper information about the Chandragiri variety been
given to these farmers, would that have raised the level of adoption?’. These points need further
elaboration in terms of fresh empirical investigations.
Regarding various sources of information, mass contact programmes was reported as the
important source by almost half (47-48%) of the respondents, the proportion being much higher
in case of full adopters (60%). Other major sources of information included the visit of extension
agents, demonstration plots, training programmes, group meetings, etc. Interestingly, almost 20%
of the non-adopters reported getting the information about the variety through training
programmes, though they have not adopted the variety. Reasonable numbers of non-adopters
also reported about the visit of extension agents, the conduct of group meetings and setting up of
demonstration plots. Yet, these extension related activities did not lead to an adoption of the
variety in case of the non-adopters.
Among the major reasons for adoption as revealed by the full and partial adopters, the attributes
of the Chandragiri variety, such as (a) higher yield, (b) resistance to pests and diseases, (c) large

26
beans, (d) superior quality, (e) climate suitability, etc, were important. The proportions of
growers reporting these attributes was more or less similar in case of both the full as well as
partial adopter categories. On the other hand, the important reasons for non-adoption as revealed
by the non-adopters were: (a) lack of familiarity (36%), (b) non-suitability of the variety to the
land terrain (29%), (c) lack of technical advice (22%), (d) pests and disease attack (13%), (e)
higher wages (9.1%), (f) labour shortage (8.1%), (g) risk aversion behaviour (8.1%), etc. Some
of the other reasons for non-adoption were that the existing coffee varieties are performing well
and these growers were hopeful of adopting the Chandragiri variety in future when they
undertake replanting or new planting activities.
5.6. Access to Information Sources and Technical Support
The growers were asked to share their responses as regards the information sources on the
varieties. Quite surprisingly, larger proportions of growers reported having no source of
information. The proportion of growers reported having ‘no source information’ was the highest
amongst the non-adopters (54%), followed by 42% in case of full adopters and 26% in case of
partial adopters.
As regards various channels of information, majority of the full adopters (47%)have reported that
they get access to formal information sources, while majority of the non-adopters (47%) reported
having access to informal information channels. In case of partial adopters, both formal and
informal channels of information were found to be quite important and influential, with 55% of
the non-adopters having access to both formal and informal sources of information about the
varieties and agro-management practices (Figure 8).
Figure 8: Access to information on coffee cultivation
Source: Primary Survey (2018) NRPPD.
27
Growers were asked to reflect on their interactions with the formal institutional agencies, such as
the Coffee Board, for seeking information, incentives and various support measures, for growing
coffee varieties, especially, Chandragiri. In this regard, the respondents were asked to report the
frequency of their visits to the Coffee Board. It was observed that majority of all categories of
growers (81% of partial adopters, 66% of the non-adopters and 46% of the full adopters) had
reported that their visits to the Coffee Board offices was purely need based and not regular.
However, majority of the full adopters seemed to be in regular contact with the Coffee Board
offices, with 38 % of them reporting weekly visits, followed by 15% of them making monthly
visits to the Coffee Board offices to seek guidance and support for cultivation.
The growers were further asked, ‘why they were unable to access the formal institutional
sources, such as the Coffee Board, for seeking information or any other support?’. It was
reported by majority of the respondents (60%) that such formal institutional sources, especially,
Coffee Board offices, does not exist near the farm holdings. Among the three categories, 67% of
the full adopter households (67%), 64% of the non-adopter households and 54% of the partially
adopted growers have reported the non-availability of the formal information channels.
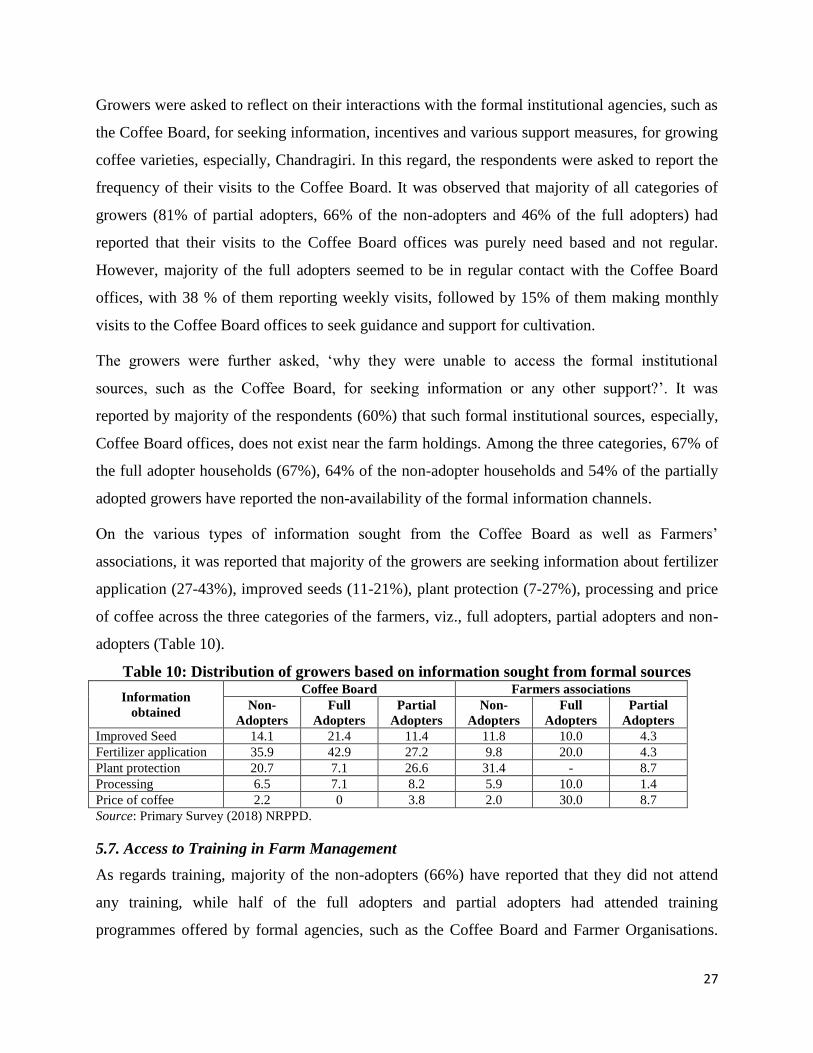
On the various types of information sought from the Coffee Board as well as Farmers’
associations, it was reported that majority of the growers are seeking information about fertilizer
application (27-43%), improved seeds (11-21%), plant protection (7-27%), processing and price
of coffee across the three categories of the farmers, viz., full adopters, partial adopters and non-
adopters (Table 10).
Table 10: Distribution of growers based on information sought from formal sources
Information
obtained
Coffee Board Farmers associations
Non-
Adopters
Full
Adopters
Partial
Adopters
Non-
Adopters
Full
Adopters
Partial
Adopters
Improved Seed 14.1 21.4 11.4 11.8 10.0 4.3
Fertilizer application 35.9 42.9 27.2 9.8 20.0 4.3
Plant protection 20.7 7.1 26.6 31.4 - 8.7
Processing 6.5 7.1 8.2 5.9 10.0 1.4
Price of coffee 2.2 0 3.8 2.0 30.0 8.7
Source: Primary Survey (2018) NRPPD.
5.7. Access to Training in Farm Management
As regards training, majority of the non-adopters (66%) have reported that they did not attend
any training, while half of the full adopters and partial adopters had attended training
programmes offered by formal agencies, such as the Coffee Board and Farmer Organisations.

28
This indicates that perhaps the non-adoption of the Chandragiri variety amongst the non-adopters
could be due to the lack of training opportunities in the vicinity of their farm holdings.
Majority of those who obtained training in agro-management (40%), reported that group
approach was one of the major focus areas of training imparted by the Coffee Board, followed by
participation in awareness campaigns (24%), coffee cultivation and processing (18%), supply of
seed coffee of elite planting materials (12%). There were notable differences across grower
categories in terms of the various components of training programmes they attended (Table 11).
Table 11: Distribution of growers on the basis of type of training
Training programmes Not Adopted Full Adopted Partial Adopted Total
Group Approach 56.1 47.6 30.5 39.7
Theme based workshop 8.8 14.3 4.3 6.2
Coffee cultivation and Processing 12.2 14.3 21.3 18.0
Awareness campaign 16.9 9.5 29.1 24.2
Supply of seed elite planting materials 6.1 14.3 14.9 12.0
Source: Primary Survey (2018) NRPPD.
We also elicited a question ‘whether the growers had opportunities to share their ideas or
suggestions for better management of farms with support from the institutional agencies, such as
the Coffee Board?.’ It was observed that the growers were able to present their ideas on the
possible interventions to be made in the fields of training, forming grower collectives, seed
provision, etc as evident from Table 12 indicating the responsiveness of the Coffee Board. The
ideas of group approach to training and capacity building, coffee cultivation and processing, etc
were also reported to be considered by the Board for implementation.
Table 12: Distribution of growers on the basis of ideas presented to Coffee Board and
considered by the Board
Training
Ideas presented (share to total) Ideas considered (share to ideas
presented)
Non-
adopters
Full
adopters
Partial
adopters Total
Non-
adopters
Partial
adopters Total
Group Approach 3 (14.3) - 9 (18.4) 12 (16.4) 1 (33.3) 7 (77.8) 8 (66.7)
Theme based workshop 5 (23.8) 2 (66.7) 7 (14.3) 14 (19.2) - 1 (14.3) 1 (7.1)
Coffee cultivation and
Processing 4 (19) - 18 (36.7) 22 (30.1) - 3 (16.7) 3 (13.6)
Awareness campaign 7 (33.3) - 11 (22.4) 18 (24.7) 1 (14.3) 3 (27.3) 4 (22.2)
Supply of seed coffee of
elite planting materials 2 (9.5) 1 (33.3) 4 (8.2) 7 (9.6) - 1 (25.0) 1 (14.3)
Total 21 3 49 73 2 (9.5) 15 (30.6) 17 (23.3)
Source: Primary Survey (2018) NRPPD.
5.8. Determinants of ‘Chandragiri’ Adoption: An Econometric Analysis
The study revealed that almost half (49.5%) of the 600 sample households had adopted
Chandragiri variety, introduced by the Coffee Board 10 years ago. To explore the factors that

29
influence the decision of the grower to adopt or not, we have used a binary variable indicating 1
for adoption and 0 for non-adoption. We used a binomial logit regression to examine the farmer,
farm, crop and institutional factors that influence the possibility of exposure to Chandragiri
variety over other Arabica and Robusta varieties. The estimated model is stated as follows:
The probabilities depend on a vector of observed covariates . The simplest idea would be to
let be a linear function of the covariates, say:
Where β is a vector of regression coefficients. This model is also called the linear probability
model and is often estimated from individual data using ordinary least squares (OLS).
As observed, the dependent variable takes the value of 0, if the coffee grower decides not to
adopt the variety, and takes the value 1, if the grower adopts the Chandragiri variety. The
independent variables considered in the model represent the farmer characteristics (like age
education gender, family labour, extent of dependence on hired labour etc of the grower), farm
attributes (size of holding, number of plots cultivated) along with variables indicating the role of
institutional interventions, like sources of information and the extent of training availed by the
growers. The descriptive statistics of the model is presented in Table 13.
Table 13: Variable description and Summary Statistics
Variable Non- Adopters (n= 303) Full Adopters (n=297)
Mean SD Mean SD
Age of the household head ( years) 53.38 8.904 56.02 9.486
Education of the head (years) 11.01 2.899 11.42 2.859
Gender (1- male, 0-female) 1.1221 0.32796 1.0842 0.27812
Average monthly income (Rs.) 38613.86 24630.91 54713.81 38703.68
Family labour employed (1=yes, 0=no) 0.33 0.471 0.3502 0.47783
Area under coffee cultivation ( ha) 5.1777 7.03226 10.2859 15.29106
Plot number (1=Single, 0= multiple) 0.67 0.471 0.34 0.475
Access to information (0=none, 1=
formal, 2= informal, 3= both) 0.4653 0.49962 0.7239 0.44782
Training attended (1=yes, 0=no) 0.4884 0.86451 1.0202 1.21905

30
The result of the logistic regression regarding the adoption and non-adoption of Chandragiri
variety is given in Table 14. The odds ratios show that farmer characteristics such as age,
average monthly income, family labour; farm characteristics such as area under coffee
cultivation, number of plots; crop characteristics such as area of coffee plants; and institutional
characteristics such as access to information and training attended were found to be statistically
significant. As the age of the grower increases, the odds of adopting Chandragiri variety was
higher than the odds of not adopting it. This suggests that the growers in the higher age groups
tend to have more experience about the varietal performance and thereby adopt the Chandragiri
variety for cultivation. The average monthly income and adoption rate of Chandragiri were
positively related, which suggests that with increasing income, the growers tend to take a risk to
experiment with new varieties than those having lower monthly incomes.
Table 15: Estimates of Logistic Regression Model for the decision to adopt Chandragiri
variety by the Coffee Growers
Explanatory Variables Adopted and Not Adopted
Coefficient Odds Ratio Z value
Age of the household head (years) 0.0248067*** 1.025117*** 2.39
Education of the head (years) 0.0326364 1.033175 0.99
Gender (1- male, 0-female) -0.1937497 0.8238641 -0.59
Average monthly income (Rs.) 9.896506*** 1.00001*** 3.0
Family labour employed (1=yes, 0=no) 3.55E-01* 1.426715* 1.71
Area under coffee cultivation (ha) 0.025503*** 1.025831*** 2.48
Plot number (1=Single, 0= multiple) -0.8274407*** 0.4371667*** -4.06
Access to information (0=none, 1= formal, 2= informal, 3= both) 0.5682141*** 1.765112*** 2.77
Training attended (1=yes, 0= no) 0.2865265*** 1.331794*** 2.9
Constant -2.618697*** 0.0728978*** -2.49
Non- adopters of Chandragiri are the reference category
Number of observations – 600
LRchi2 (10) = 130.90
Prob>chi2 = 0.0000
Pseudo R2 = 0.1574
Note: ‘*’, ‘**’ and ‘***’ indicates significance at 10%, 5% and 1% respectively.
The effect of employment of family labour on the adoption of Chandragiri was positively
significant, suggesting that the odds of those growers employing more family labour tend to
adopt Chandragiri variety,which requires more labour than other coffee varieties. As
hypothesized, with a per unit increase in area under coffee cultivation, the odds for adopting
Chandragiri was higher than not adopting it. The number of plots and the adoption decision
shows a negative relationship, meaning that when farmers have less number of plots, they tend to
adopt Chandragiri variety. Further, the lower age of the plants signifies the increased presence of
Chandragiri in the planting stock. As expected, the access to either formal or both formal and

31
informal sources of information increase the odds for adopting Chandragiri variety. Further, the
number of training attended has also a significant positive influence on the choice of Chandragiri
variety.
From the above discussion, it can be observed that those are not adopting Chandragiri variety
were the growers in the lower age groups, with low monthly income, higher dependence on hired
labour, less area under cultivation, multiple plots, higher age of coffee plants, less access to
various kinds of information related to cultivation of Chandragiri and not attending any training
from formal sources such as the Coffee Board.
6. Concluding Observations and Policy Pointers
With a view to address the issue of declining productivity in the Arabica variety of coffee in
which India has a definite advantage, the CCRI brought out the Chandragiri variety with high
yield potential and other attributes like resistance to wide-spread diseases like leaf rust and white
stem borer. As the outcome of this new innovation with respect to the much-needed turnaround
in yield depends on the extent of its diffusion among the coffee growers, the study was an
attempt at understanding the adoption pattern of Chandragiri by the coffee growers. Though
there are three broad perspectives in explaining the process of technology diffusion –adoption
perspective, adaption perspective and the innovation system perspective – the study adopted a
heuristic approach by combining the key aspects of adoption perspective and innovation system
perspectives. The adaption perspective is found having very limited relevance because the
Chandragiri variety has not been subjected to any change since its introduction a decade ago.
It is observed that within a period of about 10 years after the introduction of Chandragiri, about
half of the sample growers have adopted this variety with considerable inter-regional variations,
with the highest adoption in Chickmagalur district (61%) followed by Kodagu (54.5) and Hassan
(32.7). Interestingly, an overwhelming majority (91%) of the sample growers preferred partial
adoption with only 9% of growers reporting full adoption. A key issue of concern is that almost
half of the growers, according to the adoption perspective, are still remaining as laggards.
Further, it is observed that a larger segment of the marginal growers (65%) are not adopting
Chandragiri variety. Landholding size showed a direct bearing on the adoption behaviour,
presumably indicating the high risk-taking capability of larger growers. The finding that the
small and marginal growers are yet to consider the new variety as one that would help changing

32
their fortune tend to suggest that they are yet to be fully convinced about the superiority of this
variety. The major reasons reported for non-adoption are the high cost of maintenance and the
resultant lack of profitability9 and dissatisfaction with respect to yield. Hence, factors, such as
declining yield, higher cost of farming, the lack of profitability and market uncertainties, are the
key issues of concern. Here it may be noted that the wonder clone in cardamom, viz., Njallani
variety, introduced at the instance of a farmers, adopted by almost 90% of the growers in South
India within a period of few years (George and Joseph 1998) because the yield of the new variety
was 5-6 times higher than all the varieties that prevailed. At the same time, providing empirical
credence to the innovation system perspective, it was observed from the study that those not
adopting the new variety are faced with the lack of information and with limited interaction with
the institutional architecture for training and other activities for capacity building of growers. On
the other hand, the adopters especially, the full adopters are the ones who have participated more
intensively in the various capability building initiatives, like training programs along with
regular interaction with the extension system indicating the positive role of institutional
interventions in facilitating diffusion.
It was evident from the FGDs that the growers, given their high expectations in the face of new
challenges emerging from both price and non-price factors, are not satisfied with Chandragiri
and “they are still waiting for a wonder clone” to come and rescue. It was also stated that while
biotechnological options could be harnessed to come up with new varieties, such efforts are yet
to take place. It was also transpired from the discussion that currently, the R&D and extension is
almost entirely by the CCRI, with hardly any private sector involvement in the generation and
upscaling of innovations. Further, there have been neither any improvement or adaptations made
to the variety that was introduced more than a decade ago, nor enunciation of a new package of
practices to address the emerging challenges, inter alia, on account of increasing climate change
induced risks in coffee cultivation. In the absence of any certification, what is being offered now
from the private nurseries, is the poor cousins of the original Chandragiri. While subsidy could
9A recent study by Gana Shruthy (2018) reports that the netprofit from cultivation of Arabica worked out to be Rs.
15848 per ha in small and Rs. 687 per ha in semi-medium farms, while it turned out be negative in medium and
large farms, viz., -13109 and -23376 per ha respectively. In contrast, the net profits in Robusta worked out to be
quite high at Rs.49669 per ha in small, semi-medium (Rs.39731 per ha), medium (Rs.42041 per ha) and large
(Rs.12086 per ha) farms. The overall returns per rupee investment were found to be higher in Robusta (1.28) than
Arabica (0.99).

33
have been helpful at least partly in inducing growers in adoption, it was stated that application
for subsidies remains unattended for years and hardly any attempt is being made to come up with
alternatives for subsidized planting and replanting.
On the whole, going by the available evidence, the effectiveness of the technological innovation
by way of Chandragiri variety in making a turnaround in Arabica productivity appears at best
marginal. This is because, even after 10 years of its introduction, almost 50% of the growers
have not adopted this variety and those adopted have only adopted it partially. To the extent
institutional interventions have been helpful in facilitating diffusion, there is the need for more
intensified institutional interventions by way of increased extension and R&D effort inter alia by
harnessing the bio-technological options to come up with new varieties. Further, in the current
scenario wherein the role of the state is more important than ever before on account of multiple
challenges of increasing price as well as climate change risks, an increasing withdrawal of the
state leading to downsizing of R&D and extension systems is worrisome and badly needs a
reversal in terms of reinventing policies and institutional strategies. At the same time, given the
limits faced by the domestic R&D system, it is high time to explore the short-run options of
importing high yielding plant varieties like Tabi from Columbia for example, or the drought-
tolerant varieties available from Brazil, for promotion and wider adoption in India.
-------------------------------------
K.J. Joseph is the Coordinator of the NRPPD Programme, Centre for Development Studies.
P. K. Viswanathan serves as Professor (Economics) with specialised interests in the Economics
of Natural Resources Management and Sustainability, Amrita School of Business, Kochi, Amrita
Vishwa Vidyapeetham.
Sajitha A is Doctoral Scholar at the Centre for Development Studies. ---------------------------------------
References
Asfaw, S., Shiferaw, B., Simtowe, F., & Lipper, L. 2012. Impact of Modern Agricultural
Technologies on Smallholder Welfare: Evidence from Tanzania and Ethiopia. Food
policy, 37(3), 283-295.
Biggs, S. D., & Clay, E. J. 1981. ‘Sources of Innovation in Agricultural Technology.’ World
Development, 9(4), 321-336.

34
Binswanger, H. P., Ruttan, V. W., Ben-Zion, U., Janvry, A. D., & Evenson, R. E. 1978. Induced
Innovation; Technology, Institutions, and Development.
Brown, L. 1981. Innovation Diffusion, London: Methuen.
Coffee Board of India (various years). Coffee Statistics, Ministry of Commerce & Industry,
Government of India.
Feder, G., Just, R. E., &Zilberman, D. 1985. ‘Adoption of Agricultural Innovations in
Developing Countries: A Survey. Economic Development and Cultural Change, 33(2),
255-298.
Gana Shruthy. 2018. ‘A Study on Production and Marketing of Coffee in Western Ghats Region
of Karnataka,’ Thesis Submitted to the University of Mysore through the Department of
Economics and Cooperation, Mysore.
Griliches, Z. 1957. ‘Hybrid Corn: An Exploration In The Economics of Technological
Change.’ Econometrica, Journal of the Econometric Society, 501-522.
Hall, A. J., and N. G. Clark. 1995. ‘Coping with Change, Complexity and Diversity in
Agriculture: The Case of Rhizobium inoculants in Thailand. World Development 23(9):
1601–1614.
Jayarama. 2010. ‘Coffee Farming is a Business,’ Indian Coffee, 74(4): 3.
Just, R. E., & Zilberman, D. 1988. The Effects of Agricultural Development Policies on Income
Distribution and Technological Change in Agriculture. Journal of Development
Economics, 28(2), 193-216.
Rogers, E. M. 1962. Diffusion of Innovations. First edition. New York. Free Press.
Rosenberg, N. 1972. ‘Technology and American Economic Growth’ (p. 75). New York: Harper
& Row.
Sood, D. 2007. Production Picks up, while Exports Remain Stable, Coffee Annual, India,
https://gain.fas.usda.gov/Recent%20GAIN%20Publications/Coffee%20Annual_New%20Delhi_I
ndia_5-15-2017.pdf
Spielman, D. J. 2005. ‘Innovation Systems Perspectives on Developing-Country Agriculture: A
Critical Review’. International Food Policy Research Institute (IFPRI). International
Service for National Agricultural Research (ISNAR) division.
Stoneman, P. 1981. ‘Intra-firm Diffusion, Bayesian Learning and Profitability,’ The Economic
Journal, 91(362), 375-388.

35