Embed Size (px)
Citation preview

ngineering 53 (2006) 47–60www.elsevier.com/locate/petrol
Journal of Petroleum Science and E
Diffusion coefficients of methane in liquid hydrocarbons at highpressure and temperature
M. Jamialahmadi a, M. Emadi b, H. Müller-Steinhagen c,d,⁎
a University of Petroleum Industry, Ahwaz, Iranb Department of Chemical and Process Engineering, University of Surrey, UK
c Institute for Technical Thermodynamics, German Aerospace Centre (DLR), Germanyd Institute for Thermodynamics and Thermal Engineering, University of Stuttgart, Germany
Received 27 January 2005; received in revised form 30 January 2006; accepted 31 January 2006
Abstract
The accurate prediction of diffusion coefficients of methane in liquid hydrocarbons is one of the key parameters for improvingthe prediction of compositional oil reservoir simulators, for designing surface facilities, and for high pressure gas/liquid masstransfer operations. In this investigation, a precision high pressure and temperature diffusion cell apparatus has been used tomeasure diffusion coefficients of methane in dodecane and in a typical Iranian crude oil at high pressures and temperatures. Thediffusion cell is modelled using a finite-domain moving boundary method. Extensive experimental results are presented at highpressures and temperatures, especially for regions where published data were insufficient. The mechanism of mass transfer duringthe incubation period is analysed by solving the equation of continuity for the diffusion cell numerically and considering that thediffusion coefficient is changing with time and concentration. The effects of pressure, liquid phase viscosity and operatingtemperature on the diffusion coefficient of the solute gas in the solution are discussed. The results indicate that uncertainties whichgenerally exist in the physical and thermodynamic properties of the crude oils may have a significant effect on the diffusioncoefficient of a solute gas in a complex mixture like crude oil.© 2006 Elsevier B.V. All rights reserved.
Keywords: Diffusion coefficients; High pressure; High temperature; Secondary oil recovery
1. Introduction
When a gas and a liquid phase which are notthermodynamically in equilibrium are brought intoclose contact, transfer of one or more components mayoccur from the gas phase to the liquid or, vice versa, bythe mechanism of molecular diffusion. Mass transfer by
⁎ Corresponding author. Institute for Technical Thermodynamics,German Aerospace Centre (DLR), Germany.
E-mail addresses: [email protected] (M. Jamialahmadi),[email protected] (H. Müller-Steinhagen).
0920-4105/$ - see front matter © 2006 Elsevier B.V. All rights reserved.doi:10.1016/j.petrol.2006.01.011
molecular diffusion is the basic physical mechanismunderlying many important areas of soil science,petroleum engineering, chemical engineering, biotech-nology and nuclear engineering. In recent years, theproblem of mass transfer by molecular diffusion in oilreservoirs, when a non-equilibrium gas is injected intothe reservoir, has become increasingly important andreceived significant attention (i.e. Burger and Mohanty,1995; LeGallo et al., 1997). Nguyen and Faroug Ali(1998) measured the solubility and diffusivity of carbondioxide in Aberfeldy heavy oil using impure carbon dio-xide gas containing nitrogen as the main contaminant. It
48 M. Jamialahmadi et al. / Journal of Petroleum Science and Engineering 53 (2006) 47–60
was noted that increasing the concentration of nitrogen inthe carbon dioxide stream decreased the solubility andthe diffusivity of carbon dioxide in the oil. Riazi (1996)developed a method for determining diffusion coeffi-cients of gases in liquids at constant volume andtemperature using a PVT cell. No compositionalmeasurements are necessary for this method of measur-ing diffusion coefficients. Results obtained by thismethod for binary systems yielded diffusion coefficientswithin ±5% of literature values. Zhang et al. (2000)discussed the importance of molecular diffusion for thestudy of petroleum recovery techniques. The mainobjective of their work was to develop an experimentaltechnique for measuring gas diffusion coefficients inheavy oils. They used Riazi's (1996) method andmeasured the diffusion coefficients of methane andcarbon dioxide in heavy oil at 21°C and pressures up to3500kPa. Comparing their results with published valuesof the diffusion coefficients of methane and carbondioxide, they found that deviations were much larger formethane, probably because of the different oils and testconditions. Upreti and Mehrotra (2002) measured thediffusivity of carbon dioxide, methane, ethane andnitrogen in Athabasca bitumen in the range 25–90°Cat 4 and 8MPa. The diffusivity of these gases has beendetermined as a function of gas concentration in thebitumen using a non-intrusive experimental method.The diffusivity of gases was found to increase withtemperature and pressure.
In oil recovery projects, gas is injected into oilreservoirs for different reasons such as maintenance ofreservoir pressure and enhanced recovery of oil. In thefirst case, some of the gas, which is injected into thedome above the oil zone, dissolves in the oil, thuslowering its viscosity, surface tension and density. Thesepossibly favorable changes resulting from re-pressuringof the oil reservoir create interest in the rate at which thegas may be expected to dissolve under differentprevailing conditions. Previous investigators (i.e. Hilland Lacy, 1934; Bertram and Lacy, 1935; Reamer et al.,1956) have shown that the rate of dissolution of a gassuch as methane in a quiescent body of hydrocarbon oilis controlled primarily by the rate of diffusion of thedissolved gas from the gas–oil interface into the body ofthe liquid phase.
In the second case, when gas is injected for thepurpose of enhanced oil recovery, understanding andmodelling of diffusion processes may be of greatimportance for the planning and evaluation of gasinjection projects in oil reservoirs. The most importantproperty required for determining the rate of masstransfer between the gas and oil phase is the molecular
diffusion coefficient at reservoir conditions. Kinetictheory has been shown to be adequate for estimationof molecular diffusion in low pressures gases throughthe Chapman–Enskog theory (1939). For liquidsystems, most correlations are based on the Stokes–Einstein equation, which relates inversely the diffusioncoefficient to liquid viscosity. Descriptions of thesecorrelations and conditions for which their applicationhas been recommended are summarized by Taylor andKrishna (1993) and by Poling et al. (2001).
For high-pressure systems, most theory-based corre-lations fail to perform properly, and for this reasonempirical correlations have been developed. Slatteryand Bird (1961) developed a chart for calculation ofself-diffusion coefficients of dense gases. This chartextends to a reduced pressure of four and is based onfew experimental data. Subsequently these charts wererecommended in the API Technical Data Book(American Petroleum Institute, 1997) for estimation ofbinary diffusion coefficients of dense hydrocarbonsystems. Mathur and Thodos (1965) developed ageneralized correlation for the self-diffusivity of sub-stances in the gaseous and liquid states in terms ofreduced density and reduced temperature. Sigmund(1976) reported some experimental data and a correla-tion for the prediction of binary diffusion coefficients ofdense hydrocarbons for both liquids and gaseoussystems. Even though most data used for developingthis correlation for liquid systems were at atmosphericpressure, it has found practical application in masstransfer calculations in the oil reservoirs at highpressure. Riazi and Whitson (1993) showed that theSigmund correlation predicts diffusivities for gasesdissolved in liquid hydrocarbons at high pressures,which are 80–100% higher than reported experimentalvalues. Denoyelle and Bardon (1983) reported diffusioncoefficients for carbon dioxide in oil at reservoirconditions, which are 5 to 10 times higher than thosemeasured at atmospheric conditions. They concludedthat measured diffusion coefficients at atmosphericconditions cannot be used at reservoir conditions.Renner (1986) measured diffusion coefficients ofhydrocarbon gases in consolidated porous media atpressures up to 6MPa (900psi). He also developed acorrelation as a function of liquid viscosity andthermophysical properties of the diffusing gases. Riaziand Whitson (1993) proposed a generalized correlationin terms of viscosity and molar density of solutions forboth gases and liquids. Although the proposed correla-tion is based on experimental data of hydrocarbonsystems, they claimed that it may also be used for non-hydrocarbon systems.
49M. Jamialahmadi et al. / Journal of Petroleum Science and Engineering 53 (2006) 47–60
Unfortunately, none of the available correlations issuitable for the prediction of diffusion coefficients ofhydrocarbon gases in hydrocarbon liquids at the highpressures and temperatures which are commonly foundin oil reservoirs. The reason for this discrepancy is thelack of reliable high-pressure and temperature moleculardiffusion experimental data. The data at high pressureare scarce and fragmentary, at least in part, for the reasonthat performing these measurements in the laboratory isdifficult, expensive and time consuming. The aim of thepresent investigation is to study systematically themechanisms of molecular diffusion of gases in liquidsby measuring diffusion coefficients of methane indodecane, which has physical properties similar tocrude oil and in a typical Iranian crude oil, up to apressure of 40MPa at different temperatures. In thispaper, experimental results are presented over a widerange of pressure and temperature, especially for regionswhere previously published data were insufficient. Alltests are performed in an accurate high-pressurediffusion cell with “finite-domain” moving boundarybehaviour. The effect of solute concentration andviscosity on the diffusion coefficient is demonstratedexperimentally. At present, the data acquired are used toassess the predictions of various available correlations
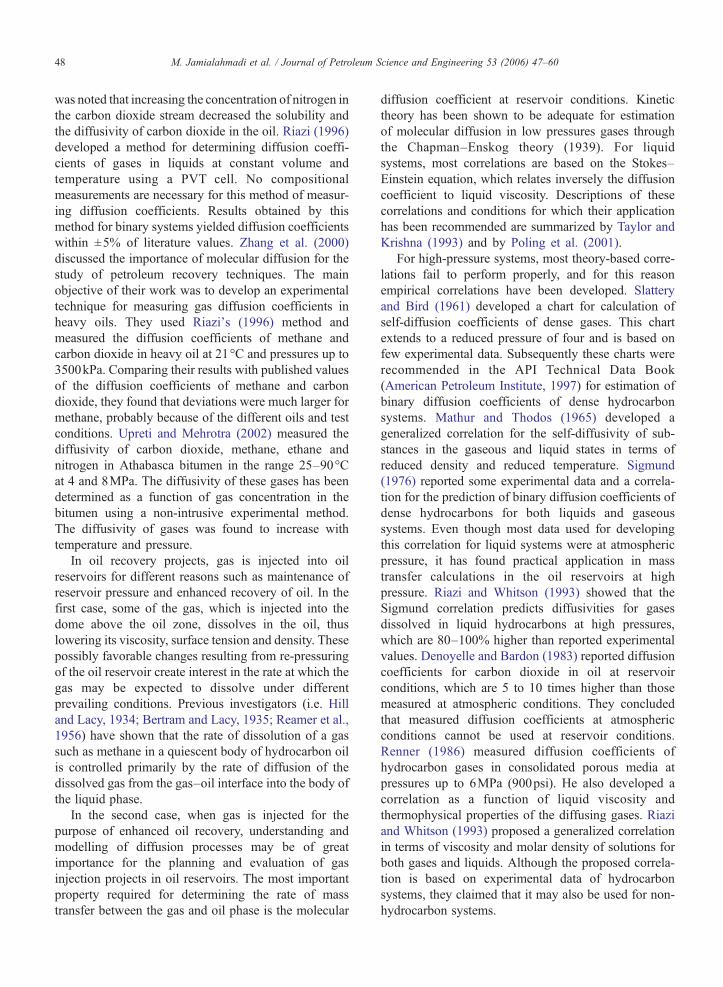
Fig. 1. Schematic drawing of th
for diffusion coefficients. A Radial Basis Function(RBF) neural network is trained for the prediction ofdiffusion coefficients of methane in hydrocarbonliquids. Ultimately, the trained network will be used todevelop a simple approximate parametric correlation forthe prediction of diffusion coefficients of a solute gas inliquid hydrocarbons.
2. Experimental equipment and procedure
2.1. Test apparatus
The complete diffusion apparatus is shown in Fig. 1.The diffusion cell is surrounded by a temperature-controlled air bath. To increase the temperature of thediffusion cell from ambient to the desired values up to180°C, several thermostatically controlled electricalheaters have been installed in various parts of the airbath. The mean body of the bath consists of a heavyangle iron frame, covered with aluminum alloy sheetand insulated with a 5-cm thickness of compressedglass wool. The interior is lined with insulation board.The bath is partitioned such that a duct is separatedfrom the area provided for the cell. The duct housesthe heaters, the thermostat and the blower, which
e experimental apparatus.
50 M. Jamialahmadi et al. / Journal of Petroleum Science and Engineering 53 (2006) 47–60
provides forced air circulation through the bath.Louvers installed at the duct outlet permit adjustingthe air stream. Furthermore, the bath is also equippedwith a high-pressure stainless steel reservoir cylinderwith a volume of 500cm3. This cylinder, which isused to store methane gas at the desired temperatureand pressure, is connected to the top of the diffusioncell. The diffusion cell is a cylinder with a volume of400cm3. Three glass windows are arranged in the faceof the cell so that any liquid level may be determinedvisually. The readings are obtained with a precisecathetometer, which is equipped with a sliding scopeand illumination system, allowing the operator thesafety of observing volume changes through a mirrorimage rather than facing the pressurized windowedcell directly. The cross-sectional area of the cell borehas been designed so that a 1-mm fluid level changecorresponds to a volume change of 1cm3. Thecathetometer permits readings to 0.01cm3. The cellis supported in the air bath by a journal, about whichit can be revolved from a vertical position with oneend of the cell up through the horizontal to a verticalposition with the other end of the cell up. Two high-pressure stainless steel tubing spirals connect the inletand outlet of the cell to the inlet valves of the bathassembly. Three shallow holes are drilled into the cellwall for inserting thermocouples to determine whentemperature equilibrium has been reached. Thediffusion cell permits examination of gas and liquidsamples for pressures up to 70MPa (10000psi) andtemperatures up to 180°C. The injection of gas andliquid phase at the desired pressure was performedusing fully automatic twin mercury pumps. The flowrate in each pump is variable from 1cm3/h to about1500cm3/h. The operating pressure of each pump isup to 70MPa (10000psi) and a calibrated ruler isinstalled between the two pumps, to determine theoutlet volume with an accuracy of 0.01cm3.
2.2. Experimental procedure
In preparation for a typical diffusion test, the cell wascleaned, dried and the system connected to a vacuum toremove air or any other gases present in the system.Once the pressure of the system has reached approxi-mately 0.025kPa (0.2mm Hg), the liquid is introducedby injection from the bottom upward and filled up toabout 35% of the cell volume. Pure methane is alsointroduced into the reservoir cylinder of the air bath atthe desired pressure. Then, the main power of the airbath heaters is switched-on and the temperature of thesystem allowed to rise very gently up to the desired
temperature. Various combinations of main heaters mayhave to be used in order to reach this temperature. Fivethermocouples, three on the diffusion cell and two in themain body of the bath, record the temperatures invarious parts of the diffusion cell and the air bath. Thesystem was degassed and then left at the desiredpressure and temperature for about 10h to ensure ahomogeneous condition throughout the system. Now,the top three-way valve of the cell was connected to thehigh-pressure gas reservoir cylinder. When the pressurein the cell reached the desired value, the top valve wasclosed and the liquid level recorded. As time passes,methane diffuses into the liquid phase, therefore, theliquid level rises and its volume increases. The pressurein the diffusion cell was kept constant by continuousinjection of mercury to the bottom of the cell. From themovement of the interface and the position of the pistonrod of the mercury pump, the volume of dissolvedmethane in the liquid phase may be readily determinedas a function of time. Acquisition of a complete set ofvolume–time data usually requires 2–6days. Thediffusion coefficient may then be determined from thevolume–time data. At the end of each experimentsamples of the liquid and gas phases were withdrawnfrom the bottom and top parts of the cell, respectively.The liquid sample was collected in a cylinder; thevolume of gas separated from the liquid was measuredin a gasometer. The composition of the gas phase wasanalyzed by a gas chromatograph to check thepossibility of evaporation of the liquid phase, whichproved to be negligible. All experimental runs wereperformed in random fashion and some runs wererepeated later to check the reproducibility of theexperiments, which proved to be good.
2.3. Test fluids
Diffusion experiments were performed using puremethane as gas phase, pure normal dodecane and atypical Iranian crude oil as liquid phase. Accurateknowledge of physical properties and phase behavior ofmethane-dodecane and methane-crude oil under variousoperating temperatures and pressures is an essentialprerequisite for determination of diffusion coefficientsfrom volume–time data. Limited gas solubility mea-surements were performed using a standard PVT cellapparatus. The system is based on the principle that gasdissolved in the liquid phase evolves when the pressureis released and the temperature of the system isincreased. The solubility of methane in the liquidphase was measured at several pressures and tempera-tures. In each run, the equilibrium was detected by
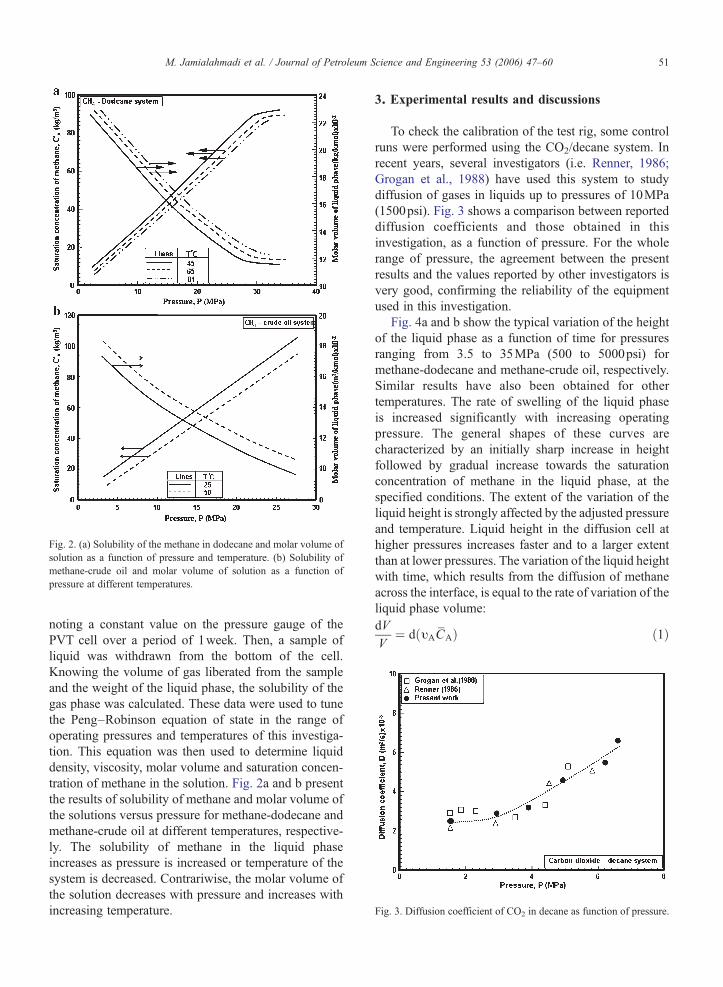
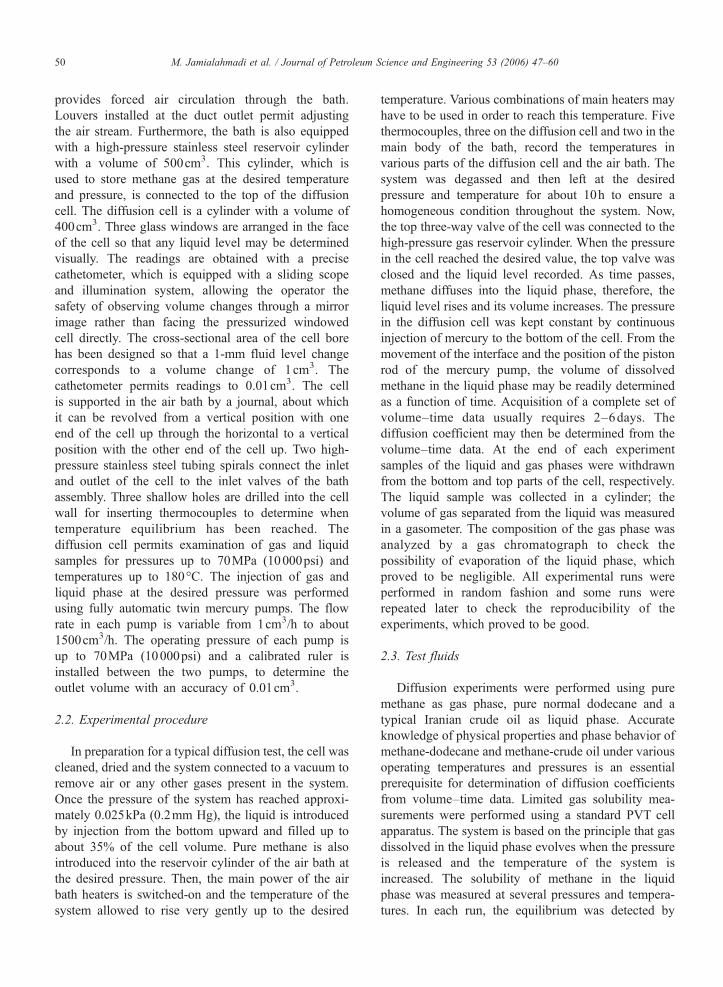
Fig. 3. Diffusion coefficient of CO2 in decane as function of pressure.
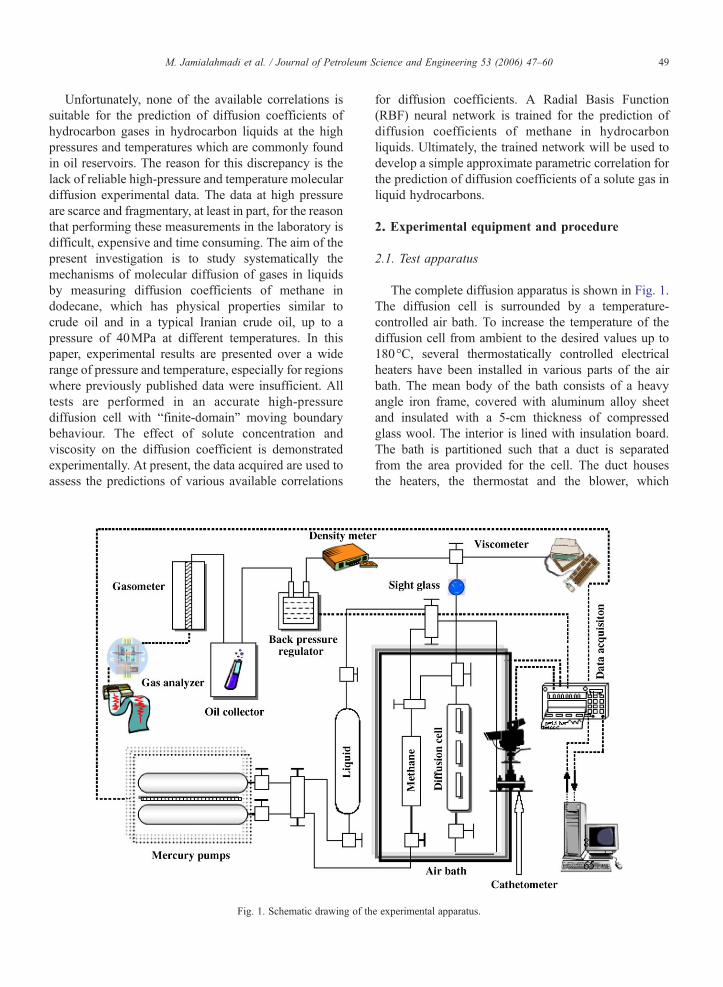
Fig. 2. (a) Solubility of the methane in dodecane and molar volume ofsolution as a function of pressure and temperature. (b) Solubility ofmethane-crude oil and molar volume of solution as a function ofpressure at different temperatures.
51M. Jamialahmadi et al. / Journal of Petroleum Science and Engineering 53 (2006) 47–60
noting a constant value on the pressure gauge of thePVT cell over a period of 1week. Then, a sample ofliquid was withdrawn from the bottom of the cell.Knowing the volume of gas liberated from the sampleand the weight of the liquid phase, the solubility of thegas phase was calculated. These data were used to tunethe Peng–Robinson equation of state in the range ofoperating pressures and temperatures of this investiga-tion. This equation was then used to determine liquiddensity, viscosity, molar volume and saturation concen-tration of methane in the solution. Fig. 2a and b presentthe results of solubility of methane and molar volume ofthe solutions versus pressure for methane-dodecane andmethane-crude oil at different temperatures, respective-ly. The solubility of methane in the liquid phaseincreases as pressure is increased or temperature of thesystem is decreased. Contrariwise, the molar volume ofthe solution decreases with pressure and increases withincreasing temperature.
3. Experimental results and discussions
To check the calibration of the test rig, some controlruns were performed using the CO2/decane system. Inrecent years, several investigators (i.e. Renner, 1986;Grogan et al., 1988) have used this system to studydiffusion of gases in liquids up to pressures of 10MPa(1500psi). Fig. 3 shows a comparison between reporteddiffusion coefficients and those obtained in thisinvestigation, as a function of pressure. For the wholerange of pressure, the agreement between the presentresults and the values reported by other investigators isvery good, confirming the reliability of the equipmentused in this investigation.
Fig. 4a and b show the typical variation of the heightof the liquid phase as a function of time for pressuresranging from 3.5 to 35MPa (500 to 5000psi) formethane-dodecane and methane-crude oil, respectively.Similar results have also been obtained for othertemperatures. The rate of swelling of the liquid phaseis increased significantly with increasing operatingpressure. The general shapes of these curves arecharacterized by an initially sharp increase in heightfollowed by gradual increase towards the saturationconcentration of methane in the liquid phase, at thespecified conditions. The extent of the variation of theliquid height is strongly affected by the adjusted pressureand temperature. Liquid height in the diffusion cell athigher pressures increases faster and to a larger extentthan at lower pressures. The variation of the liquid heightwith time, which results from the diffusion of methaneacross the interface, is equal to the rate of variation of theliquid phase volume:dVV
¼ d υACP
Að Þ ð1Þ
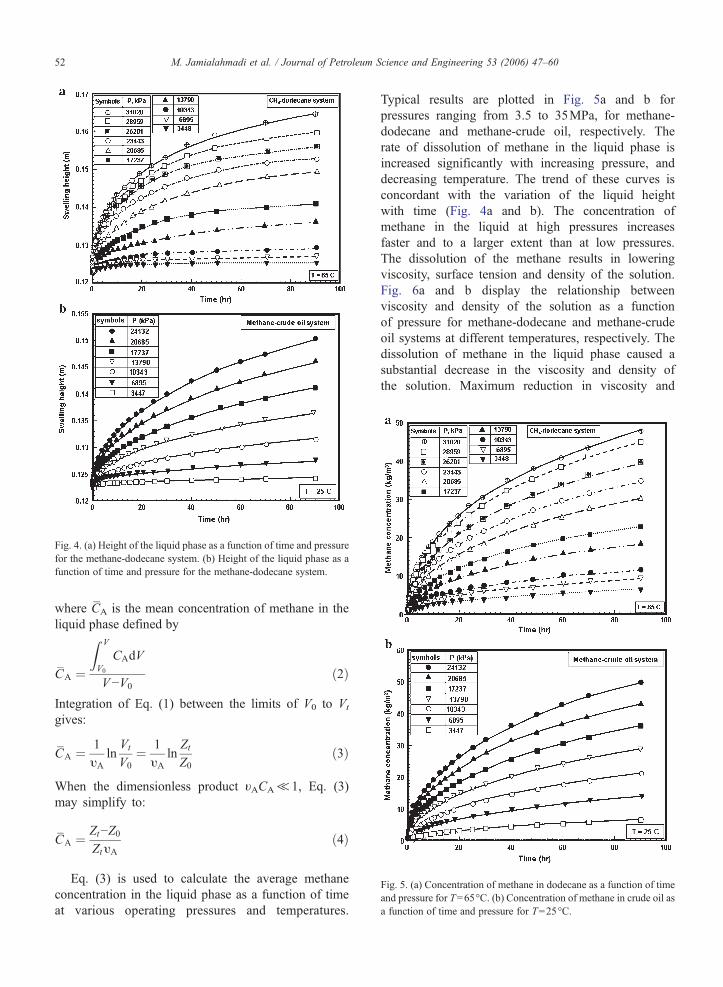
Fig. 4. (a) Height of the liquid phase as a function of time and pressurefor the methane-dodecane system. (b) Height of the liquid phase as afunction of time and pressure for the methane-dodecane system.
Fig. 5. (a) Concentration of methane in dodecane as a function of timeand pressure for T=65°C. (b) Concentration of methane in crude oil asa function of time and pressure for T=25°C.
52 M. Jamialahmadi et al. / Journal of Petroleum Science and Engineering 53 (2006) 47–60
where C̄A is the mean concentration of methane in theliquid phase defined by
CP
A ¼
Z V
V0
CAdV
V−V0ð2Þ
Integration of Eq. (1) between the limits of V0 to Vt
gives:
CP
A ¼ 1υA
lnVt
V0¼ 1
υAln
ZtZ0
ð3Þ
When the dimensionless product υACA≪1, Eq. (3)may simplify to:
CP
A ¼ Zt−Z0ZtυA
ð4Þ
Eq. (3) is used to calculate the average methaneconcentration in the liquid phase as a function of timeat various operating pressures and temperatures.
Typical results are plotted in Fig. 5a and b forpressures ranging from 3.5 to 35MPa, for methane-dodecane and methane-crude oil, respectively. Therate of dissolution of methane in the liquid phase isincreased significantly with increasing pressure, anddecreasing temperature. The trend of these curves isconcordant with the variation of the liquid heightwith time (Fig. 4a and b). The concentration ofmethane in the liquid at high pressures increasesfaster and to a larger extent than at low pressures.The dissolution of the methane results in loweringviscosity, surface tension and density of the solution.Fig. 6a and b display the relationship betweenviscosity and density of the solution as a functionof pressure for methane-dodecane and methane-crudeoil systems at different temperatures, respectively. Thedissolution of methane in the liquid phase caused asubstantial decrease in the viscosity and density ofthe solution. Maximum reduction in viscosity and
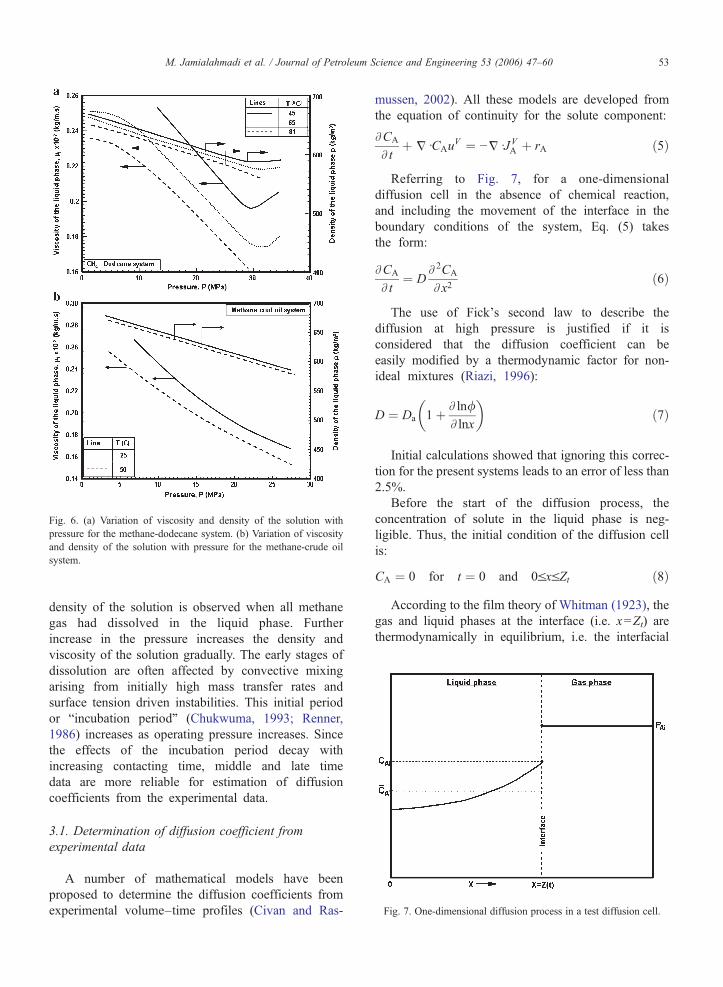
Fig. 6. (a) Variation of viscosity and density of the solution withpressure for the methane-dodecane system. (b) Variation of viscosityand density of the solution with pressure for the methane-crude oilsystem.
Fig. 7. One-dimensional diffusion process in a test diffusion cell.
53M. Jamialahmadi et al. / Journal of Petroleum Science and Engineering 53 (2006) 47–60
density of the solution is observed when all methanegas had dissolved in the liquid phase. Furtherincrease in the pressure increases the density andviscosity of the solution gradually. The early stages ofdissolution are often affected by convective mixingarising from initially high mass transfer rates andsurface tension driven instabilities. This initial periodor “incubation period” (Chukwuma, 1993; Renner,1986) increases as operating pressure increases. Sincethe effects of the incubation period decay withincreasing contacting time, middle and late timedata are more reliable for estimation of diffusioncoefficients from the experimental data.
3.1. Determination of diffusion coefficient fromexperimental data
A number of mathematical models have beenproposed to determine the diffusion coefficients fromexperimental volume–time profiles (Civan and Ras-
mussen, 2002). All these models are developed fromthe equation of continuity for the solute component:
ACA
AtþjdCAu
V ¼ −jdJVA þ rA ð5Þ
Referring to Fig. 7, for a one-dimensionaldiffusion cell in the absence of chemical reaction,and including the movement of the interface in theboundary conditions of the system, Eq. (5) takesthe form:
ACA
At¼ D
A2CA
Ax2ð6Þ
The use of Fick's second law to describe thediffusion at high pressure is justified if it isconsidered that the diffusion coefficient can beeasily modified by a thermodynamic factor for non-ideal mixtures (Riazi, 1996):
D ¼ Da 1þ Aln/Alnx
� �ð7Þ
Initial calculations showed that ignoring this correc-tion for the present systems leads to an error of less than2.5%.
Before the start of the diffusion process, theconcentration of solute in the liquid phase is neg-ligible. Thus, the initial condition of the diffusion cellis:
CA ¼ 0 for t ¼ 0 and 0VxVZt ð8ÞAccording to the film theory of Whitman (1923), the
gas and liquid phases at the interface (i.e. x=Zt) arethermodynamically in equilibrium, i.e. the interfacial

54 M. Jamialahmadi et al. / Journal of Petroleum Science and Engineering 53 (2006) 47–60
concentration of solute, CAi, remains unchanged as longas temperature and pressure of the system are keptconstant. Hence, the first boundary condition of Eq. (6)is:
CA ¼ CAi for t > 0 and x ¼ Zt ð9ÞAfter methane and liquid phase dodecane are brought
into close contact mass transfer commences, andmethane diffuses across the interface into the liquidphase. As a result, the liquid phase swells and theinterface moves to a new position Zt. Depending oncontacting time, height of liquid, and rate of masstransfer, the system may be considered as “semi-infinite” or “finite-domain” moving boundary system.
The semi-infinite system assumption is valid as longas the solute does not penetrate to the bottom of thediffusion cell during the course of the experiment. Thiscondition prevails when the diffusion cell is long or thetime of contact between gas and liquid phase is short.Hence, the second boundary condition of Eq. (6) can bedefined as:
CA ¼ 0 for x ¼ 0 and tz0 ð10ÞThe solution of Eq. (6) subject to the initial and
boundary conditions defined by Eqs. (8)–(10) is givenby Crank (1975):
CA x; tð Þ ¼ CAi 1−erfx
2ffiffiffiffiffiDt
p� �� �
¼ CAierfcx
2ffiffiffiffiffiDt
p� �
ð11Þ
The total mass of methane transferred into the liquidphase after time t can be calculated from the integrationof Eq. (11) over the volume of the diffusion cell:
mA ¼Z V
−lCA x; tð ÞdV ¼ S
Z Z
−lCA x; tð Þdx
¼ 2SdCAi
ffiffiffiffiffiDt
p
r¼ Kd
ffiffit
p ð12Þ
where
K ¼ 2SdCAi
ffiffiffiffiDp
rð13Þ
Eq. (12) shows that a plot of mA versus the squareroot of time should provide a straight line with a slope ofconstant K. Hence, the diffusivity of the solute in theliquid phase can be obtained from Eq. (13) bycalculating the value of K from the experimental data.Most investigators (i.e. Renner, 1986; Grogan et al.,1988) used this method for determination of diffusion
coefficients. The mass average concentration of solutecan be obtained from the combination of Eq. (12) withEq. (1):
C̄A ¼ mA
V¼ mA
SdZt¼ 2CAi
Z0expðυAC̄AÞ
ffiffiffiffiffiDtp
rð14Þ
The application of the semi-infinite solution limitsthe experimental data which can be used to determinediffusion coefficients to those at early times of theexperiments. This limitation is a serious drawback ofthis method as early time experimental data areaffected by convective mixing arising from initiallyhigh mass transfer rates, especially at high pressurewhere the solute has a high solubility in the liquidphase. This initial mixing effect decreases withincreasing contacting time, hence middle and latetime data are less affected and provide better estimatesof diffusion coefficients.
3.2. Finite-domain moving boundary model
From the experimental point of view, finite systemsprovide conditions for more precise estimates of diffusioncoefficients. These systems allow design and constructionof small and compact apparatus, which is a great advantagefor working at high pressure and temperature. When liquidin the diffusion cell comes into close contact with the gasphase, diffusion commences. However, since the cell issealed and is of finite length, there can be no mass transferacross the ends of the cell. Therefore, the second boundarycondition of Eq. (6) for finite systems is:
ACA
Ax¼ 0 for x ¼ 0 ð15Þ
The solution of Eq. (6) in conjunction with its finiteboundary conditions may be performed assuming thatthe diffusion coefficient itself is either independent ordependent on solute concentration in the liquid phase.Therefore, the diffusivity may remain constant over theentire course of the diffusion process, or alternatively, itmay change as diffusion time increases and the solutionbecomes more concentrated with the solute.
3.2.1. Concentration-independent diffusion coefficientIntegration of Eq. (6) with the assumption of constant
diffusivity between x=0 and x=Zt yields:
Z Z
0
ACA
Atdx ¼ D
Z Z
0
A2CA
Ax2dx ¼ D
ACA
Ax
����Z
ð16Þ
55M. Jamialahmadi et al. / Journal of Petroleum Science and Engineering 53 (2006) 47–60
Applying Leibnitz's integration rule (Stroud, 1996),Eq. (16) simplifies to:
ddt
Z Z
0CA x; tð Þdx ¼ D
ACA
Ax
����Zt
þ CAiAZtAt
ð17Þ
Differentiating Eq. (1) with respect to time leads to:
dC̄A
dt¼ 1
Ztd1dt
Z Z
0CA x; tð Þdx− C̄A
ZtddZtdt
ð18Þ
which can be combined with Eq. (17) to give:
ZtdC̄A
dt¼ CAi−C̄A
� dZtdt
þ DACA
Ax
����Zt
ð19Þ
Substituting for Zt and its derivative from Eqs. (2)and (3) yields:
dC̄A
dt¼ CAi−C̄A
� υA þ D
Z0exp υAC̄A
� d ACA
Ax
����Zt
ð20Þ
Eq. (20) relates the rate of diffusion of the soluteinto the liquid phase to the concentration profile at theinterface. The main problem in the solution of thisequation is that the interfacial concentration profile∂CA /∂x|Zt
is unknown. Do and Pinczewski (1991)have shown that for moving boundary systems it issatisfactory to assume a variable power concentrationprofile for the solute throughout the diffusion process:
CA ¼ b0 þ b1xn ð21Þ
where the power n is a function of time and given by:
n ¼ ax where x ¼ CAi
C̄Að22Þ
The parameter a is positive and independent of timeand should be determined from experimental data. Theinterfacial and mean solute concentrations at any timecan be calculated from Eq. (21) and its combination withEq. (2), respectively:
CAi ¼ b0 þ b1Znt ð23Þ
and
C̄A ¼ b0 þ b1nþ 1
Znt ð24Þ
Substituting for Zt and n from Eqs. (4) and (22) intoEq. (24) yields:
C̄A ¼ b0 þ b1axþ 1
Z01−υC̄A
� �ax
ð25Þ
The parameters b0 and b1 can be obtained in terms ofCAi and CA from the simultaneous solution of Eqs. (23)and (25):
b0 ¼ C̄A þ C̄A
a1−xx
� �ð26Þ
and
b1 ¼ CAi−C̄A
� axþ 1ax
� �1−υC̄A
Z0
� �ax
ð27Þ
The interfacial concentration gradient can also becalculated by differentiating Eq. (21) with respect to x:
ACA
Ax
����Zt
¼ b1dndZn−1t
¼ ðCAi−C̄AÞðaCAi−C̄AÞð1−υAC̄AÞZ0C̄A
ð28Þ
Substituting Eq. (28) into Eq. (20) gives:
dC̄A
dt¼ Dð1−υAC̄AÞ3ðCAi−C̄AÞðaCAi−C̄AÞ
Z20 C̄Að1−υCAiÞ
ð29Þ
Integrating Eq. (29) using the separation of variablesmethod yields:
1a7
lnðaCAi þ C̄AÞa1
ðCAi þ C̄AÞa2ð1−aC̄AÞa3=aþ a42aa7ð1−aC̄AÞ2
þ a5aa7ð1−aC̄AÞ
þ a6a7
¼ Ddt ð30Þ
The parameters α1 to α7 are constant and given inTable 1.
As already stated by Do and Pinczewski (1991), theconcentration profiles defined by Eq. (14) are not yetaffected by the non-flux boundary condition during theearly stages of the diffusion process. Hence, at thebeginning of the diffusion process, the prediction of Eq.(30) should coincide with the semi-infinite solution ofEq. (14). The validity of the variable profile concentra-tion of the solute is demonstrated in Fig. 8, where themass of carbon dioxide transferred into the liquid phasepredicted from Eq. (30) is compared with valuesobtained from Eq. (14), for several values of theadjustable parameter a. Excellent agreement betweenEqs. (14) and (30) is obtained with a value of a=0.56 atshort contacting times, where the finite solution of Eq.(30) is identical to the semi-infinite solution. Thus, a plotof the left-hand side of Eq. (30) versus time should give astraight line and the slope of such a plot is the diffusivity.
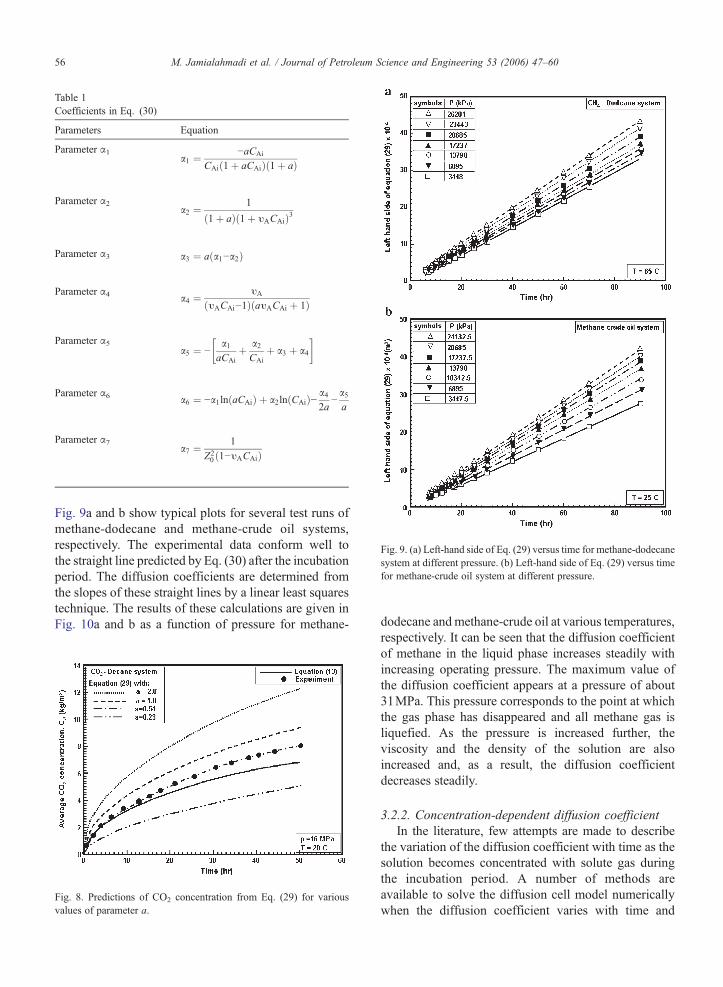
Table 1Coefficients in Eq. (30)
Parameters Equation
Parameter α1a1 ¼ −aCAi
CAið1þ aCAiÞð1þ aÞ
Parameter α2a2 ¼ 1
ð1þ aÞð1þ υACAiÞ3
Parameter α3 a3 ¼ aða1−a2Þ
Parameter α4 a4 ¼ υA
ðυACAi−1ÞðaυACAi þ 1Þ
Parameter α5a5 ¼ −
a1aCAi
þ a2CAi
þ a3 þ a4
� �
Parameter α6 a6 ¼ −a1ln aCAið Þ þ a2ln CAið Þ− a42a
−a5a
Parameter α7a7 ¼ 1
Z20 ð1−υACAiÞ
Fig. 9. (a) Left-hand side of Eq. (29) versus time for methane-dodecanesystem at different pressure. (b) Left-hand side of Eq. (29) versus timefor methane-crude oil system at different pressure.
56 M. Jamialahmadi et al. / Journal of Petroleum Science and Engineering 53 (2006) 47–60
Fig. 9a and b show typical plots for several test runs ofmethane-dodecane and methane-crude oil systems,respectively. The experimental data conform well tothe straight line predicted by Eq. (30) after the incubationperiod. The diffusion coefficients are determined fromthe slopes of these straight lines by a linear least squarestechnique. The results of these calculations are given inFig. 10a and b as a function of pressure for methane-
Fig. 8. Predictions of CO2 concentration from Eq. (29) for variousvalues of parameter a.
dodecane andmethane-crude oil at various temperatures,respectively. It can be seen that the diffusion coefficientof methane in the liquid phase increases steadily withincreasing operating pressure. The maximum value ofthe diffusion coefficient appears at a pressure of about31MPa. This pressure corresponds to the point at whichthe gas phase has disappeared and all methane gas isliquefied. As the pressure is increased further, theviscosity and the density of the solution are alsoincreased and, as a result, the diffusion coefficientdecreases steadily.
3.2.2. Concentration-dependent diffusion coefficientIn the literature, few attempts are made to describe
the variation of the diffusion coefficient with time as thesolution becomes concentrated with solute gas duringthe incubation period. A number of methods areavailable to solve the diffusion cell model numericallywhen the diffusion coefficient varies with time and
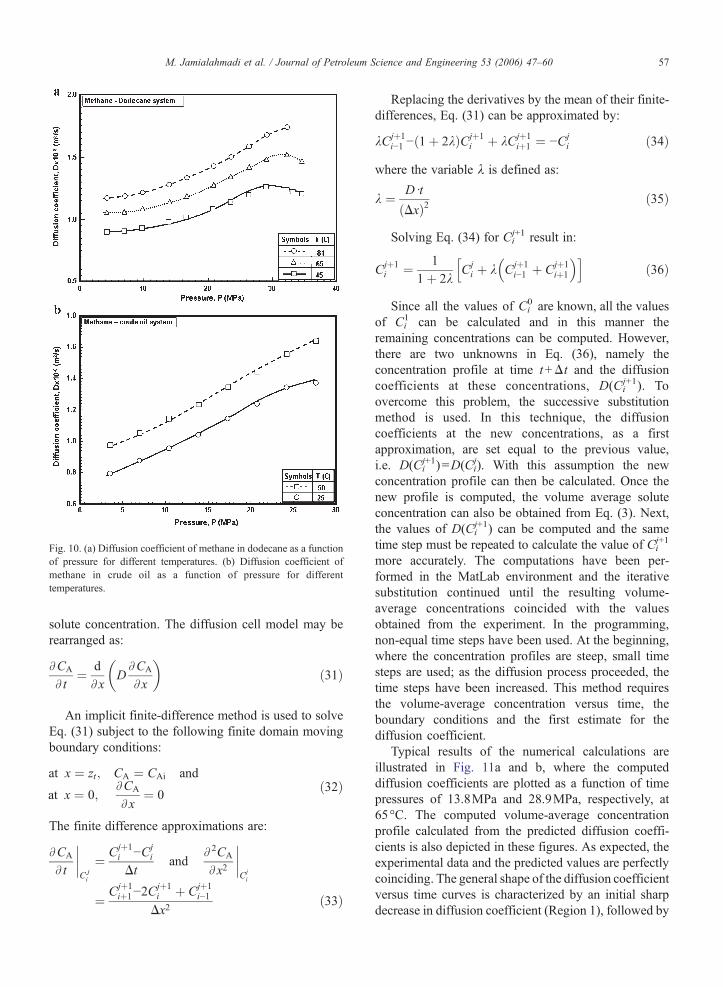
Fig. 10. (a) Diffusion coefficient of methane in dodecane as a functionof pressure for different temperatures. (b) Diffusion coefficient ofmethane in crude oil as a function of pressure for differenttemperatures.
57M. Jamialahmadi et al. / Journal of Petroleum Science and Engineering 53 (2006) 47–60
solute concentration. The diffusion cell model may berearranged as:
ACA
At¼ d
AxDACA
Ax
� �ð31Þ
An implicit finite-difference method is used to solveEq. (31) subject to the following finite domain movingboundary conditions:
at x ¼ zt; CA ¼ CAi and
at x ¼ 0;ACA
Ax¼ 0
ð32Þ
The finite difference approximations are:
ACA
At
����CJi
¼ Cjþ1i −Cj
i
Dtand
A2CA
Ax2
����Cji
¼ Cjþ1iþ1−2C
jþ1i þ Cjþ1
i−1
Dx2ð33Þ
Replacing the derivatives by the mean of their finite-differences, Eq. (31) can be approximated by:
kCjþ1i−1 −ð1þ 2kÞCjþ1
i þ kCjþ1iþ1 ¼ −Cj
i ð34Þwhere the variable λ is defined as:
k ¼ Ddt
ðDxÞ2 ð35Þ
Solving Eq. (34) for Cij+1 result in:
Cjþ1i ¼ 1
1þ 2kCji þ k Cjþ1
i−1 þ Cjþ1iþ1
�h ið36Þ
Since all the values of Ci0 are known, all the values
of Ci1 can be calculated and in this manner the
remaining concentrations can be computed. However,there are two unknowns in Eq. (36), namely theconcentration profile at time t+Δt and the diffusioncoefficients at these concentrations, D(Ci
j+1). Toovercome this problem, the successive substitutionmethod is used. In this technique, the diffusioncoefficients at the new concentrations, as a firstapproximation, are set equal to the previous value,i.e. D(Ci
j+1)=D(Cij). With this assumption the new
concentration profile can then be calculated. Once thenew profile is computed, the volume average soluteconcentration can also be obtained from Eq. (3). Next,the values of D(Ci
j+1) can be computed and the sametime step must be repeated to calculate the value of Ci
j+1
more accurately. The computations have been per-formed in the MatLab environment and the iterativesubstitution continued until the resulting volume-average concentrations coincided with the valuesobtained from the experiment. In the programming,non-equal time steps have been used. At the beginning,where the concentration profiles are steep, small timesteps are used; as the diffusion process proceeded, thetime steps have been increased. This method requiresthe volume-average concentration versus time, theboundary conditions and the first estimate for thediffusion coefficient.
Typical results of the numerical calculations areillustrated in Fig. 11a and b, where the computeddiffusion coefficients are plotted as a function of timepressures of 13.8MPa and 28.9MPa, respectively, at65°C. The computed volume-average concentrationprofile calculated from the predicted diffusion coeffi-cients is also depicted in these figures. As expected, theexperimental data and the predicted values are perfectlycoinciding. The general shape of the diffusion coefficientversus time curves is characterized by an initial sharpdecrease in diffusion coefficient (Region 1), followed by
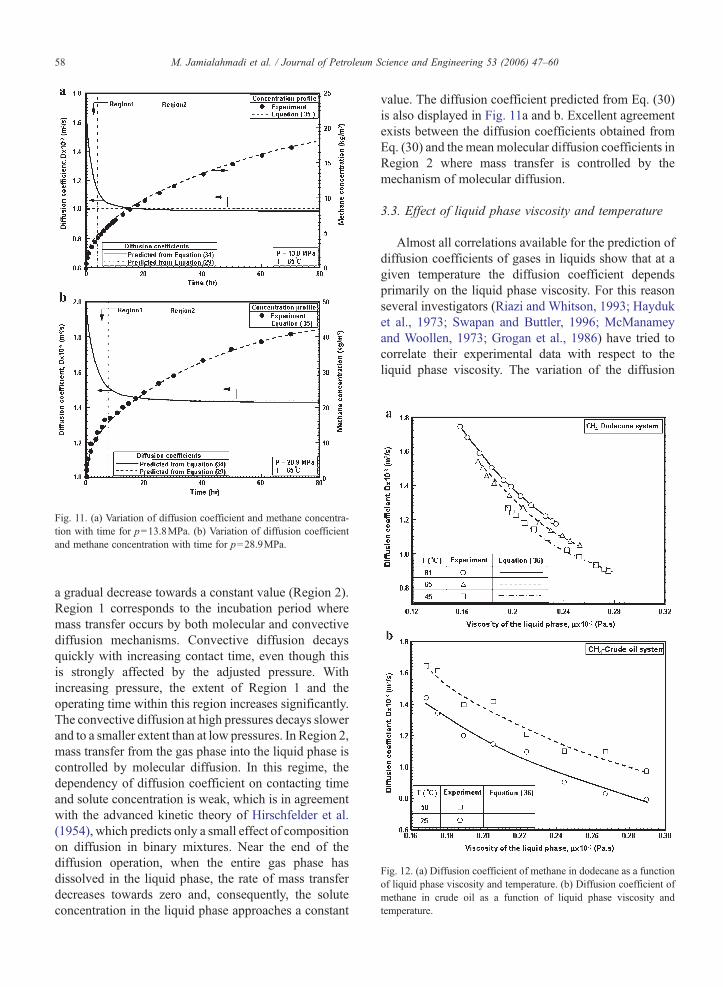
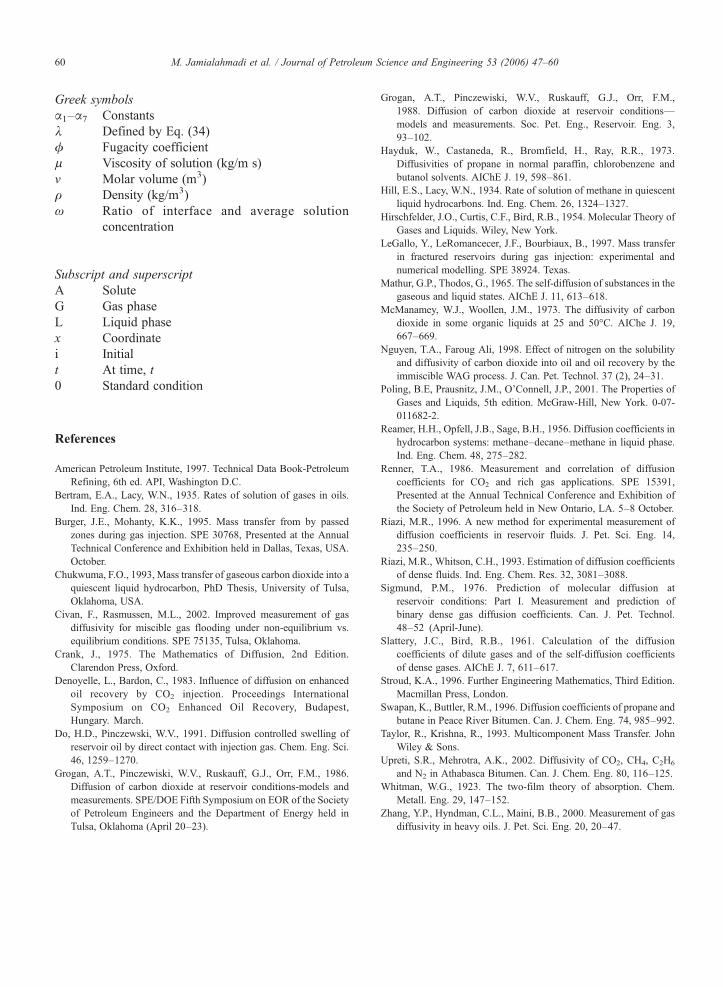
Fig. 12. (a) Diffusion coefficient of methane in dodecane as a functionof liquid phase viscosity and temperature. (b) Diffusion coefficient ofmethane in crude oil as a function of liquid phase viscosity andtemperature.
Fig. 11. (a) Variation of diffusion coefficient and methane concentra-tion with time for p=13.8MPa. (b) Variation of diffusion coefficientand methane concentration with time for p=28.9MPa.
58 M. Jamialahmadi et al. / Journal of Petroleum Science and Engineering 53 (2006) 47–60
a gradual decrease towards a constant value (Region 2).Region 1 corresponds to the incubation period wheremass transfer occurs by both molecular and convectivediffusion mechanisms. Convective diffusion decaysquickly with increasing contact time, even though thisis strongly affected by the adjusted pressure. Withincreasing pressure, the extent of Region 1 and theoperating time within this region increases significantly.The convective diffusion at high pressures decays slowerand to a smaller extent than at low pressures. In Region 2,mass transfer from the gas phase into the liquid phase iscontrolled by molecular diffusion. In this regime, thedependency of diffusion coefficient on contacting timeand solute concentration is weak, which is in agreementwith the advanced kinetic theory of Hirschfelder et al.(1954), which predicts only a small effect of compositionon diffusion in binary mixtures. Near the end of thediffusion operation, when the entire gas phase hasdissolved in the liquid phase, the rate of mass transferdecreases towards zero and, consequently, the soluteconcentration in the liquid phase approaches a constant
value. The diffusion coefficient predicted from Eq. (30)is also displayed in Fig. 11a and b. Excellent agreementexists between the diffusion coefficients obtained fromEq. (30) and the mean molecular diffusion coefficients inRegion 2 where mass transfer is controlled by themechanism of molecular diffusion.
3.3. Effect of liquid phase viscosity and temperature
Almost all correlations available for the prediction ofdiffusion coefficients of gases in liquids show that at agiven temperature the diffusion coefficient dependsprimarily on the liquid phase viscosity. For this reasonseveral investigators (Riazi and Whitson, 1993; Hayduket al., 1973; Swapan and Buttler, 1996; McManameyand Woollen, 1973; Grogan et al., 1986) have tried tocorrelate their experimental data with respect to theliquid phase viscosity. The variation of the diffusion

Table 2Coefficients of Eq. (36)
Coefficients Methane-dodecane system Methane-crude oil system
T=45°C T=65°C T=81°C T=25°C T=50°C
a0 0.24719×10⁻⁸ 0.26309×10⁻⁸ 0.27494×10⁻⁸ 0.2304×10⁻⁸ 0.25028×10⁻⁸
a1 −1.0006 −1.00012 −1.00024 −1.009 −1.00717
59M. Jamialahmadi et al. / Journal of Petroleum Science and Engineering 53 (2006) 47–60
coefficient with liquid phase viscosity is shown in Fig.12a and b for methane-dodecane and methane-crude oilsystems at various temperatures, respectively. At eachtemperature, the diffusion coefficient decreases steadilyas the liquid phase viscosity increases. Liquid phaseviscosity also decreases with increasing liquid phasetemperature. Therefore, the diffusion coefficient alsoincreases as liquid phase temperature increases. Thedependency of diffusion coefficient on liquid phaseviscosity may be correlated as:
DðT ;PÞ ¼ a0la1 ð37Þ
where a0 and a1 are coefficients which can be obtainedfrom the experimental data. The reported values for thecoefficient a0, varies from 0.5×10⁻¹⁰ to 0.4×10⁻¹¹. Onthe other hand, almost all investigators reported that thecoefficient a1 is negative and varies from −0.45 to −1.2.This indicates that the diffusion coefficient has aninverse relationship with liquid phase viscosity. Theexperimental data for methane-dodecane fit nicely toEq. (37) at each temperature, as shown in Fig. 12a. Thecoefficients of the correlation are summarized in Table 2for the methane-dodecane and methane crude oilsystems.
Although Eq. (37) fits the diffusion coefficient ofmethane in dodecane very well, its predictions forthe crude oil are subject to considerable error. Thereason for this inconsistency arises from the presenceof various components in the crude oil and the tracesof heavy metals which may have a significant effecton the diffusion coefficient of methane in the crudeoil. The uncertainties which exist in the physical andthermodynamic properties of this solution may alsohave a significant effect on the determination ofdiffusion coefficients of methane in crude oil.
4. Conclusions
The diffusion coefficients of methane and carbondioxide in liquid hydrocarbons have been measuredover a wide range of pressures and temperatures, using aprecision high pressure diffusion apparatus. The diffu-sivities are determined using the continuity equationwith finite-domain boundary conditions, with the
assumption that the diffusion coefficient itself is eitherindependent or dependent on the solute concentration inthe liquid phase. The results indicate that during theincubation period mass transfer occurs by both convec-tive and molecular diffusion mechanisms and that theextent of this period increases significantly as operatingpressure increases. After the incubation period, masstransfer is mostly controlled by the mechanism ofmolecular diffusion, and the diffusion coefficient of thesolute gas in the liquid hydrocarbons increases asoperating pressure and temperature increase. Further-more, in this period, the diffusion coefficient is almostindependent of solute concentration. The maximumvalue of diffusion coefficient appears at a pressurecorresponding to the point at which the gas phase hasdisappeared and all gas has dissolved in the liquid phase.As the pressure is increased further, viscosity anddensity of the solution increase and, as a result, thediffusion coefficient decreases.
Nomenclaturea0, a1 Coefficients of Eq. (37)b0 and b1 ConstantsCA Mass concentration of solute (kg/m3)CA(x,t) Solute concentration at position x at time t (kg/
m3)D Diffusion coefficient (m2/s)Da Activity-corrected diffusion coefficient (m2/s)K Defined by Eq. (12)jA Mass transfer by the mechanism of molecular
diffusion (kg/m2s)mA Mass of solute (kg)MW Molecular weight (kg/kmol)n Variable powerp Pressure (Pa)rA Rate of reaction (kg/m3s)S Cross-section area of diffusion cell (m2)t Time (s)T Temperature (K)u Velocity (m/s)V Volume (m3)Z Position of interface (m)w Synaptic weightsx Coordinate direction (m)
60 M. Jamialahmadi et al. / Journal of Petroleum Science and Engineering 53 (2006) 47–60
Greek symbolsα1–α7 Constantsλ Defined by Eq. (34)ϕ Fugacity coefficientμ Viscosity of solution (kg/m s)ν Molar volume (m3)ρ Density (kg/m3)ω Ratio of interface and average solution
concentration
Subscript and superscriptA SoluteG Gas phaseL Liquid phasex Coordinatei Initialt At time, t0 Standard condition
References
American Petroleum Institute, 1997. Technical Data Book-PetroleumRefining, 6th ed. API, Washington D.C.
Bertram, E.A., Lacy, W.N., 1935. Rates of solution of gases in oils.Ind. Eng. Chem. 28, 316–318.
Burger, J.E., Mohanty, K.K., 1995. Mass transfer from by passedzones during gas injection. SPE 30768, Presented at the AnnualTechnical Conference and Exhibition held in Dallas, Texas, USA.October.
Chukwuma, F.O., 1993, Mass transfer of gaseous carbon dioxide into aquiescent liquid hydrocarbon, PhD Thesis, University of Tulsa,Oklahoma, USA.
Civan, F., Rasmussen, M.L., 2002. Improved measurement of gasdiffusivity for miscible gas flooding under non-equilibrium vs.equilibrium conditions. SPE 75135, Tulsa, Oklahoma.
Crank, J., 1975. The Mathematics of Diffusion, 2nd Edition.Clarendon Press, Oxford.
Denoyelle, L., Bardon, C., 1983. Influence of diffusion on enhancedoil recovery by CO2 injection. Proceedings InternationalSymposium on CO2 Enhanced Oil Recovery, Budapest,Hungary. March.
Do, H.D., Pinczewski, W.V., 1991. Diffusion controlled swelling ofreservoir oil by direct contact with injection gas. Chem. Eng. Sci.46, 1259–1270.
Grogan, A.T., Pinczewiski, W.V., Ruskauff, G.J., Orr, F.M., 1986.Diffusion of carbon dioxide at reservoir conditions-models andmeasurements. SPE/DOE Fifth Symposium on EOR of the Societyof Petroleum Engineers and the Department of Energy held inTulsa, Oklahoma (April 20–23).
Grogan, A.T., Pinczewiski, W.V., Ruskauff, G.J., Orr, F.M.,1988. Diffusion of carbon dioxide at reservoir conditions—models and measurements. Soc. Pet. Eng., Reservoir. Eng. 3,93–102.
Hayduk, W., Castaneda, R., Bromfield, H., Ray, R.R., 1973.Diffusivities of propane in normal paraffin, chlorobenzene andbutanol solvents. AIChE J. 19, 598–861.
Hill, E.S., Lacy, W.N., 1934. Rate of solution of methane in quiescentliquid hydrocarbons. Ind. Eng. Chem. 26, 1324–1327.
Hirschfelder, J.O., Curtis, C.F., Bird, R.B., 1954. Molecular Theory ofGases and Liquids. Wiley, New York.
LeGallo, Y., LeRomancecer, J.F., Bourbiaux, B., 1997. Mass transferin fractured reservoirs during gas injection: experimental andnumerical modelling. SPE 38924. Texas.
Mathur, G.P., Thodos, G., 1965. The self-diffusion of substances in thegaseous and liquid states. AIChE J. 11, 613–618.
McManamey, W.J., Woollen, J.M., 1973. The diffusivity of carbondioxide in some organic liquids at 25 and 50°C. AIChe J. 19,667–669.
Nguyen, T.A., Faroug Ali, 1998. Effect of nitrogen on the solubilityand diffusivity of carbon dioxide into oil and oil recovery by theimmiscible WAG process. J. Can. Pet. Technol. 37 (2), 24–31.
Poling, B.E, Prausnitz, J.M., O'Connell, J.P., 2001. The Properties ofGases and Liquids, 5th edition. McGraw-Hill, New York. 0-07-011682-2.
Reamer, H.H., Opfell, J.B., Sage, B.H., 1956. Diffusion coefficients inhydrocarbon systems: methane–decane–methane in liquid phase.Ind. Eng. Chem. 48, 275–282.
Renner, T.A., 1986. Measurement and correlation of diffusioncoefficients for CO2 and rich gas applications. SPE 15391,Presented at the Annual Technical Conference and Exhibition ofthe Society of Petroleum held in New Ontario, LA. 5–8 October.
Riazi, M.R., 1996. A new method for experimental measurement ofdiffusion coefficients in reservoir fluids. J. Pet. Sci. Eng. 14,235–250.
Riazi, M.R., Whitson, C.H., 1993. Estimation of diffusion coefficientsof dense fluids. Ind. Eng. Chem. Res. 32, 3081–3088.
Sigmund, P.M., 1976. Prediction of molecular diffusion atreservoir conditions: Part I. Measurement and prediction ofbinary dense gas diffusion coefficients. Can. J. Pet. Technol.48–52 (April-June).
Slattery, J.C., Bird, R.B., 1961. Calculation of the diffusioncoefficients of dilute gases and of the self-diffusion coefficientsof dense gases. AIChE J. 7, 611–617.
Stroud, K.A., 1996. Further Engineering Mathematics, Third Edition.Macmillan Press, London.
Swapan, K., Buttler, R.M., 1996. Diffusion coefficients of propane andbutane in Peace River Bitumen. Can. J. Chem. Eng. 74, 985–992.
Taylor, R., Krishna, R., 1993. Multicomponent Mass Transfer. JohnWiley & Sons.
Upreti, S.R., Mehrotra, A.K., 2002. Diffusivity of CO2, CH4, C2H6
and N2 in Athabasca Bitumen. Can. J. Chem. Eng. 80, 116–125.Whitman, W.G., 1923. The two-film theory of absorption. Chem.
Metall. Eng. 29, 147–152.Zhang, Y.P., Hyndman, C.L., Maini, B.B., 2000. Measurement of gas
diffusivity in heavy oils. J. Pet. Sci. Eng. 20, 20–47.

本文献由“学霸图书馆-文献云下载”收集自网络,仅供学习交流使用。
学霸图书馆(www.xuebalib.com)是一个“整合众多图书馆数据库资源,
提供一站式文献检索和下载服务”的24 小时在线不限IP
图书馆。
图书馆致力于便利、促进学习与科研,提供最强文献下载服务。
图书馆导航:
图书馆首页 文献云下载 图书馆入口 外文数据库大全 疑难文献辅助工具