Embed Size (px)
Citation preview

1
Diffusion behaviour of proteins and polyelectrolytes
interrogated via a microfluidics device
Tiago Picanço Castanheira da Silva
November 2017 │ Instituto Superior Técnico, Portugal
Abstract
The diffusion coefficient (D) of different proteins and dextran sulphate sodium salt (DSS) was determined
by using a microfluidics H-cell. The mass transfer was determined with an inline measurement by a
spectrophotometer (proteins) or a conductivity meter (polyelectrolyte) and D was calculated using
COMSOL and Matlab, making use of the mass transfer between two streams flowing in laminar flow
that had different solute concentration and considering the channel’s dimensions and residence time in
the microchannel. The D value of lysozyme and cytochrome c was determined for different experimental
conditions, having compared the values and trends with previous literature and models. The D value
was also determined for six different proteins. It was found that the increase of the ionic strength was
inversely proportional to the D value of lysozyme, varying from 𝐷 = 4.40 ± 0.17 × 10⁻¹⁰ 𝑚2/𝑠 to a value
between 1.2 × 10⁻¹⁰ and 1.5 × 10⁻¹⁰ 𝑚2/𝑠 for higher ionic strength values. The variation with the
solvent’s viscosity and with the increase of the proteins’ molecular weight followed the trend predicted
by the Stokes-Einstein correlation suggesting that it is valuable for predicting a trend but not for precise
value for the studied molecules. Lysozyme and cytochrome C showed an increase of D value with
increase of protein concentration suggesting that there are predominant repulsive interactions between
the proteins. The D value of DSS showed no significant trend or variation with the increase of solute
concentration. It is demonstrated that the H-cell is a high-throughput method, being accurate and
precise, with flexibility in the detection method.
Keywords: diffusion coefficient, H-cell, microfluidics, protein, polyelectrolyte
1. Introduction
The diffusion coefficient (D) is often a rate-limiting
step of biochemical industries and a good
understanding of the diffusion phenomenon in solution
is of great importance, both theoretically and practically
[1]. The practical application of this knowledge is the
need to design mass transfer processes and often
parameters are important in the scaling of industrial
processes, allowing for a better planning of a process
[2]. For theoretical purposes, the diffusion coefficient is
often an indicator of a molecule’s stability in solution,
among other properties. Even though it is important to
know both protein and polyelectrolyte diffusion
coefficients, the estimation of this parameter through
experimental methods revealed itself as a hard and
time-consuming process as there are several available
methodologies for the determination of the diffusion
coefficient but there is not a consensus either in the data
collected by the different methodologies or in which
methodology is better for its determination [1].
There are plenty of factors influencing diffusion as
it was proven that it depends on various aspects,
ranging from hydrodynamic factors but it also depends
on factors like the shape and size of these molecules,
2
their concentration on solution, their charge and the
ionic strength of the solution [3]. Simpler molecules may
have its diffusion dependent only on electrostatic
interactions (strong electrolytes, for example) and
solute-solvent interactions but more complex
molecules, like proteins, often have their diffusion
dependent on solute-solute interactions like
electrostatic interactions and van der Waals
interactions, together with the hydrodynamic solute-
solvent interactions [4]. Solute-solute interactions are
important in such a way that it has been shown that
diffusion can be affected by the solute’s concentration
and also the solution’s ionic strength, as the shielding
effect of ions may be of importance to avoid or promote
solute-solute interactions [5], [3]. The complexity of
molecules like proteins and polyelectrolytes makes it
hard to accurately predict its D value and this can be
affected by a wide range of conditions so there is the
need to accurately predict the diffusion coefficient of
several molecules under various conditions.
Although there are a various number of methods to
determine the diffusion coefficient of molecules
(Dynamic Light Scattering, Nuclear Magnetic
Resonance, Gouy Interferometry, among others), there
is a lack of agreement in which one is the most suitable
one [1]. It ultimately comes down to what is most
suitable for each one, as some of the above mentioned
techniques require expensive and complex equipment,
even though capable of generating accurate data. One
of the drawbacks of these techniques lies in its inability
to adapt detection devices to the molecule that is the
target of research. Therefore, there is the need to have
a detection method that can overcome these limitations
whilst generating accurate data and a novel device is
used to study the diffusion behaviour of proteins and
polyelectrolyte.
In the last years, microfluidics arose as a viable
alternative to these methods. Microfluidics is used to
predict diffusion coefficients using the principle of solute
transfer between the interface of two co-current laminar
flow fluids [6]. The microscale offered by microfluidics
allows for a control of the fluid dynamics, allowing for a
bigger control of molecule concentration in space and
time [7]. Conjugated to this, a versatile detection
method allows for an adaptation of the technique to the
studied molecules. Mass diffusion has been studied for
decades now, and has been widely accepted to be a
random molecular motion, as acknowledged by Fick
and Brown [8]. Until this day, mass diffusion relies its
comprehension on Fick’s laws of diffusion [1], [9].
Einstein and Stokes developed an equation for the
prediction of diffusion when the solute is much bigger
than the solvent and based on Brownian motion known
as the Stokes-Einstein correlation:
𝐷 =𝑘𝐵𝑇
𝑓=
𝑘𝐵𝑇
6𝜋𝜂𝑅0
(1)
In this equation, f represents the friction coefficient
of the solute given by 6π•η•R0, where η is the solvent’s
viscosity and R0 is the solute’s radius (that can be the
hydrodynamic radius, in the case of protein, for example
[2]), whereas kB represents the Boltzmann constant and
T the temperature. In the present work, a microfluidics
H-cell previously developed and validated by Häusler et
al. [10] previously validated for electrolytes in the same
study and was used for the study of diffusion conjugated
with suitable detection devices for both proteins and
polyelectrolytes.
Polyelectrolytes have been emerging as important
molecules in the biomedical field due to its
biocompatible properties and are non-toxic and well-
tolerated by the human body. Dextran Sulphate Sodium
Salt (DSS) has a pKa lower than 2 which means that is
negatively charged at any pH above this value. This
opens room for the formation of polyelectrolyte
complexes (PEC). These complexes are formed by
mixing two polyelectrolytes of opposite charge in
solution that will interact through electrostatic
interactions, which are relatively strong interactions but
still reversible. Proteins themselves have a positive or
negative charge depending on their pI value and
solution’s pH. The conjugation of both molecules could
revolutionize how drug administration is done
nowadays [11].

3
2. Experimental Approach
2.1. Materials and Solutions
Acetate and Phosphate Buffers were prepared
using, CH3COOH glacial (MERCK, ≥ 99,7% assay),
CH3COONa (MERCK, ≥ 99% assay) and Na2HPO4
(Sigma-Aldrich, ≥ 99% assay), NaH2PO4 (Sigma-
Aldrich, ≥ 99% assay), respectively. The viscous
solutions were prepared using glycerol (MERCK, ≥ 99%
assay) and Ionic Strength solutions were prepared
using NaCl (J.T. Baker, 100%). A different buffer was
used for the Enbrel ® IgG solution using L-arginine
monohydrochloride (Sigma-Aldrich, ≥ 99,5%), HCl
(MERCK, 37-38%), Na2HPO4 (Sigma-Aldrich, ≥ 99%),
NaCl and Sucrose (MERCK). Milli Q water was used as
the solvent for all buffers. The cleaning solution was
prepared by solubilization of 5% (w/v) NaOH pellets
(Sigma-Aldrich, ≥ 98% assay). For the SIC trials,
NaHCO3 (JT Baker, ≥ 99% assay) and Ethanolamine
(Sigma-Aldrich, ≥ 98% assay) were used, besides some
of the components previously described. Blue Dextran
(DxBlue) (Sigma-Aldrich) and acetone (Sigma-Aldrich,
≥ 99.9% assay) were used to assess the SIC columns’
integrity.
Lysozyme from chicken hen egg white (Sigma-
Aldrich, 14.3 kDa, 70 000 U/mg), Cytochrome C from
bovine heart (Sigma-Aldrich, 12.327 kDa, ≥ 95%
assay), Myoglobin from horse heart (Sigma-Aldrich, 17
kDa, ≥ 90% assay), Ovalbumin from chicken egg white
(Sigma-Aldrich, 44.3 kDa, ≥ 98% assay) human Enbrel®
IgG (Pfizer, 150 kDa), Bovine Serum Albumin (BSA)
(Sigma-Aldrich, 66.5 kDa, ≥ 95% assay) and Dextran
Sulphate Sodium Salt (Sigma-Aldrich, 5 kDa) were
used. All protein/polyelectrolyte solutions were used
using acetate buffer (AB), phosphate buffer (PB) or milli-
Q water, and will be referred accordingly.
2.2. Experimental Approach
The setup that was used for the measurements of
the Diffusion Coefficient of proteins and DSS is
illustrated in Figure 2. The system consists of a syringe
pump (Model 200, KD Scientific, Massachusetts) that
has four 1 mL syringes (Omnifix®-F, B.Braun,
Germany) operating simultaneously. Two syringes are
pumping the fluid into the H-cell (Micronit®,
Netherlands) (streams 1 and 2) while two syringes are
withdrawing the fluid out (streams 3 and 4) at the same
rate. This ensures that there is an equal inflow and
outflow of fluid in the microchannel system, allowing for
a clear interface between the two fluids right in the
centre of the channel. The syringes are connected to
the microfluidics H-cell (Micronit®, Netherlands) of
dimensions 625 mm x 750 μm x 69 μm (length x
average width x height) with PEEKTM tubes (Upchurch
Scientific®, VWR, Pennsylvania). The inline detector is
either a Spectrophotometer (SPD-20AV, Shimadzu,
Japan) for proteins, or a Conductivity meter (C3010
Multi-Parameter Analyser, Consort, Belgium), for
polyelectrolyte.
For the in-line devices a calibration line was made
using different concentrations of solute, in order to have
proportionality between the solute’s concentration and
the signal from the device.
Protein concentration in solution was determined
using a spectrophotometer (UV-1800, Shimadzu,
Japan), with a suitable wavelength for each of the
proteins.
2.3 Protein Attachment
To better understand if the chip was reliable in the
generated data, it was important to know if the chip
surface influenced diffusion of complex molecules, like
proteins. To do this, a study to determine the protein
attachment to the glass surface of the chip was
performed. To do this, two spectrophotometers
connected in-line to streams 3 and 4 from Figure 2.
Using a calibration line for each device, it was estimated
the outlet concentration of both streams and a mass
balance in steady-state was made.
2.4. Mass Balance
Diffusion coefficient is calculated through a mass
balance to the chip channels. The two inlet
concentrations are known, being always needed to
have a receiving fluid and a giving fluid. After diffusion
takes place the outlet concentration of the receiving fluid
is measured. Knowing this concentration, as well as
knowing one of the outlet concentrations, a mass
balance can be done to estimate the total amount of
mass that diffused from the channel with the giving fluid
to the channel with the receiving fluid. Cussler explains
this mass balance [1], that is applied to the interface
between both streams when steady-state is reached. In
a steady-state diffusion across a thin, moving liquid film
Figure 2 - Experimental setup used. The system comprises a syringe pum module, a microfluidics channel (H-cell) and a detector. Streams 1 and 2 are the inlet of the giving and receiving fluids, respectively, and streams 3 and 4 are the outlets of the receiving and giving fluids, respectively. An inline detector (spectorphotomer/conductivity meter) is placed between the outlet of the receiving fluid and the syringe.
Inline Detector
1 2 3 4
x
y z

4
there are three assumptions in order to do the mass
balance: the solution is dilute, the only resistance to
mass transfer is the liquid and the mass transport has
two main components that are diffusion along the x-axis
and convection along the y-axis and any other
phenomenon for mass transfer is negligible (for axis
reference please check Figure 2) [1].
The mass balance, based in Fick’s law of diffusion
for steady-state and after dividing all of the equation’s
terms for the characteristic dimensions Δx Δy Δz,
equation (2) is obtained:
�̅�(𝑥) ∙𝜕𝐶
𝜕𝑦= 𝐷
𝜕2𝐶
𝜕𝑥2 (2)
2.5. Diffusion Coefficient determination
A program of Matlab (Mathworks, USA) linked with
COMSOL Multyphysics (COMSOL, Sweden) was
developed to calculate the diffusion coefficient based on
the steady state outlet concentration of the receiving.
This model was developed and validated in previous
research [10]. The input parameters for the calculation
are outlet and both inlet concentrations, channel’s
dimensions and flow rate. With each D value, the
Fourier number can be estimated. Previous research
showed that a Fourier number between 0.3-0.39 was
within high sensitivity and accuracy estimations of the D
value [10].
2.6. Self-Interaction Chromatography (SIC)
For the SIC trials, a 1 ml commercial column (Hi-
TrapTM PD-10 NHS-activated, GE Healthcare)
connected to an AKTA Avant 25 (GE Healthcare) under
the control of the UNICORN software was used. Initially
there was the need to bind irreversibly the lysozyme to
the resin. This is carried out similarly to what was
described by Tessier [12], by leaving a lysozyme
solution in recirculation during 4 h at a flow rate of 1
ml/min in a buffer containing NaHCO3 and NaCl. After
coupling, a solution containing a reactive compound like
ethanolamine is used to block any groups that did not
react with lysozyme. This procedure is used in the
ligand column and blocked column and in this last one,
the recirculation step with lysozyme is skipped. After the
preparation of the columns the coupling efficiency is
measured and a coverage area of the column of 25%
was achieved meaning that the column is viable
(coverage area should be between 20-30%). The
experiments were then conducted, using lysozyme
solutions in the buffers that were to be tested. To do so,
1.5 mg/ml solutions of lysozyme were prepared. The
column was equilibrated with the suitable buffer and
when the signal reached a steady value, a pulse of the
solution was passed through the column and the protein
eluted in this step. A final elution step was used to elute
from the column any of the protein that could have been
still inside the columns. It was used an acetate buffer
10mM, phosphate buffer 10mM and water solutions for
these trials with lysozyme.
3. Results and Discussion
3.1 Chip Validation - NaCl and attachment
To validate the chip and the chosen channel for
diffusion, different studies were made. To better
understand if the chip was reliable in the generated
data, it was important to know if it could provide data in
accordance to previous literature and to know what was
the chip surface influence in molecules like proteins.
It was performed a diffusion trial to collect data on
the D value of sodium chloride and further compare it
with literature. It was obtained a value of 𝐷 = 1.55 ±
0.04 × 10⁻⁹ 𝑚2/𝑠 which is about 3% different from
previous literature [1], [10]. Literature suggested that a
concentration of solute in the channel was 10 mol/m3 or
less [10] and a concentration of 50 mol/m3 was used
and this could be the cause of the deviation, as a higher
concentration of sodium chloride could increase
attractive interactions between the ions in solution.
Even though, this measurement validated the
microfluidics chip and the chosen channel as it provided
a measurement with good accuracy of an extensively
studied compound.
The protein attachment trials were performed with
several proteins (lysozyme, cytochrome C, myoglobin,
ovalbumin, BSA and Enbrel ® IgG) in different buffers.
The overall data showed that the recovery of protein
was 102.3 ± 3.8 %. This value is virtually 100%, due to
the error estimated. This shows that all protein that was
pumped into the H-cell was retrieved through the outlet
channels, validating that there is no influence of the
glass surface on the estimation of the diffusion
coefficient of the proteins.
3.2 Ionic Strength
To better understand what is the influence of the
solute’s ionic strength on the diffusion of proteins,
different trials were done using solutions of varying ionic
strength (I). The ionic strength calculated taking into
account not only the solution’s intrinsic contribution (in
the case of acetate and phosphate buffers) but also
when sodium chloride was added to the solutions.
5
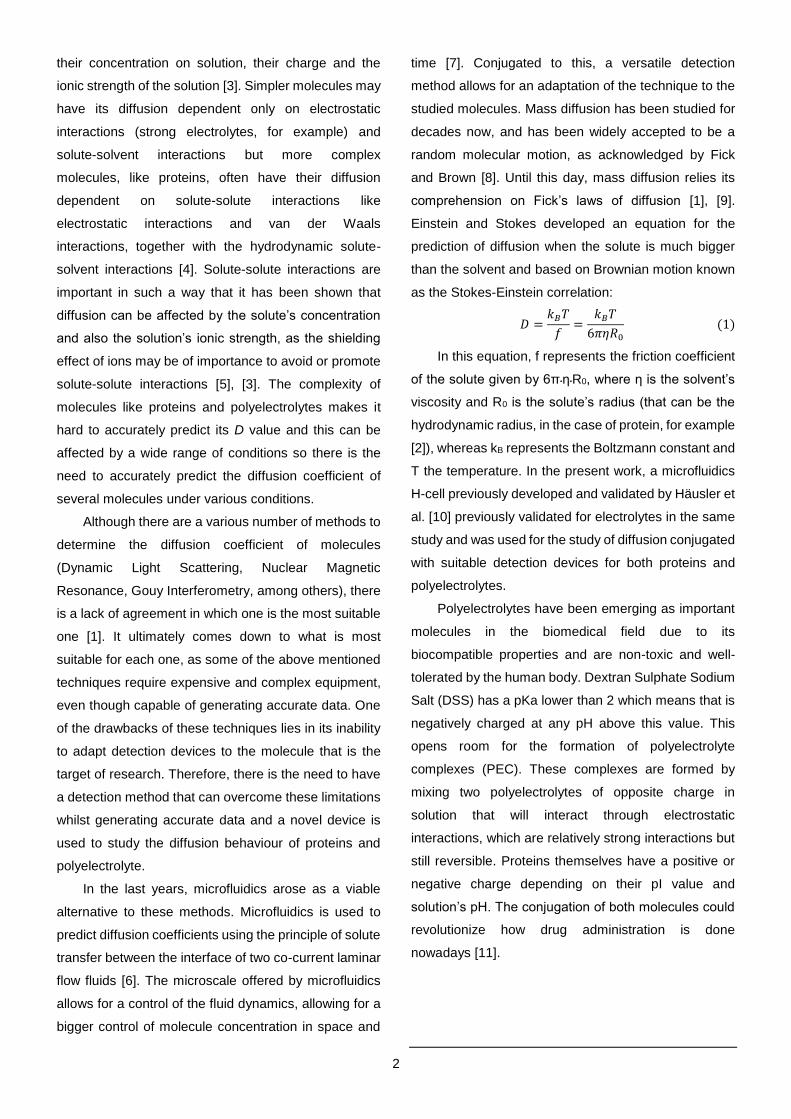
Looking at Figure 2 it is possible to see that there
is a variation in the D value of Lysozyme (triangles and
diamonds) in the region of very low ionic strength.
Experimental data on lysozyme and cytochrome C in a
region from low to relatively high ionic strength showed
that there was not a big change in the diffusion of these
proteins. It was also demonstrated that there is not a big
difference in having ionic strength using a higher
concentration of phosphate buffer (for example 100 m
M PB) or using a lower concentration buffer with added
salt (for example phosphate buffer 10 mM and 200 mM
sodium chloride).
Cadman et al. had already studied the influence of
I on the diffusion coefficient of lysozyme chloride [3].
Experimental data showed the same trend as in [3], as
a very steep decrease in the D value of lysozyme is
noticeable. It is also possible to see a decrease in the D
value of cytochrome C from 3 mM ionic strength to
higher values of ionic strength. In the higher ionic
strength region (100 mM and above), a diffusion
coefficient between 1.2 × 10⁻¹⁰ and 1.5 × 10⁻¹⁰ 𝑚2/𝑠 is
observed and is comparable to previous literature data
[3], [13]. In all the solutions used, both lysozyme and
cytochrome C have a net positive charge, as their pI
values are 11.3 and 10, respectively. Lysozyme was
tested in a water solution, AB (10mM and 100mM) and
PB (10 mM and 100mM) (pH values of 3.5, 4.2 and 7.2)
and cytochrome C in AB and PB solutions (pH values of
4.2 and 7.2). The ionic strength could be regulated with
the use of sodium chloride.
The predominant interactions between these
proteins are electrostatic interactions and, in this case,
repulsive interactions. This is visible when the the I
value is increased even just a little, as the D value for
lysozyme decreased sharply from 0M ionic strength to
3 mM ionic strength. The increase of the ionic strength
of the solutions will lead to an increase of the free ions
in solution that can have electrostatic interactions with
the proteins. Increasing I, the free electrostatic energy
of the proteins will decrease and that will make it less
likely for them to interact with one another, reducing the
diffusion coefficient. Ions in solution have a shielding
effect over the charged residues of the proteins and
residues that were previously charged and able to
interact with other charge residues are not available
anymore, decreasing the repulsive interactions
between the molecules [3]. The lack of variation of the
D value from a given I value onwards is due to the fact
that only a certain ionic strength is needed to shield all
protein residues and the proteins will present a typical
hard sphere diffusion, behaving like there are no more
proteins in solution, behaving like hard-spheres (this
phenomenon was visible until an ionic strength of 500
mM).
3.3 Viscosity
Solvent’s effect on diffusion are not only related to
the ionic strength of the solution. To test the influence
of the solvent’s viscosity, different trials using 10 mM PB
with added glycerol. The solutions’ viscosity was
1.00 × 10⁻³, 1.36 × 10⁻³, 1.84 × 10⁻³, and 4.57 × 10⁻³
Pa•s, corresponding to an added glycerol of about 0, 10,
20 and 40% (v/v).
0
1
2
3
4
5
6
7
0 100 200 300 400 500 600
D (
x1
0-1
0m
2/s
)
I (mM)
0
1
2
3
4
5
6
7
0 5 10 15 20 25
Figure 2 - Diffusion of Lysozyme and Cytochrome C in different
ionic strength solutions. The green triangles (▲) represent
literature values for lysozyme in water, with varying concentration
of KCl, for the variation of the ionic strength [3]. The blue diamonds
(♦) represent lysozyme experiments in different buffers and the red
squares (■) represent the cytochrome C experiments in different
buffers with varying concentration of NaCl. The dashed lines in
data points are used to guide the viewers eye. Measurements
performed at a controlled room temperature of 20ºC. The black
dashed line is used to highlight the lower ionic strength region.
6
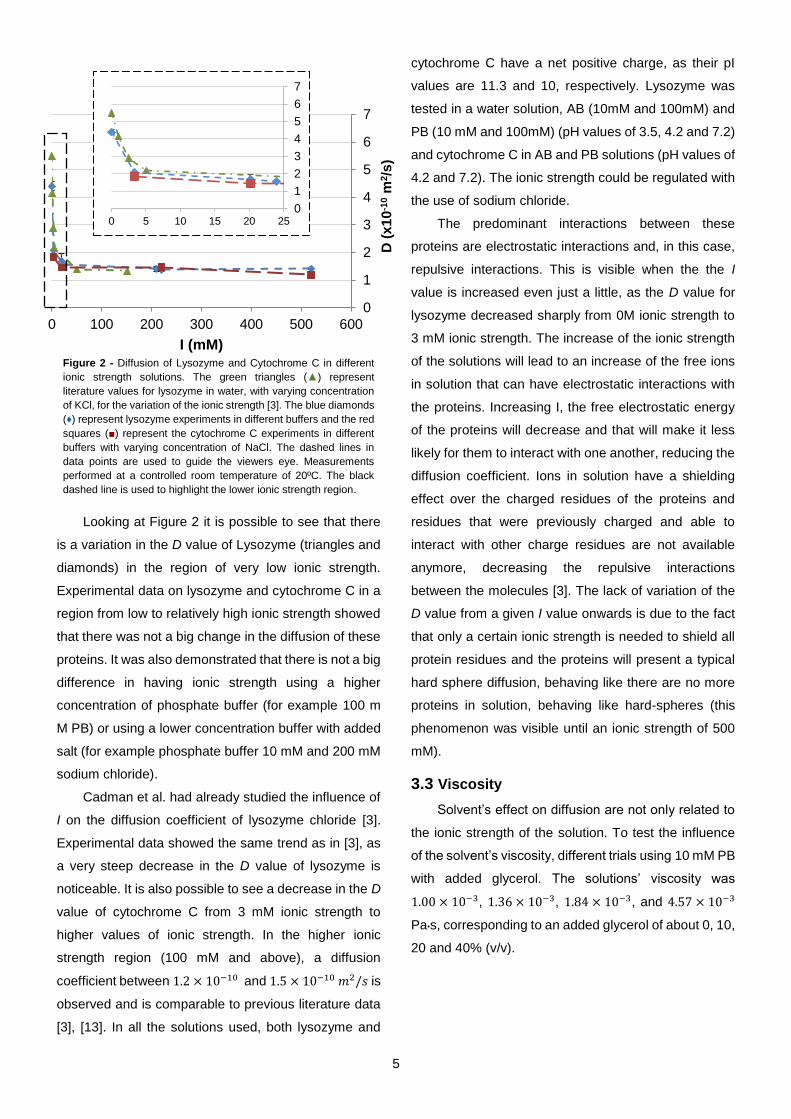
It is possible to see from Figure 3 that there is a
decrease in the diffusion coefficient of both proteins with
the increase of the solvent’s viscosity. For the case of
molecules diffusing in a solvent that is much smaller, the
Stokes-Einstein correlation is good for the prediction of
the variation of D. The increase of the viscosity will lead
to a bigger drag force of the solvent applied in the
solute, as the friction of the aqueous solution increases.
Stokes-Einstein correlation predicts an inverse
proportionality between D and the medium’s viscosity,
and that is what is observed.
It is important to highlight that Stokes-Einstein is a
very simplistic model, as it doesn’t account the inter
molecule interactions. However, for the used
experimental conditions the electrostatic interactions
influence in the diffusion phenomena is shielded due to
the ions in solution, and only the van der Waals
interactions have a role, having both proteins a hard-
sphere diffusion behaviour (as shown in 3.2).
The observation of Figure 3 shows that the
prediction of the Stokes-Einstein correlation could be
very accurate for this specific case. It appears that what
keeps the equation’s values from being closer to the
experimental ones is the hydrodynamic radius chosen
for each of the proteins. In fact, for lysozyme several
hydrodynamic radii have been suggested for similar
experimental conditions to the ones used (at the lowest
viscosity), and range from 17 to 20 Å and the chosen to
the Stokes-Einstein correlation was 20 Å. For bovine
cytochrome C there is limited data on this subject and a
RH of 17 Å was used. Using a different value for the
hydrodynamic radius of both proteins could show a very
precise fitting of the Stokes-Einstein correlation to the
experimental data, as a hydrodynamic radius of 16 Å for
lysozyme and 15 Å for cytochrome C would largely
improve the fitting of the correlation to the experimental
data.
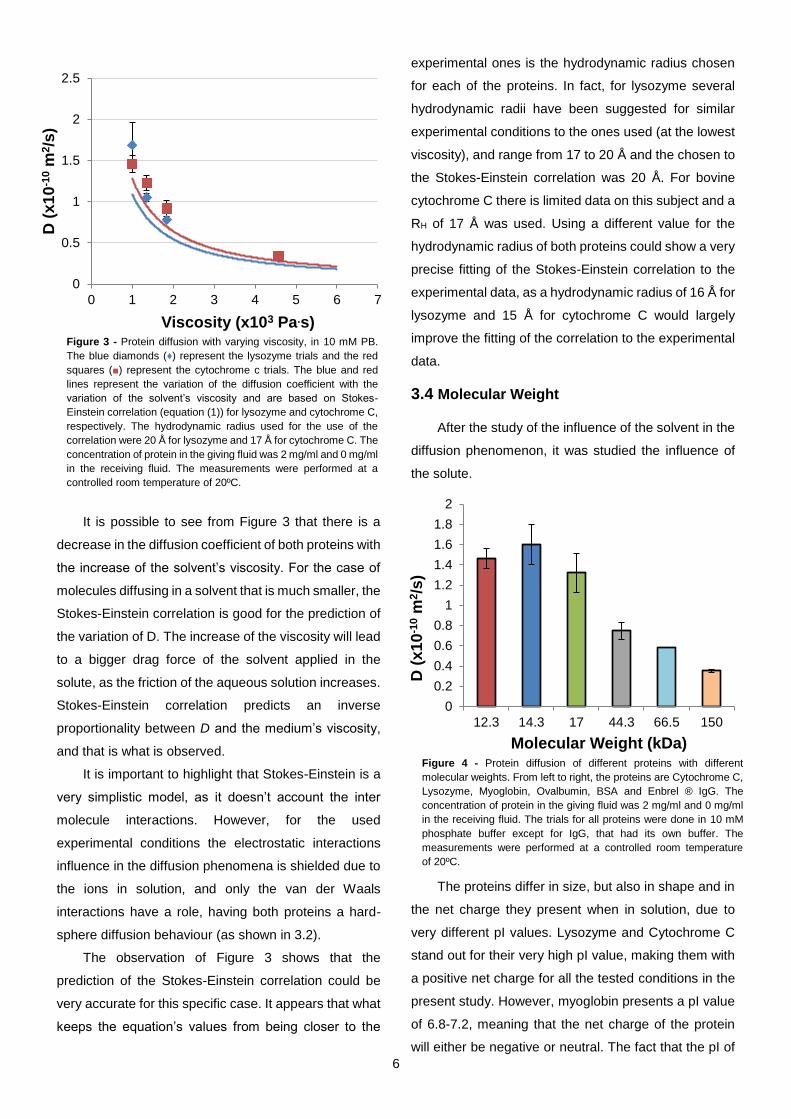
3.4 Molecular Weight
After the study of the influence of the solvent in the
diffusion phenomenon, it was studied the influence of
the solute.
The proteins differ in size, but also in shape and in
the net charge they present when in solution, due to
very different pI values. Lysozyme and Cytochrome C
stand out for their very high pI value, making them with
a positive net charge for all the tested conditions in the
present study. However, myoglobin presents a pI value
of 6.8-7.2, meaning that the net charge of the protein
will either be negative or neutral. The fact that the pI of
0
0.5
1
1.5
2
2.5
0 1 2 3 4 5 6 7
D (
x1
0-1
0m
2/s
)
Viscosity (x103 Pa.s)
0
0.2
0.4
0.6
0.8
1
1.2
1.4
1.6
1.8
2
12.3 14.3 17 44.3 66.5 150
D (
x1
0-1
0m
2/s
)
Molecular Weight (kDa)Figure 4 - Protein diffusion of different proteins with different
molecular weights. From left to right, the proteins are Cytochrome C,
Lysozyme, Myoglobin, Ovalbumin, BSA and Enbrel ® IgG. The
concentration of protein in the giving fluid was 2 mg/ml and 0 mg/ml
in the receiving fluid. The trials for all proteins were done in 10 mM
phosphate buffer except for IgG, that had its own buffer. The
measurements were performed at a controlled room temperature
of 20ºC.
Figure 3 - Protein diffusion with varying viscosity, in 10 mM PB.
The blue diamonds (♦) represent the lysozyme trials and the red
squares (■) represent the cytochrome c trials. The blue and red
lines represent the variation of the diffusion coefficient with the
variation of the solvent’s viscosity and are based on Stokes-
Einstein correlation (equation (1)) for lysozyme and cytochrome C,
respectively. The hydrodynamic radius used for the use of the
correlation were 20 Å for lysozyme and 17 Å for cytochrome C. The
concentration of protein in the giving fluid was 2 mg/ml and 0 mg/ml
in the receiving fluid. The measurements were performed at a
controlled room temperature of 20ºC.

7
this protein is so close to the tested conditions was
noticeable when one wanted to prepare the solution of
myoglobin, as it clearly took a longer time to fully
dissolve in the used buffer. Ovalbumin, BSA and Enbrel
® IgG have pI values of 4.5, 4.7 and 4.4-5.5, so all of
these proteins will have a negative net charge in
solution.
The data shows that an increase in the size (in this
case showed by the molecular weight) will lead to a
decrease in the diffusion coefficient. The first three
proteins (cytochrome C, lysozyme and myoglobin) have
similar molecular weights and shapes and the only
difference (besides the Mw difference) is the pI value of
each. This is in accordance with what the Stokes-
Einstein correlation predicts, as an increase in the
molecular weight is most of the times synonym to an
increase in the hydration radius. The influence of the RH
is equal to the influence of the solvent’s viscosity, as an
increase in this value will lead to an inversely
proportional decrease of D, as a smaller molecule will
be subjected to a lower friction from the solvent, when
moving freely in solution, when compared with a larger
molecule.
3.5 Concentration
The study of the influence of solute’s concentration
in the diffusion coefficient was also tested. To do so,
different concentrations of solute were used in the inlet
fluids, considering the tested concentration to be the
average of the concentration of both fluids. Lysozyme
and Dextran Sulphate were tested using three different
solutions (acetate buffer 10 mM, phosphate buffer 10
mM and water) whereas cytochrome C was tested using
both acetate buffer 10 mM and phosphate buffer 10
mM.
In Figure 5 it is possible to see that both lysozyme
and cytochrome C have an increase in the diffusion
coefficient with an increase of the concentration of
protein for the tested buffers, with low ionic strength. For
the lowest ionic strength tested (water solution, with 0
mM of ionic strength) the diffusion coefficient was
constant for the tested concentrations. It is also possible
to see that there is no apparent change in the diffusion
coefficient of DSS for water and AB solutions. On the
other hand, it is noticeable that there is an increase of
the diffusion coefficient of DSS with the increase of the
solute’s concentration for the PB experiments.
The increase of the diffusion coefficient of the
proteins with the increase in concentration is explained
with the repulsive interactions that these proteins have
with themselves in the tested conditions as this is a
similar phenomenon to a previously reported one for a
different protein (α-chymotripsinogen) [14]. In the case
of the tested proteins, D is influenced by the
concentration of these proteins because it has an effect
on the ion/protein ratio. The ions in solution help to
shield the surface charges of the proteins in solution,
shielding the ability of these proteins to have
electrostatic interactions with one another [5]. A lower
concentration of protein will then lead to a bigger
percentage of proteins that have their surface charges
shielded and less available proteins will be in solution
for the electrostatic interactions. The smaller the ratio
ion/protein, the more proteins will be in solution that
have less shielded surface charges and more repulsive
electrostatic interactions will occur. A possible
justification for the no apparent change of the diffusion
coefficient in water is the fact that in this solution there
is no shielding at all occurring and that the diffusion
coefficient is at a maximum value. Increasing to much
the concentration of solute could lead to precipitation of
this solute and then the decrease of the diffusion
coefficient (bigger particles diffuse slower).
Dextran Sulphate behaves differently than the
proteins. This molecule is in the salt form which means
that every molecule of dextran sulphate that is
solubilized, twelve sodium molecules will be released in
solution. This will make it that the solution’s ionic
strength varies with the variation of the concentration of
the polyelectrolyte. This molecule is smaller than any of
the proteins tested and that is the reason why its
diffusion coefficient is bigger than the proteins. The
solubility of this compound is higher than the proteins
and the fact that higher concentrations of solute still had
an outlet signal within the linearity range allowed for the
testing of higher concentrations than the used for

8
proteins. From Figure 5 it is possible to see that DSS
shows no clear increase or decrease of its D with the
increase in concentration for water and acetate buffer
10 mM but an increase was noticeable for phosphate
buffer 10 mM.
Using the same analysis used for proteins, the
increase of the concentration of polyelectrolyte could
decrease the ion/polyelectrolyte ratio and this will lead
to a bigger importance of the electrostatic interactions
between polyelectrolyte molecules. However, as
dextran sulphate is in the form of sodium salt, every time
it is solubilized in solution there is the release of sodium
ions in solution proportional to the solubilized molecules
meaning that the ion/polyelectrolyte ratio is kept
constant in water. So, it is expected that electrostatic
interactions between DSS molecules are equal for the
minimum and maximum concentration tested in water.
It is true, however, that increasing the concentration of
DSS will decrease the ratio mentioned in the buffer
solutions because for a smaller concentration, this ratio
is influenced by the sodium in DSS molecules plus the
ions in solution. For a smaller concentration of DSS the
ratio of ion/polyelectrolyte is higher than when the
concentration of DSS in solution is higher, as the
influence of the sodium ions in DSS will have a bigger
importance as the sodium in the DSS molecules will be
more than the present in solution. This could justify the
increase seen in phosphate buffer, but the same trend
was expected in acetate buffer even though the buffers
differ in ionic strength (20 mM and 3mM, respectively).
0
1
2
3
4
5
6
0 1 2 3 4 5 6
D (
x1
0-1
0m
2/s
)
0
1
2
3
4
5
6
0 1 2 3 4 5 6
0
2
4
6
8
10
12
14
0 2 4 6 8 10 12
D (
x1
0-1
0m
2/s
)
Concentration (mg/ml) Concentration (mg/ml)
Concentration (mg/ml)
Figure 5 – Lysozyme (top left), cytochrome c (top right) and dextran sulphate (bottom) diffusion with varying concentration, in different solutions.
The green triangles (▲) represent the water trials, the blue diamonds (♦) represent the trials in 10 mM acetate buffer and the red squares (■)
represent the trials in 10 mM phosphate buffer. Measurements performed at a controlled room temperature of 20ºC. The dashed green and
blue lines in data points is used to guide the viewers eye. A linear regression for the trials of lysozyme and cytochrome C in AB and PB was
done and for dextran sulphate in PB. For lysozyme, the equation of the regression in AB was y = 0.427x + 1.523 with a correlation coefficient
of R2=0.935 (full blue line) and the regression in PB has the equation y = 0.757x + 0.801 with a correlation coefficient of R2=0.978 (full red
line). For cytochrome C, the equation of the regression in AB was y = 0.204x + 1.568 with a correlation coefficient of R2=0.928 (full blue line)
and the regression in PB has the equation y = 0.412x + 1.081 with a correlation coefficient of R2=0.995 (full red line). For dextran sulphate,
the equation of the regression in PB was y = 0.456x + 6.663 with a correlation coefficient of R2=0.905 (full red line).

9
To understand what kind of interactions were
happening in the diffusion trials, a SIC study was done.
This study’s main function is to understand if a protein,
in a given condition, has with itself repulsive or attractive
interactions or if it doesn’t interact with itself in any way.
The objective was to have qualitative data and not
quantitative, although it is important to keep in mind that
SIC trials can be used to estimate the second virial
coefficient (B22). When the elution represented by the
blue line occurs at less retention volume than the elution
by the dashed line, it means that there are repulsive
interactions occurring [15]. If the opposite happens,
than there are attractive interactions and if the peaks
elute at the same retention volume than there are no
interactions. It is accepted that lysozyme molecules’
interactions are mainly based on two phenomena,
repulsive electrostatic interactions and attractive van
der Waals interactions [4]. Looking at Figure 6, that is
observed for both water and acetate buffer but not for
phosphate, although it is expected from the data in
Figure 5 that in this buffer there are also repulsive
interactions. The SIC experiments were performed
using an inject concentration of lysozyme around 1.5
mg/ml. It is important to keep in mind that the
interactions between molecules, with varying
concentration, depend on the ion/protein ratio. This can
mean that at a low concentration of protein in a buffer
solution, the ionic strength might be enough to shield all
protein charges, decreasing the electrostatic
interactions and, therefore, a bigger influence of other
type of interactions will rule the diffusion [15], appearing
to have attractive interactions. This was not observed
for both water and acetate buffer because the ionic
strength of both solutions (0 mM and 3 mM,
respectively) was very low and not enough to shield the
charges of the proteins in solution, being the ion/protein
ratio low enough for the electrostatic interactions to
prevail over the attractive van der Waals interactions.
4. Conclusions and Future Work
The main objective of the present work was to
determine the diffusion coefficient of different
molecules, such as different proteins and a
polyelectrolyte, using a microfluidics chip (H-cell). The
determination of such parameters aims to understand
how the diffusion of these molecules is affected by the
conditions of the solution in which they’re solubilized.
The first trials (sodium chloride diffusion
measurement and protein attachment to the chip
surface) allowed to conclude that the microfluidics
channel predicted a diffusion coefficient with a 3.1%
deviation from previously reported data, which allowed
to conclude that the method was good for the prediction
of this parameter. It is also possible to conclude that
there is no significant loss of protein by attachment to
the glass surface of the H-cell, as a recovery of virtually
100% was obtained.
From the different protein trials, with the variation of
ionic strength, protein concentration, solvent’s viscosity
and different size of the proteins it is possible to
conclude that the diffusion coefficient varies with the
different solvent’s conditions or solute’s conditions
0
50
100
150
200
250
300
0 0.5 1 1.5 2
Retention Volume (ml)
0
50
100
150
200
250
300
0 0.5 1 1.5 2
Ab
so
rban
ce (
mA
U)
Retention Volume (ml)
0
50
100
150
200
250
300
0 0.5 1 1.5 2 2.5
Retention Volume (ml)
A B C
Figure 6 – Determination of the retention volumes of Ligand column (represented by the blue line) and Blocked Column (represented by the
red dashed line.), for lysozyme.. A represents the trials in water solution, B represents the trial in 10 mM Acetate Buffer solution and C represents
the trials in 10 mM Phosphate Buffer solution. The trials were performed at a controlled room temperature of 20ºC.

10
(when varying the molecular weight and using different
proteins, there’s a variation not only in the size of the
proteins but also in the intrinsic properties of these
proteins, such as pI values). It was noticeable that the
diffusion of proteins is affected by the ion/protein ratio
(in this study it was studied by means of increasing
concentration of protein), by the solution’s ionic strength
and viscosity and by the size of the diffusing proteins,
as the bigger proteins diffused slower than the smaller
proteins. For the Mw trials, it could be better to use the
same molecule (same protein or even use a
polyelectrolyte with different Mw’s). Using the same
protein, the trials could be conducted with a protein that
has monomers, dimers and trimers, after making sure
that in solution these dimers and trimers kept existing
avoiding the differences in intrinsic properties, as
previously mentioned.
The studies on the variation of diffusion of DSS with
its concentration in solution were inconclusive and
further studies need to be done in order to understand
how the medium influences its diffusion coefficient and
it is suggested that trials in very high ionic strength are
performed. With the presented data it is hard to
hypothesize on which interactions are predominant for
DSS diffusion, since the van der Waals interactions are
highly unlikely to be something other than attractive
[16]. It is, therefore, unknown what is happening in
solution and why there is an increase in the diffusion
coefficient of DSS for PB and the same trend is not
verified for AB.
We can conclude that there was a decrease in the
diffusion coefficient of lysozyme with the increase of the
ionic strength in a very small range of tested ionic
strength. With this, we can conclude that lysozyme has
electrostatic repulsive interactions (also proven with SIC
trials) with itself that are progressively reduced with the
increase of ionic strength, due to the shielding of the
surface charges of the proteins. It is important to have
a study on the ionic strength where the ionic strength is
solely controlled by the concentration of a strong
electrolyte (sodium chloride, for example). With the use
of a strong electrolyte, the slope presented in the study
can be better characterized and a comparison between
the ionic strength from buffers and the strong electrolyte
can be done.
Stokes-Einstein correlation still presents itself as a
good prediction equation. Although it has some flaws
regarding the accuracy of the prediction, it is very good
to understand the trend of the variation of the diffusion
coefficient with parameters like solvent’s viscosity,
temperature and solute’s size (in the form of the
hydrodynamic radius).
The device showed to be a reliable and high
throughput method for the determination of the diffusion
coefficient, whilst allowing to have a smaller sample and
time consumption when compared to other
determination methods. There is still some work to do
to add value to this method. An automation of the
sampling (with an autosampler, for example) could
make an effective use of the presented technology to
avoid human manipulation, reducing the risk of errors
and saving human power. The miniaturization of the
detection methods and the system pumps could elevate
this technology to an even higher standard. If the
detection methods could be small enough, we could
have a lab-on-a-chip, with the conjugation of the H-cell
and a suitable detection method.
5. Bibliography
[1] E. L. Cussler, Diffusion: mass transfer in fluid
systems., Cambridge university press, 2009.
[2] L. &. N. B. He, “A novel correlation for protein
diffusion coefficients based on molecular weight and radius of
gyration.,” Biotechnology progress, vol. 19, nº 2, pp. 544-548,
2003.
[3] A. D. Cadman, R. Fleming e R. H. Guy, “Diffusion of
lysozyme chloride in water and aqueous potassium chloride
solutions.,” Biophysical journal, vol. 37, nº 3, pp. 569-574,
1982.
[4] C. A. Haynes, K. Tamura, H. R. Korfer, H. W. Blanch
e J. M. Prausnitz, “Thermodynamic properties of aqueous.
alpha.-chymotrypsin solution from membrane osmometry
measurements,” The Journal of Physical Chemistry, vol. 96,
nº 2, pp. 905-912, 1992.
[5] L. L. Sorret, M. A. DeWinter, D. K. Schwartz e T. W.
Randolph, “Challenges in predicting protein-protein
interactions from measurements of molecular diffusivity,”
Biophysical journal, vol. 111, nº 9, pp. 1831-1842, 2016.

11
[6] M. van Leeuwen e et al, “Quantitative determination
of glucose transfer between cocurrent laminar water streams
in a H‐shaped microchannel,” Biotechnology progress, vol. 25,
nº 6, pp. 1826-1832, 2009.
[7] G. M. Whitesides, “The origins and the future of
microfluidics,” Nature, vol. 442, nº 7101, pp. 368-373, 2006.
[8] H. Mehrer e N. A. Stolwijk, “Heroes and highlights in
the history of diffusion.,” Diffusion Fundamentals, vol. 11, nº
1, pp. 1-32, 2009.
[9] S. F. Sun, Physical chemistry of macromolecules:
basic principles and issues., John Wiley & Sons., 2004.
[10] E. Häusler, P. Domagalski, M. Ottens e A. Bardow,
“Microfluidic diffusion measurements: The optimal H-cell.,”
Chemical engineering science, vol. 72, pp. 45-50, 2012.
[11] P. Burke, “Controlled release protein therapeutics:
Effects of process and formulation on stability,” em Handbook
of pharmaceutical controlled release technology, New York,
Wise DL, 2000, pp. 661-692.
[12] P. M. Tessier, S. D. Vandrey, B. W. Berger, R.
Pazhianur, S. I. Sandler e A. M. Lenhoff, “Self-interaction
chromatography: a novel screening method for rational
protein crystallization,” Acta Crystallographica Section D:
Biological Crystallography, vol. 58, nº 10, pp. 1531-1535,
2002.
[13] D. E. Kuehner, C. Heyer, C. Rämsch, U. M.
Fornefeld, H. W. Blanch e J. M. Prausnitz, “Interactions of
lysozyme in concentrated electrolyte solutions from dynamic
light-scattering measurements,” Biophysical journal, vol. 73,
nº 6, pp. 3211-3224, 1997.
[14] M. A. Blanco, T. Perevozchikova, V. Martorana, M.
Manno e C. J. Roberts, “Protein–protein interactions in dilute
to concentrated solutions: α-chymotrypsinogen in acidic
conditions,” The journal of physical chemistry. B, vol. 118, nº
22, p. 5817, 2014.
[15] A. Quigley, J. Y. Y. Heng, J. M. Liddell e D. R.
Williams, “The accurate measurement of second virial
coefficients using self-interaction chromatography:
Experimental considerations,” European Journal of
Pharmaceutics and Biopharmaceutics, vol. 85, nº 3, pp. 1103-
1111, 2013.
[16] J. N. Israelachvili, Intermolecular and surface forces,
3rd ed., Academic press, 2011.


![Polish-Israeli Conference on Electrospinning and Tissue ... · charges in the polymer solution and complex interactions of polyelectrolytes with solvent [1]. Moreover, the polarity](https://img.dokumen.tips/doc/110x75/5f056d147e708231d412e792/polish-israeli-conference-on-electrospinning-and-tissue-charges-in-the-polymer.jpg)