Embed Size (px)
Citation preview

Diffusion and Transformation of Climate Change Knowledge Through
Social Networks Kenneth A Frank & Tingqiao Chen
[email protected] [email protected] Michigan State University
GLISA
Presented at Ohio State Sea Grant ChangingClimate Webinar
1-16-2014

Movement of Climate Change Knowledge Through Social
Networks
• People learn about climate change from different places, from the events they attend to published works they read or author. And everyone, from climate scientists to the general public, receives and processes climate information differently. This presentation looks at the different ways in which climate information is relayed and how effective those pathways are.
• Specifically this webinar will explore: • How climate knowledge changes as it moves through different networks of people • What are the social structures through which knowledge diffuses
– How the change depends on the nature of the social structure through which it moves
• How roles people play in the transfer of information relate to where they are located in the social structure
• How opportunities for interaction are structured by institutional forces like online forums and large sponsors such as NOAA and the National Science Foundation

Outline of Talk • Recently Published Work (phase I)
– Networks of coauthors on climate documents in the Great lakes – Shape policy oriented behavior
• Current work (phase II) – Networks of mediators between physical science and
stakeholders/end-users – Participation
• On-line structure • Events: Biweekly NOAA meetings, webinars, documents, etc.
– Different social structures different diffusions and transformations • How does this affect exposure of end-user? (phase III).

Phase I
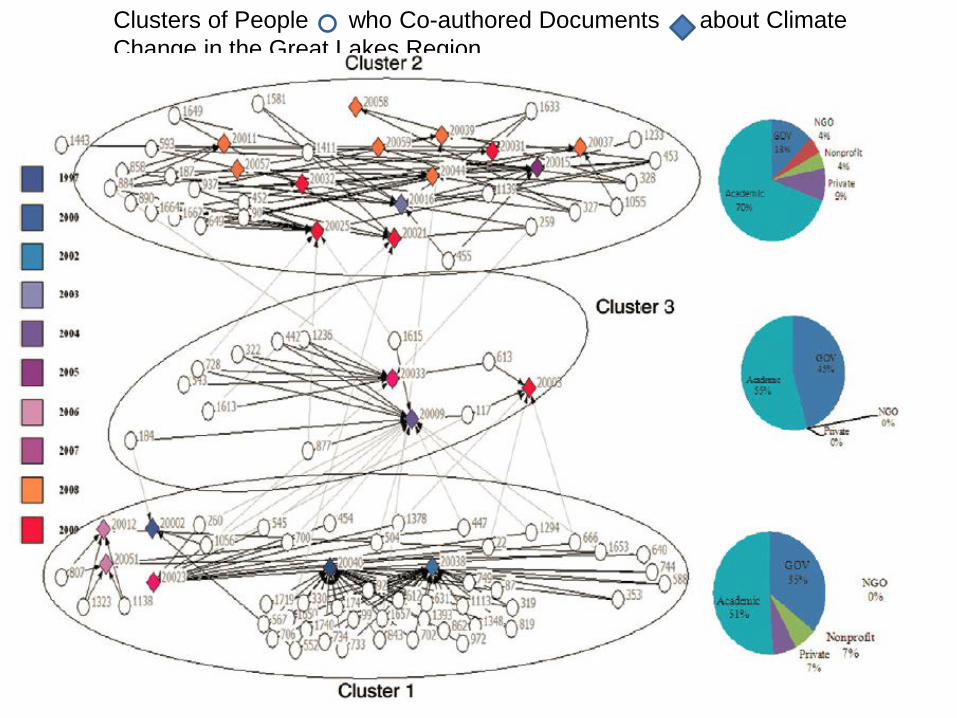
Clusters of People who Co-authored Documents about Climate Change in the Great Lakes Region

Technical Appendix: Documents by Cluster •Cluster 1
–20040: Preparing for a Changing Climate: The Potential Consequences of Climate Variability and Change in the Great Lakes Region –20002:Adapting to Climate Change and Variability in the Great Lakes-St. Lawrence Basin • 20038:Preface to the Potential Impacts of Climate Change in the Great Lakes Region •20023: From Impacts to Adaptation: Canada in a Changing Climate 2007
•Cluster 2 •20015:Confronting Climate Change in the Great Lakes Region: Impacts on Our Communities and Ecosystems •20016:Confronting Climate Change in the Great Lakes Region •20011: Climate Change in the Great Lakes Region: Starting a Public Discussion •20021: Ecological Impacts of Climate Change •20025: Global Climate Change Impacts in the US: A State of Knowledge Report from the U.S. Global Change Research Program •20031: Informing Decisions in a Changing Climate: Panel on Strategies and Methods for Climate-Related Decision Support •20032: Introduction: Assessing the effects of climate change on Chicago and the Great Lakes •20037: Potential Impacts of Climate Change on U.S. Transportation •20039: Chicago Climate Action Plan •20044: Scientific Assessment of the Effects of Global Climate on the United States •20059: Economic Impacts of Climate Change on Pennsylvania
•Cluster 3 •20009: Climate Change Impacts and Adaptation: A Canadian Perspective •20003: Adapting to Climate Change in Ontario: Towards the Design and Implementation of a Strategy and
Action Plan (Report of the Expert Panel on Climate Change Adaptation) •20033: IPCC 4th Assessment Report, Working Group II Report "Impacts, Adaptation and Vulnerability" North America, Chapter 14 :

Interpretation
• 3 positions (or clusters) • Statistically significant (rejecting null of no
clustering) – Not really causal inference
• Each group a mixture of – academic and government
• Define bridging role relative to clusters • Relate bridging role to outcomes
– Policy advocacy and activism

Measures of Policy Oriented Behaviors • Political Advocacy: Extent to which an actor engages in activities with an intention to
influence policy and behavior. – participation in meetings, – media campaigns regarding climate change issues, – participating in conferences and workshops that engage decision-makers, – participating in interviews, press conferences, writing articles or blogs to increase
awareness of climate change and advocate climate change-related action.
• Policy advising: Attendance at policy-related or governmental meetings, in the role of directly informing policies or plans (e.g. contributing solutions, participating in policy design) with research about climate change and expert knowledge.
• Scale for Both: 0 to 4 (5 scales). – 0: no evidence that the actor was involved in policy advocacy activity – 1): the actor’s reports or publications were aimed at being policy-relevant (i.e. expressed
the intention or claim that the document could inform policy) – 2: actor’s activities were related to policy advocacy, but it was not their primary activity – 3: policy advocacy was a primary activity they were given score of at least 3. – 4: consistently involved in policy advocacy over time

Bridgers more Engaged in Policy Advocacy and Advising
Those who bridge between clusters of actors were more involved in policy advocacy than others in their social system
Bridgers more likely to be engaged in political advising • 2.15 for bridgers versus .7 for others (on our scale from 0 to 4). (p <
.0001). – Controlling for differences among groups and sector, the bridgers were
more likely to be policy advocates • estimated difference of 1.56, standard error of .34, p < .0001.
Those who bridge between clusters of actors were more involved in policy advising than others in their social system.
3.6 for bridger’s versus 2.4 for others (scale of 0-4; p < .002).
– Controlling for differences among clusters and sector • difference of 1.30 (standard error of 0.34, p < 0.001).
• Key: Inferences might be wrong, but what would it take to be wrong? – Comparable to inference about C02 on temperature
• Not that sensitive to tentatively placed actors

Qualitative: The Constraint for the Non-bridger
Actor 374 (Insular) In the last ten years or so it’s become obvious that we need to
engage more with other groups, especially scientists. Our organization especially was too insular ten years ago. The issue of climate change has been one of the drivers of realizing that and making an effort to change it.
Structural constraint makes it difficult to bridge Actors don’t really know effect of social structure on behavior: “I can’t really tell you what interactions have pushed future
involvement and what haven’t.”

Policy implications
• Change agents – create venues which affect which social structures
can emerge – Can influence participation/attendance venues
• Enhanced serendipity – Always changing – Find gaps and support – Encourage people to pursue own links

Knowledge Flows from Climate Scientists to Practice Preliminary Findings (Phase II)
• Questions: – How is knowledge about climate change transformed as it diffuses through
the social structure? – What are the social structures through which knowledge diffuses? – How do social structures shape the flow of knowledge? – How do the roles different people play in the diffusion of knowledge relate to
their location in the social structure? – How are opportunities for interaction structured by institutional forces?
• Context – Scientists, translators/mediators and practitioners in the Great Lakes – Current focus:
• changes in lake levels (recent diffusion) • frequency and duration of freeze-thaw cycles (currently diffusing –
baseline)
Preliminary Findings Q1: How is knowledge transformed as it diffuses through the
social structure?
• Preliminary: Interviews • Knowledge transformed as it “diffuses” from
scientists to practice – Disconnected from language and models of
climate change • Code switching
– End users may not know knowledge to be associated with climate change
– Localized: “your river will look like this …”

Preliminary Findings Q2: What are the social structures through which knowledge
diffuses? • WICCI social structure of distributed learning
through web based user groups. • vs fabric woven by small conferences and NOAA
sponsored events in which those based in Michigan and Ohio are more likely to participate.
• But we do not know how the context in which mediators are exposed to new knowledge affects their own understandings and the language they use to disseminate (survey at end).
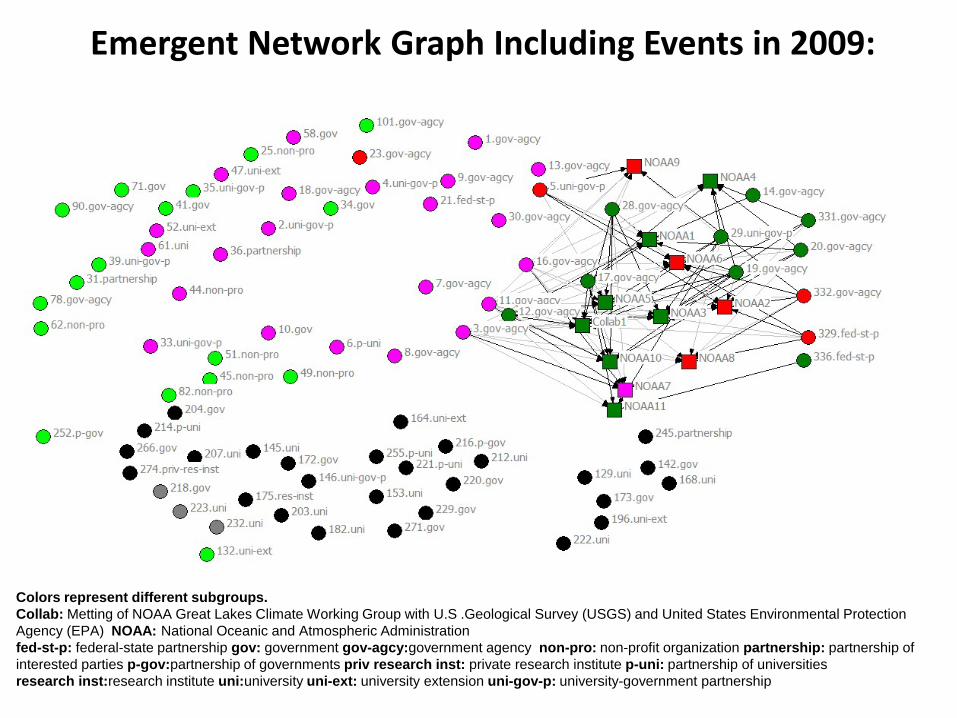
Emergent Network Graph Including Events in 2009:
Colors represent different subgroups. Collab: Metting of NOAA Great Lakes Climate Working Group with U.S .Geological Survey (USGS) and United States Environmental Protection Agency (EPA) NOAA: National Oceanic and Atmospheric Administration fed-st-p: federal-state partnership gov: government gov-agcy:government agency non-pro: non-profit organization partnership: partnership of interested parties p-gov:partnership of governments priv research inst: private research institute p-uni: partnership of universities research inst:research institute uni:university uni-ext: university extension uni-gov-p: university-government partnership

2009 & 2010
Colors represent different subgroups. Collab: Metting of NOAA Great Lakes Climate Working Group with U.S .Geological Survey (USGS) and United States Environmental Protection Agency (EPA) NOAA: National Oceanic and Atmospheric Administration Adpt: Great Lakes Cities Climate Adaptation Integrated Assessment Meeting fed-st-p: federal-state partnership gov: government gov-agcy:government agency non-pro: non-profit organization partnership: partnership of interested parties p-gov:partnership of governments priv research inst: private research institute p-uni: partnership of universities research inst:research institute uni:university uni-ext: university extension uni-gov-p: university-government partnership

2009-2011
Colors represent different subgroups. Collab: Metting of NOAA Great Lakes Climate Working Group with U.S .Geological Survey (USGS) and United States Environmental Protection Agency (EPA) NOAA: National Oceanic and Atmospheric Administration Adpt: Great Lakes Cities Climate Adaptation Integrated Assessment Meeting GLISA: Great Lakes Integrated Sciences and Assessments Center Meeting GLRICG: Great Lakes Restoration Initiative Coordination Group fed-st-p: federal-state partnership gov: government gov-agcy:government agency non-pro: non-profit organization partnership: partnership of interested parties p-gov:partnership of governments priv research inst: private research institute p-uni: partnership of universities research inst:research institute uni:university uni-ext: university extension uni-gov-p: university-government partnership

2009-2012
Colors represent different subgroups. Collab: Metting of NOAA Great Lakes Climate Working Group with U.S .Geological Survey (USGS) and United States Environmental Protection Agency (EPA) NOAA: National Oceanic and Atmospheric Administration Adpt: Great Lakes Cities Climate Adaptation Integrated Assessment Meeting GLISA: Great Lakes Integrated Sciences and Assessments Center Meeting GLRICG: Great Lakes Restoration Initiative Coordination Group MWCG: Midwest Climate Group UMGLLC: Upper Midwest and Great Lakes Landscape Conservation Cooperative Steering Committee fed-st-p: federal-state partnership gov: government gov-agcy:government agency non-pro: non-profit organization partnership: partnership of interested parties p-gov:partnership of governments priv research inst: private research institute p-uni: partnership of universities research inst:research institute uni:university uni-ext: university extension uni-gov-p: university-government partnership

Preliminary Findings Q3: How do social structures shape the flow of knowledge?
• Hypotheses:
– WICCI structure: • More direct access to original sources • Less repeated exposures • Less chance of exposure to knowledge outside regular access points • Sensemaking within WICCI groups and formal events
– Emergent network through events: • Filtered access to original sources • Redundant exposures • More serendipitous exposures • Sensemaking through informal networks that emerge between formal
events • Think Ecosystem: efficiency vs redundancy
– WICCI more efficient – Emergent network more resilient
• Speculation!

Q4: How do the roles different people play in the diffusion of knowledge relate to their location in the social structure?
• Do those who bridge within the social structure play more active roles in diffusing knowledge to the general public – More opportunities – More versatile language – Personality type
• Mirrors hypotheses for authors of climate documents in the Great Lakes
• Must wait for phase III of research, link to end-users and stakeholders

Preliminary Findings Q5: How are opportunities for interaction structured by institutional forces?
GLISA
WICCI

Interpretation
• WICCI sub-system discernible from others • Some overlap • Implications for language, ideas? • Again, we won’t know until we survey what
people know and who they talk to

What we are Learning within Phase II
• Knowledge is transformed as it diffuses • Knowledge diffuses through different types of
social structures – Can shape how knowledge changes & flows
(ecosystem) – Opportunities to participate in diffusion
• Structures shaped by institutional forces

What We Learned across Phases I and II • Look at network structure
– Collect data on • exposure (2 mode: people and events)
– Cheap, identify network boundary, leverage points • direct ties (1 mode)
– Conveys deep or sticky knowledge (Hansen 1999) – Look for clustering
• Interactions within clusters – Generate new knowledge – Learn to articulate knowledge – Synthesize elements
• Bridgers as key – Political involvement – Diffusion

Practical Implications • Understand the ecology that produced the
information to which you are exposed – Clusters and bridging – Constantly changing, dynamic
• Diffusion could have followed different trajectories, been transformed in multiple ways
• Get information from multiple sources, seek to access information outside your regular network.

Next steps in Phase II
• Currently: completed interviews of 10 members of network – different positions and networks – See protocol at end of ppt – Analyze relative to social position
• Administer and analyze short survey (Glisa conference, WICCI, etc) – Knowledge about lake levels, freeze-thaw cycles – Social networks and information courses
• Teaming with Maria Lemos and Scott Kalafatis to study documents – Artifacts of social interaction – Characterizes information
• Coordinating with other RISAs, NCA
Future Work in Phase III
• Interview stakeholders • Snowball sample survey coauthors to identify
broader range of stakeholders • Extend to other projects (RISAs) • Link to document content (see Scott Kalafatis‘
work)

Conversation
• Where do you get information from about – Climate change? – Lake levels in the Great Lakes? – Freeze-thaw cycles in the Great Lakes?
• Do you get information from multiple sources? How does it vary by source?
• Are we missing a key aspect of the knowledge flow?

Please Complete the 5 Minute Survey on State of Knowledge
• Survey concerns state of knowledge about lake levels and freeze-thaw cycles in the Great Lakes
• It is OK if you do not have strong opinions (we hope to follow up and track changes)
• https://msucoe.qualtrics.com/SE/?SID=SV_2c57vhPvoED2LiJ

Instruments
• Survey • Interview protocol


Longer version: network questions:

Protocol for Interviewing about Climate Change Diffusion Ken Frank & Tingqiao Chen

End Here

THE EVOLUTION OF POLICY-BASED CLIMATE KNOWLEDGE NETWORKS IN THE GL REGION
Scott Kalafatis, Yun-JIa Lo, Maria Carmen Lemos and Ken Frank University of Michigan and Michigan State University


How was consensus Achieved?

Who Bridges?
• Canadians • Former & current scientists


How does Scientific Knowledge Inform Policy?
• It does • As key academics engage in political advocacy
– Yes, but not the earliest researchers – People who changed disposition
• As academics participate in policy-making decisions – Yes, but different from those who engage in advocacy
• Through designated mediators between academics and policy-makers? Yes, but – mediators are themselves scientists – Natural and social science – Members of NGO’s

Does Scientific Knowledge (or expression thereof) Change as it Informs Policy?
Analysis of the Documents • How do networks among stakeholders
regarding climate change in the Great Lakes Region change over time?
• Different clusters emerged at different points in time. – Once group 1 emerged, fossilized

Interpretation • Early documents (97-01): group 1 (neither policy involved nor politically active).
– more academics – Many not involved in later documents
• Mid range (2002-2005) – Each group forms, little bridging
• Later (2006-2009) – Group 2 (policy involved) more full developed – Bridging documents
• 20033: IPCC 4th Assessment Report, Working Group II Report "Impacts, Adaptation and Vulnerability" North America, Chapter 14 :
• 20023: From Impacts to Adaptation: Canada in a Changing Climate 2007 • 20021: Ecological Impacts of Climate Change • 20025: Global Climate Change Impacts in the US: A State of Knowledge Report from the U.S.
Global Change Research Program – Early academics in group 1 not involved in later documents – Advocacy emerges with bridging documents?
• Gwen Arnold (Friday), – large permeable network to adopt (group 1). – Smaller, less permeable to implement (group 2). – Group 3 bridges

Document Content over Time Changing Expressions of Knowledge
1997-2005 • Mitigating climate change
– Reducing emissions of CO2 – Reducing other green house
gases (methane) – Increasing forest production
• Gradual change – Air temperature – Water temperature – CO2 levels
• Individual systems – Water, land, health, animals
• Linear effects • Uniform Effects
2006-2009 • Adapting to climate change
– Changing planting seasons – Erosion protection – Disaster relief
• Extreme Events – Hurricanes – Tornadoes – Extreme heat – Extreme precipitation
• Integrated Systems • Non-linear
– Threshold, cascading • Nuanced and Variable Effects • Regionalized (but not local)

Process for coding • Based on web pages
– biographies – published documents
• 20 actors coded by two raters. • Policy advising, 95% of the scores were in agreement within
one unit (e.g., scores of 3 and 4 involvement were within one unit and therefore considered to agree). – All others rated by only 1 person
• Policy advocacy, 45% were in agreement – primarily due to differences in identification of relevant
information on web pages (85% were within 2 units). – Average of 2 raters’ scores for all actors

Example of coding (actor 259) • Interviewer: Now, we have reports coming out, scientists around the world warning that the
impact of these higher temperatures could be devastating for humankind. But yet, you know, we still see people driving their SUVs, CO2 levels -- very high levels, of course, around the world. What needs to be done to change minds, in your opinion as a scientist? Actor 259: I think it's important that people connect the evidence we're seeing with their own actions. Examples like in the very hot summer in Europe in 2005, there were over 30,000 extra deaths due to the extra warming. People need to understand that that's the kind of phenomenon that we're going to see more and more as the earth's temperature continues to warm.
• • response focused on the link between scientific knowledge and human behavior, and then he
emphasized the scientific forecast. In this sense he was playing an advocate role – Advocacy score of 4
• nvolved in many national and international committees related to global ecology and climate change including the IPCC, whose goal is to inform UNFCC governments about climate change. He also participated in the writing of a policy document such as the Chicago Climate Action Plan.
– Involved score of 4

The Changing Representations of Knowledge
1997-2005 • Best point estimate or
range estimates
2006-2009 • Risk management
– “very likely” (Global Climate Change impacts in the US)
– “very high confidence” (IPCC)

200040: Preparing for a Changing Climate: The Potential Consequences of Climate Variability and Change in the Great Lakes Region (published in 2000)
Water Resources (page 2) In the current assessment, output from the
CGCM1 model suggests that the evolution of a long-term trend toward lower Great Lakes levels may reach magnitudes of approximately a 1.5 to 3 feet drop on the various lakes within a time frame of about 3 decades. Output from the HadCM2 model suggests no change to a slight increase in lake levels.
Ice cover will also likely decrease – both in terms
of days with ice cover and thickness of ice. Water regulation strategies should be developed that are robust enough for either high or low water levels.
Water regulation models need to be developed
to deal with some of the lake level changes that are anticipated from climate change.
No language of certainty/confidence Description of gradual change over time Linear trend Water taken as separate from other systems
Some call for action and better models

20009: Climate Change Impacts and Adaptation: A Canadian Perspective (2004) • Such problems [with water such as drought] are
expected to become more common as a result of climate change. There are still uncertainties, however, regarding the magnitude, and in some cases the direction, of future changes, in part due to the limitations of climate models.
• Although impacts would vary on a regional basis, it is apparent that certain aspects, including extreme events, reduced ice cover and shifts in flow regimes, are concerns in many areas of the country.
• Overall, the most vulnerable regions would be those already under water stress, such as parts of the Prairies and the Okanagan Valley, where demand is already approaching or exceeding supply.
• In many regions, decreases in flow volumes and water levels are expected to create or increase water supply problems during the summer months. In Prairie rivers, for example, summer flows are expected to decrease due to reduced water supply from snowmelt and glacier runoff.
• Water supply issues are also expected to become a greater concern in the Great Lakes basin, where a range of sectors would be affected by declining water levels (Figure 2).
Short reference to extreme events
Rough language of uncertainty
Some reference to variable effects

200033: IPCC 4th Assessment Report, Working Group II Report "Impacts, Adaptation and Vulnerability" North America, Chapter 14 (published in 2007, page 619 executive summary)
• North America has experienced locally severe economic damage, plus substantial ecosystem, social and cultural disruption from recent weather-related extremes, including hurricanes, other severe storms, floods, droughts, heatwaves and wildfires (very high confidence).
• The vulnerability of North America depends on the effectiveness and timing of adaptation and the distribution of coping capacity, which vary spatially and among sectors (very high confidence).
• Climate change will constrain North America’s over-allocated water resources, increasing competition among agricultural, municipal, industrial and ecological uses (very high confidence).
• Climate change impacts on infrastructure and human health and safety in urban centres will be compounded by ageing infrastructure, maladapted urban form and building stock, urban heat islands, air pollution, population growth and an ageing population (very high confidence).
• Without increased investments in countermeasures, hot temperatures and extreme weather are likely to cause increased adverse health impacts fromheat-relatedmortality, pollution, storm-related fatalities and injuries, and infectious diseases (very high confidence).
• Disturbances such as wildfire and insect outbreaks are increasing and are likely to intensify in a warmer future with drier soils and longer growing seasons (very high confidence).
Expressed level of confidence
Variable vulnerability
Interaction among systems
Attention to extreme conditions

(200044) Scientific Assessment of the Effects of Global Climate on the United States (2008, page 2)
Language of uncertainty
Synergistic, interactive effects
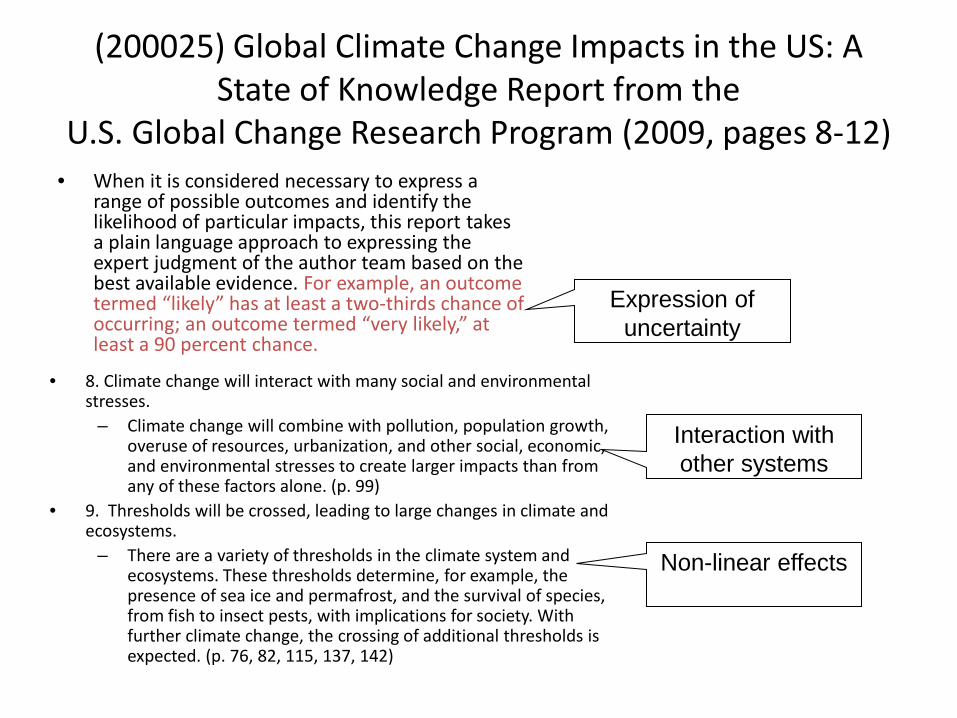
(200025) Global Climate Change Impacts in the US: A State of Knowledge Report from the
U.S. Global Change Research Program (2009, pages 8-12) • When it is considered necessary to express a
range of possible outcomes and identify the likelihood of particular impacts, this report takes a plain language approach to expressing the expert judgment of the author team based on the best available evidence. For example, an outcome termed “likely” has at least a two-thirds chance of occurring; an outcome termed “very likely,” at least a 90 percent chance.
Expression of uncertainty
• 8. Climate change will interact with many social and environmental stresses.
– Climate change will combine with pollution, population growth, overuse of resources, urbanization, and other social, economic, and environmental stresses to create larger impacts than from any of these factors alone. (p. 99)
• 9. Thresholds will be crossed, leading to large changes in climate and ecosystems.
– There are a variety of thresholds in the climate system and ecosystems. These thresholds determine, for example, the presence of sea ice and permafrost, and the survival of species, from fish to insect pests, with implications for society. With further climate change, the crossing of additional thresholds is expected. (p. 76, 82, 115, 137, 142)
Non-linear effects
Interaction with other systems

Two-mode: Who wrote the newer documents and why?
• Group 2 (High involvers) + group 3 (high advocates, increased advocates) wrote documents with
– Adapting to climate change – Extreme Events – Integrated Systems – Non-linear – Nuanced and Variable Effects
• Why? – Dealing with public policy – But why more nuanced language?
• Resolving Internal conflict? (John P.) – More sophisticated representation?
• Preserving scientific identity – More complicated makes scientists necessary?
• Complexity emphasizes local decision-making (e.g., Chicago) – Examine links between local decision makers and authors of broader documents (Lee
Taedong) – Challenges in predicting localized implications

2
3
1
Increased Involvement 20002009

2
3
1
Increased Advocacy 20002009

Two-mode: Who wrote the newer documents and why?
• Group 2 (High involvers) + group 3 (high advocates, increased advocates) wrote documents with
– Adapting to climate change – Extreme Events – Integrated Systems – Non-linear – Nuanced and Variable Effects
• Why? – Dealing with public policy – But why more nuanced language?
• Resolving Internal conflict? (John P.) – More sophisticated representation?
• Preserving scientific identity – More complicated makes scientists necessary?
• Complexity emphasizes local decision-making (e.g., Chicago) – Examine links between local decision makers and authors of broader documents (Lee
Taedong) – Challenges in predicting localized implications

• Data: People (mode 1) and the documents they produced (mode 2) • Motivation: Common co-authorship
• potential for knowledge (and normative) flows • Exposure to one another • Exposure to document (or conference) organizer • Exposure to content of document
• Documents as written artifacts of • knowledge state • Political stance • Rhetorical style
• Writing of documents can be convened/encouraged by change agents • Leverage for altering network and policy
• Data publicly accessible
Coauthored Documents: Two Mode Network Data
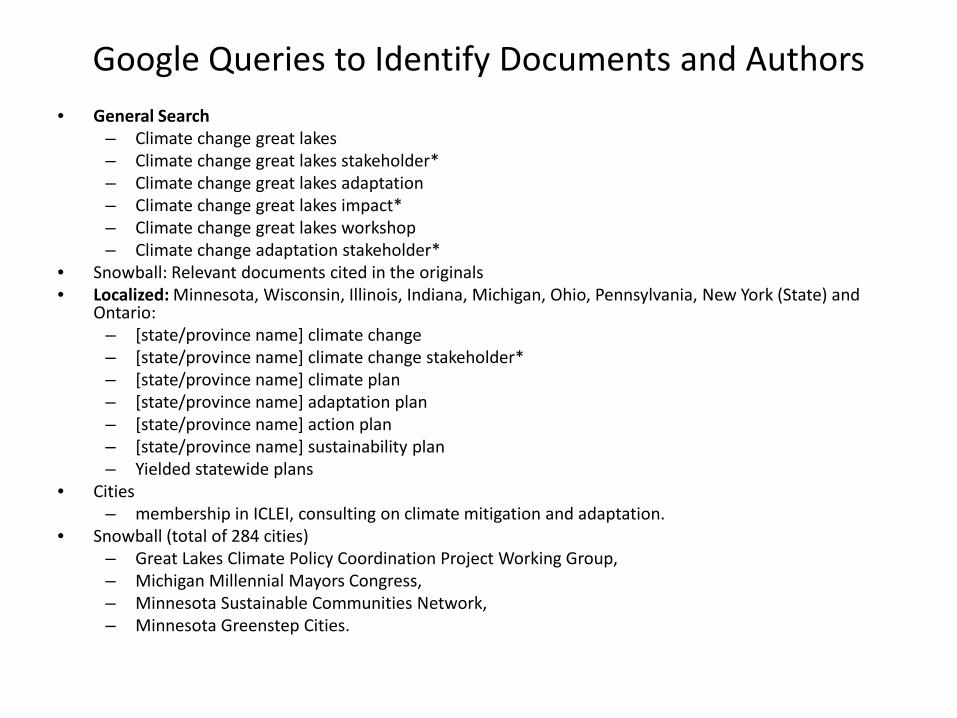
Google Queries to Identify Documents and Authors • General Search
– Climate change great lakes – Climate change great lakes stakeholder* – Climate change great lakes adaptation – Climate change great lakes impact* – Climate change great lakes workshop – Climate change adaptation stakeholder*
• Snowball: Relevant documents cited in the originals • Localized: Minnesota, Wisconsin, Illinois, Indiana, Michigan, Ohio, Pennsylvania, New York (State) and
Ontario: – [state/province name] climate change – [state/province name] climate change stakeholder* – [state/province name] climate plan – [state/province name] adaptation plan – [state/province name] action plan – [state/province name] sustainability plan – Yielded statewide plans
• Cities – membership in ICLEI, consulting on climate mitigation and adaptation.
• Snowball (total of 284 cities) – Great Lakes Climate Policy Coordination Project Working Group, – Michigan Millennial Mayors Congress, – Minnesota Sustainable Communities Network, – Minnesota Greenstep Cities.

Example Data: Co-authorship on Documents related to Climate Change in the Great Lakes
Data link all who were named to this document
IPCC 4th Assessment Report, Working Group II Report "Impacts, Adaptation and Vulnerability" North America, Chapter 14
Document 200033

Boundaries Issues Water Agriculture Tourism Adaptation
Time: 1997 to 2009 Documents featured stakeholder involvement and
perspectives Governmental Agencies Academic organizations (Universities or Colleges; research centers ) Nonprofit or Nongovernmental Organizations Private Companies or Research Institutes

Great Lakes Region

Bridging (x)
Inclination towards policy
Policy advising and advocacy
Impact of a confound must be greater than .29 to invalidate inference. Each correlation must be greater than .54 (assuming correlations equal to maximize impact)
Impact of Unmeasured Confound Necessary to
Invalidate Inference of Bridging Effect on Policy Behavior
rx cv
ry cv rx cvX ry cv

What Must be the Impact of an Unmeasured Confounding variable
invalidate the Inference?
Step 1: Establish Correlation Between BCT and Help Provided, partialling for all covariates
Step 2: Define a Threshold for Inference Can be, but does not have to be statistical
significance Step 3: Calculate the Threshold for the Impact
Necessary to Invalidate the Inference Step 4: Multivariate Extension, with other
Covariates

Step 1: Establish Correlation Between BCT and Help Provided, partialling for
all covariates
2 2
t 4.39r .447(n q 1) t (79 2 1) 4.39
xy = = =− − + − − +
t taken from regression, =6.22 n is the sample size=1208 q is the number of parameters estimated (2 including confound)

Step 2: Define a Threshold for Inference
• Define r# as the value of r that is just statistically significant:
# critical2critical
tr(n q 1) t
=− − +
n is the sample size q is the number of parameters estimated tcritical is the critical value of the t-distribution for making an inference
#
2
1.99 .223(79 2 1) 1.99
r = =− − +
r# can also be defined in terms of effect sizes
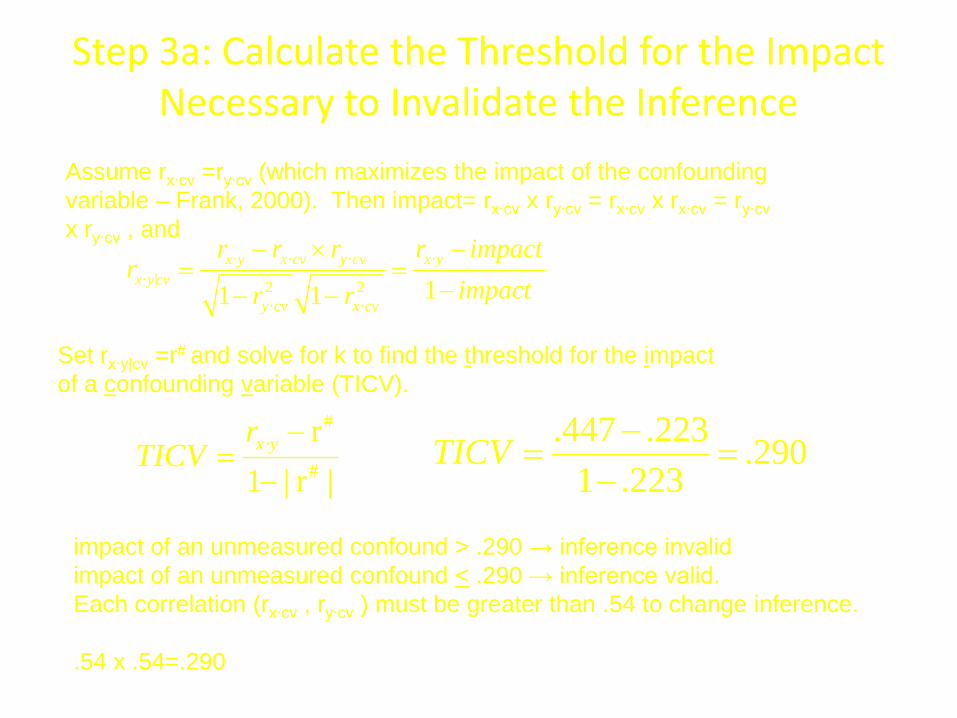
Step 3a: Calculate the Threshold for the Impact Necessary to Invalidate the Inference
#·
#
r1 | r |
x yrTICV
−=
−
Set rx∙y|cv =r# and solve for k to find the threshold for the impact of a confounding variable (TICV).
.447 .223 .2901 .223
TICV −= =
−
· · · ·· | 2 2
· ·11 1
x y x cv y cv x yx ycv
y cv x cv
r r r r impactr
impactr r
− × −= =
−− −
Assume rx∙cv =ry∙cv (which maximizes the impact of the confounding variable – Frank, 2000). Then impact= rx∙cv x ry∙cv = rx∙cv x rx∙cv = ry∙cv x ry∙cv , and
impact of an unmeasured confound > .290 → inference invalid impact of an unmeasured confound < .290 → inference valid. Each correlation (rx∙cv , ry∙cv ) must be greater than .54 to change inference. .54 x .54=.290

Calculations made easy!
• http://www.msu.edu/~kenfrank/papers/calculating%20indices%203.xls
User enters: critical value of t, sample size, and observed t-ratio
Spreadsheet calculates impact threshold Component correlations
impact of an unmeasured confound > .289 → inference invalid impact of an unmeasured confound < .289 → inference valid. Each correlation (rx∙cv , ry∙cv ) must be greater than .54 to change inference.

Commentary on Inference • Large “impact of confound” required to invalidate inference • Stronger than inference regarding relationship between CO2 and
temperature. – Although this included lagged variables (key)
• Inference sustained (but not as strong) if bridging not defined by “From Impacts to Adaptation” (document 20023)
• Alternative: – Estimated effect of r=.44 is twice as large as threshold for statistical
significance r=.22 (used as a threshold for causal inference) – to invalidate the inference, 50% of the data would have to be
replaced with counterfactual cases in which there was no effect of bridging on policy involvement (Frank et al, forthcoming)
• Qualitative

CO2
Omitted Confound
Temperature (y)
Impact of a confound must be greater than .04 to invalidate inference. Each correlation must be greater than .22 (assuming correlations equal)
Impact of Unmeasured Confound to Invalidate Inference of
CO2 Effect on Temperature

Calculations for CO2 • TunnicliffeWilson, Granville. 2010. “Atmospheric CO2 and Global Temperatures:
The Strength and Nature • of Their Dependence.” Public Presentation: NBER—NSF Time Series Conference.
Duke University.

1997
2000
2002
2003
2004
2005
2006
2007
2008
2009
Clusters of People who Co-authored Documents about Climate Change in the Great Lakes Region

• Internal Validity: • Wish we had longitudinal data
• Control for prior tendency for policy behavior • Difficult to measure – lag between participation and in documents
• Subjective interpretation based on the network pictures • External validity
• Narrow range of documents • Focus on Great Lakes region • Apply to other scientific issues (health or education)
• Mechanism • Do not understand individual sensemaking
Limitations