Embed Size (px)
Citation preview

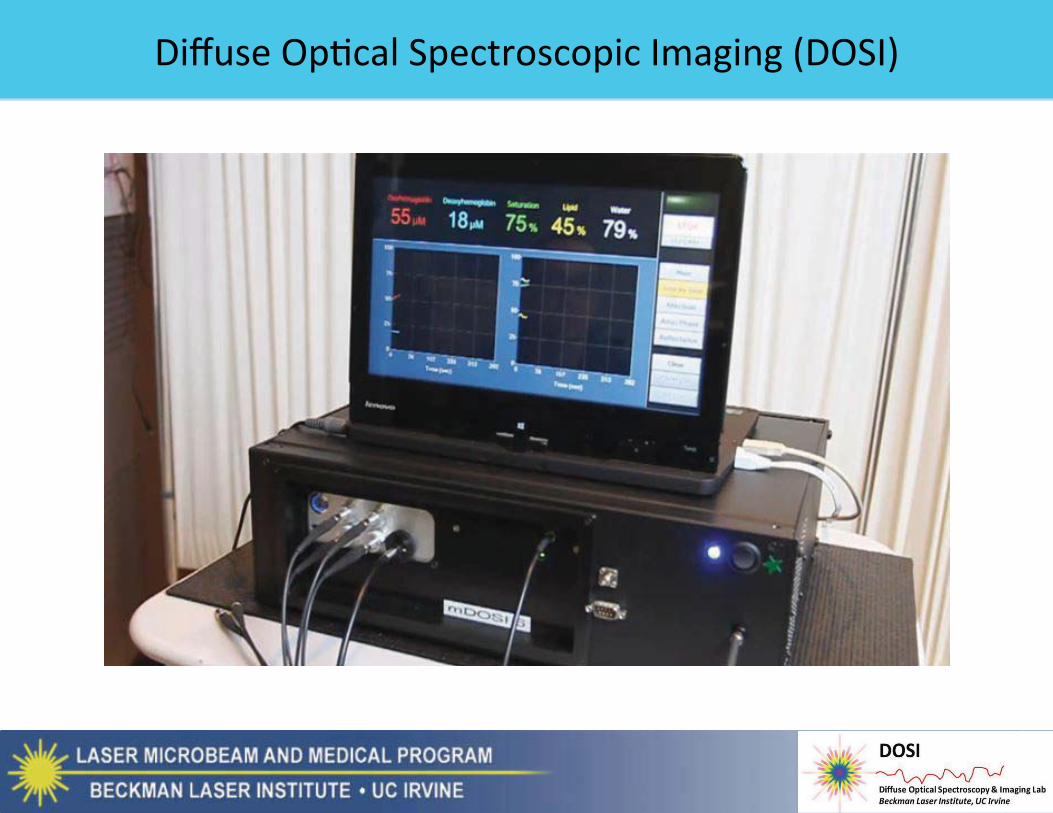
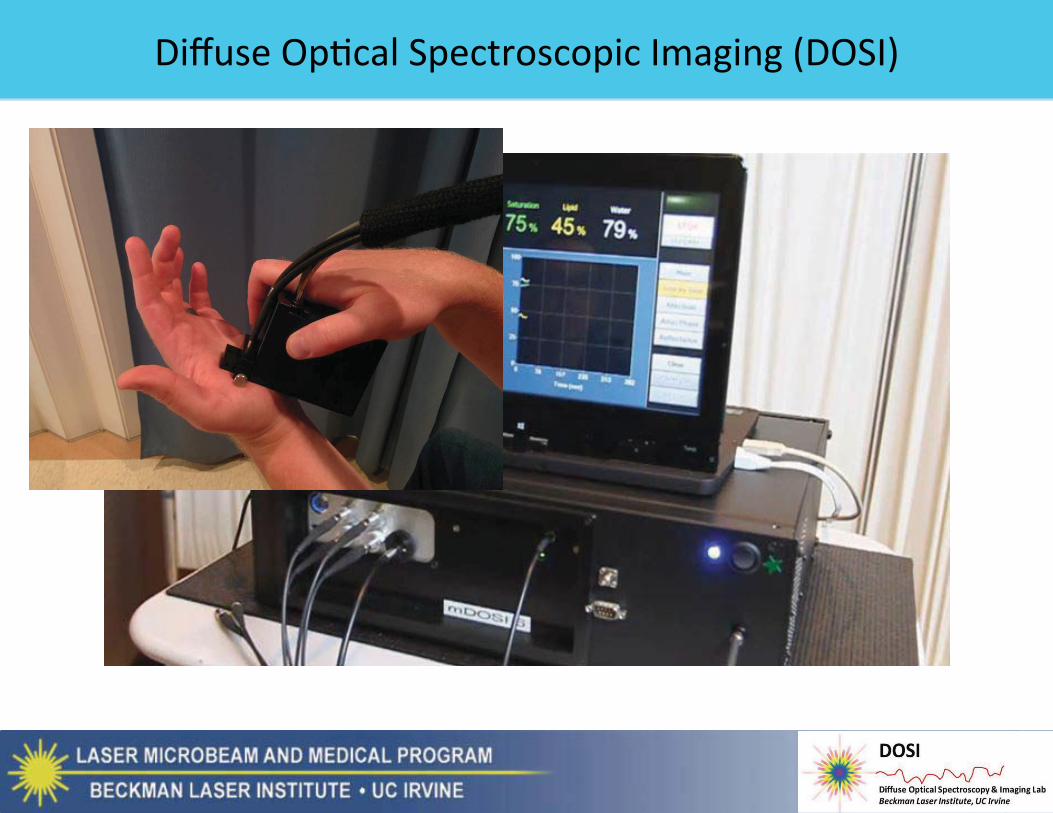
Diffuse Optical Spectroscopy and Imaging
Laser Microbeam and Medical Program (LAMMP) Beckman Laser Institute and Medical Clinic
Departments of Biomedical Engineering and Surgery
University of California, Irvine http://www.bli.uci.edu
Bruce J. Tromberg BLI
Computational Biophotonics Workshop: August 2016
Disclosure
Co-founder: Industry Collaboration:

Medical Imaging
MR, X-ray, Nuclear, US (Optical)
Mainstream Modalities
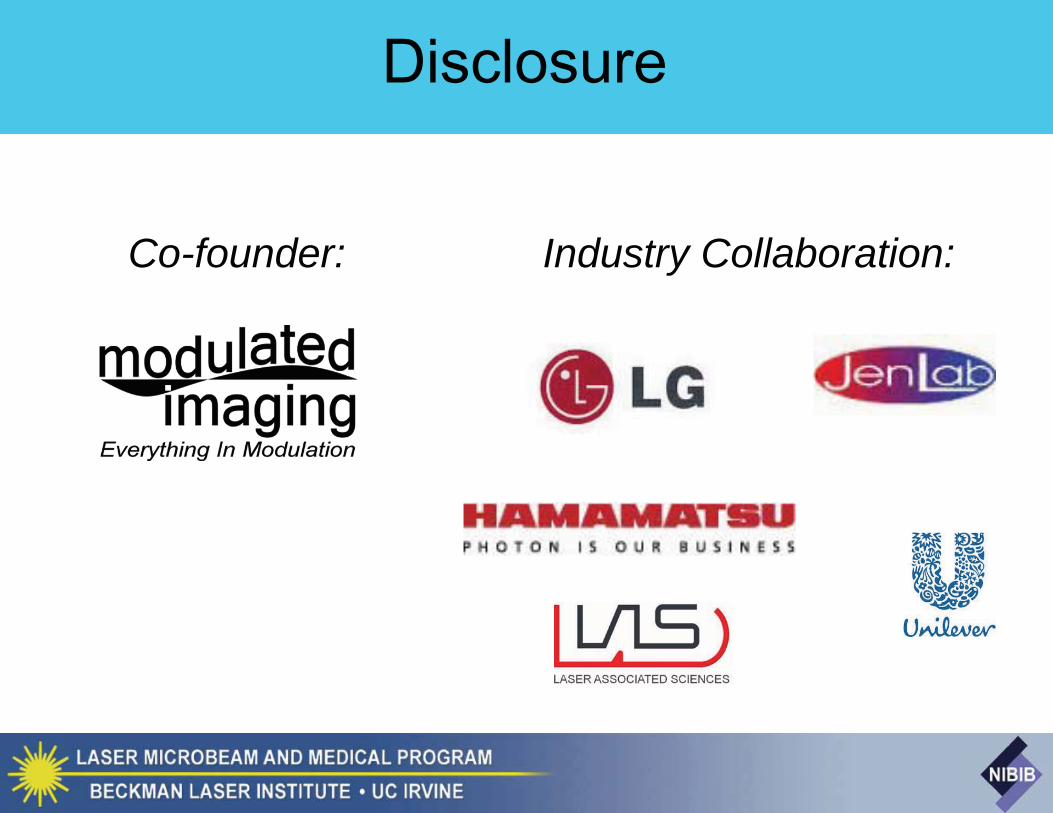
Where Does Biophotonics Fit In?
Masimo Pronto
Medtronic-Covidien Invos
DiagnosticsImaging/spectroscopy
NOVADAQ Pinpoint
Heidelberg Engineering Spectralis
Perimed Periscan Pentax Endoscope
Syneron-Candela, Lumenis, Alma, Cutera, Cynosure, Fotona, Lutronic, etc
AMO Intralase FS
TherapeuticsMedical Lasers
Vioptix Odissey
>$60B/yr
St. Jude C7-XR
Masimo Pronto
edtronic-Me Covidien Invos
Vioptix Odisseey
XR

Diffuse Optics • Multi-Spectral (NIR) • Structured Light: Space and Time• Optical Pathlength Control
Multiple Light Scattering
850 nm NIR LEDs
O'Sullivan TD, et al. J Biomed Opt.17(7):071311 (2012).
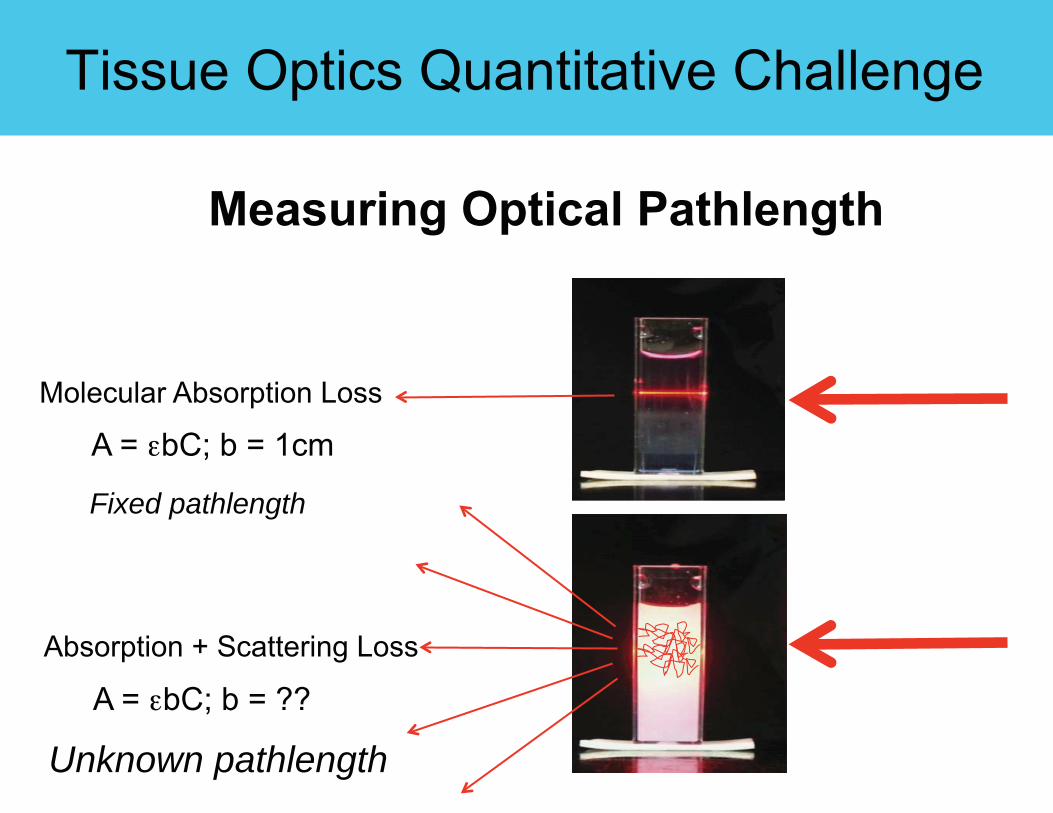
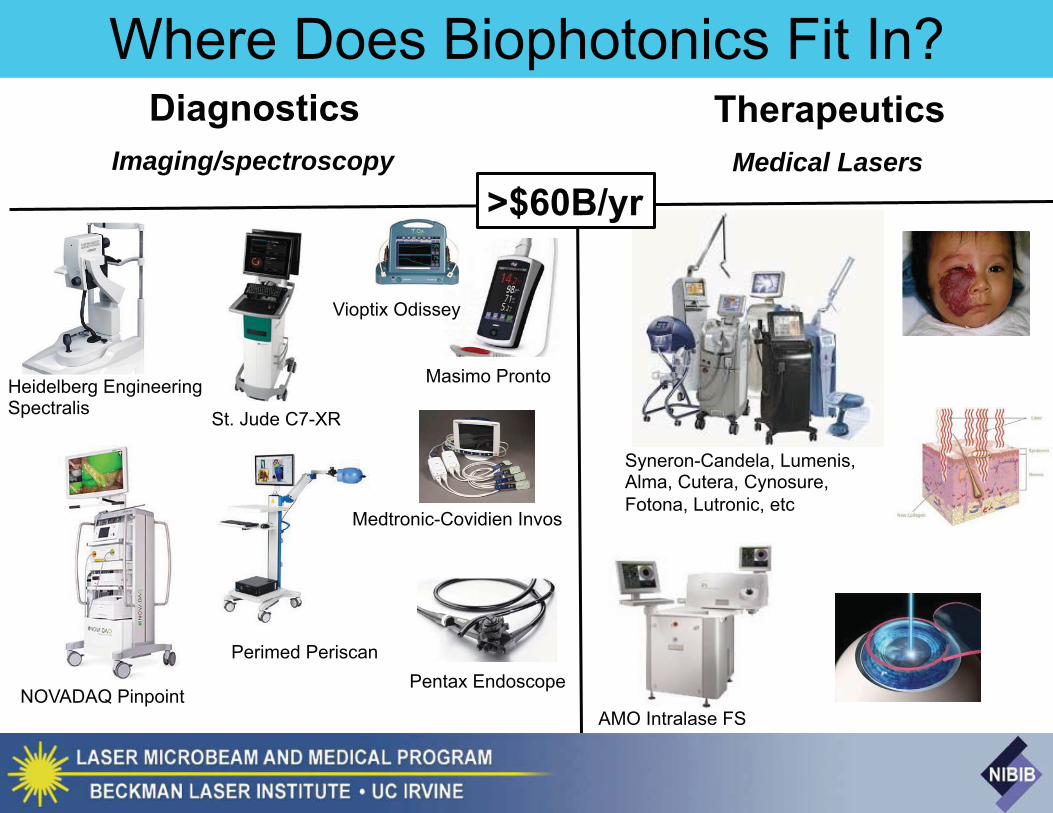
Tissue Optics Quantitative Challenge
Measuring Optical Pathlength
Molecular Absorption Loss
Absorption + Scattering Loss
A = bC; b = 1cm
A = bC; b = ??
Fixed pathlength
Unknown pathlength

Why Measure Optical Pathlength?
• Determine Perfusion and Metabolism at depth (Oxy/Deoxy Hb) • Determine concentration of other NIR absorbers/fluors (e.g. Water,
Lipid, exogenous dyes/particles )• Correct fluorescence for tissue optical property distortions
1) Separate Absorption from Scattering 2) Localize Information in 3D (Tomography)
Physics
Physiology
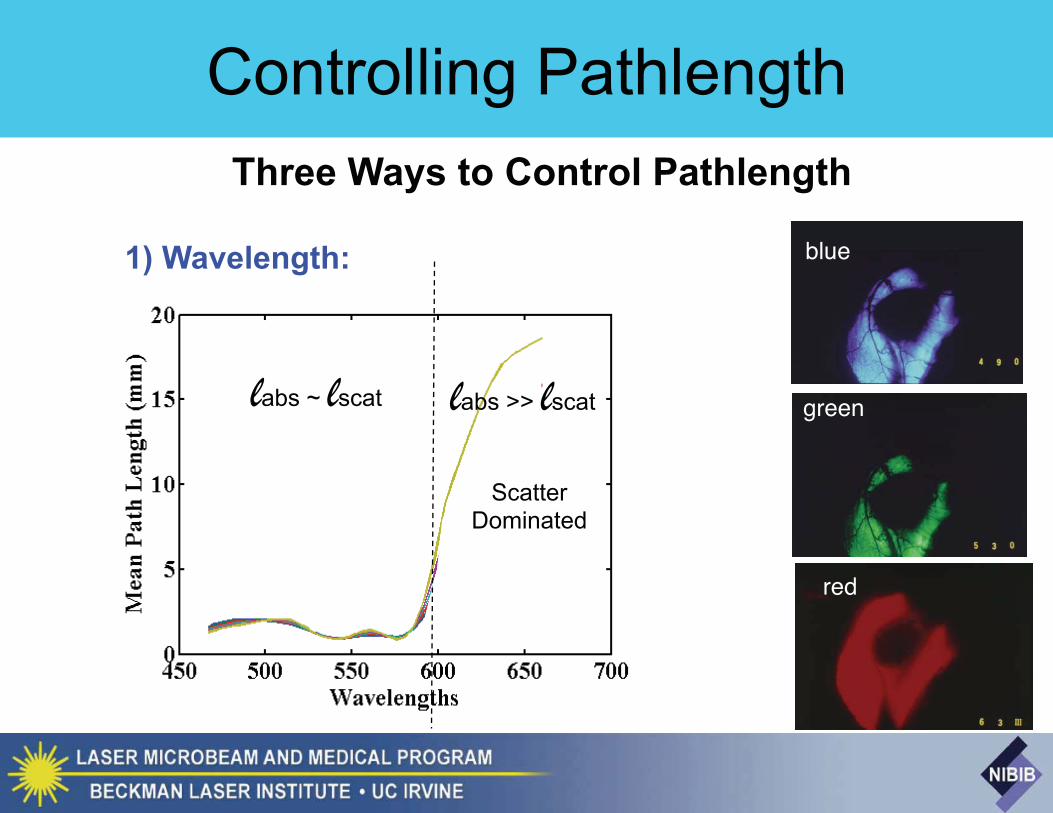
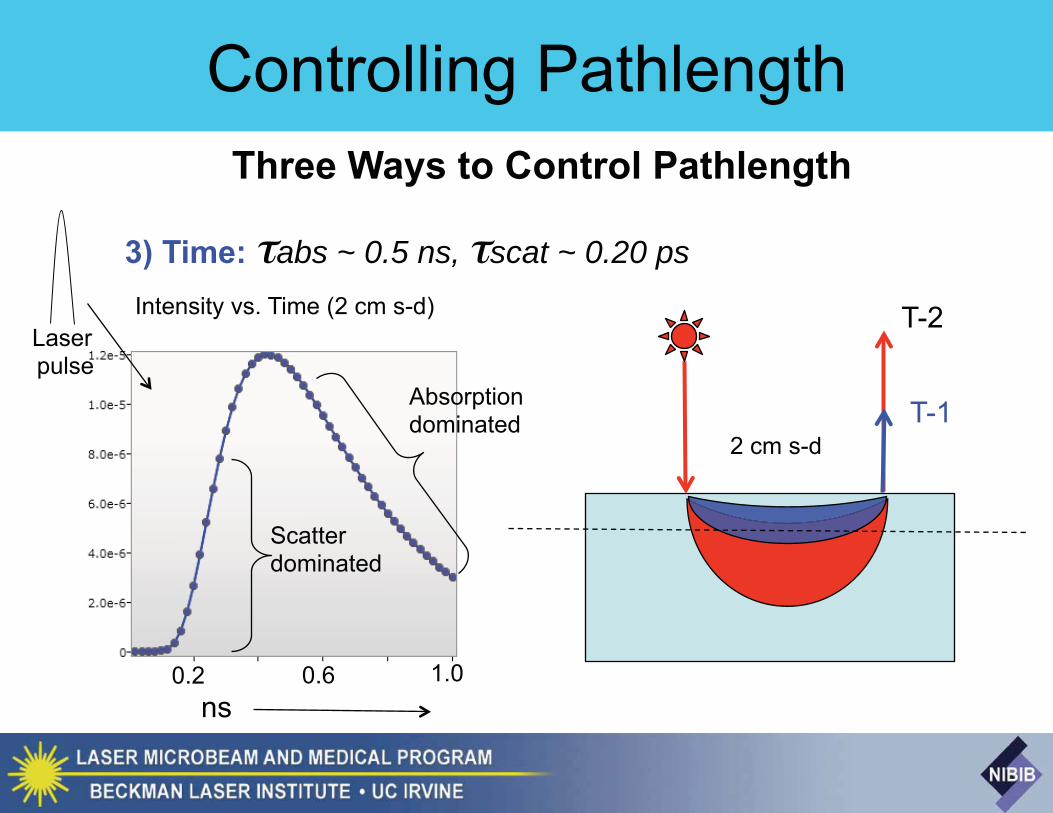
Controlling Pathlength Three Ways to Control Pathlength
blue
green
red
ScatterDominated
labs ~ lscat labs >> lscat
1) Wavelength:
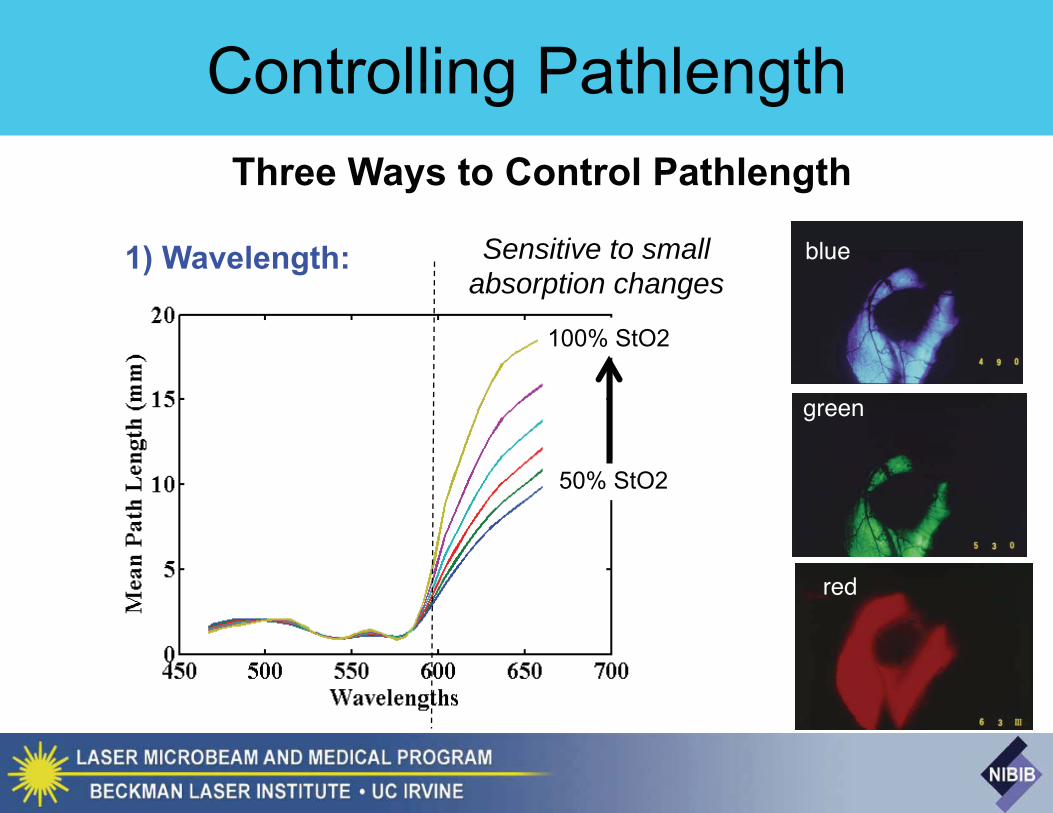
Controlling Pathlength
1) Wavelength: blue
green
red
100% StO2
50% StO2
Sensitive to small absorption changes
Three Ways to Control Pathlength

400 labs ~ lscat labs >> lscat

Controlling Pathlength
2) Space: labs ~ 10 cm; lscat ~ 20-40 μm;
D-1 D-2
2 10 20mm
Reflectance vs D
μa = 0.01 mm-1
μs’ = 0.1 mm-1
Scatter dominated
Scatter + Absorption
Three Ways to Control Pathlength
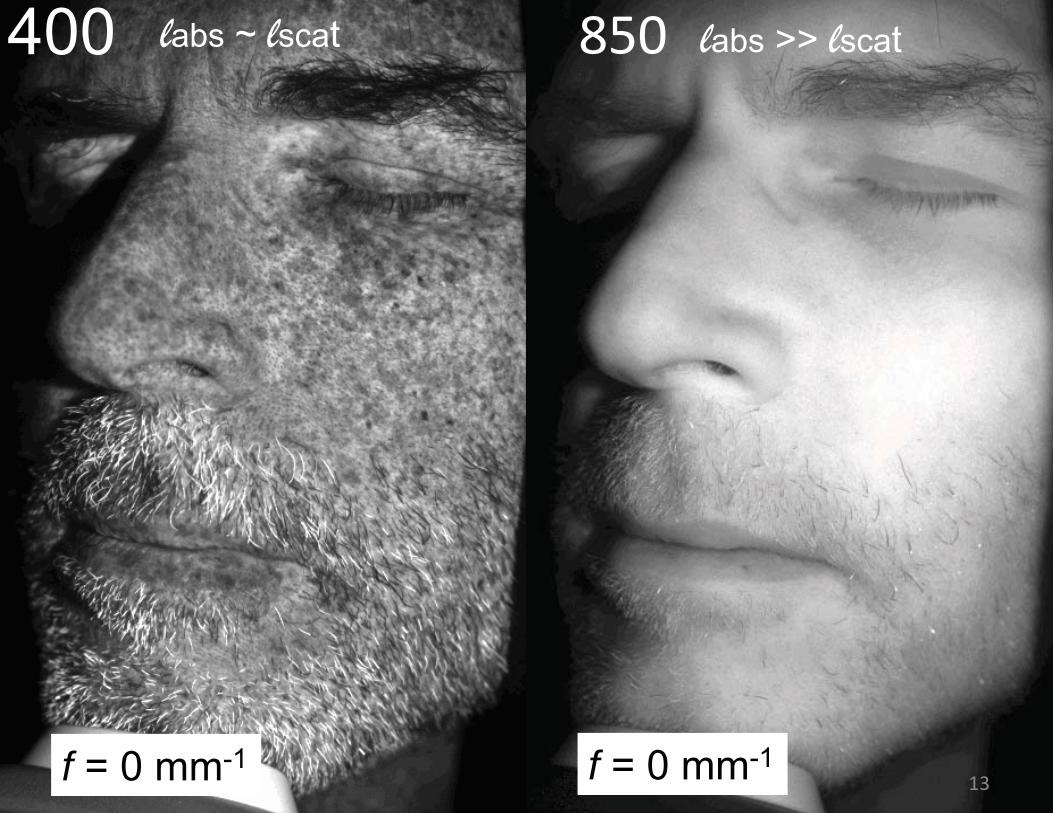
400 labs ~ lscat labs >> lscat
f = 0 mm-1 f = 0 mm-1
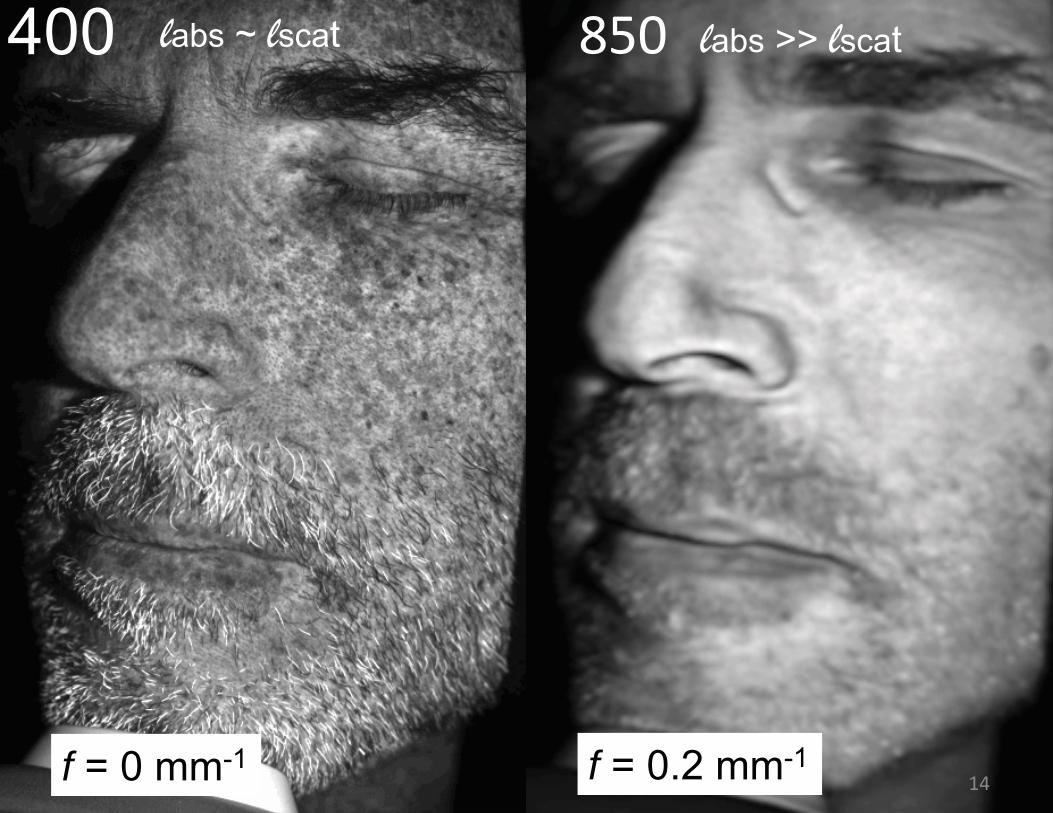
400 labs ~ lscat labs >> lscat
f = 0 mm-1 f = 0.2 mm-1
Controlling Pathlength
3) Time: abs ~ 0.5 ns, scat ~ 0.20 ps Intensity vs. Time (2 cm s-d)
Laserpulse
0.2 1.00.6ns
T-1
T-2
Scatterdominated
Absorptiondominated
Three Ways to Control Pathlength
2 cm s-d

Measuring Optical Path Length

Measuring Optical Path Length FT
(t)
FT-1
()
FT(t)
FT-1
()

Measuring Optical Path Length FT
(t)
FT-1
()
FT(t)
FT-1
()
FT
FTF-1
(
~10 cm depth, ~ cm resolution ~1 cm in depth, ~mm resolution Tromberg, et al., Appl Opt., (1993) Cuccia et. al., Opt Lett, (2005)
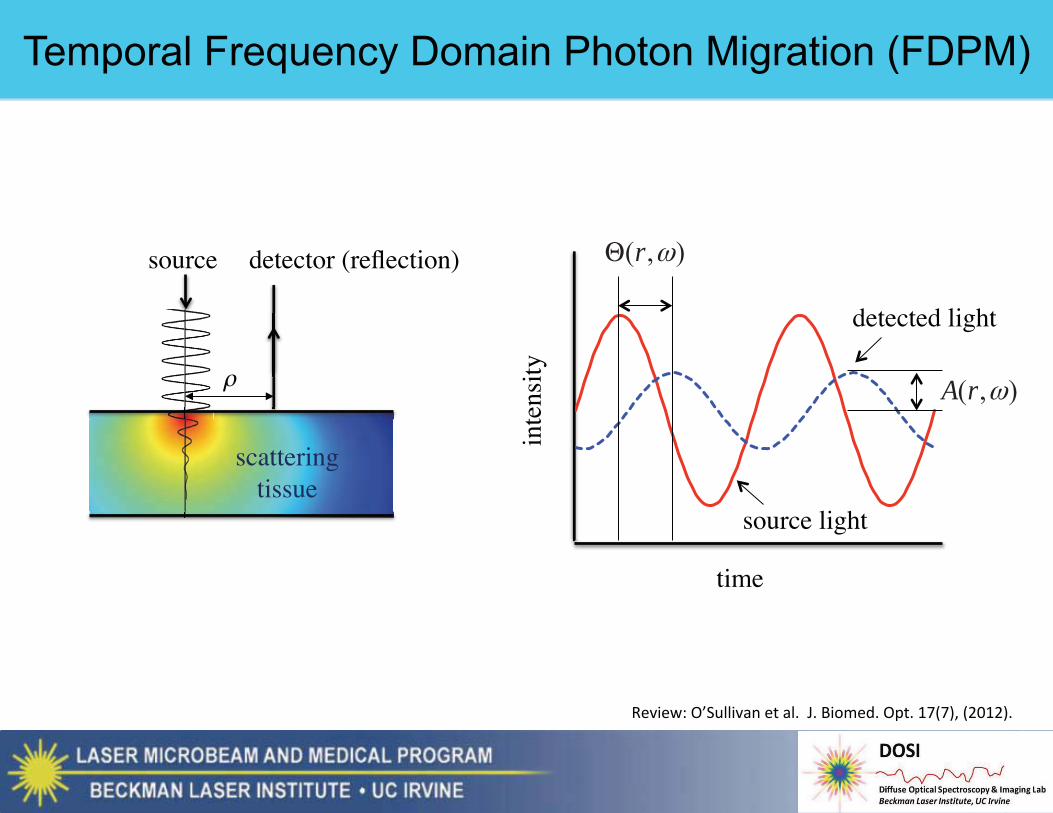
source detector (re ection)
scattering tissue
inte
nsity
time
source light
detected light
),(r
),(rA
Temporal Frequency Domain Photon Migration (FDPM)
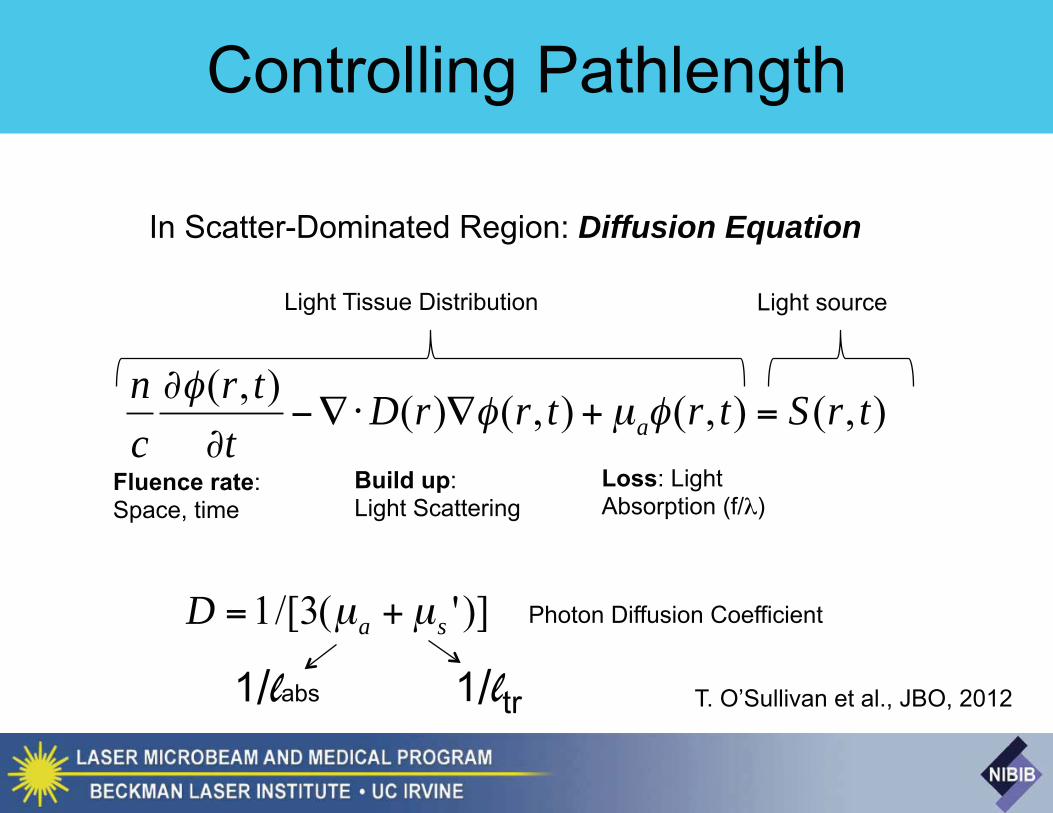
Controlling Pathlength
),(),(),()(),( trStrtrrDt
trcn
a =+
Light source
Loss: Light Absorption (f/ )
Build up:Light Scattering
)]'(3/[1 saD += Photon Diffusion Coefficient
In Scatter-Dominated Region: Diffusion Equation
Light Tissue Distribution
Fluence rate:Space, time
1/labs 1/ltr T. O’Sullivan et al., JBO, 2012

Diffusion equation (time dependent)
==+= ])[exp()exp(4
)exp(4
),( rktirkDr
StikrDr
Srt imgrealACAC
AC
frequency domain scalar photon density wave
)exp()()(),(ratefluencemodulated tirrrt ACDC +=
damped wavecDi
Dk a +=2
In nite medium:
Boundary Conditions: Haskell, Tromberg et al, JOSA-A (1994)

0200400600800
10001200
0 0.02 0.04 0.06 0.08 0.1
k (1/mm)
Mod
ulat
ion
Freq
uenc
y (M
hz)
Photon density wave
kreal
a = 0.006 mm-1
s’ = 1 mm-1
n=1.4
photon density wavelength = 2 /kimg 10 cm @ 200 MHz
(if no scattering, in air 9 m @ 200 MHz )
phase velocity Vp = /kimg ={ << c a Vp = 2(D/c a )1/2 16 mm/ns >> c a Vp = (2D c)1/2
1/ l
DC = 1/ eff = (D/ a)1/2 = 7.4 mm
kimag
0.05 0.1 0.15 0.2 0.25c a= 200 MHz
AC = 1/kreal
(independent of )
(dependent on : dispersion)
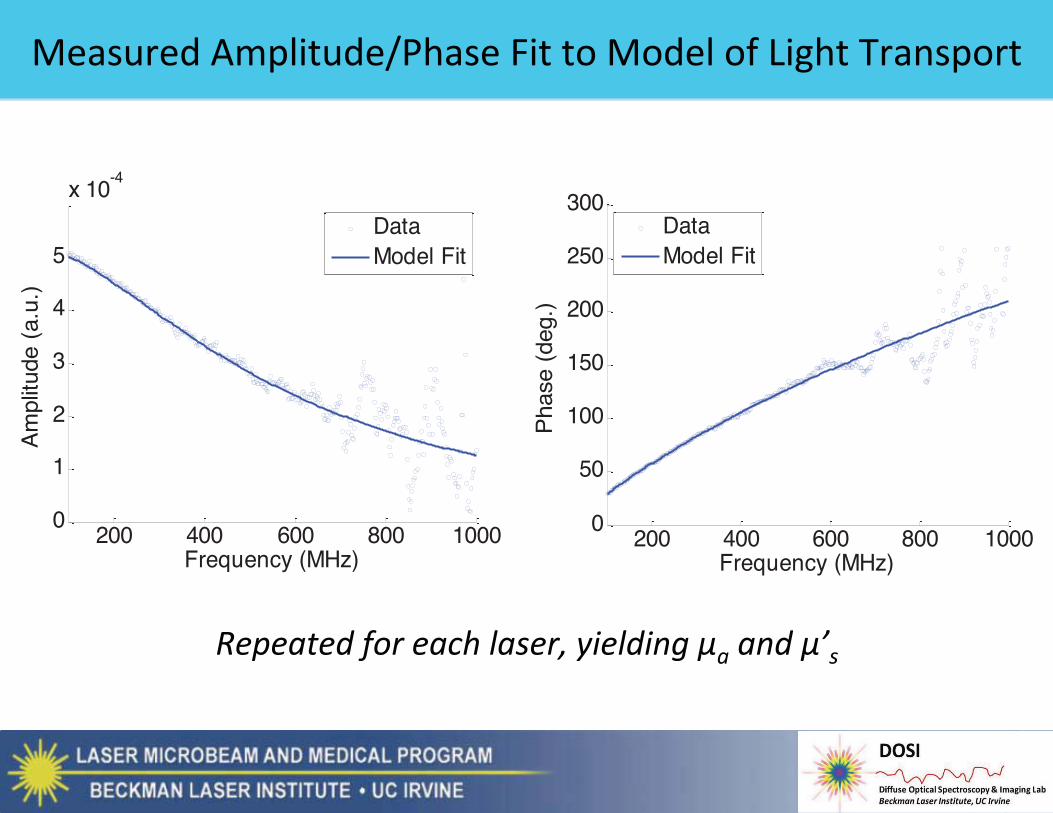
200 400 600 800 10000
1
2
3
4
5
x 10-4
Am
plitu
de (
a.u.
)
Frequency (MHz)
DataModel Fit
200 400 600 800 10000
50
100
150
200
250
300
Pha
se (
deg.
)Frequency (MHz)
DataModel Fit
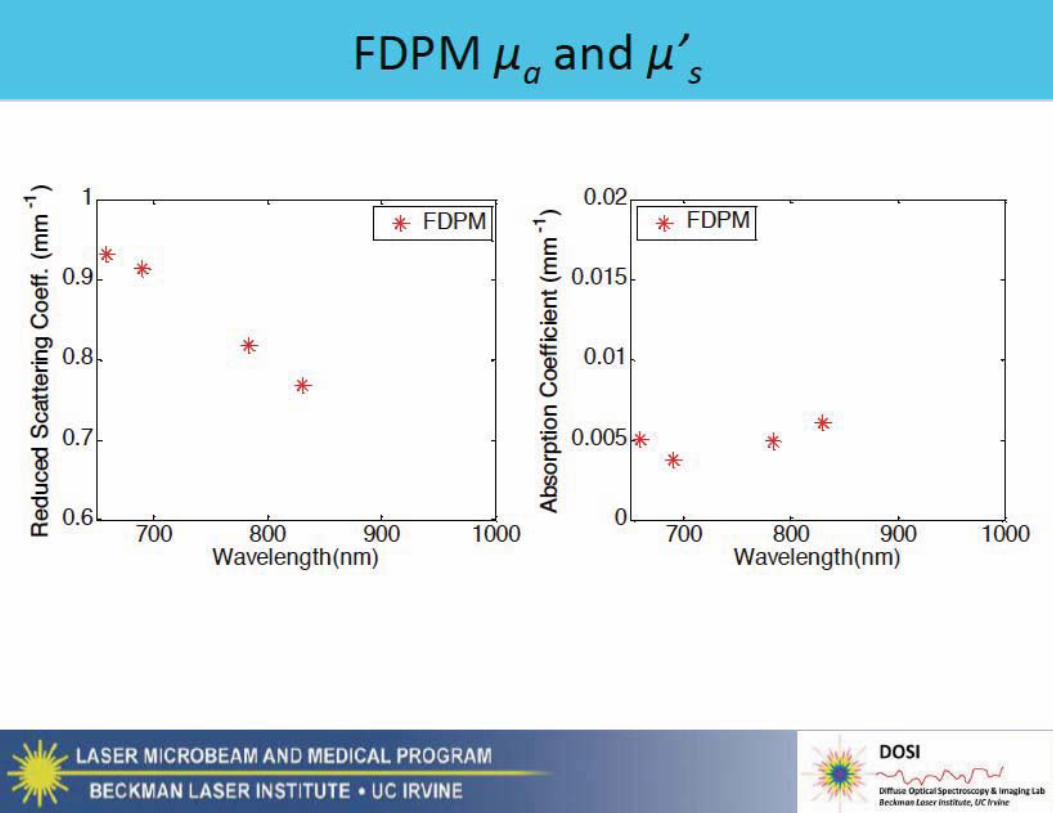
700 800 900 10000
0.005
0.01
0.015
0.02
Abs
orpt
ion
Coe
ffic
ient
(m
m-1
)Wavelength(nm)
FDPM
700 800 900 10000.6
0.7
0.8
0.9
1
Red
uced
Sca
tter
ing
Coe
ff.
(mm
-1)
Wavelength(nm)
FDPM
700 800 900 10000
0.005
0.01
0.015
0.02
Abs
orpt
ion
Coe
ffic
ient
(m
m-1
)Wavelength(nm)
FDPM
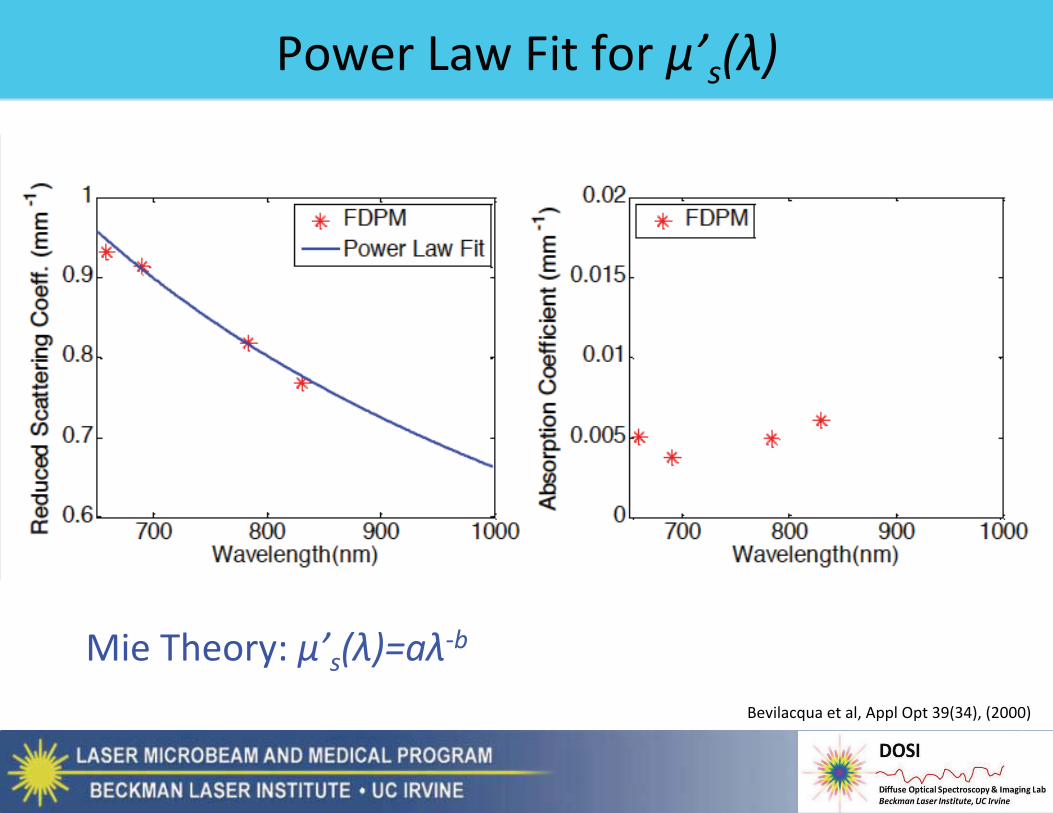
700 800 900 10000.6
0.7
0.8
0.9
1
Red
uced
Sca
tter
ing
Coe
ff.
(mm
-1)
Wavelength(nm)
FDPMPower Law Fit

700 800 900 10000.6
0.7
0.8
0.9
1
Red
uced
Sca
tter
ing
Coe
ff.
(mm
-1)
Wavelength(nm)
FDPMPower Law Fit
700 800 900 10000
0.005
0.01
0.015
0.02
Abs
orpt
ion
Coe
ffic
ient
(m
m-1
)Wavelength(nm)
FDPM
700 800 900 10000
0.2
0.4
0.6
0.8
1
1.2R
efle
ctan
ce (
a.u.
)
Wavelength(nm)
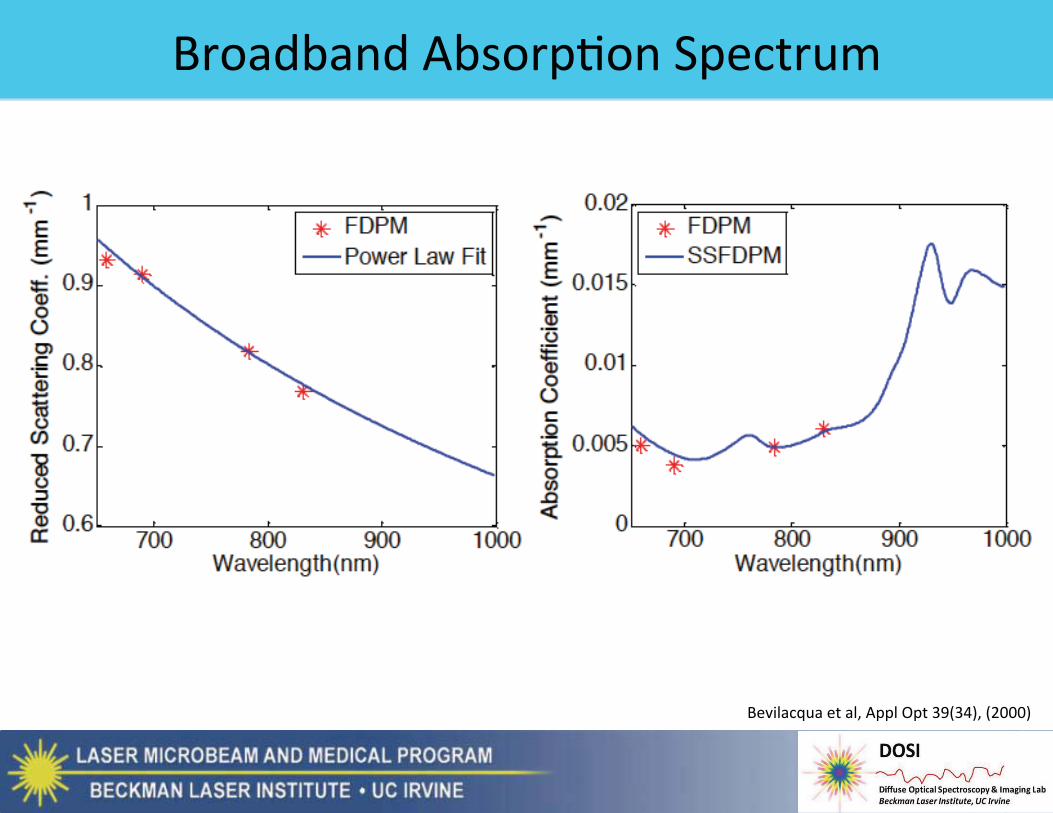
700 800 900 10000
0.005
0.01
0.015
0.02
Abs
orpt
ion
Coe
ffic
ient
(m
m-1
)Wavelength(nm)
FDPMSSFDPM
700 800 900 10000.6
0.7
0.8
0.9
1
Red
uced
Sca
tter
ing
Coe
ff.
(mm
-1)
Wavelength(nm)
FDPMPower Law Fit

700 800 900 10000
0.005
0.01
0.015
0.02
Abs
orpt
ion
Coe
ffic
ient
(m
m-1
)Wavelength(nm)
FDPMSSFDPMChromophore Fit
Oxyhemoglobin = 12.7 μMDeoxyhemoglobin = 4.1 μM
Water = 21.5% Lipid = 79.6%
LcII
=0log
650 700 750 800 850 900 950 10000.0
0.2
0.4
0.6
0.8
1.0
Abs
orpt
ion
(mm
-1m
M-1)
Wavelength(nm)
Tissue NIR absorbers
HHb
O2Hb
BULK LIPID
H2O


OxygenMetabolism
Arteriole90 mmHg
Tissue 17 < 47 mmHg
CellMitochondria2<30 mmHg
Venule 35
mmHg10-30 mmHg
Oxygen demand
Oxygen Supply
Cell-vascularcoupling
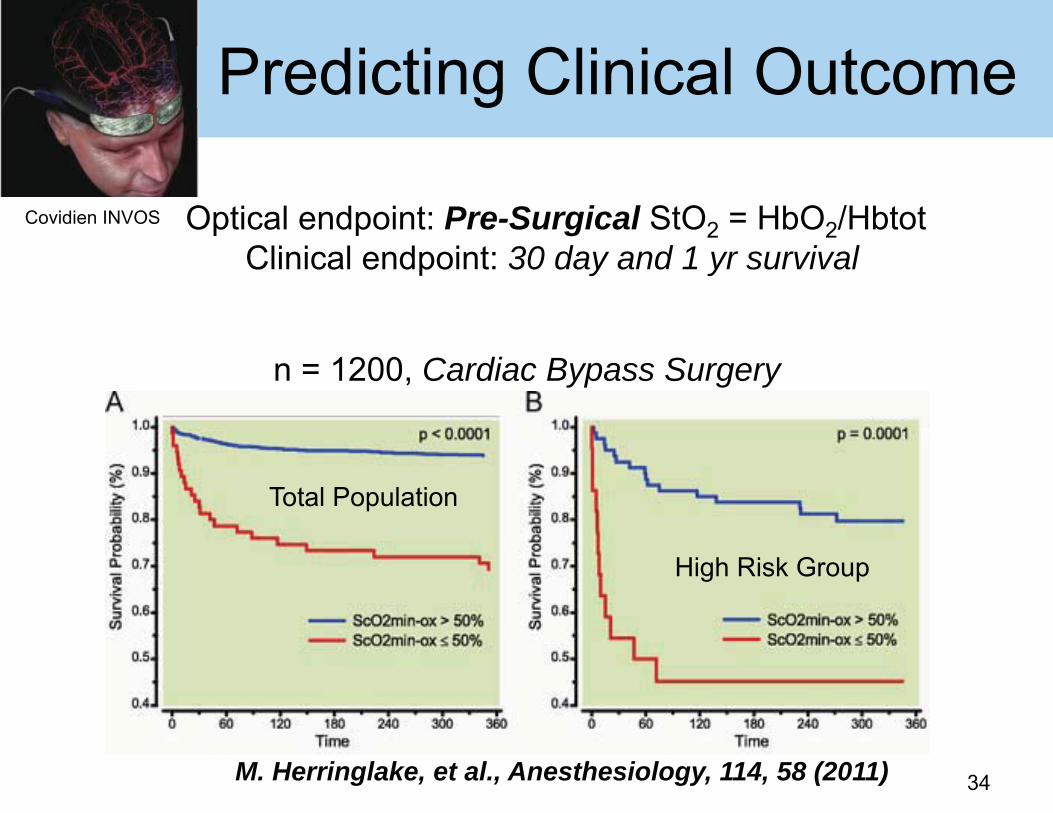
Predicting Clinical Outcome
34M. Herringlake, et al., Anesthesiology, 114, 58 (2011)
Total Population
High Risk Group
Optical endpoint: Pre-Surgical StO2 = HbO2/HbtotClinical endpoint: 30 day and 1 yr survival
n = 1200, Cardiac Bypass Surgery
Covidien INVOS
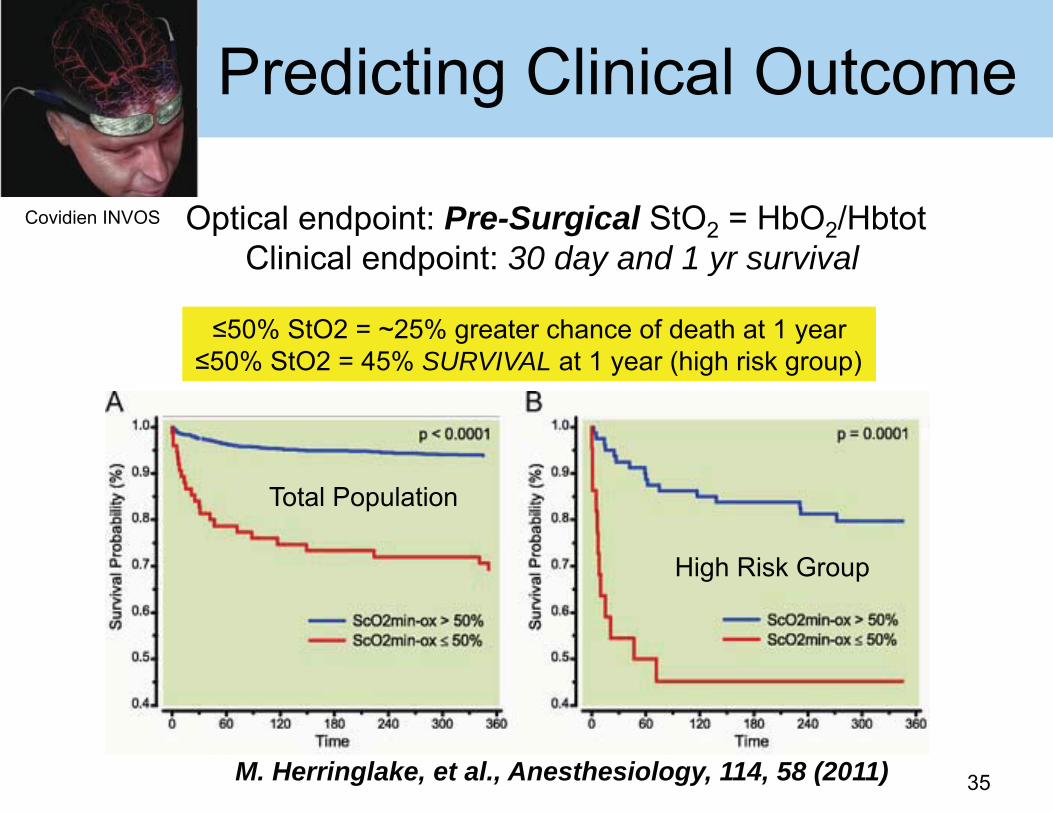
Predicting Clinical Outcome
35M. Herringlake, et al., Anesthesiology, 114, 58 (2011)
50% StO2 = ~25% greater chance of death at 1 year 50% StO2 = 45% SURVIVAL at 1 year (high risk group)
Total Population
High Risk Group
Covidien INVOS Optical endpoint: Pre-Surgical StO2 = HbO2/HbtotClinical endpoint: 30 day and 1 yr survival

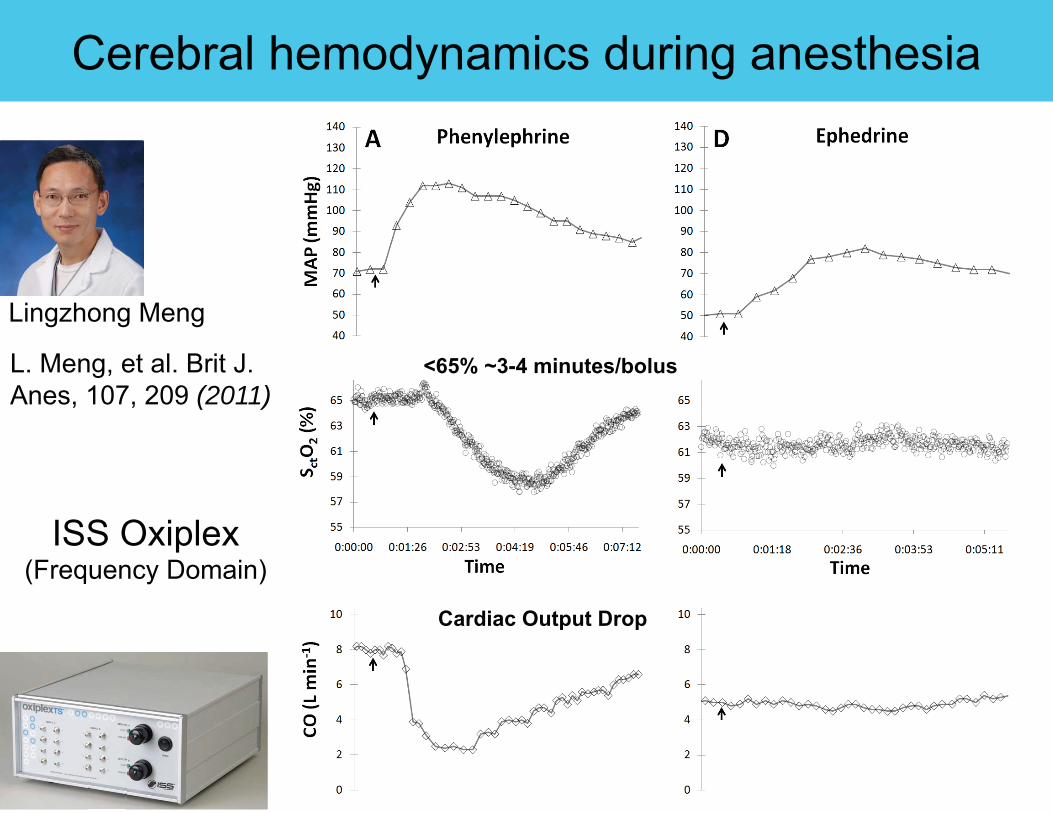
Cerebral hemodynamics during anesthesia Phenylephrine Ephedrine
Lingzhong Meng
L. Meng, et al. Brit J. Anes, 107, 209 (2011)
ISS Oxiplex (Frequency Domain)

Cerebral hemodynamics during anesthesia Phenylephrine Ephedrine
Lingzhong Meng
L. Meng, et al. Brit J. Anes, 107, 209 (2011)
ISS Oxiplex (Frequency Domain)
<65% ~3-4 minutes/bolus
Cerebral hemodynamics during anesthesia Phenylephrine Ephedrine
Lingzhong Meng
L. Meng, et al. Brit J. Anes, 107, 209 (2011)
ISS Oxiplex (Frequency Domain)
<65% ~3-4 minutes/bolus
Cardiac Output Drop