Embed Size (px)
Citation preview

1
Boyce & Bowers (2018)
Different Levels of Leadership for Learning: Investigating Differences Between Teachers Individually and Collectively using
Multilevel Factor Analysis of the 2011-12 Schools and Staffing Survey
Jared Boyce Alex J. Bowers SRI International Teachers College, Columbia University
[email protected] [email protected]
ABSTRACT:1 This study investigated the differences between how individual
teachers perceive leadership for learning and how teachers
collectively perceive leadership for learning, using a large
nationally generalizable dataset of 7,070 schools from the
National Center for Education Statistics 2011–12 Schools and
Staffing Survey (SASS). This study used cross-validation
multilevel factor analysis to find that individual teachers view
leadership for learning as consisting of six factors (school
influence, classroom control, collegial climate, student
attendance, neighborhood context, teacher commitment) whereas
teachers collectively (e.g., as a faculty) perceive three factors
that are non-isomorphic with the individual-level factors
(instructional leadership, management, social environment).
These results imply that teachers collectively have a functional
view of leadership, while individual teachers have views more
aligned to specific areas of influence. This article provides the
beginning of a theoretical framework for future multilevel
educational leadership research into teacher leadership and
leadership for learning.
Keywords: Leadership for Learning, School Leadership,
Instructional Leadership, Teacher Perception, Multivariate
Analysis, Factor Analysis, Factor Structure
INTRODUCTION: The purpose of this study is to investigate the differences
between how individual teachers perceive leadership for learning
and how teachers collectively (i.e., as a faculty of a school)
perceive leadership for learning, using a large nationally
generalizable dataset, the Schools and Staffing Survey (SASS)
1 This document is a pre-print of this manuscript, published in
the International Journal of Leadership in Education.
Recommended Citation:
Boyce, J., Bowers, A.J. (2018) Different Levels of Leadership
for Learning: Investigating Differences Between Teachers
Individually and Collectively Using Multilevel Factor Analysis
of the 2011-12 Schools and Staffing Survey. International
Journal of Leadership in Education, 21(2), p.197-225.
http://doi.org/10.1080/13603124.2016.1139187
Note: This document was last updated on February 6, 2018.
from the National Center for Education Statistics (NCES).
School leadership is important in supporting student
achievement (Marzano, Waters, & McNulty, 2005), having the
second largest positive effect on student growth, second only to
teacher quality (Leithwood & Jantzi, 2008; Leithwood &
Seashore-Louis, 2011).
One of the prevailing conceptual frameworks for understanding
and measuring effective school leadership is instructional
leadership theory (Hallinger & Murphy, 1985; Neumerski, 2013;
Robinson, Lloyd, & Rowe, 2008). Instructional leadership
theory maintains that principals should focus their efforts on
defining the school mission, managing the instructional program,
and creating a positive school climate (Hallinger & Murphy,
1985). Both principals and teachers take up important
instructional leadership roles within schools (Leithwood,
Mascall, & Strauss, 2009; Marks & Printy, 2003; Printy, Marks,
& Bowers, 2009; Spillane, Halverson, & Diamond, 2001, 2004)
with ‘teachers [assuming] more leadership functions at both
instructional and organizational levels of practice’ (York-Barr &
Duke, 2004, p. 255), suggesting that examining school
leadership behaviours beyond the principal-based instructional
leadership framework (Hallinger & Murphy, 1985) would
provide a more comprehensive understanding of the practice of
school leadership. Crucially, teachers often serve as the
connection between leadership practices in schools and student
achievement (Heck & Hallinger, 2009, 2014; Krüger &
Scheerens, 2012; Price, 2015; Price & Moolenaar, 2015).
Recently, educational leadership researchers have extended the
concept of instructional leadership into a broader framework of
‘leadership for learning’ – school leadership focused on the
instructional aspects of schools, combined with managing the
multiple and varied aspects of school administration to ensure
school-wide alignment of all aspects of a school with
instructional-centered leadership at its core (Boyce & Bowers, in
press; Halverson, Kelley & Shaw, 2014; Hallinger, 2011;
Knapp, Copland, and Talbert, 2003; Murphy, Elliott, Goldring,
& Porter, 2006, 2007; Robinson, 2011). Several different
leadership for learning frameworks have emerged within the
field of educational leadership (Boyce & Bowers, in press;
Halverson, Kelley & Shaw, 2014; Hallinger, 2011; Murphy,
Elliott, Goldring, & Porter, 2006, 2007; Robinson, 2011). The
2
Boyce & Bowers (2018)
specific definition of leadership for learning used within this
study is defined as the collection of: vision for learning,
instructional program, curricular program, assessment program,
communities of learning, resource allocation and use,
organizational culture, and social advocacy (Murphy, Elliott,
Goldring, & Porter, 2006, 2007).
The combination of the emerging leadership for learning
conceptual framework, the recognition that both teachers and
principals have active leadership roles within schools, and the
call for measuring leadership practices have led to the creation of
instruments such as the Vanderbilt Assessment of Leadership in
Education (VAL-ED) (Goff, Goldring, & Bickman, 2014;
Porter, Polikoff, Goldring, Murphy, Elliott, & May, 2010) and
Comprehensive Assessment of Leadership for Learning (CALL)
(Halverson & Dikkers, 2011; Halverson, Kelly & Shaw, 2014;
Kelley & Halverson, 2012). Both of these instruments measure
leadership practices across multiple levels, including teachers
and principals (Bowers, Blitz, Modest, Salisbury, & Halverson,
2017; Goff et al., 2014; Halverson & Dikkers, 2011; Kelley &
Halverson, 2012; Porter et al., 2010). This work motivates the
need for teacher perspectives to be taken into account in
understanding the practice of leadership within schools for both
theoretical reasons (Halverson & Dikkers, 2011; Knapp et al.,
2003; Marks & Printy, 2003; Murphy et al., 2006; Spillane,
Halverson, & Diamond, 2004) and methodological reasons
(Hallinger & Heck, 2011; Heck & Hallinger, 2009, 2010).
In the present study, we use the recent 2011–12 administration
of the Schools and Staffing Survey (SASS), a large nationally
representative USA teacher survey, to examine how leadership
for learning is perceived of in schools by teachers across two
organizational levels: the individual teacher level and the
collective teacher level. We employ the recent approach of
combining cross-validation with multilevel factor analysis to
address the past methodological issue of over-fitting exploratory
factor models to the data, making generalizations to larger
populations of interest problematic. Our findings include
individual teachers perceiving of six factors of leadership for
learning, teachers collectively perceiving of three factors of
leadership for learning, and the factor structures of the two levels
being non-isomorphic with each other.
LITERATURE REVIEW: The traditional view of instructional leadership in schools was
that principals were the sole instructional leaders of schools and
that the sole responsibility of instructional leadership fell upon
their shoulders (Hallinger & Murphy, 1985). Over the past
fifteen years, new frameworks of educational leadership have
relied on a rich body of organizational theory literature arguing
that leadership cannot be separated from its context (Spillane et
al., 2001, 2004). As noted by Spillane et al. (2001), ‘to study
school leadership we must attend to leadership practice rather
than chiefly or exclusively to school structures, programs, and
designs’ (p. 23). One of the core conceptual shifts has been to
move school leadership outside of the domain of being a
positional function, such as the specific role of the principal
(Hallinger & Murphy, 1985), and instead to reposition school
leadership as a function of the organization (Gronn, 2002a,
2002b; Marks & Printy, 2003; Printy et al., 2009; Spillane et al.,
2001, 2004).
Along with this newer conception of school leadership comes a
new conceptualization of who school leaders are. The classic
model of a school leader was positional: the principal was the
school leader (Hallinger & Murphy, 1985; Krüger & Scheerens,
2012). However, if school leadership is an organizational
function rather than a positional attribute, then the concept of
having a single school leader no longer makes sense (Gronn,
2002a, 2002b; Halverson et al., 2014; Marks & Printy, 2003;
Printy et al., 2009; Spillane et al., 2001, 2004). Instead of having
a single school leader with many followers, everyone at the
school who is engaging in leadership functions is him-/herself a
leader (Gronn, 2002a, 2002b; Leithwood et al., 2009; Spillane et
al., 2001; 2004). This conception of school leadership as shared
instructional leadership has led to the identification of school
faculties consisting of both formal and informal leaders (Marks
& Printy, 2003; Printy et al., 2009; Urick & Bowers, 2014b) and,
importantly for the present study, teachers collectively taking
action as faculties in enacting school leadership functions
(Bowers et al., 2017, Urick, 2012).
School leadership extends beyond individual school leaders
(Gronn, 2002a, 2002b; Halverson et al., 2014; Spillane et al.,
2001, 2004). The overarching goal of leadership for learning
frameworks is to provide a foundation to ensure that schools are
collectively focused on what is necessary to ensure the success
of their students (Hallinger, 2011; Halverson & Dikkers, 2011;
Knapp et al., 2003; Murphy et al., 2006, 2007). Murphy et al.
(2006, 2007) talk about the importance of shifting from an
individual leadership model to a team leadership model to
improve the overall performance of schools. This includes the
creation of both formal and informal leadership roles for
teachers in schools (Murphy et al., 2006, 2007).
Educational leadership research has grappled with a number of
methodological problems in modeling and assessing school
leadership (Hallinger & Heck, 1996, 2011; Heck & Hallinger,
2009, 2010, 2014). Hallinger and Heck (1996) reviewed fifteen
years of educational leadership research and determined that the
collected findings demonstrated that there was seemingly little to
no leadership effect in schools when school leadership was
modeled as a direct effect between principals and students.
Hendriks and Stein (2012) reached similar conclusions regarding
school leadership methodologies and their effectiveness in
measuring school leadership. In the first part of their meta-study,
Hendriks and Stein (2012) found that the vast majority of
educational leadership literature did not provide statistically
significant evidence that principal leadership behaviours have a
direct impact on student achievement. However, many of the
indirect effects models which found significant yet indirect
effects of school leadership on student achievement included
teachers in their models, such as collaborative leadership

3
Boyce & Bowers (2018)
practices (Heck & Moriyama, 2010), teacher participation in
decision-making (Leithwood & Jantzi, 2008), shared values
between principals and teachers on academic climate (De
Maeyer, Rymenans, van Petegem, van den Bergh, &
Rijlaarsdam, 2007), and various types of teacher commitment
(Ross & Gray, 2006). Overall the findings of Hendriks and Stein
(2012) support the need for better understandings of leadership
pathways (Hallinger & Heck, 2011) that include teachers.
Educational leadership research has historically been split
between examining teacher perceptions at the individual level or
aggregated to the school level (Leithwood & Jantzi, 2008;
Rowan, Raudenbush, & Kang, 1991). There can be marked
differences between individual perspectives, preferences, and
beliefs and various norms, processes, and beliefs that are shared
collectively by a group (Avolio & Bass, 1995; Dorfman,
Hanges, & Brodbeck, 2004; Leithwood & Jantzi, 2008; Urick &
Bowers, in press). Education research that focuses exclusively
on schools, the collective level of analysis, can disempower the
lived experiences of the individuals who are essential to the
overall functioning of the collective body (James & Jones, 1974;
Pallas, 1988; Rowan, Raudenbush, & Kang, 1991). At the same
time, focusing exclusively on the individuals without attending
to collective factors that are only present at the school level can
ignore powerful and meaningful effects on students, teachers,
and principals (Bryk & Driscoll, 1988; Pallas, 1988; Rowan,
Raudenbush, & Kang, 1991).
Educational leadership research has moved toward employing
multilevel analysis to measure leadership practices at the
individual and collective levels simultaneously (Bowers, et al.,
2017; Heck & Hallinger, 2009, 2014; Raudenbush & Bryk,
2002; Urick & Bowers, 2011, 2014, in press). This simultaneous
modeling of individuals and organizations corrects past
methodological errors while enabling new conceptual questions
to be explored (Hallinger & Heck, 2011; Heck & Hallinger,
2009, 2014; Raudenbush & Bryk, 2002; Urick & Bowers, 2011,
2014, in press). Hallinger and Heck (1996) alluded to the value
of multilevel modeling nearly twenty years ago in their review
of educational leadership literature:
We believe that researchers of administrative effects
will also profit greatly from adopting a multilevel
perspective toward schools as organizations…. Treating
data within its hierarchical structure may assist in
building theory about the nature of administrator effects
across levels of the organization. It will also facilitate
more refined investigations into a wider variety of
theoretical perspectives on how impact is obtained in
different types of organizational structure…. (p. 34)
Since Hallinger and Heck (1996) published their review,
multilevel modeling methodologies across the research literature
have allowed for collective effects to be modeled without
aggregating individual teacher responses. Or, said another way,
the research literature now allows for individuals’ lived
experiences to be included in a manner that accounts for shared
contexts, and for accurate comparisons to be made between the
individual and collective levels (Hox, 2010; Kaplan & Elliott,
1997; Rowe & Hill, 1998; Raudenbush & Bryk, 2002; Rowan et
al., 1991; Rumberger & Palardy, 2004). Through their increasing
use across the field of education research literature, multilevel
modeling techniques create new opportunities for connecting
complex theoretical leadership frameworks with the equally
complex reality of the leadership being an organizational
function and an individual endeavor (Hallinger & Heck, 2011;
Heck & Hallinger, 2009, 2014; Raudenbush & Bryk, 2002;
Urick & Bowers, 2011, 2014, in press).
Conceptual framework
The present study is grounded in organizational theory literature
specifically focused on how individual and collective constructs
differ across levels of organizations and how to model these
differences (Bliese, 2000; Chen, Bliese, & Mathieu, 2005; Dyer,
Hanges, & Hall, 2005; Kozlowski & Klein, 2000). We applied
Dyer et al.’s (2005) conceptual framework for multilevel factor
analysis in particular, as it was designed to provide a theoretical
framework in support of leadership research. Multilevel factor
analysis is an attractive innovation in the multilevel modeling
methods research that has been increasingly employed in recent
education research (Muthén, 1991, 1994; Muthén &
Asparouhov, 2011). In short, multilevel factor analysis
simultaneously examines the individual, as well as
organizational collective level, factors across survey response
items, providing a means to appropriately nest individuals within
organizations while providing separate factor structures at the
individual and collective levels (Muthén, 1991, 1994; Muthén &
Asparouhov, 2011). The creation of separate individual and
group-level estimates of factor structures offers key insights into
the differences between how individuals and organizations
interact with one another and how different perception of
leadership exist across organizational levels (Dyer et al., 2005).
Dyer et al. (2005) describe a typology of three different types of
factors at the collective level: composition factors in which a
collective factor is isomorphic to an individual-level factor and
the two mirror each other, compilation factors in which a
collective factor is not represented by any individual-level
factor, and fuzzy factors in which a collective factor is somewhat
isomorphic to an individual-level factor and the two may
function similarly in practice, yet the underlying structure of the
factors varies across the two levels.
This typology of cross-level factor comparisons is critical for
building multilevel theories of leadership that are grounded in
empirical evidence. This ties in directly to issues of aggregate
construct validity and research being impeded by the lack of
strong conceptual multilevel typologies (Chan, 1998; Chen,
Bliese, & Mathieu, 2005; Dyer et al., 2005; Mumford, 1998). As
explained by Dyer et al. (2005):
Leadership researchers have questioned the extent to
which relationships among constructs would vary at
different levels of analysis as well as the extent to
which constructs would have different meanings or
factor structures at different levels of analysis. (p. 150)

4
Boyce & Bowers (2018)
Most typically, either theoretical arguments are
referenced to verify the [aggregate] construct, or an
argument is made that the construct is valid because an
adequate level of agreement in responses exists within
the group. Few studies have used empirical techniques
such as factor analysis to explore the validity of
aggregate constructs in a manner that explicitly
acknowledges the aggregate nature of the measure,
while allowing for a simultaneous assessment of
measurement qualities (e.g., factor loadings, factor
intercorrelations) at both the aggregate and disaggregate
levels of analysis. (pp. 151–152)
Past theoretical leadership frameworks have regularly assumed
that individuals and collective bodies have similar
understandings of leadership (Chan, 1998; Chen, Bliese, &
Mathieu, 2005; Dyer et al., 2005; Mumford, 1998) despite the
fact that there is a significant body of theoretical and empirical
work that speaks to this assumption being inaccurate (Avolio &
Bass, 1995; Chen et al., 2005; Dorfman, Hanges, & Brodbeck,
2004; Dyer et al, 2005). One of the primary reasons for this
assumption has not been theoretical concerns, but rather
methodological concerns (Chen et al., 2005; Dyer et al., 2005).
Simply put, past leadership researchers have been hamstrung by
lacking empirical methodologies that have been robust enough
to rigorously explore multilevel theories (Chen et al., 2005; Dyer
et al., 2005). Within educational leadership literature in
particular, research into teacher leadership has been limited as
‘the few large-scale quantitative studies that do exist... have
exposed dilemmas in attempting to define teacher leadership in
ways that make quantification possible and meaningful’ (York-
Barr & Duke, 2004, p. 287).. Past researchers have made
deliberate efforts to demonstrate the value of multilevel factor
analysis in addressing these past concerns (Chen et al., 2005;
Dyer et al., 2005). This study follows a similar line of education
research (D’Haenens et al. 2010; Dunn et al., 2014), aiming to
add novel contributions to the field of educational leadership
while also showcasing the value and accessibility of multilevel
factor analysis methodologies.
Thus, the present study combines rigorous methodology, the
framework of leadership for learning, and a dataset that spans
across different domains within the leadership for learning
framework to address the following research question: to what
extent are there differences between how individual teachers and
teachers collectively perceive of leadership for learning in their
schools?
METHODS: Data, statistical weights, & analytic sample
This study is a secondary data analysis of the 2011–12 Schools
and Staffing Survey (SASS) administered by the National Center
for Educational Statistics (NCES) within the US Department of
Education (Goldring, Gray, & Bitterman, 2013; Goldring, Taie,
Rizzo, Colby, Fraser, & Chandler, 2013). We selected the 2011–
12 SASS dataset for this study for three reasons. First, SASS
provides a unique opportunity to examine leadership for learning
given its alignment with the leadership for learning theoretical
framework (Boyce & Bowers, in press). Second, SASS is
generalizable to the USA population of teachers through the use
of sampling weights (Goldring et al., 2013), which allows the
present study to explore teachers’ perspectives nationwide.
Third, prior quantitative research using SASS data has shown
SASS to be amenable to both mixture modeling (including factor
analysis) and multilevel analysis, providing significant insights
into a variety of research areas related to educational leadership
(Boyce & Bowers, in press). To ensure confidentiality of the
results, all sample sizes have been rounded to the nearest ten and
all statistics directly describing the data have been rounded to
the nearest hundredth (NCES, 2011a).
The data used in this study are a subset of the full sample of
public school teachers and public schools included in the 2011–
12 SASS dataset. We applied multilevel sampling weights
throughout our analysis, which limited our sample to include
only teachers with the requisite sample weighting data for
multilevel modeling (Asparouhov, 2006; Asparouhov, Muthén,
& Muthén, 2004). This resulted in an analytic sample of
n=34,850 teachers (93% of the teachers within the teacher data
file) within n=7,070 schools (94% of the schools within the
school data file).
Variables included in the analysis
We based our variable selection for this study on prior literature
on leadership for learning as reviewed above. In reviewing the
2011–12 SASS Public School Teacher survey we focused on
identifying question items that related to teacher perceptions and
self-reports of the following areas (Boyce & Bowers, in press;
Halverson & Dikkers, 2011; Kelley & Halverson, 2012; Murphy
et al., 2006, 2007): teacher influence, teacher leadership, school
leadership, school climate, teacher satisfaction, and teacher
commitment. This resulted in the selection of 49 question items
to be included in the present study as indicators for our
multilevel factor analyses.
We provide a summary of the question items below. As
recommended by prior multilevel factor analysis research, some
question items were reverse-coded to aid in both modeling
convergence and interpretation of the results (D’Haenens, van
Damme, & Onghena, 2010; Gustafsson & Stahl, 2005). We
conducted our reverse-coding process to create a consistent
response structure in which a greater numerical response
corresponded with a more positive interpretation (D’Haenens et
al., 2010). Additionally, all indicators were dichotomized to aid
with model convergence and to provide a more conservative
estimate of the number of factors within the data (Barendse,
Oort, & Timmerman, 2015). A full list of the question items,
their SASS question codes, how their responses were coded,
whether their responses were reversed, and their unweighted
descriptive statistics can be found in Appendix A.

5
Boyce & Bowers (2018)
Teacher self-reports of school-level influence: The 2011–12
SASS included seven questions asking teachers to report their
self-perceptions of how much influence they have in their
schools across different functions (Boyce & Bowers, in press;
Halverson & Dikkers, 2011; Kelley & Halverson, 2012; Murphy
et al., 2007; NCES, 2011b). The survey asked teachers to
respond on a four-point Likert scale that we dichotomized into
either high influence (1 = Moderate influence or higher) or low
influence (0 = Minor influence or lower).
Teacher self-reports of classroom-level control: The 2011–12
SASS included six questions asking teachers to report their self-
perceptions of how much control they have in their classrooms
across different functions (Boyce & Bowers, in press; Halverson
& Dikkers, 2011; Kelley & Halverson, 2012; Murphy et al.,
2007; NCES, 2011b). The survey asked teachers to respond on a
four-point Likert scale that we dichotomized into either high
control (1 = Moderate control or higher) or low control (0 =
Minor control or lower).
Teacher attitudes: The 2011–12 SASS included twenty-five
questions asking teachers how much they agreed or disagreed
with a variety of different statements (Boyce & Bowers, in press;
Halverson & Dikkers, 2011; Kelley & Halverson, 2012; Murphy
et al., 2007; NCES, 2011b). The survey asked teachers to
respond on a four-point Likert scale: 1 = Strongly agree, 2 =
Somewhat agree, 3= Somewhat disagree, and 4 = Strongly
disagree. Since agreement responses were recorded in the survey
as being lower numbers, question items that reflected positive
attitudes about the school (e.g., ‘The school administration’s
behavior toward the staff is supportive and encouraging.’) were
reverse-coded so that agreement with a positive statement was a
numerically greater answer. Responses were then dichotomized
into negative attitude (0 = Strongly or Somewhat agree after
reverse-coding) or positive attitude (1 = Strongly or Somewhat
disagree after reverse-coding).
Teacher perceptions of school problems: The 2011–12 SASS
included ten questions asking teachers for their perceptions of
the magnitudes of certain types of problems in their schools
(Boyce & Bowers, in press; Halverson & Dikkers, 2011; Kelley
& Halverson, 2012; Murphy et al., 2007; NCES, 2011b). The
survey asked teachers to respond on a four-point Likert scale
that we dichotomized into large problems (0 = Moderate
problem or worse) or small problems (1 = Minor problem or
better).
Teacher commitment: The 2011–12 SASS included one question
item that directly asked teachers about their professional
commitment (Boyce & Bowers, in press; Halverson & Dikkers,
2011; Kelley & Halverson, 2012; Murphy et al., 2007; NCES,
2011b): ‘If you could go back to your college days and start over
again, would you become a teacher or not?’ The survey asked
teachers to respond on a five-point Likert scale that we reverse-
coded and dichotomized into high professional satisfaction (1 =
Probably would become a teacher or higher) or low professional
satisfaction (0 = Chances about even for and against or lower).
Analysis
In the present study we performed a four-fold cross-validation
multilevel factor analysis (Dunn et al., 2014; Dyer et al., 2005;
Muthén 1991, 1994; van der Gaag et al., 2006). Multilevel factor
analysis is a quantitative method that belongs to the statistical
family of mixture modeling (Muthén 1991, 1994; Muthén &
Asparouhov, 2011). The underlying assumption of mixture
modeling is that there is latent information present within a
dataset that explains how the data are structured. The process of
performing a multilevel factor analysis is to examine a set of
observed data, or indicators, and testing to what extent these
observed data could be explained by a smaller set of latent
variables, or factors (Chen et al., 2005; Dyer et al., 2005;
Muthén 1991, 1994; Muthén & Asparouhov, 2011). Specific to
social science applications, this type of analysis helps to uncover
deeper cognitive, emotional, and social processes that are not
readily apparent at the surface level of survey question items
(Chen et al., 2005; Dunn et al., 2014; Dyer et al., 2005, Muthén,
1994; Urick & Bowers, in press). Additionally, multilevel factor
analysis models the nested nature of teachers within schools in a
way that is statistically accurate by controlling for the dependent
nature of the data, appropriately nesting teachers within schools
(Muthén 1991, 1994; Hox, 2010; Raudenbuch & Bryk, 2002)
and thus provides an opportunity to explore differences between
how individuals and collective bodies differ in how they make
sense of their environments (Chen et al., 2005; Dunn et al.,
2014; Dyer et al., 2005; Urick & Bowers, in press).
We employed cross-validation to address potential drawbacks of
purely exploratory factor analysis (Arlot & Celisse, 2010;
Breiman & Spector, 1992; Kohavi, 1995; Zhang, 1993), such as
difficulty generalizing to the population of interest due to over-
fitting (Dunn et al., 2014; Thompson, 2004). Given past work in
using cross-validation in conjunction with factor analysis (van
der Gaag et al., 2006), we selected V-fold cross-validation (Arlot
& Celisse, 2010; Breiman & Spector, 1992; Kohavi, 1995;
Zhang, 1993).
When performing V-fold cross-validation it is important to
choose a suitable number of folds as different numbers of folds
have different impacts on the bias of the exploration (Arlot &
Celisse, 2010; Breiman & Spector, 1992; Kohavi, 1995; Zhang,
1993). Based on past literature (Arlot & Celisse, 2010; Breiman
& Spector, 1992; Kohavi, 1995; Zhang, 1993), our sample size,
and the limitations of our computing power (as some of these
models can take days of processing time on the current
technology available), we selected a four-fold cross-validation
process. Following past recommendations (Bell, Ferron, &
Kromrey, 2008; Maas & Hox, 2005), we randomly divided our
2011–12 SASS sample of 7,070 schools into four subsets of
1,770 schools, each with approximately five teachers per school
on average.
We began with the full analytic sample of 7,070 schools. Then
we randomly split the full analytic sample into four subsamples
of 1,770 schools. We built our four exploratory subsamples by

6
Boyce & Bowers (2018)
combining three of the four subsets. For example, one of our
exploratory subsamples is comprised of random subsamples one,
two, and three. Our other exploratory subsamples were built
similarly. Then we set our confirmatory subsamples to be equal
to our random subsamples. This created four exploratory
subsamples that were each equal to 75% of the full analytic
sample and four confirmatory subsamples that were each equal
to 25% of the full analytic sample.
Analytic model
Guided by past research (Dunn et al., 2014; Dyer et al., 2005;
Muthén 1991, 1994; van der Gaag et al., 2006), we conducted
the four-fold cross-validation multilevel factor analysis in four
different stages. First, we calculated the intraclass correlation
coefficients (ICCs) for each indicator variable among the four
exploratory samples. ICCs estimate the amount of variance that
is present between groups (Dunn et al., 2014; Dyer et al., 2005;
Muthén, 1994). Based on recommendations from the literature
(Dyer et al., 2005), we looked for a large number of our
indicators to have ICC’s consistently above 0.05 across the four
exploratory datasets to ensure there was meaningful variance to
justify the appropriateness of multilevel modeling (Muthén,
1994).
Second, we performed separate within-level and between-level
MEFAs on each of the exploratory samples (Dunn et al., 2014).
In selecting the number of factors at each level, we used Kaiser’s
criterion (D’Haenens et al., 2010; Dunn et al., 2014) to guide us
in only examining factors with eigenvalues greater than or equal
to one (Bandalos & Boehm-Kaufman, 2009; Dunn et al., 2014;
Hayton, Allen & Scarpello, 2004). The three measures for
evaluating the best model fit at this stage were the comparative
fit index (CFI), root mean square error of approximation
(RMSEA), and the standardized root mean square residual
(SRMR) (Bentler, 1980, 1992; Dunn et al., 2014; Jöreskog &
Sörbom, 1981; Muthén & Muthén, 1998; Steiger, 1990). Chi-
squared can also be used for model fit, however for larger
sample sizes it is often significant and therefore is often not used
as one of the primary indicators (Dunn et al., 2014). Based on
the literature (Browne & Cudeck, 1993; Dunn et al., 2014; Hu &
Bentler, 1999; Kline, 2010; MacCallum, Browne, & Sugawara,
1996; Marsch, Hau & Wen, 2004; Stieger, 1990), our fit criteria
included a CFI above 0.900, RMSEA below 0.060, and SRMR
below 0.080, indicating adequate model fit. Beyond these
quantitative measures, we also evaluated models with respect to
their interpretability, the number of indicators that have
significant loadings on more than one factor, and how distinct
the factors were from one another (Brown, 2014; D’Haenens et
al., 2010; Dunn et al., 2014; Kline, 2010). We considered
significant factor loadings to be above |0.32| and strong factor
loadings to be above |0.50| (Dunn et al., 2014).
Third, after determining the number of factors at each level
individually, we performed MEFAs on each of the exploratory
samples with factors at both the within and between levels to
confirm whether or not a model with factors at both levels had
adequate fit (Dunn et al., 2014). During this stage we also
evaluated whether or not certain indicators should be removed in
order to improve model fit (Brown, 2014; Dunn et al., 2014;
Kline, 2010). There are two criteria by which an indicator may
be removed at this stage. The first criterion is that an indicator
may not contribute much explanatory power to the overall model
if (a) it does not have any strong factor loadings and (b) it does
not have two or more significant factor loadings (Dunn et al.,
2014). While cross-loaded indicators are often removed when
conducting factor analysis, our exploratory framework (Dunn et
al., 2014) instead interprets them as modeling the overlapping
nature of psychological, social, and behavioral factors in
education. The second criterion for removing an indicator from
the model is that the indicator may not load consistently with the
same items across the four exploratory samples.
Fourth, the final stage of the analysis was cross-validation.
Using the loadings from the MEFAs in stage three, we
conducted MCFAs on the four confirmatory samples. The
MCFAs were performed in an iterative manner until adequate
model fit had been achieved (van der Gaag et al., 2006). The
first MCFA included only significant and strong factor loadings
that were found in four exploratory samples in stage three. Then
we added factor loadings that were significant in three of the
four exploratory samples to the model for the next set of
MCFAs, and so on until adequate model fit was achieved. The
goal of this iterative process was to have the resulting MCFA
model be both parsimonious and accurate to the data (Dunn et
al., 2014; van der Gaag et al., 2006).
We used Mplus version 7.11 (Muthén & Muthén, 2013) to
analyse the models. Given recent literature on different
estimators (DiStefano & Morgan, 2014), we used weighted least
squares–mean and variance adjusted (WLSMV) estimation for
our analysis (Dunn et al., 2014). The MEFAs were performed
with a geomin oblique rotation, which was justified given the
inter-factor correlations (D’Haenen’s et al., 2010).
RESULTS: The purpose of the present study is to investigate the differences
between how individual teachers and teachers collectively
perceive of leadership for learning in their schools as a means to
understand the complexity of the practice of school leadership.
We conducted the cross-validation multilevel factor analysis in
four different stages. Stage one examined the intraclass
correlation coefficients of the 49 indicators and determined that
there was significant variation between schools, indicating that
multilevel modeling was well-suited for these data. Stage two
used MEFAs to conclude that individual teachers perceived of
six different leadership for learning factors while teachers
collectively perceived of three factors. Stage three confirmed
that the six within-level and three between-level model fit the
data well and trimmed ten indicators to improve model fit and
parsimony. Stage four cross-validated the final model from stage
three.

7
Boyce & Bowers (2018)
The processes and results of each stage are detailed below. We
report fit statistics, model selection comparisons, incremental
indicator additions and removals, and both the final exploratory
and final confirmatory factor structures following the past
MLFA and cross-validation literature (Dunn et al., 2014; Dyer et
al., 2015; D’Haenens et al, 2010; Muthén, 1994; van der Gaag et
al, 2006). Structured reporting of intermediate MLFA statistics
supports the ability to understand the underlying complexity of
the data and the appropriateness of the final MCFA model (Dyer
et al., 2005; Muthén, 1994). We then turn to the interpretation
and discussion of the final validated multilevel confirmatory
factor analysis in the discussion.
Stage one – examining multilevel variance across items
Stage one consisted of calculating and reviewing the intraclass
correlation coefficients (ICCs) of all 49 indicators in each of the
four randomly split exploratory subsamples. ICCs measure the
amount of variance that occurs between schools at the between-
level compared to the amount of variance that occurs between
individual teachers at the within-level. Past literature
recommends having ICCs of at least 0.05 on most of the
indicator variables to establish that the data are well-suited to
multilevel factor analysis (Dyer et al., 2005).
Appendix B provides the ICCs for all indicators in each of the
exploratory samples. All 49 indicators have ICCs above 0.05 in
all four exploratory samples. This suggests that multilevel factor
analysis is an appropriate method to use in analysing these data.
Moreover, the ICCs vary from 0.061 to 0.614. The variation in
the ICCs suggests that different variables may be more likely to
have strong factor loadings at the within-level while others may
be more likely to have strong factor loadings at the between-
level, resulting in different factor structures at each level (Dunn
et al., 2014). This finding lends further evidence to the
justification for a multilevel model of these data.
Stage two – assessing the appropriate number of factors at level
1 and level 2 independently of one another
Stage two consisted of exploring the number of factors at the
within school level (i.e., individual teacher level) and between
school level (i.e., collective teacher level) separately using
MEFA on each of the four exploratory subsamples. This is the
first step in exploring the structure of how individual teachers
and teachers collectively perceive of leadership for learning in
their schools. The final product of stage two is the initial
multilevel factor model that will be evaluated in detail during
stage three. Fit statistics for the models using exploratory sample
four can be found in Appendix C as a representation of our
analysis for this stage.
The eigenvalues for the possible within-level individual teacher
factors were calculated using the four exploratory samples.
Kaiser’s criterion provided an upper limit of ten within-level
factors in all four samples. We generated fit statistics for models
with between one and ten within-level factors for each sample
(e.g., Appendix C Panel A). The models with eight and ten
within-level factors did not converge across all of the
exploratory samples. Based on this, we eliminated models with
eight or more within-level factors from consideration given these
convergence issues. Following the recommendations of the
literature noted in the methods, we then used our model fit
criteria of CFI above 0.900, RMSEA below 0.060, and
SRMRwithin below 0.080 as our initial cutoff for determining
which models fit the samples adequately. In all four samples the
models with between five and seven within-level factors had
adequate model fit based on these criteria. We examined these
models in detail. We eliminated the model with five factors
because in all four samples it included a factor that consisted
entirely of cross-loaded indicators. In comparing the six- and
seven-factor models, the six-factor model had similar yet
consistently fewer cross-loaded indicators (1, 1, 2, 2) across the
four exploratory samples compared to the seven-factor model (2,
3, 3, 4). Additionally, the seven-factor model did not add
significantly more interpretability to the model and the
indicators that had strong loadings on the seventh factor had
strong loadings on other factors in the six-factor model. Given
this analysis, we selected the six-factor model to move forward
with in terms of selecting the number of within-level factors.
The eigenvalues for the possible between-level collective teacher
school-level factors were calculated using the four exploratory
samples. Kaiser’s criterion provided an upper limit of nine
between-level factors in three samples and an upper limit of
eight in one sample. Based on these results, we generated fit
statistics for models with between one and nine between-level
factors for each sample to err on the side of being thorough in
our model evaluation (e.g., Appendix C Panel B). We used our
model fit criteria of CFI above 0.900, RMSEA below 0.060, and
SRMRbetween below 0.080 as our initial cutoff for determining
which models fit the samples adequately. In all four samples the
models with between three and nine between-level factors had
adequate model fit based on these criteria. We examined these
models in detail. We eliminated the models with between seven
and nine between-level factors because in all four exploratory
samples they included factors that consisted of either all or all-
but-one cross-loaded indicators. We eliminated models with
either five or six factors because they included factors that
consisted of all-but-one cross-loaded indicators in at least one
exploratory sample. In choosing between the three-factor and
four-factor models, we preferred the three-factor model because
its numbers of cross-loaded indicators were 10, 10, 12, and 14
across the four exploratory samples, which were fewer than the
four-factor model’s 14, 15, 16, and 17 cross-loaded indicators.
Given this analysis, we selected the three-factor model to move
forward with in terms of selecting the number of between-level
factors.
At the conclusion of stage two, we determined that, at the
within-level of analysis, individual teachers perceive of
leadership for learning as six distinct factors. We also concluded
that at the between-level of analysis teachers collectively
perceive of leadership for learning as three distinct factors. This
suggested that a fully specified multilevel factor structure of six

8
Boyce & Bowers (2018)
within-level factors and three between-level factors would fit the
data well.
Stage three – assessing full MEFA model fit across the
exploratory subsamples and trimming indicators
In stage two, we determined that individual teachers perceived
leadership for learning as a collection of six different factors at
level 1, the individual teacher level, and that teachers
collectively perceived of leadership for learning as a collection
of three different factors at level 2, the collective teacher level.
In stage three, we examined whether or not the combined model
of six within-level individual teacher factors and three between-
level collective teacher school factors fit the four exploratory
subsamples as our primary foundation for the cross-validation as
noted above in the methods. In doing so we conducted multiple
trims of the data to improve model fit and interpretability. Model
fit statistics for all models run in this stage are listed in
Appendix D.
The six within-level factors and three between-level factors
model fit the data well on all four exploratory samples with
CFI’s above 0.900, RMSEA’s below 0.060, and SRMR’s below
0.080. Thus, the stage two multilevel exploratory factor analyses
worked well, as the fully specified multilevel exploratory factor
analysis fit all exploratory subsamples.
Having confirmed adequate model fit, we next reviewed the
factor loadings to determine whether or not specific indicators
should be trimmed from the model as recommended by past
literature to ensure a final parsimonious best fit model (Brown,
2014; Dunn et al., 2014; Kline, 2010). In the first round of
trimming we removed indicators that did not have loadings that
significantly added to the overall model. The specific
requirements for making the determination is that the indicator
(a) did not have any strong factor loading on any factor at either
the within or between levels and (b) did not have two or more
significant factor loads on any factors at either the within or
between levels (Dunn et al., 2014). The cutoff for a strong factor
loading was |0.50| and the cutoff for a significant factor loading
was |0.32| (Dunn et al., 2014). We removed seven question items
based on them not fulfilling these criteria in one or more of the
exploratory samples: T0436, T0437, T0439, T0440, T0448,
T0449, and T0452.
We reran the models across all four exploratory samples with
these seven items removed, leaving 42 indicators in the model.
The model fits improved slightly with the smaller number of
indicators. We reviewed the models again in detail to evaluate
whether or not more indicators should be trimmed based on not
having significant loadings in the model. There were no new
indicators to remove based on this criterion. We then reviewed
indicators to determine whether or not any should be removed
based on having inconsistent loadings across the four
exploratory samples. 31 of the 42 indicators had the same
loading structures across all four models. In reviewing the other
eleven indicators, we wished to err on the side of not over-
trimming the model given that the cross-validation process
allows for variation between loadings. We identified three
indicators as (a) not having any consistent strong loadings across
the four exploratory models and (b) having at least three distinct
factor loading structures across the four exploratory models. We
removed these three indicators: T0431, T0458, and T0469.
We reran the models across all four exploratory samples with
these three additional indicators removed, leaving 39 indicators
in the model. The model fits improved slightly with the smaller
number of indicators. We reviewed the models again in detail to
evaluate whether or not any additional indicators should be
trimmed, and we determined that there was no need to trim any
other indicators.
The conclusion of stage three was an exploratory multilevel
factor structure presented in Table 1. This model includes six
within-level factors (representing individual teachers’
perceptions) and three between-level factors (representing
teachers’ collective perceptions) of leadership for learning based
on 39 of the original 49 indicators from SASS. We report the
model resulting from stage three as recommended by past
literature (Dunn et al., 2014), but we do not formally interpret
the model until it has undergone cross-validation (van der Gaag
et al., 2006). In stage four we take the model detailed in Table 1
and cross-validate it on the confirmatory subsamples using
iterative multilevel confirmatory factor analyses as described
previously in the methodology section.
Stage four – fitting the final multilevel confirmatory factor
analysis model
The prior three stages were exploratory in their purposes. The
result of all three of those stages is a set of multilevel models
with the goal of describing the underlying factor structures of
both individual teachers and teachers collectively. The fourth
and final stage of this process is to cross-validate this
exploratory work by performing MCFAs of these models on the
confirmatory samples. Complete fit statistics for all models in
this stage are listed in Appendix E.
Our initial model for the MCFA only included factor loadings
that were significant across all four exploratory models. Since 33
of our indicators had entirely consistent loading patterns, the
vast majority of the significant loadings from stage three were
included in this model. None of the models at this stage met our
criteria for adequate model fit. The average RMSEA of 0.027
was readily beneath the desired 0.060. SRMRwithin was
borderline, averaging 0.078 across the models with a desired
maximum of 0.080. CFI averaged 0.833, under the desired 0.900
or greater, and SRMRbetween averaged 0.149, above the desired
0.080 or lower.
In our second model for the MCFA we added in factor loadings
that were significant across three of the four exploratory models.
This resulted in three between-level factor loadings being added
to the model. CFI, RMSEA, and SRMRwithin did not change
significantly. However, SRMRbetween did drop significantly to an
average of 0.130, a marked improvement.

9
Boyce & Bowers (2018)
Table 1: Multilevel exploratory factor analysis model, exploratory subsample four
Within level (individual teachers) Between level (collective teachers)
Indicator Factor 1
School
Influence
Factor 2
Classroom
Control
Factor 3
Collegial
Climate
Factor 4
Student
Attend.
Factor 5
Neigh.
Context
Factor 6
Teacher
Commit.
Factor 1
Instruct.
Leadership
Factor 2
Managem.
Factor 3
Social
Env.
T0423: Evaluating 0.837 -0.046 -0.004 -0.010 0.041 -0.026
0.381 0.395 -0.178
T0424: Hiring 0.683 -0.041 0.029 0.001 -0.014 -0.010
0.388 0.201 0.057
T0426: Budget 0.669 0.057 0.007 -0.028 0.015 -0.003
0.093 0.393 -0.028
T0425: Discipline 0.642 0.028 0.155 0.040 -0.013 0.018
0.189 0.631 -0.094
T0422: In-service PD 0.632 0.050 0.105 0.029 -0.016 0.022
0.350 0.447 -0.028
T0420: Performance standards 0.575 0.185 0.047 0.022 -0.007 0.042
0.634 0.417 -0.020
T0421: Curriculum 0.573 0.335 -0.051 0.000 0.002 0.011
0.903 0.006 -0.030
T0428: Content 0.097 0.811 -0.074 -0.064 0.062 -0.047
0.930 -0.177 -0.058
T0429: Teaching 0.020 0.793 0.044 0.035 -0.021 0.043
0.768 0.034 0.143
T0430: Grading -0.021 0.745 0.081 0.006 -0.029 0.021
0.726 0.003 -0.014
T0432: Homework -0.066 0.675 0.161 0.043 -0.012 0.001
0.476 -0.050 0.028
T0427: Textbooks 0.155 0.635 -0.02 -0.024 0.044 -0.020
0.803 -0.086 0.036
T0444: Principal knows 0.060 -0.038 0.800 0.008 0.017 -0.036
-0.138 0.859 -0.101
T0441: Principal enforcement 0.058 0.027 0.745 0.106 -0.022 0.016
0.006 0.817 -0.010
T0467: Like how school is run 0.029 0.014 0.742 0.052 -0.032 0.208
0.124 0.890 0.026
T0435: Admin support 0.044 0.066 0.730 0.038 -0.099 0.081
0.150 0.856 -0.157
T0445: Cooperative effort -0.011 -0.020 0.701 -0.067 0.161 -0.022
-0.026 0.827 0.076
T0446: Recognition 0.083 0.031 0.684 -0.062 0.086 0.045
0.028 0.866 -0.057
T0443: Shared beliefs -0.036 -0.048 0.625 -0.069 0.231 -0.090
-0.198 0.691 0.248
T0466: Like being here -0.044 0.003 0.617 -0.020 0.034 0.264
0.282 0.779 0.082
T0442: Teacher enforcement 0.063 -0.061 0.593 0.038 0.217 -0.053
-0.214 0.688 0.280
T0451: Generally satisfied -0.045 0.074 0.557 0.002 -0.024 0.438
0.314 0.663 0.189
T0455: Tardiness 0.053 -0.057 -0.021 0.902 -0.011 0.013
0.017 0.206 0.718
T0456: Absenteeism 0.026 -0.017 0.000 0.849 0.122 -0.033
0.017 0.127 0.866
T0457: Cutting -0.037 0.017 0.043 0.802 0.106 -0.005
-0.147 0.264 0.662
T0450: Tardiness/cutting -0.005 0.052 -0.024 0.626 -0.020 0.109
-0.037 0.208 0.758

10
Boyce & Bowers (2018)
T0461: Parent involvement 0.033 0.002 0.011 -0.006 0.819 0.034
0.214 0.002 0.880
T0463: Unprepared to learn 0.012 0.035 0.020 0.081 0.796 0.065
0.212 0.036 0.892
T0462: Poverty 0.001 -0.019 -0.084 -0.008 0.762 -0.025
0.245 -0.127 0.813
T0460: Student apathy 0.058 -0.020 0.038 0.084 0.650 0.055
-0.007 0.198 0.800
T0464: Student health -0.092 0.037 -0.023 0.096 0.608 0.019
0.239 -0.079 0.844
T0459: Dropping out -0.067 0.047 0.054 0.275 0.469 -0.040
-0.084 0.100 0.789
T0438: Parent support 0.092 0.039 0.166 -0.044 0.319 0.108
0.322 -0.005 0.833
T0468: Leave for higher pay 0.016 -0.017 -0.040 -0.024 0.001 0.779
0.433 0.163 0.216
T0470: Less enthusiasm 0.072 -0.032 0.056 -0.002 0.038 0.680
0.498 0.252 0.174
T0472: Become a teacher again 0.104 -0.033 -0.049 -0.036 0.042 0.666
0.333 0.114 0.234
T0465: Stress -0.040 0.029 0.251 0.063 -0.022 0.649
0.450 0.477 0.278
T0471: Consider staying home 0.001 -0.011 0.057 0.006 0.079 0.588
0.467 0.263 0.201
T0447: Job security -0.011 0.150 -0.090 0.105 0.116 0.196
0.498 -0.013 0.414
Factor correlations
Between level, collective teachers Factor 1 Factor 2 Factor 3
Factor 1 Instructional Leadership 1.000
Factor 2 Management 0.220 1.000
Factor 3 Social Environment 0.071 0.382 1.000
Within level, individual teachers Factor 1 Factor 2 Factor 3 Factor 4 Factor 5 Factor 6
Factor 1 School Influence 1.000
Factor 2 Classroom Control 0.360 1.000
Factor 3 Collegial Climate 0.447 0.257 1.000
Factor 4 Student Attendance 0.101 0.161 0.227 1.000
Factor 5 Neighborhood Context 0.198 0.147 0.260 0.490 1.000
Factor 6 Teacher Commitment 0.239 0.268 0.349 0.226 0.261 1.000
Note: All factor loadings are standardized. Bolded loadings were included in the final MCFA. All bolded loadings are significant at p < 0.05.
11
Boyce & Bowers (2018)
Table 2: Final multilevel confirmatory factor analysis model, confirmatory subsample four
Within level (individual teachers) Between level (collective teachers)
Indicator Factor 1
School
Influence
Factor 2
Classroom
Control
Factor 3
Collegial
Climate
Factor 4
Student
Attend.
Factor 5
Neigh.
Context
Factor 6
Teacher
Commit.
Factor 1
Instruct.
Leadership
Factor 2
Managem.
Factor 3
SocialEnv.
T0423: Evaluating 0.781
0.281 0.134
T0424: Hiring 0.622
0.582
T0426: Discipline 0.685
0.371
T0425: Budget 0.785
0.663
T0422: In-service PD 0.762
0.294 0.369
T0420: Performance standards 0.736
0.619 0.309
T0421: Curriculum 0.526 0.289
0.655
T0428: Content
0.748
0.488
T0429: Teaching
0.838
0.887
T0430: Grading
0.762
0.639
T0432: Homework
0.733
0.397
T0427: Textbooks
0.722
0.631
T0444: Principal knows
0.788
0.690
T0441: Principal enforcement
0.789
0.772
T0467: Like how school is run
0.869
1.000
T0435: Admin support
0.777
0.807
T0445: Cooperative effort
0.686
0.893
T0446: Recognition
0.784
0.859
T0443: Shared beliefs
0.586
0.813
T0466: Like being here
0.736
0.299 0.830
T0442: Teacher enforcement
0.692
0.752
T0451: Generally satisfied
0.512
0.395
0.400 0.772
T0455: Tardiness
0.863
0.830
T0456: Absenteeism
0.921
0.920
T0457: Cutting
0.895
0.762

12
Boyce & Bowers (2018)
T0450: Tardiness/cutting
0.623
0.863
T0461: Parent involvement
0.818
0.918
T0463: Unprepared to learn
0.887
0.949
T0462: Poverty
0.625
0.769
T0460: Student apathy
0.753
0.902
T0464: Student health
0.588
0.846
T0459: Dropping out
0.690
0.763
T0438: Parent support
0.558
0.233
0.747
T0468: Leave for higher pay
0.677
0.810
T0470: Less enthusiasm
0.736
0.788
T0472: Become a teacher again
0.644
0.725
T0465: Stress
0.860
0.540 0.594
T0471: Consider staying home
0.662
0.938
T0447: Job security
0.470
0.325
Factor correlations
Between level, collective teachers Factor 1 Factor 2 Factor 3
Factor 1 Instructional Leadership 1.000
Factor 2 Management 0.319 1.000
Factor 3 Social Environment 0.328 0.475 1.000
Within level, individual teachers Factor 1 Factor 2 Factor 3 Factor 4 Factor 5 Factor 6
Factor 1 School Influence 1.000
Factor 2 Classroom Control 0.516 1.000
Factor 3 Collegial Climate 0.567 0.306 1.000
Factor 4 Student Attendance 0.156 0.149 0.287 1.000
Factor 5 Neighborhood Context 0.330 0.231 0.458 0.636 1.000
Factor 6 Teacher Commitment 0.369 0.309 0.547 0.274 0.372 1.000
Note: All factor loadings are standardized. Bolded loadings met the |0.32| criterion for a significant factor loading in at least three of the confirmatory models. All loadings are
significant at p < 0.001.
13
Boyce & Bowers (2018)
In our third model for the MCFA we added in factor loadings
that were significant across two of the four exploratory models.
This resulted in a single between-level factor loading being
added to the model. The fit statistics did not significantly
change.
In our fourth and final model for the MCFA included factor
loadings that were significant in any single exploratory model,
fitting the full MEFA model from stage three with six level 1
individual teacher factors and three level 2 collective teacher
school factors. The final model fit the data reasonably well with
an average CFI across the randomly split confirmatory
subsamples of 0.886, average RMSEA of 0.023, average
SRMRwithin of 0.064, and average SRMRbetween of 0.125.
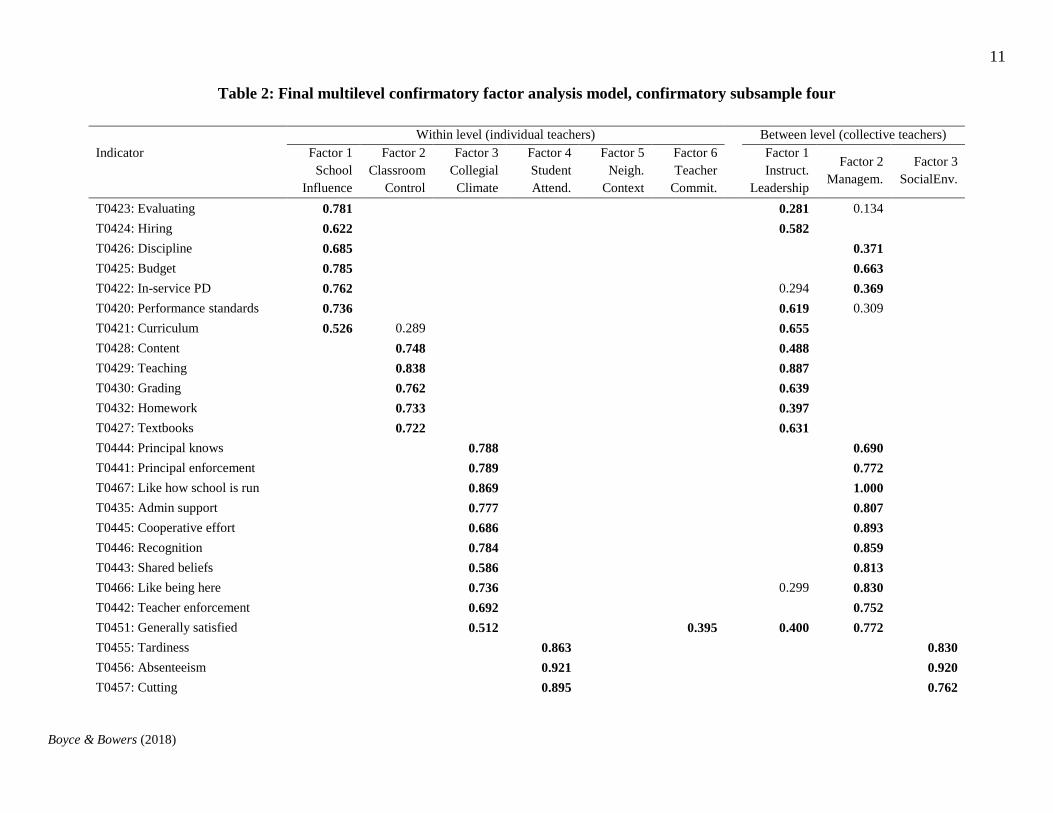
Table 2 provides the factor loadings and factor correlations for
the final multilevel confirmatory factor analysis, with six level 1
individual teacher factors and three level 2 collective teacher
school factors at the between level. We report the factor loadings
of the fourth confirmatory sample as that model had the best fit.
For our interpretation of the MCFA results, we interpreted only
factor loadings that met our criterion of |0.32| or higher for
significant loadings in at least three of the four confirmatory
models. Figure 1 illustrates the factor structure of both the within
level (individual teachers) and the between level (teachers
collectively). We detail our rationales for naming the factors
below.
Working from left to right in Table 2, we named the first within-
level individual teacher factor ‘school influence’ (Boyce &
Bowers, in press). All seven question items from the 2011–12
SASS section asking teachers for self-reports of school influence
were included in this factor and they were the only question
items to be included in this factor. This factor represents the
extent to which an individual teacher perceives herself as being
able to influence aspects of her school.
We named the second within-level individual teacher factor
‘classroom control’ (Boyce & Bowers, in press) for similar
reasons. The only difference is that one of the question items
related to classroom control (classroom control over disciplining
students, T0431) was removed from the model during the
trimming in stage three, so not all of the classroom control
question items were included in this factor. This factor
represents the extent to which an individual teacher perceives
herself as being able to control what happens in her classroom.
The third within-level individual teacher factor was significantly
more diverse in its question items. The themes running through
the question items include teacher’s views on the principal,
school administration, shared beliefs between the adults in the
school, and use words such as ‘supportive’, ‘encouraging’, and
‘recognized’ in describing how the adults in the school relate to
one another. We named this factor ‘collegial climate’ (Cohen &
Brown, 2013) given the wide scope of the question items. This
factor represents how an individual teacher perceives of her
attitudes and her relationships with her fellow school staff.
We named the fourth within-level individual teacher factor
‘student attendance’ (Roby, 2004) There were four question
items in the 2011–12 SASS that asked teachers about the extent
to which student tardiness, absenteeism, and/or class cutting was
a problem in the school and interfered with teaching. All four of
these question items were included in this factor and they were
the only question items to be included in this factor. This factor
represents how an individual teacher perceives of student
attendance in her school.
The fifth within-level individual teacher factor included question
items related to parental support, student apathy, students
coming to school unprepared, students dropping out, and non-
academic factors of poverty and poor student health. The focus
of these question items seemed to be related to factors that were
non-academic in nature and related to the external environment
of the school itself and the actions of people other than students
acting independently. We named this factor ‘neighborhood
context’ (Brooks-Gunn, 1997; Crowder & South, 2003; Epstein
et al., 2002; Harding, 2003; Leithwood & Riehl, 2003) to
attempt to capture the underlying meaning of these different
themes. This factor represents the extent to which an individual
teacher perceives of non-student external factors affect the
school environment.
We named the sixth within-level individual teacher factor
‘teacher commitment’ (Boyce & Bowers, in press) This decision
was based on past SASS literature that used this term to describe
teachers’ attitudes and behaviours around their professional
behaviour and likelihood of turnaround. One of the question
items included in this factor specifically asks teachers if they
would become a teacher again, which we identified as being
related to teachers’ professional commitment prior to performing
our analysis. Other question items relate to teachers leaving for a
higher paying job, thinking about staying home, and issues
around stress, disappointment, and tiredness from teaching.
Importantly, while one question item related to teacher
satisfaction did has a significant loading on this factor, both it
and the second question item related to teacher satisfaction both
had strong loadings on the collegial climate factor. This suggests
this factor does not describe teacher satisfaction, supporting our
naming of teacher commitment. This factor represents how an
individual teacher perceives of her professional fulfillment.
The six different within-level individual teacher factors all had
significant correlations between them (see Table 2). The
strongest correlations were between school influence and
classroom control (0.561), school influence and collegial climate
(0.567), collegial climate and teacher commitment (0.547),
collegial climate and neighborhood context (0.458), and
neighborhood context and student attendance (0.636). There
were weaker correlations between school influence and
neighborhood context (0.330), school influence and teacher
commitment (0.369), classroom control and collegial climate
(0.306), classroom control and teacher commitment (0.309), and
neighborhood context and teacher commitment (0.372). The
remaining correlations were below 0.300.

14
Boyce & Bowers (2018)
Figure 1: Factor structure of multilevel confirmatory factor analysis model
This is a visual representation of the information from Table 2. Circles represent the factors and rectangles represent indicators. All factors at both
levels are correlated with all other factors at that level.
T0428: Content
T0429: Teaching
T0430: Grading
T0432: Homework
T0427: Textbooks
T0468: Leave for higher pay
T0470: Less enthusiasm
T0472: Become a teacher again
T0471: Consider staying home
T0465: Stress
T0423: Evaluating
T0424: Hiring
T0420: Performance standards
T0421: Curriculum
T0426: Budget
T0425: Discipline
T0422: In-service PD
T0451: Generally satisfied
T0444: Principal knows
T0441: Principal enforcement
T0467: Like how school is run
T0435: Admin support
T0445: Cooperative effort
T0446: Recognition
T0443: Shared beliefs
T0466: Like being here
T0442: Teacher enforcement
T0447: Job security
T0455: Tardiness
T0456: Absenteeism
T0457: Cutting
T0450: Tardiness/cutting
T0461: Parent involvement
T0463: Unprepared to learn
T0462: Poverty
T0460: Student apathy
T0464: Student health
T0459: Dropping out
T0438: Parent support
Classroom
Control
Teacher
Commitment
School
Influence
Collegial
Climate
Student
Attendance
Neighborhood
Context
Instructional
Leadership
Management
Social
Environment
Within level (individual teachers) Between level (collective teachers)

15
Boyce & Bowers (2018)
The first between-level collective teacher factor included the
entire classroom control factor, the entire teacher commitment
factor, and the question items from the school influence factor
relating to teachers, curriculum, and performance standards for
students. Additionally, it included a question item relating to
school performance on state and/or local tests that did not load
on any of the within-level factors (T0447). Given these loadings,
we named this factor ‘instructional leadership’ (Hallinger &
Murphy, 1985). The focus of the factor appears to be related to
what happens in teachers’ classrooms, instructional aspects of
school-wide decision-making, and student performance. The
inclusion of the within-level teacher commitment factor in this
between-level factor suggests that teachers’ professional
commitment is very strongly related to the degree to which they
are involved in the instructional leadership of their schools. This
factor represents the extent to which the collective faculty of a
school feels it can impact the core instructional program of its
school. Based on Dyer et al.’s (2005) MLFA framework, this
collective teacher factor is a compilation factor as there is no
equivalent factor at the individual level. The instructional
leadership factor is unique to the between-level factor structure.
The second between-level collective teacher factor included the
entire collegial climate factor, the question items from the school
influence factor relating to in-service professional development
programs, discipline policy, and school budgeting, and one
question item from teacher commitment for whether or not the
stress and disappointments of teaching at one’s school were
worth it. Given these loadings, we named this factor
‘management’ (Murphy et al., 2006, 2007). The focus of the
factor appears to be related to how the adults relate to one
another and the non-instructional aspects of school-wide
decision-making. This factor represents the extent to which the
collective faculty of a school feels that it can impact the
management of the school and the extent to which the school is
well-managed. Based on Dyer et al.’s (2005) MLFA framework,
this collective teacher factor is a compilation factor as there is no
equivalent factor at the individual level. The management factor
is unique to the between-level factor structure.
The third between-level collective teacher factor included the
entire student attendance factor, the entire neighborhood context
factor, and a question item relating to school performance on
state and/or local tests that did not load on any of the within-
level factors (T0447). The focus of the factor appears to be the
union of students’ behaviour and the behaviours of people
external to schools who have high levels of influence on
students. We combined these meanings in naming this factor
‘social environment’ (Epstein et al., 2002; Leithwood & Riehl,
2003; Paulsen, 1991; Ryan & Patrick, 2001; Trickett & Moos,
1973; Yen & Syme, 1999). This factor represents the extent to
which the collective faculty of a school perceives of external
factors in general affect the school environment. Based on Dyer
et al.’s (2005) MLFA framework, this collective teacher factor is
a compilation factor as there is no equivalent factor at the
individual level. The social environment factor is unique to the
between-level factor structure.
The three different between-level collective teacher factors all
had significant correlations between them (see Table 2). The
strongest correlation was between management and social
environment (0.475). There were weaker correlations between
instructional leadership and management (0.319) and
instructional leadership and social environment (0.328).
DISCUSSION: The present study represents the first study of the most recent
administration of SASS to employ multilevel factor analysis
with cross-validation in order to understand how teachers both
individually and collectively perceive leadership for learning in
their schools. We found six factors at the within level (individual
teachers, also referred to as level 1): school influence, classroom
control, collegial climate, student attendance, neighborhood
context, and teacher commitment. We found three factors at the
between level (teachers collectively, also referred to as level 2):
instructional leadership, management, and social environment.
This study demonstrates the strength of multilevel factor
analysis in both accurately modeling how teachers within
schools perceive leadership for learning and in providing
significant insight into how individual teachers perceive their
environments differently from how schools’ faculties perceive
their environments.
Dyer et al.’s (2005) multilevel factor typology is a useful lens to
apply to help understand how individual teachers differ from
teachers collectively. Dyer et al. (2005) posit that there are three
different types of between-level factors: composition factors that
are functionally the same at both the level of the individual
teachers and the level of schools, compilation factors that are
only meaningful at the level of a school’s faculty, and fuzzy
factors that are partially isomorphic between the individual and
collective levels. Based on the results of our analysis, the level 2
collective teacher factors appear to all be compilation factors
with no specific representation at the level 1 individual teacher
level, as none of the school-level teacher collective factors have
isomorphic relationships with factors at the individual teacher
level (see Figure 1).
Our findings suggest that a school’s faculty (operating at the
between level, or the collective level) has represents a functional
view of leadership for learning (Morgeson, DeRue, & Karam,
2009) in a way that is qualitatively different from how individual
teachers conceive of leadership for learning. Teachers
collectively see leadership for learning as relating to three
different functions of a school: carrying out the instructional
program of the school (instructional leadership factor),
performing non-instructional tasks in support of the instructional
program (management factor), and engaging with the larger
16
Boyce & Bowers (2018)
context of the school (social environment factor). This supports
the conceptualization of educational leadership as an
organizational function rather than a specific collection of tasks
and activities (Gronn, 2002a, 2002b; Spillane et al., 2001, 2004).
In contrast to this, individual teachers perceive of leadership for
learning as being more related to specific areas of influence
(Boyce & Bowers, in press; Everitt, 2005; Ni, 2012; Rosen,
2007; Skinner, 2008; Smith & Rowley 2005). Individual
teachers are more aware of whether or not particular leadership
tasks are being enacted (within classrooms or across entire
schools) than they are aware of the specific function that the
leadership task is fulfilling. Similarly, individual teachers have a
more fine-grained awareness of the differences between
contextual forces that impact student learning, namely seeing
student attendance and neighborhood context as separate
constructs rather than viewing them as a single interrelated
construct.
These findings may speak to educational sociological theories
around emergent properties (Jacobson & Wilensky, 2006; Lesh,
2006; Wilmott, 1999). The concept of emergent properties is that
there are certain system-level functions and effects that can only
be observed through the networked interaction of the actors
within that system (Jacobson & Wilensky, 2006; Lesh, 2006;
Wilmott, 1999). The lack of isomorphisms between the
individual- and collective-level factors in our findings could be
the result of the three collective factors being emergent
properties of faculties in schools. This would speak to why there
are no isomorphisms between the two levels and why individual
teachers have an areas of influence view of leadership for
learning while teachers collectively have a more functional view
of leadership. Given that some school leadership functions occur
at the level of the organization and not the level of the individual
(Murphy et al., 2006, 2007; Spillane et al., 2001, 2004), it is
possible that teachers engage with these leadership functions
through emergent properties around their collective leadership
function.
The present study highlights that one of the fundamental
elements of the original instructional leadership framework
(Hallinger & Murphy, 1985) still holds true in current
conceptions of leadership for learning (Halverson & Dikkers,
2011; Kelley & Halverson, 2012; Murphy et al., 2006, 2007).
Hallinger and Murphy (1985) put forth that instructional
leadership was a superordinate function of the school relative to
the teachers. In other words, instructional leadership was
something that individual teachers did not enact, but something
that was enacted above their organizational level. The present
study supports this proposition by demonstrating that teachers
collectively can perceive instructional leadership in a way that
individual teachers cannot. This study also speaks directly to the
relationship between instructional leadership (Hallinger &
Murphy, 1985) and leadership for learning (Halverson &
Dikkers, 2011; Kelley & Halverson, 2012; Murphy et al., 2006,
2007). Specifically, these findings are in alignment with past
educational leadership research that suggests the instructional
leadership framework is a subset of the larger leadership for
learning framework (Boyce & Bowers, in press).
Beyond the existence of the factors themselves, the correlations
between the factors speak directly to past leadership literature.
At the individual level, one of the strongest correlations is
between individual-level teacher school influence and collegial
climate (0.567). This supports past findings of teachers’
autonomy and influence within schools influencing the adult
development of teachers more than other instructional leadership
factors (Boyce & Bowers, in press; Cannata, 2007; Hunt, 2003;
Weathers, 2011). The correlation between collegial climate and
teacher commitment is similar (0.547), suggesting that the nature
and quality of the interpersonal relationships between the adult
members of the schools are important to each teachers’ own
intrapersonal relationships between herself and her job. This
could tie into past literature regarding Leader-Member Exchange
theory (LMX) and the body of LMX literature that has found
powerful connections between interpersonal relationships,
intrapersonal dispositions, organizational performance, and
individual performance (Gerstner & Day, 1997; Graen, Novak,
& Sommerkamp, 1982; Graen & Uhl-Bien, 1995; Wayne, Shore,
& Liden, 1997).
This study also speaks to current educational leadership research
related to the collective action of teachers in the form of
professional learning communities (PLCs) (Hairon, Goh, &
Chua, 2015; Murphy, 2015). PLCs have been shown to serve
significant organizational roles within schools, such as allowing
teachers to collectively enact instructional leadership tasks
(Hairon et al., 2015). Additionally, research into PLCs has
shown that they are structures that promote the development of
positive, professional relationships and individual teacher
learning (Hairon et al., 2015). The questions of how and why
PLCs can effectively serve both organizational and individual
roles with supporting and developing teacher leadership have
been stymied by a lack of valid constructs that allow for deep
and meaningful theoretical frameworks to be developed (Harion
et al., 2015). The results of the present study directly inform this
body of literature by providing empirical individual and
aggregate teacher leadership factors.
Beyond providing a link between collective and individual
teacher leadership, PLCs also provide a crucial link between
principal leadership and teacher leadership (Murphy, 2015).
Effective school leadership relies on having structures in place
for the practice of collaborative leadership that includes both
principals and teachers (Drago-Severson, 2004; Murphy, 2015).
This is because principals serve complex dual roles in schools,
existing as both the formal leaders of school communities while
also being active members of the communities that they lead
(Marks & Printy, 2003; Printy et al., 2009). This requires
principals to lead by example through ways that direct the
development of their teachers while simultaneously empowering
teachers as leaders themselves (Drago-Severson, 2004; Murphy,
2015). Effective PLCs can serve as structures for principals and
teachers to collaborate in ways that support both principal and

17
Boyce & Bowers (2018)
teacher leadership (Hairon et al., 2015; Murphy, 2015). The
present study can inform leadership practice by providing a
grounded understanding of how to structure PLCs. The
collective teacher factors of instructional leadership,
management, and social environment provide a grounding for
how schools might structure the overarching functions and goals
of PLCs and areas in which principals can directly model
leadership behaviours in developing their teachers as leaders.
Similarly, the individual teacher factors of school influence,
classroom control, collegial climate, and student attendance
might structure how the individual teachers carry out the
collective leadership decisions made in PLCs as a communal
effort that principals support without necessarily directly
involving themselves.
There are important methodological implications that follow
from our results in addition to the conceptual implications. Past
educational leadership research has had methodological
difficulties in correctly modeling nested data, leading to both
empirical and methodological difficulties in addressing
aggregate constructs in educational leadership (Boyce &
Bowers, in press; Heck & Hallinger, 2014; Leithwood & Jantzi,
2008; Urick & Bowers, 2011, 2014b). This paper addresses
these issues by providing the beginnings of a multilevel theory
of different levels of leadership for learning (Chan, 1998; Chen,
Bliese, & Mathieu, 2005; Dyer et al., 2005; Mumford, 1998) that
is empirically grounded in a nationally generalizable dataset.
This addresses past issues with empirically investigating
different pathways of school leadership (Hallinger & Heck,
2011; Heck & Hallinger, 2009) by, for example, providing a
starting point for future research employing multilevel structural
equation modeling (Kline, 2010), a method well-suited to
exploring the relationships and pathways of leadership for
learning.
Another important methodological implication is with respect to
factors in education research. Similarly to aggregating individual
responses to the school level by simply averaging them together,
some researchers employ measures that are intended to measure
group-level constructs using individual-level factor analysis to
justify the instrument (e.g., Goddard, Hoy & Hoy, 2000) (Chan,
1998; Chen, Bliese, & Mathieu, 2005; Dyer et al., 2005;
Mumford, 1998). The present study demonstrates that these
statistical findings may not be sufficient justification for using
such measures. Specifically, a factor that holds together well at
the individual level is not guaranteed to hold together well at the
collective level (Chan, 1998; Chen, Bliese, & Mathieu, 2005;
Dyer et al., 2005; Mumford, 1998). As discussed above,
teachers’ perceptions of their school influence is an example of
an individual-level factor that has no analogue at the collective
level. Given this, researchers who want to accurately measure
collective constructs should be certain to employ appropriate
multilevel modeling practices to determine whether or not
particular factors of interest are being accurately modeled at the
appropriate level.
Limitations
One potential limitation of the study is with our cluster size. In
conducting our analysis, the between-level modeling was
challenging, as evidenced by the number of between-level cross-
loaded factors during stage two and the MCFA SRMRbetween
statistics being above our desired threshold in stage four. These
suggest that our statistical models may have had difficulty with
accurately modeling between-level factors, which may be able to
be improved through increased cluster size.
The second potential limitation of the present study is that the
factor structure is constrained by the questions asked in the
2011–12 administration of SASS. The 2011–12 SASS was
selected for this study because it asks teachers a wide-ranging
collection of questions related to leadership for learning, of
which we included 49 of the question items as indicators in our
analytic model. That said, there are other datasets that ask
different sets of questions that may provide different insights
into teachers’ perceptions. We encourage further research into
teachers’ perceptions of leadership for learning using different
datasets to determine whether or not the factors we found in the
present study are consistent across different measures.
A third potential limitation of the present study is the lack of
principal perceptions included in our analysis. We attempted
several times to include 2011–12 SASS principal perceptions in
the present study, yet encountered several problems in
attempting factor analysis on the principal data: some factors
consistently did not have any strong loadings on any of their
indicators, some factors had only one or two indicators, some
models would not stabilize after even several rounds of trimming
(i.e., after removing indicators that did not have any significant
loadings the next round of models would have new indicators
without any significant loadings, and so on), and the trimming
process sometimes removed almost entire sections of the
principal survey. We encourage further research along this line
using other datasets that may be more amenable to principal and
teacher comparative factor analysis, such as TALIS (OECD,
2014).
Conclusion
In conclusion, this study found that there are important
differences in how individual teachers and teachers collective
perceive of leadership for learning in their schools. Individual
teachers viewed leadership for learning as being a combination
of school influence, classroom control, collegial climate, student
attendance, neighborhood context, and teacher commitment,
whereas teachers collectively viewed leadership for learning as
being a combination of instructional leadership, management,
and social environment.
This study has strong implications for research, policy, and
practice. For research, our results highlight the importance of
using multilevel modeling techniques in understanding
educational leadership. In particular, this study demonstrates that
there are important conceptual differences between how
individuals and groups perceive their environments. For policy,
18
Boyce & Bowers (2018)
this study highlights the difficulty in performing school-level
interventions. As said succinctly by O’Day (2002, p. 295): ‘The
school is the unit of intervention, yet the individual is the unit of
action.’ There are differences and tensions between how to
motivate the faculty of a school and how to motivate individual
teachers in their classrooms (O’Day, 2002), which is in strong
alignment with our findings regarding teacher commitment.
Future policy initiatives and analyses need to account for the
difference between how teachers and schools operate at the
individual and collective levels. For practice, this study informs
principals and other education leaders that effective school
leadership must address the needs of both the individual adults
in the schools and the adults as a collective body. Individual and
collective sense-making processes have significant differences,
both of which are important to attend to in running effective
schools.
Suggested Citation: Boyce, J., Bowers, A.J. (2018) Different Levels of Leadership
for Learning: Investigating Differences Between Teachers
Individually and Collectively Using Multilevel Factor Analysis
of the 2011-12 Schools and Staffing Survey. International
Journal of Leadership in Education, 21(2), p.197-225.
http://doi.org/10.1080/13603124.2016.1139187
REFERENCES: Avolio, B. J., & Bass, B. M. (1995). Individual consideration
viewed at multiple levels of analysis: A multi-level
framework for examining the diffusion of transformational
leadership. Monographs in Organizational Behavior and
Industrial Relations, 24, 53–74.
Arlot, S., & Celisse, A. (2010). A survey of cross-validation
procedures for model selection. Statistics Surveys, 4, 40–79.
Asparouhov, T. (2006). General multilevel modeling with
sampling weights. Communications in Statistics: Theory
and Methods, 35(3), 439– 460.
Asparouhov, T., Muthén, B., & Muthén, L. (2004). Weighting
for unequal probability of selection in multilevel modeling.
Mplus Web Notes, 8. Retrieved from:
http://www.statmodel.com/download/webnotes/MplusNote8
1.pdf
Bandalos, D. L., & Boehm-Kaufman, M. R. (2009). Four
common misconceptions in exploratory factor analysis. In
C. E. Lance & R. J. Vandenberg (Eds.), Statistical and
methodological myths and urban legends: Doctrine, verity
and fable in the organizational and social sciences(pp. 61–
87). New York, NY: Routledge.
Barendse, M. T., Oort, F. J., & Timmerman, M. E. (2015). Using
exploratory factor analysis to determine the dimensionality
of discrete responses. Structural Equation Modeling: A
Multidisciplinary Journal, 22(1), 87–101.
Bell, B. A., Ferron, J. M., & Kromrey, J. D. (2008). Cluster size
in multilevel models: The impact of sparse data structures
on point and interval estimates in two-level models.
Proceedings of the Joint Statistical Meetings (pp. 1122–
1129). Alexandria, VA: American Statistical Association.
Bentler, P. M. (1980). Multivariate analysis with latent
variables: Causal modeling. Annual Review of
Psychology, 31(1), 419–456.
Bentler, P. M. (1992). On the fit of models to covariances and
methodology to the Bulletin. Psychological Bulletin, 112(3),
400.
Bliese, P. D. (2000). Within-group agreement, non-
independence, and reliability: Implications for data
aggregation and analysis. In K. J. Klein & S. W. J.
Kozlowski (Eds.), Multilevel theory, research, and methods
in organizations (pp. 349–381). San Francisco, CA: Jossey-
Bass.
Breiman, L., & Spector, P. (1992). Submodel selection and
evaluation in regression. The X-random case. International
Statistical Review/Revue Internationale de Statistique,
60(3), 291–319.
Brooks-Gunn, J. (1997). Neighborhood poverty, volume 1:
Context and consequences for children (Vol. 1). Russell
Sage Foundation.
Browne, M. W., & Cudeck, R. (1993). Alternative ways of
assessing model fit. In K. A. Bollen & J. S. Long (Eds.),
Testing structural equation models (pp. 136–162).
Newsbury Park, CA: Sage.
Brown, T. A. (2014). Confirmatory factor analysis for applied
research. New York, NY: Guilford Publications.
Bowers, A. J., Blitz, M., Modest, M., Salisbury, J., & Halverson,
R. (2017). How Leaders Agree with Teachers in Schools on
Measures of Leadership Practice: A Two-Level Latent Class
Analysis of the Comprehensive Assessment of Leadership
for Learning. Teachers College Record, 119(4).
http://www.tcrecord.org/Content.asp?ContentId=21677
Boyce, J., Bowers, A.J. (in press) Towards an Evolving
Conceptualization of Instructional Leadership as Leadership
for Learning: Meta-Narrative Review of 109 Quantitative
Studies Across 25 Years. Journal of Educational
Administration. https://doi.org/10.1108/JEA-06-2016-0064
Cannata, M. (2007). Teacher community in elementary charter
schools. Education Policy Analysis Archives, 15(11), 1–29.
Chan, D. (1998). Functional relations among constructs in the
same content domain at different levels of analysis: A
typology of composition models. Journal of Applied
Psychology, 83(2), 234.
Chen, G., Bliese, P. D., & Mathieu, J. E. (2005). Conceptual
framework and statistical procedures for delineating and
testing multilevel theories of homology. Organizational
Research Methods, 8(4), 375–409.
Cohen, J. (1992). A power primer. Psychological
Bulletin, 112(1), 155.
Cohen, J. (2013). Statistical power analysis for the behavioral
sciences. New York, NY: Academic Press.
Cohen, J., & Brown, P. (2013). School climate and adult
learning. In T. Dary and T. Pickeral (Eds.), School Climate
Practices for Implementation and Sustainability (pp. 52–
56). A School Climate Practice Brief, Number 1. New York,
NY: National School Climate Center.
19
Boyce & Bowers (2018)
Crowder, K., & South, S. J. (2003). Neighborhood distress and
school dropout: The variable significance of community
context. Social Science Research, 32(4), 659-698.
D'haenens, E., Van Damme, J., & Onghena, P. (2010).
Multilevel exploratory factor analysis: Illustrating its
surplus value in educational effectiveness research. School
Effectiveness and School Improvement, 21(2), 209–235.
DiStefano, C., & Morgan, G. B. (2014). A comparison of
diagonal weighted least squares robust estimation
techniques for ordinal data. Structural Equation Modeling:
A Multidisciplinary Journal, 21(3), 425–438.
Dorfman, P. W., Hanges, P. J., & Brodbeck, F. C. (2004).
Leadership and cultural variation: The identification of
culturally endorsed leadership profiles. In R. J. House, P. J.
Hanges, M. Javidan, P. W. Dorfman & V. Gupta (Eds.),
Culture, leadership, and organizations: The GLOBE study
of 62 societies (pp. 669–719). Thousand Oaks, CA: Sage.
Drago–Severson, E. (2004). Helping teachers learn: Principal
leadership for adult growth and development. Thousand
Oaks, CA: Corwin Press.
Dunn, E. C., Masyn, K. E., Jones, S. M., Subramanian, S. V., &
Koenen, K. C. (2014). Measuring psychosocial
environments using individual responses: An application of
multilevel factor analysis to examining students in schools.
Prevention Science, 1–16.
Dyer, N. G., Hanges, P. J., & Hall, R. J. (2005). Applying
multilevel confirmatory factor analysis techniques to the
study of leadership. The Leadership Quarterly, 16(1), 149–
167.
Dziak, J. J., Lanza, S. T., & Tan, X. (2014). Effect size,
statistical power, and sample size requirements for the
bootstrap likelihood ratio test in latent class analysis.
Structural Equation Modeling: A Multidisciplinary
Journal, 21(4), 534–552.
Epstein, J. L., Sanders, M. G., Simon, B. S., Salinas, K. C.,
Jansorn, N. R., & Van Voorhis, F. L. (2002). School, family,
and community partnerships: Your handbook for action.
Thousand Oaks, CA: Corwin Press.
Everitt, J. (2005). Control in the classroom and influence on
school policies: Types of teacher autonomy and teacher
attrition. Washington, DC: American Sociological
Association.
Gerstner, C. R., & Day, D. V. (1997). Meta-analytic review of
leader–member exchange theory: Correlates and construct
issues. Journal of Applied Psychology, 82(6), 827.
Goddard, R. D., Hoy, W. K., & Hoy, A. W. (2000). Collective
teacher efficacy: Its meaning, measure, and impact on
student achievement. American Educational Research
Journal, 37(2), 479–507.
Goff, P. T., Goldring, E., & Bickman, L. (2014). Predicting the
gap: Perceptual congruence between American principals
and their teachers’ ratings of leadership
effectiveness. Educational Assessment, Evaluation and
Accountability, 26(4), 333–359.
Goldring, R., Gray, L., & Bitterman, A. (2013). Characteristics
of public and private elementary and secondary school
teachers in the United States: Results from the 2011–12
schools and staffing survey. First Look. (NCES 2013-
14). Washington DC: National Center for Education
Statistics.
Goldring, R., Taie, S., Rizzo, L., Colby, D., Fraser, A., &
Chandler, K. (2013). User’s manual for the 2011–12
schools and staffing survey. Washington, DC: National
Center for Education Statistics.
Graen, G., Novak, M. A., & Sommerkamp, P. (1982). The
effects of leader—member exchange and job design on
productivity and satisfaction: Testing a dual attachment
model. Organizational Behavior and Human Performance,
30(1), 109–131.
Graen, G. B., & Uhl-Bien, M. (1995). Relationship-based
approach to leadership: Development of leader-member
exchange (LMX) theory of leadership over 25 years:
Applying a multi-level multi-domain perspective. The
Leadership Quarterly, 6(2), 219–247.
Gronn, P. (2002a). Distributed leadership. In K. A. Leithwood &
P. Hallinger (Eds.), Second international handbook of
educational leadership and administration (pp. 653-696).
Dordrecht, The Netherlands: Springer.
Gronn, P. (2002b). Distributed leadership as a unit of
analysis. The Leadership Quarterly, 13(4), 423–451.
Gustafsson, J.-E., & Stahl, P.A. (2005). STREAMS 2.0 user’s
guide. Mölndal, Sweden: MultivariateWare.
Hairon, S., Goh, J. W. P., & Chua, C. S. K. (2015). Teacher
leadership enactment in professional learning community
contexts: Towards a better understanding of the
phenomenon. School Leadership & Management. doi:
10.1080/13632434.2014.992776
Hallinger, P. (2010). A review of three decades of doctoral
studies using the principal instructional management rating
scale: A lens on methodological progress in educational
leadership. Educational Administration Quarterly.
0013161X10383412.
Hallinger, P. (2011). Leadership for learning: Lessons from 40
years of empirical research. Journal of Educational
Administration, 49(2), 125–142.
Hallinger, P., & Heck, R. H. (1996). Reassessing the principal's
role in school effectiveness: A review of empirical research,
1980–1995. Educational Administration Quarterly, 32(1),
5–44.
Hallinger, P., & Heck, R. H. (2010). Leadership for learning:
Does collaborative leadership make a difference in school
improvement?. Educational Management Administration &
Leadership, 38(6), 654–678.
Hallinger, P., & Heck, R. H. (2011). Conceptual and
methodological issues in studying school leadership effects
as a reciprocal process. School Effectiveness and School
Improvement, 22(2), 149–173.
Hallinger, P., & Murphy, J. (1985). Assessing the instructional
management behavior of principals. The Elementary School
Journal, 86(2), 217–247.
Halverson, R. & Dikkers, S. (2011) Comprehensive assessment
of leadership for learning (CALL): Development and design
of an online, formative assessment and feedback system for
middle and high school leadership. Annual Conference of

20
Boyce & Bowers (2018)
the American Education Research Association. New
Orleans, LA. April 2011.
Halverson, R., Kelley, C., & Shaw, J. (2014). A CALL for
improved school leadership. Phi Delta Kappan, 95(6), 57–
60.
Harding, D. J. (2003). Counterfactual models of neighborhood
effects: the effect of neighborhood poverty on dropping out
and teenage pregnancy. American Journal of Sociology,
109(3), 676-719.
Harman, H. H. (1960). Modern factor analysis. Chicago, IL: The
University of Chicago Press.
Hayton, J. C., Allen, D. G., & Scarpello, V. (2004). Factor
retention decisions in exploratory factor analysis: A tutorial
on parallel analysis. Organizational Research
Methods, 7(2), 191–205.
Heck, R. H., & Hallinger, P. (2009). Assessing the contribution
of distributed leadership to school improvement and growth
in math achievement. American Educational Research
Journal, 46(3), 659–689.
Heck, R. H., & Hallinger, P. (2010). Collaborative leadership
effects on school improvement: Integrating unidirectional-
and reciprocal-effects models. The Elementary School
Journal, 111(2), 226–252.
Heck, R. H., & Hallinger, P. (2014). Modeling the longitudinal
effects of school leadership on teaching and
learning. Journal of Educational Administration, 52(5),
653–681.
Heck, R. H., & Moriyama, K. (2010). Examining relationships
among elementary schools' contexts, leadership,
instructional practices, and added-year outcomes: A
regression discontinuity approach. School Effectiveness and
School Improvement, 21(4), 377–408.
Hendriks, M., & Steen, R. (2012). Results from school
leadership effectiveness studies (2005–2010). In J.
Scheerens (Ed.), School Leadership Effects Revisited (pp.
65–129). Dordrecht, The Netherlands: Springer.
Howell, J. M., & Avolio, B. J. (1993). Transformational
leadership, transactional leadership, locus of control, and
support for innovation: Key predictors of consolidated-
business-unit performance. Journal of applied
psychology, 78(6), 891.
Hox, J. (2010). Multilevel analysis: Techniques and applications
(Second ed.). New York, NY: Routledge.
Hu, L. T., & Bentler, P. M. (1999). Cutoff criteria for fit indexes
in covariance structure analysis: Conventional criteria
versus new alternatives. Structural Equation Modeling: A
Multidisciplinary Journal, 6(1), 1–55.
Hunt, D. J. (2003). Social capital and teacher perceptions of
curricular control. State University of New York at Albany.
Jacobson, M. J., & Wilensky, U. (2006). Complex systems in
education: Scientific and educational importance and
implications for the learning sciences. The Journal of the
Learning Sciences, 15(1), 11–34.
Jöreskog, K. G., & Sörbom, D. (1981). LISREL V: Analysis of
linear structural relationships by maximum likelihood and
least squares methods. Chicago, IL: National Educational
Resources Chicago.
Kaplan, D., & Elliott, P. R. (1997). A model-based approach to
validating education indicators using multilevel structural
equation modeling. Journal of Educational and Behavioral
Statistics, 22(3), 323–347.
Kelley, C., & Halverson, R. (2012). The comprehensive
assessment of leadership for learning: A next generation
formative evaluation and feedback system. Journal of
Applied Research on Children: Informing Policy for
Children at Risk, 3(2), 4.
Kim, J. O., & Mueller, C. W. (1978). Introduction to factor
analysis: What it is and how to do it (Vol. 13). Beverly
Hills, CA: Sage.
Kline, R. (2010). Principles and practice of structural equation
modeling (3rd Ed.). New York, NY: Guilford Press.
Knapp, M. S., Copland, M. A., & Talbert, J. E. (2003). Leading
for learning: Reflective tools for school and district leaders.
Center for the Study of Teaching and Policy, University of
Washington.
Kohavi, R. (1995, August). A study of cross-validation and
bootstrap for accuracy estimation and model selection.
International Journal of Computer Applications, 14( 2),
1137–1145).
Krüger, M., & Scheerens, J. (2012). Conceptual perspectives on
school leadership. In J. Scheerens (Ed.), School leadership
effects revisited: Review and meta-analysis of empirical
studies (pp. 1–31). London: Springer.
Leithwood, K., & Jantzi, D. (2008). Linking leadership to
student learning: The contributions of leader efficacy.
Educational Administration Quarterly, 44(4), 496–528.
Leithwood, K., Mascall, B., & Strauss, T. (2009). What we have
learned and where we go from here. In K. Leithwood, B.
Mascall, & T. Strauss (Eds.), Distributed leadership
according to the evidence (pp. 269–282). New York, NY:
Routledge.
Leithwood, K. A., & Riehl, C. (2003). What we know about
successful school leadership. Nottingham: National College
for School Leadership.
Leithwood, K., & Seashore-Louis, K. (2011). Linking leadership
to student learning. Hoboken, NJ: John Wiley & Sons.
Lesh, R. (2006). Modeling students modeling abilities: The
teaching and learning of complex systems in education. The
Journal of the Learning Sciences, 15(1), 45–52.
MacCallum, R. C., Browne, M. W., & Sugawara, H. M. (1996).
Power analysis and determination of sample size for
covariance structure modeling. Psychological
Methods, 1(2), 130.
Maas, C. J., & Hox, J. J. (2005). Sufficient sample sizes for
multilevel modeling. Methodology: European Journal of
Research Methods for the Behavioral and Social
Sciences, 1(3), 86.
Marks, H. M., & Printy, S. M. (2003). Principal leadership and
school performance: An integration of transformational and
instructional leadership. Educational Administration
Quarterly, 39(3), 370–397.
Marsh, H. W., Hau, K. T., & Wen, Z. (2004). In search of
golden rules: Comment on hypothesis-testing approaches to
setting cutoff values for fit indexes and dangers in

21
Boyce & Bowers (2018)
overgeneralizing Hu and Bentler's (1999) findings.
Structural Equation Modeling, 11(3), 320–341.
Marzano, R. J., Waters, T., & McNulty, B. A. (2005). School
leadership that works: From research to results.
Association for Supervision and Curriculum Development.
1703 North Beauregard Street, Alexandria, VA 22311-1714.
Morgeson, F. P., DeRue, D. S., & Karam, E. P. (2009).
Leadership in teams: A functional approach to
understanding leadership structures and processes. Journal
of Management, 36(1), 5–39.
Mumford, M. D. (1998). Situations, interactions, and followers:
The case of individualized leadership. Monographs in
Organizational Behavior and Industrial Relations, 24, 421–
428.
Murphy, J. (2015). Creating communities of professionalism:
Addressing cultural and structural barriers. Journal of
Educational Administration, 53(2), 154–176.
Murphy, J., Elliott, S. N., Goldring, E., & Porter, A. C. (2006).
Learning-centered leadership: A conceptual
foundation. Learning Sciences Institute, Vanderbilt
University (NJ1).
Murphy, J., Elliott, S. N., Goldring, E., & Porter, A. C. (2007).
Leadership for learning: A research-based model and
taxonomy of behaviors 1. School Leadership and
Management, 27(2), 179–201.
Muthén, B. O. (1991). Multilevel factor analysis of class and
student achievement components. Journal of Educational
Measurement, 28(4), 338–354.
Muthén, B. O. (1994). Multilevel covariance structure
analysis. Sociological Methods & Research, 22(3), 376–
398.
Muthén, B. O., & Asparouhov, T. (2011). Beyond multilevel
regression modeling: Multilevel analysis in a general latent
variable framework. In J.J. Hox (Ed.), Handbook of
advanced multilevel analysis (pp. 15–40). New York, NY:
Routledge.
Muthén, L. K., & Muthén, B. O. (1998–2015). Mplus user’s
guide: The comprehensive modeling program for applied
researchers. Los Angeles: Muthen & Muthen.
National Center for Education Statistics (NCES). (1991). 1987–
88 Schools and staffing survey user's manual. Retrieved
from: http://nces.ed.gov/surveys/sass/pdf/SASS8788.pdf
National Center for Education Statistics (NCES). (2011a).
Restricted-use data procedures manual. Washington, DC:
National Center for Education Statistics. Retrieved from:
http://nces.ed.gov/pubs96/96860rev.pdf
National Center for Education Statistics (NCES). (2011b).
Teacher questionnaire, schools and staffing survey, 2011–
12 school year. Washington, DC: National Center for
Education Statistics. Retrieved from:
http://nces.ed.gov/surveys/sass/pdf/1112/SASS4A.pdf
Neumerski, C. M. (2013). Rethinking instructional leadership, a
review: What do we know about principal, teacher, and
coach instructional leadership, and where should we go
from here? Educational Administration Quarterly, 49(2),
310–347.
Ni, Y. (2012). Teacher working conditions in charter schools
and traditional public schools: A comparative study.
Teachers College Record, 114(3), 1–26.
O'Day, J. A. (2002). Complexity, accountability, and school
improvement. Harvard Educational Review, 72(3), 293–
329.
Organisation for Economic Co-operation and Development
(OECD). (2014). TALIS. Retrieved from:
http://www.oecd.org/edu/school/talis.htm
Paulsen, R. (1991). Education, social class, and participation in
collective action. Sociology of Education, 96-110.
Porter, A. C., Polikoff, M. S., Goldring, E., Murphy, J., Elliott,
S. N., & May, H. (2010). Developing a psychometrically
sound assessment of school leadership: The VAL-ED as a
case study. Educational Administration Quarterly, 46(2),
135–173.
Price, H.E. (2015). Principals’ social interactions with teachers:
How principal-teacher social relations correlate with
teachers’ perceptions of student engagement. Journal of
Educational Administration, 53(1). 116–139.
Price, H.E., & Moolenaar, N.M. (2015). Principal-teacher
relationships: foregrounding the international importance of
principals’ social relationships for school learning climates.
Journal of Educational Administration, 53(1).
Printy, S. M., Marks, H. M., & Bowers, A. J. (2009). Integrated
leadership: How principals and teachers share
transformational and instructional influence. Jsl, 19(5), 504.
Raudenbush, S. W., & Bryk, A. S. (2002). Hierarchical linear
models: Applications and data analysis methods (Vol. 1).
Thousand Oaks, CA: Sage.
Robinson, V. (2011). Student-centered leadership (Vol. 15).
Hoboken, NJ: John Wiley & Sons.
Robinson, V. M., Lloyd, C. A., & Rowe, K. J. (2008). The
impact of leadership on student outcomes: An analysis of
the differential effects of leadership types. Educational
Administration Quarterly, 44(5), 635–674.
Roby, D. E. (2004). Research on school attendance and student
achievement: A study of Ohio schools. Educational
Research Quarterly, 28(1), 3–16.
Rosen, J. A. (2007). An exploration of perceived decision
making influence for teachers in public schools:
Relationships between influence, charter schools, and
school performance. The Ohio State University.
Ross, J. A., & Gray, P. (2006). School leadership and student
achievement: The mediating effects of teacher
beliefs. Canadian Journal of Education/Revue Canadienne
de L'éducation, 29(3), 798–822.
Rowan, B., Raudenbush, S. W., & Kang, S. J. (1991).
Organizational design in high schools: A multilevel
analysis. American Journal of Education, 99(2), 238–266.
Rowe, K. K., & Hill, P. W. (1998). Modeling educational
effectiveness in classrooms: The use of multi-level
structural equations to model students’
progress. Educational Research and Evaluation, 4(4), 307–
347.
Rumberger, R. W., & Palardy, G. J. (2004). Multilevel models
for school effectiveness research. In D. Kaplan (Ed.),

22
Boyce & Bowers (2018)
Handbook on quantitative methodology for the social
sciences (pp. 235-258). Thousand Oaks, CA: Sage.
Ryan, A. M., & Patrick, H. (2001). The classroom social
environment and changes in adolescents’ motivation and
engagement during middle school. American Educational
Research Journal, 38(2), 437-460.
Skinner, R. R. (2008). Autonomy, working conditions, and
teacher satisfaction: Does the public charter school bargain
make a difference? The George Washington University.
Smith, T. M., & Rowley, K. J. (2005). Enhancing commitment
of tightening control: The function of teacher professional
development in an era of accountability. Educational Policy,
19(1), 126–154.
Snijders, T. A., & Bosker, R. J. (1993). Standard errors and
sample sizes for two-level research. Journal of Educational
and Behavioral Statistics, 18(3), 237–259.
Spillane, J. P., Halverson, R., & Diamond, J. B. (2001).
Investigating school leadership practice: A distributed
perspective. Educational Researcher, 30(3), 23–28.
Spillane, J. P., Halverson, R., & Diamond, J. B. (2004). Towards
a theory of leadership practice: A distributed
perspective. Journal of Curriculum Studies, 36(1), 3–34.
Steiger, J. H. (1990). Structural model evaluation and
modification: An interval estimation approach. Multivariate
Behavioral Research, 25(2), 173–180.
Thompson, B. (2004). Exploratory and confirmatory factor
analysis: Understanding concepts and applications.
Washington, DC: American Psychological Association.
Trickett, E. J., & Moos, R. H. (1973). Social environment of
junior high and high school classrooms. Journal of
Educational Psychology, 65(1), 93.
Urick, A., & Bowers, A. J. (2011). What influences principals'
perceptions of academic climate? A nationally
representative study of the direct effects of perception on
climate. Leadership and Policy in Schools, 10(3), 322–348.
Urick, A., Bowers, A.J. (in press) How Teacher and Principal
Perceptions Influence Instructional Leadership
Internationally: A Multilevel Factor Analysis of TALIS
2008. Leadership and Policy in Schools.
https://doi.org/10.1080/15700763.2017.1384499
Urick, A., & Bowers, A.J. (2014). How does principal
perception of academic climate measure up? The impact of
principal perceptions on student academic climate and
achievement in high school. Journal of School Leadership,
24(2), 386–414.
Urick, A., & Bowers, A.J. (2014b) What are the different types
of principals across the U.S.? A latent class analysis of
principal perception of leadership. Educational
Administration Quarterly, 50(1), 96–134.
doi:10.1177/0013161X13489019
van der Gaag, M., Hoffman, T., Remijsen, M., Hijman, R., de
Haan, L., van Meijel, B., van Harten, P., Valmaggia, L., de
Hert, M., Cuijpers, A. & Wiersma, D. (2006). The five-
factor model of the positive and negative syndrome scale II:
A ten-fold cross-validation of a revised model.
Schizophrenia Research, 85(1), 280–287.
Wayne, S. J., Shore, L. M., & Liden, R. C. (1997). Perceived
organizational support and leader-member exchange: A
social exchange perspective. Academy of Management
Journal, 40(1), 82–111.
Weathers, J. M. (2011). Teacher community in urban elementary
schools: The role of leadership and bureaucratic
accountability. Education Policy Analysis Archives, 19(3),
1–42.
Willmott, R. (1999). Structure, agency and the sociology of
education: Rescuing analytical dualism. British Journal of
Sociology of Education, 20(1), 5–21.
Yen, I. H., & Syme, S. L. (1999). The social environment and
health: a discussion of the epidemiologic literature. Annual
review of public health, 20(1), 287-308.
York-Barr, J., & Duke, K. (2004). What do we know about
teacher leadership? Findings from two decades of
scholarship. Review of educational research, 74(3), 255-
316.
Zhang, P. (1993). Model selection via multifold cross
validation. The Annals of Statistics, 21(1), 299–313.

23
Boyce & Bowers (2018)
Appendix A: Descriptive statistics, full analytic sample SASS Question Min Max M SD SASS Variable
School-level influence
Setting student performance standards 0 1 0.57 0.50 T0420, 1 = high influence
Establishing curriculum 0 1 0.64 0.48 T0421, 1 = high influence
Determining in-service prof. dev. 0 1 0.45 0.50 T0422, 1 = high influence
Evaluating teachers 0 1 0.16 0.37 T0423, 1 = high influence
Hiring new full-time teachers 0 1 0.25 0.43 T0424, 1 = high influence
Setting discipline policy 0 1 0.42 0.49 T0425, 1 = high influence
Deciding budget spending 0 1 0.16 0.37 T0426, 1 = high influence
Classroom-level control
Selecting textbooks, materials 0 1 0.64 0.48 T0427, 1 = high control
Selecting content, topics, skills 0 1 0.68 0.47 T0428, 1 = high control
Selecting teaching techniques 0 1 0.94 0.25 T0429, 1 = high control
Evaluating and grading students 0 1 0.95 0.22 T0430, 1 = high control
Disciplining students 0 1 0.88 0.32 T0431, 1 = high control
Determining amount of homework 0 1 0.94 0.23 T0432, 1 = high control
Agree or disagree with…
Administration is supportive 0 1 0.84 0.36 T0435*, 1 = agree
Satisfied with salary 0 1 0.50 0.50 T0436*, 1 = agree
Student misbehavior interferes 0 1 0.60 0.49 T0437, 1 = disagree
Great deal of parent support 0 1 0.59 0.49 T0438*, 1 = agree
Necessary materials are available 0 1 0.81 0.39 T0439*, 1 = agree
Routine duties interfere 0 1 0.33 0.47 T0440, 1 = disagree
Principal enforces school rules 0 1 0.84 0.37 T0441*, 1 = agree
Rules for behavior are enforced 0 1 0.64 0.48 T0442*, 1 = agree
My colleagues share my beliefs 0 1 0.86 0.35 T0443*, 1 = agree
Principal knows school he/she wants 0 1 0.84 0.37 T0444*, 1 = agree
Great deal of cooperative effort 0 1 0.81 0.39 T0445*, 1 = agree
Staff members are recognized 0 1 0.74 0.44 T0446*, 1 = agree
Worry about job security 0 1 0.60 0.49 T0447, 1 = disagree
Standards have positive influence 0 1 0.47 0.50 T0448*, 1 = agree
Given the support needed to teach 0 1 0.68 0.47 T0449*, 1 = agree
Student tardiness/cutting interferes 0 1 0.61 0.49 T0450, 1 = disagree
Generally satisfied at this school 0 1 0.91 0.30 T0451*, 1 = agree
Conscious effort to coordinate 0 1 0.87 0.34 T0452*, 1 = agree
Extent of the following problems
Student tardiness 0 1 0.57 0.50 T0455, 1 = small problem
Student absenteeism 0 1 0.50 0.50 T0456, 1 = small problem
Student class cutting 0 1 0.80 0.40 T0457, 1 = small problem
Teacher absenteeism 0 1 0.90 0.30 T0458, 1 = small problem
Students dropping out 0 1 0.84 0.36 T0459, 1 = small problem
Student apathy 0 1 0.48 0.50 T0460, 1 = small problem
Lack of parental involvement 0 1 0.42 0.49 T0461, 1 = small problem
Poverty 0 1 0.41 0.49 T0462, 1 = small problem
Students unprepared to learn 0 1 0.35 0.47 T0463, 1 = small problem
Poor student health 0 1 0.76 0.43 T0464, 1 = small problem
Agree or disagree with…
Stress isn’t worth it 0 1 0.79 0.40 T0465, 1 = disagree
Teachers like being here 0 1 0.77 0.42 T0466*, 1 = agree
Like the way things are run 0 1 0.74 0.44 T0467*, 1 = agree
I’d leave for a higher paying job 0 1 0.71 0.46 T0468, 1 = disagree
Think about transferring 0 1 0.70 0.46 T0469, 1 = disagree
Not as much enthusiasm 0 1 0.60 0.49 T0470, 1 = disagree
Think about staying home 0 1 0.80 0.40 T0471, 1 = disagree
Would become a teacher again 0 1 0.66 0.47 T0472*, 1 = high likelihood
Note: N = 34,850 teachers (unweighted). M and SD are unweighted. An asterisk (*) denotes a variable that was reverse-coded.

24
Boyce & Bowers (2018)
Appendix B: Intraclass correlation coefficients, exploratory subsamples Variable Exploratory
Sample 1
Exploratory
Sample 2
Exploratory
Sample 3
Exploratory
Sample 4
T0420: Performance standards 0.131 0.121 0.122 0.126 T0421: Curriculum 0.252 0.250 0.253 0.259 T0422: In-service PD 0.175 0.170 0.176 0.170 T0423: Evaluating 0.122 0.129 0.130 0.116 T0424: Hiring 0.316 0.319 0.321 0.314 T0425: Discipline 0.180 0.162 0.175 0.175 T0426: Budget 0.196 0.180 0.194 0.181 T0427: Textbooks 0.259 0.265 0.263 0.261 T0428: Content 0.214 0.211 0.215 0.214 T0429: Teaching 0.185 0.188 0.190 0.193 T0430: Grading 0.196 0.201 0.200 0.210 T0431: Discipline 0.133 0.143 0.147 0.137 T0432: Homework 0.300 0.328 0.333 0.337 T0435: Admin support 0.197 0.214 0.212 0.219 T0436: Salary satisfaction 0.237 0.240 0.229 0.240 T0437: Misbehavior 0.254 0.253 0.251 0.249 T0438: Parent support 0.204 0.205 0.214 0.205 T0439: Materials 0.211 0.215 0.213 0.225 T0440: Routine duties 0.093 0.079 0.078 0.087 T0441: Principal enforcement 0.242 0.248 0.243 0.241 T0442: Teacher enforcement 0.213 0.208 0.212 0.205 T0443: Shared beliefs 0.113 0.110 0.104 0.106 T0444: Principal knows 0.259 0.266 0.267 0.256 T0445: Cooperative effort 0.171 0.168 0.168 0.175 T0446: Recognition 0.187 0.199 0.182 0.196 T0447: Job security 0.168 0.172 0.179 0.169 T0448: Standards influence 0.065 0.066 0.071 0.065 T0449: Given support 0.098 0.103 0.098 0.101 T0450: Tardiness/cutting 0.259 0.259 0.261 0.260 T0451: Generally satisfied 0.177 0.172 0.161 0.185 T0452: Coordination 0.061 0.061 0.072 0.071 T0455: Tardiness 0.377 0.376 0.374 0.377 T0456: Absenteeism 0.383 0.368 0.386 0.374 T0457: Cutting 0.544 0.534 0.538 0.536 T0458: Teacher absenteeism 0.279 0.304 0.296 0.292 T0459: Dropping out 0.544 0.557 0.561 0.565 T0460: Student apathy 0.329 0.318 0.331 0.334 T0461: Parent involvement 0.434 0.439 0.442 0.437 T0462: Poverty 0.607 0.613 0.610 0.614 T0463: Unprepared to learn 0.413 0.430 0.418 0.423 T0464: Student Health 0.331 0.328 0.337 0.325 T0465: Stress 0.120 0.122 0.116 0.125 T0466: Like being here 0.295 0.285 0.286 0.294 T0467: Like how school is run 0.240 0.241 0.233 0.235 T0468: Leave for higher pay 0.089 0.084 0.080 0.091 T0469: Think of transfer 0.153 0.144 0.149 0.145 T0470: Less enthusiasm 0.064 0.055 0.061 0.072 T0471: Consider staying home 0.079 0.070 0.065 0.069 T0472: Become a teacher again 0.073 0.067 0.065 0.072
Appendix C: Multilevel exploratory factor analysis fit statistics

25
Boyce & Bowers (2018)
Panel A: Exploratory subsample 4, within-level MEFA fit statistics
# Factors Chi-sq. df p-value CFI RMSEA SRMRwithin
1 94211.344 1127 <0.0001 0.532 0.056 0.115
2 53700.530 1079 <0.0001 0.736 0.043 0.083
3 36237.055 1032 <0.0001 0.823 0.036 0.065
4 24164.099 986 <0.0001 0.884 0.030 0.053
5 16588.899 941 <0.0001 0.921 0.025 0.043
6 11924.798 897 <0.0001 0.945 0.022 0.034
7 9735.244 854 <0.0001 0.955 0.020 0.030
8 Convergence issues
9 Not reported given convergence issues with prior model
10 Not reported given convergence issues with prior model
Panel B: Exploratory subsample 4, between-level MEFA fit statistics
# Factors Chi-sq. df p-value CFI RMSEA SRMRbetween
1 14469.391 1127 <0.0001 0.933 0.021 0.161
2 10010.971 1079 <0.0001 0.955 0.018 0.114
3 4961.409 1032 <0.0001 0.980 0.012 0.074
4 3749.693 986 <0.0001 0.986 0.010 0.063
5 3008.721 941 <0.0001 0.990 0.009 0.049
6 2054.363 897 <0.0001 0.994 0.007 0.041
7 1730.345 854 <0.0001 0.996 0.006 0.036
8 1438.596 812 <0.0001 0.997 0.005 0.032
9 1199.405 771 <0.0001 0.998 0.005 0.029
Note: The bolded rows represent the fit statistics for the final selection of stage two: six within-level factors and
three between-level factors.

26
Boyce & Bowers (2018)
Appendix D: Multilevel exploratory factor analysis fit statistics,
6 within-level factors, 3 between-level factors
Exploratory
Subsample CFI RMSEA SRMRwithin SRMRbetween
Initial model
E. Sample 1 0.929 0.017 0.033 0.076
E. Sample 2 0.931 0.016 0.033 0.079
E. Sample 3 0.931 0.017 0.034 0.074
E. Sample 4 0.930 0.017 0.034 0.074
First trim
E. Sample 1 0.931 0.018 0.033 0.073
E. Sample 2 0.932 0.018 0.033 0.077
E. Sample 3 0.933 0.018 0.033 0.073
E. Sample 4 0.932 0.018 0.033 0.073
Second trim
E. Sample 1 0.934 0.019 0.032 0.073
E. Sample 2 0.936 0.019 0.032 0.078
E. Sample 3 0.936 0.019 0.032 0.073
E. Sample 4 0.936 0.019 0.032 0.073
Appendix E: Multilevel confirmatory factor analysis fit statistics
Confirmatory
Subsample CFI RMSEA SRMRwithin SRMRbetween
Initial model
C. Sample 1 0.832 0.027 0.078 0.148
C. Sample 2 0.831 0.027 0.076 0.145
C. Sample 3 0.832 0.027 0.078 0.148
C. Sample 4 0.836 0.028 0.081 0.156
Second model
C. Sample 1 0.829 0.027 0.078 0.130
C. Sample 2 0.831 0.027 0.076 0.124
C. Sample 3 0.832 0.027 0.078 0.132
C. Sample 4 0.835 0.028 0.081 0.133
Third model
C. Sample 1 0.829 0.027 0.078 0.129
C. Sample 2 0.832 0.027 0.076 0.121
C. Sample 3 0.831 0.027 0.078 0.132
C. Sample 4 0.835 0.028 0.081 0.130
Fourth model
C. Sample 1 0.882 0.023 0.065 0.127
C. Sample 2 0.885 0.022 0.063 0.118
C. Sample 3 0.882 0.023 0.065 0.129
C. Sample 4 0.895 0.022 0.064 0.128

27
Boyce & Bowers (2018)
Appendix F: Mplus code for stage four final multilevel confirmatory factor analysis,
6 within-level factors, 3 between-level factors
TITLE: Teacher Final MCFA, weighted by composite, Confirmatory Sample 4
6 within-level factors, 3 between-level factors
model trimmed of T0436 T0437 T0439 T0440 T0448 T0449 T0452
model trimmed of T0431 T0458 T0469
DATA: FILE = N:\MLFA\Directory\File.dat ;
VARIABLE: NAMES = JNTLNUMS CNTLNUMS FILTER TFNLWGT SFNLWGT CFNLWGT
T0420 T0421 T0422 T0423 T0424 T0425 T0426 T0427
T0428 T0429 T0430 T0431 T0432 T0435 T0436 T0437
T0438 T0439 T0440 T0441 T0442 T0443 T0444 T0445
T0446 T0447 T0448 T0449 T0450 T0451 T0452 T0455
T0456 T0457 T0458 T0459 T0460 T0461 T0462 T0463
T0464 T0465 T0466 T0467 T0468 T0469 T0470 T0471
T0472 ;
CLUSTER = JNTLNUMS ;
WEIGHT = CFNLWGT ;
CATEGORICAL = T0420 T0421 T0422 T0423 T0424 T0425 T0426 T0427
T0428 T0429 T0430 T0432 T0435
T0438 T0441 T0442 T0443 T0444 T0445
T0446 T0447 T0450 T0451 T0455
T0456 T0457 T0459 T0460 T0461 T0462 T0463
T0464 T0465 T0466 T0467 T0468 T0470 T0471
T0472 ;
USEVARIABLES = T0420 T0421 T0422 T0423 T0424 T0425 T0426 T0427
T0428 T0429 T0430 T0432 T0435
T0438 T0441 T0442 T0443 T0444 T0445
T0446 T0447 T0450 T0451 T0455
T0456 T0457 T0459 T0460 T0461 T0462 T0463
T0464 T0465 T0466 T0467 T0468 T0470 T0471
T0472 ;
ANALYSIS: TYPE = TWOLEVEL ;
ESTIMATOR = WLSMV ;
PROCESSORS = 8 ;
STARTS = 20 ;
STITERATIONS = 15 ;
MODEL: %WITHIN%
w1 BY T0420 T0421 T0422 T0423 T0424 T0425 T0426 ;
w2 BY T0421 T0427 T0428 T0429 T0430 T0432 ;
w3 BY T0435 T0441 T0442 T0443 T0444 T0445 T0446 T0451 T0466 T0467;
w4 BY T0450 T0455 T0456 T0457 ;
w5 BY T0438 T0459 T0460 T0461 T0462 T0463 T0464 ;
w6 BY T0451 T0465 T0468 T0470 T0471 T0472 ;
%BETWEEN%
b1 BY T0420 T0421 T0422 T0423 T0424 T0427 T0428 T0429 T0430 T0432
T0438 T0447 T0451 T0465 T0466 T0468 T0470 T0471 T0472 ;
b2 BY T0420 T0422 T0423 T0425 T0426 T0435 T0441 T0442 T0443 T0444
T0445 T0446 T0451 T0465 T0466 T0467 ;
b3 BY T0438 T0447 T0450 T0455 T0456 T0457 T0459 T0460 T0461 T0462
T0463 T0464 ;
OUTPUT: STANDARDIZED ;