Embed Size (px)
Citation preview

DI
SC
US
SI
ON
P
AP
ER
S
ER
IE
S
Forschungsinstitut zur Zukunft der ArbeitInstitute for the Study of Labor
Differences in Quality of Life EstimatesUsing Rents and Home Values
IZA DP No. 6703
July 2012
John V. Winters

Differences in Quality of Life Estimates
Using Rents and Home Values
John V. Winters University of Cincinnati
and IZA
Discussion Paper No. 6703 July 2012
IZA
P.O. Box 7240 53072 Bonn
Germany
Phone: +49-228-3894-0 Fax: +49-228-3894-180
E-mail: [email protected]
Any opinions expressed here are those of the author(s) and not those of IZA. Research published in this series may include views on policy, but the institute itself takes no institutional policy positions. The Institute for the Study of Labor (IZA) in Bonn is a local and virtual international research center and a place of communication between science, politics and business. IZA is an independent nonprofit organization supported by Deutsche Post Foundation. The center is associated with the University of Bonn and offers a stimulating research environment through its international network, workshops and conferences, data service, project support, research visits and doctoral program. IZA engages in (i) original and internationally competitive research in all fields of labor economics, (ii) development of policy concepts, and (iii) dissemination of research results and concepts to the interested public. IZA Discussion Papers often represent preliminary work and are circulated to encourage discussion. Citation of such a paper should account for its provisional character. A revised version may be available directly from the author.

IZA Discussion Paper No. 6703 July 2012
ABSTRACT
Differences in Quality of Life Estimates Using Rents and Home Values*
Quality of life differences across areas can be measured by differences in “real wages”, where real wages are computed as nominal wages adjusted for the cost of living. Computing cost of living differences involves several important issues, including how housing prices should be measured. Previous researchers typically have used some combination of rental payments and homeowner housing values, but housing values are forward-looking and may not reflect current user costs. This paper examines differences in quality of life estimates for U.S. metropolitan areas using, alternatively, rents and housing values. We find that the two measures of quality of life are highly correlated. Value-based estimates, however, are considerably more dispersed than rent-based estimates, likely because of the recent housing bubble and because housing values often provide an imperfect measure of the present user cost of housing. Researchers should be cautious in using housing values to construct quality of life estimates. JEL Classification: R13, R21, R23 Keywords: quality of life, amenities, rents, housing, wages Corresponding author: John V. Winters Department of Economics University of Cincinnati P.O. Box 210371 Cincinnati, OH 45221 USA E-mail: [email protected]
* The author would like to thank Barry Hirsch, three anonymous referees, and session participants at the 2009 annual meeting of the Southern Economic Association for helpful comments. Any errors or omissions are solely the responsibility of the author.
1
1. Introduction
Researchers, policymakers, and the general public are all interested in differences in the
quality of life across areas. Quality of life differences affect individual welfare and have been
found to be an important driver of metropolitan population growth (Rappaport 2007, 2009). A
number of popular publications have emerged that rank the quality of life across cities and states
based on their observable characteristics. Following Rosen (1979) and Roback (1982),
economists and other researchers have ranked the quality of life across areas based on
compensating differentials in labor, housing, and consumption markets.1 In other words, the
existence of a spatial equilibrium necessitates that workers accept lower “real wages” to live in
nicer areas. Computing real wages requires estimating cost of living differences across areas,
and doing so is one of the biggest challenges faced by quality of life researchers. Differences in
the cost of living across areas are mostly attributable to differences in the cost of housing
(Beeson and Eberts 1989), but are also at least partially attributable to differences in the prices of
non-housing goods (Gabriel, Mattey, and Wascher 2003). There are two main issues in
computing cost of living differences. The first is that good information on non-housing prices is
not readily available for all areas. Researchers usually deal with this by either ignoring non-
housing prices altogether (e.g., Roback 1982; Blomquist, Berger and Hoehn 1988) or by
inferring non-housing prices from housing prices when non-housing prices are not available
(e.g., Shapiro 2006; Albouy 2008).2
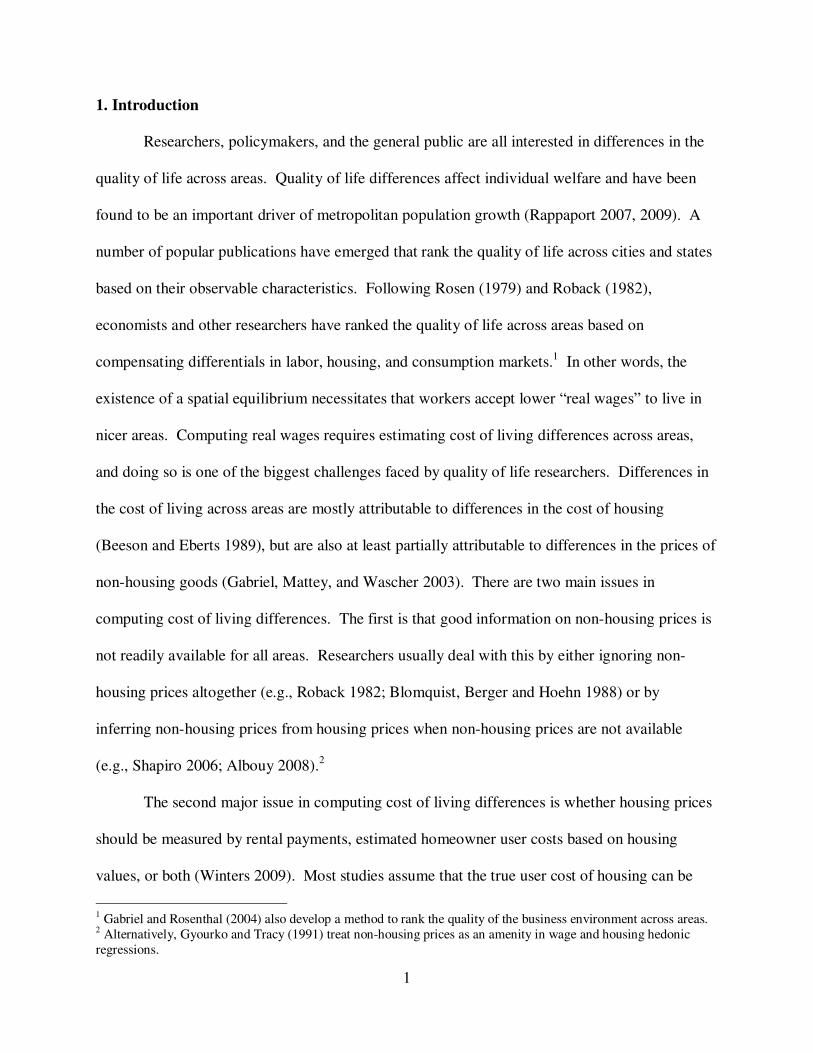
The second major issue in computing cost of living differences is whether housing prices
should be measured by rental payments, estimated homeowner user costs based on housing
values, or both (Winters 2009). Most studies assume that the true user cost of housing can be
1 Gabriel and Rosenthal (2004) also develop a method to rank the quality of the business environment across areas. 2 Alternatively, Gyourko and Tracy (1991) treat non-housing prices as an amenity in wage and housing hedonic
regressions.

2
accurately measured by both housing rents and housing values and, therefore, measure housing
prices using a weighted average of rental payments and homeowner values, with greater weight
given to homeowner values.3 However, the recent housing bubble has caused rents and
homeowner values to diverge considerably (Verbrugge 2008; Garner and Verbrugge 2009).
Even absent a housing bubble, the ratio of housing values to rents is likely to differ across areas
because of different expectations about the future growth of rents (Clark, 1995; Davis, Lehnert
and Martin 2008). Rental payments reflect the actual current user cost of housing for a specific
period of time. However, a house is an asset that yields a stream of future benefits to its owner.
The value of a house is equal to the expected net present value of the future benefit stream it
generates. Areas where rents are expected to grow more quickly over time should have a higher
ratio of current values to current rents because the expected increase in future rental payments is
capitalized into current housing values. Therefore, measuring the current user cost of housing
using house values may be inappropriate for estimating the cost of living. Because of this the
U.S. Bureau of Labor Statistics (BLS) measures housing prices solely by rents and not values in
computing the Consumer Price Index (CPI). Winters (2009) also suggests that the relationship
between wages and prices across metropolitan areas is consistent with the spatial equilibrium
hypothesis when housing prices are measured by rents but not when housing prices are measured
by housing values. Furthermore, Banzhaf and Farooque (2012) find that local public amenities
and income levels are more highly correlated with rents than owner values. This paper suggests
that quality of life estimates should base housing prices solely on rents and not on housing
values.
3 A few previous studies have also measured housing prices using either only rents or only housing values instead of
a combination of the two, but no previous study has examined differences in quality of life rankings that result from
measuring housing prices by only rents or only housing values.

3
Using a framework similar to Rosen (1979) and Roback (1982), this paper computes
quality of life estimates across metropolitan areas of the U.S. for the year 2007. The preferred
estimates compute housing prices using quality-adjusted rents because rents reflect the current
user cost of housing but housing values are based on the future stream of benefits provided by
the house. For comparison, we also compute quality of life estimates for which housing prices
are measured solely by housing values. The two measures of quality of life are very highly
correlated, but value-based estimates are considerably more dispersed across areas than the rent-
based estimates. That is, the value-based estimates report a higher implicit value of amenities in
high amenity areas than do the rent-based estimates. This is likely due in large part to the
dramatic growth in housing values prior to 2007. However, we also estimate quality of life
values for 2000 and find that a similar relationship holds in that year, though to a much lesser
extent. Value-based estimates are notably more dispersed than rent-based estimates. Rents are
superior on theoretical grounds, and we argue that future researchers should use rents and not
values when computing estimates of quality of life and amenity values.
The paper proceeds as follows. The next section presents the theoretical framework
based on the seminal work of Rosen (1979) and Roback (1982). The third section discusses the
empirical approach and data used in this study. A fourth section presents the results for the
quality of life estimates. A fifth section examines the effect of quality of life on changes in rents
and housing values from 2000 to 2007. A final section concludes.
2. Theoretical Framework
This section presents a simple model following Rosen (1979) and Roback (1982) that
shows that differences in amenity values across cities can be computed from differences in real

4
wages. Firms produce two goods, �� and ��, according to constant returns to scale production
functions using labor (�), capital (�), and land (�) and subject to locational differences in
productivity due to amenities (�): �� = ��(�,�, �; �). The marginal products of labor, capital,
and land are all non-negative, but increases in amenities can either increase or decrease
productivity. The price of capital is determined exogenously in the world market, while the
prices of labor (�) and land (��) are determined competitively in local markets. In equilibrium,
firms earn zero profits and the price of each good is equal to its unit cost of production (��):
(1) ��(�,��; �) = ��, � = 1, 2.
Individual workers maximize their own utility subject to a budget constraint. Utility is a
function of goods �� and �� and location-specific amenities: � = �(��, ��; �). Workers are
mobile across areas, and in equilibrium utility for identical workers is equal across all areas.4
The indirect utility function can be represented as a function of wages and the prices of �� and
�� given amenities:
(2) � = �(�, ��, ��; �).
Taking the total differential of both sides of (2), setting �� = 0 so that there are no differences in
utility across areas, rearranging, and employing Roy’s Identity yields a slight variant of the
common equation used to estimate the implicit price of amenities:
(3) ���� = ����� + ����� − ��.5
Dividing both sides of (3) by � converts the equation to:
4 Greenwood, Hunt, Rickman, and Treyz (1991) find that although a few areas may be out of equilibrium at a given
point in time, spatial equilibrium is not an unreasonable assumption for the most part. Oswald and Wu (2010,
2011), however, find that subjective responses about individual well-being differ across the United States even after
controlling for individual characteristics. This may reflect heterogeneous preferences for locations (Krupka and Donaldson 2007) or decreased responsiveness to area-specific demand shocks (Partridge, Rickman, Olfert and Ali
2012). This could affect our ability to accurately estimate implicit amenity prices and rank quality of life across
areas. 5 Alternatively, we could have defined the expenditure function and used Shephard’s Lemma to obtain an equivalent
result as in Albouy (2008).

5
(4) (��/�)�� = (����/�)�ln�� + (����/�)�ln�� − ����.
Equation (4) says that the implicit share of wages spent on amenity consumption in an
area can be computed from logarithmic differences in real wages across areas, where real wages
are equal to nominal wages, �, divided by the cost of living, �. Logarithmic differences in
nominal wages are represented by the ���� term. Logarithmic differences in the cost of living
are given by an expenditure share weighted average of the logarithmic differences in the prices
of goods one and two. That is, ���� = (����/�)�ln�� + (����/�)�ln��. The implicit
share of wages spent on amenity consumption is thus equal to the negative of log differences in
real wages, i.e., ���� − ����.6 To live in an area with nice amenities workers must accept
lower real wages.7
3. Empirical Framework and Data
This study estimates quality of life values for metro areas in the U.S. from the negative of
logarithmic differences in real wages. Most previous studies of quality of life differentials across
areas try to separately estimate the effect of amenities on wages and housing prices and then
aggregate the compensating differentials from these markets to estimate the value of the quality
of life in each area.8 An important limitation to this approach is that important amenities are
unlikely to be completely observed. This would cause the quality of life in areas with nice
unobserved amenities to be understated. A further problem concerns how one should account for
non-housing prices in this method. Should non-housing price differentials be treated as resulting
6 If the real wage is �/�, then the log of the real wage is ��� − ���. 7 For non-workers, the implicit price to live in a high quality of life area depends only on the cost of living and not
on wages. Thus we would expect retirees and other non-workers to be attracted to areas where amenity values are
capitalized more into wages than prices (Chen and Rosenthal 2008). 8 See Gyourko, Kahn and Tracy (1999) for a review of the literature on quality of life and amenity valuation. Stover
and Leven (1992) also discuss a number of important issues related to estimating quality of life.

6
from amenities as in Gabriel et al. (2003)? What if some of the differential in non-housing prices
is due to things other than amenities, such as geographical remoteness? The real wage approach
used in this paper does not rely on observed values of amenities and it provides a clear answer as
to how non-housing prices should be treated. There are certainly limitations to the real wage
approach as well9, but it is considered the preferred method for valuing amenities and quality of
life in this paper. Similar approaches are also used in Kahn (1995), Albouy (2008), and others.10
This paper computes logarithmic differences in nominal wages and housing prices across
metropolitan areas using microdata from the 2007 American Community Survey (ACS) and the
2000 Census, both of which are available from the IPUMS (Ruggles et al. 2008). In this study,
the geographical unit of analysis is the Combined Statistical Area (CSA) where one exists and
the Core Based Statistical Area (CBSA) for areas not part of a CSA. For ease of discussion, we
usually just refer to these as metropolitan areas. We only consider CSA/CBSAs that are
primarily metropolitan in nature and can be at least partially identified from the IPUMS data.
Unfortunately, the IPUMS data do not allow identification of geographic areas with populations
less than 100,000. Consequently, the lowest level of identifiable geography, the PUMA, often
includes both metropolitan and non-metropolitan areas. We assign each PUMA to a
metropolitan area if more than 50 percent of the population of the PUMA is contained within the
metropolitan area. This procedure allows us to identify 293 metropolitan areas in both 2000 and
2007.11
However, it is important to keep in mind that parts of metropolitan areas are often
9 One potentially important limitation is that high skilled workers may sort into high wage or high quality of life
areas, which would bias the estimates. We include detailed controls for observable worker characteristics but some
worker characteristics (e.g. innate ability) remain unobservable. 10 Gabriel and Rosenthal (2004) and Chen and Rosenthal (2008) follow a related approach by computing quality of life estimates in levels (as opposed to logs) by subtracting the local wage premium from the local housing cost
premium. Measuring QOL in levels requires assumptions about household labor supply and housing consumption
decisions based on sample means. Their approach does not account for non-housing prices and doing so would
require some assumption about non-housing consumption presumably based on income or housing consumption. 11 A few small CBSAs are not identified and are not included in this study.

7
unobservable and our resulting quality of life estimates are subject to some degree of
measurement error.
Logarithmic differences in nominal wages across areas are computed by regressing the
log of the after-tax hourly wage for worker � in area on a vector of individual characteristics, �,
and a vector of area fixed-effects, !:12
(5) ln��" = ��"# + !" + $�".
The individual characteristics are included to make workers roughly equivalent across areas and
include variables commonly found to affect individual wages such as a quartic specification in
potential experience, dummy variables for highest level of education completed, gender, marital
status, whether an individual is Black, Hispanic, Asian, or Other, head of household, part-time or
irregularly employed (working less than 35 hours per week or less than 35 weeks during the
previous year), citizenship status, industry, and occupation. We would also like to control for
other worker characteristics such as firm size and union coverage/membership, but these are not
asked in the ACS and decennial census. The results for the individual characteristics are
generally as expected and are available by request. The sample is restricted to workers between
the ages of 25 and 61. We use wages net of federal income taxes because the progressive nature
of the federal income tax system means that workers in high wage areas pay a higher percentage
of their income in federal income taxes than workers in low wages areas (Henderson 1982;
Albouy 2008, 2009). However, individual workers receive the same federal benefits regardless
12 Pre-tax hourly wages (%�") are estimated by dividing annual wage income by the number of weeks worked times
the usual hours worked per week. Federal income taxes are estimated using the federal tax schedule and based on
several assumptions. We assume that all married couples file jointly and receive two personal exemptions and non-
married persons have a filing status of single and receive one personal exemption. Itemized deductions are assumed
to equal 20 percent of annual income, but taxpayers take the standard deduction if it is more than their itemized
deductions. Deductions and exemptions are subtracted from annual earnings to estimate taxable income. Tax
schedules are then used to compute federal tax liabilities. We next compute the average tax rate for each taxpayer
(&�"), and then multiply the pre-tax hourly wage by one minus the average tax rate to compute after-tax hourly wages
(��" = %�"(1 − &�")).

8
of how much federal taxes they pay. Therefore, workers are ultimately concerned with wages
net of federal taxes when making location decisions, and this is what we use in this study.
Albouy (2009) argues that federal income tax rates should be indexed to local wages and that
failing to do so significantly reduces economic activity in high wage areas because the additional
tax burden makes those areas less desirable to potential migrants. This reduces local
employment levels and local land and housing prices and generates locational inefficiencies.
Albouy (2008) argues that failing to account for geographic differences in federal taxes causes
quality of life estimates to be significantly undervalued in high wage areas such as big cities. We
do not make any adjustment to wages for social security contributions or state and local taxes.13
The estimated area fixed-effects in (5) represent logarithmic differences in wages across
metropolitan areas.
Logarithmic differences in rents and housing values are also based on microdata from the
ACS and Census. More specifically, we regress the log of gross rents14
, (, for each housing unit
on a vector of housing characteristics, ), and a vector of area fixed-effects, *:
(6) ln(�" = )�"Γ + *" + ,�".
We also estimate a similar equation for homeowner housing values:
(7) ln��" = )�"ϕ + ." + /�" .
The housing characteristics included are dummy variables for the number of bedrooms, the total
number of rooms, the age of the structure, the number of units in the building, modern plumbing,
13 Social security contributions could be easily estimated but estimating Social Security benefits is much more
difficult. Adjusting wages for state and local income taxes would also require accounting for other taxes and the
benefits from public spending that these taxes make possible. 14 Rents are measured to include certain utilities but exclude a portion of rents attributable to property tax payments based on the effective tax rates of owner-occupied housing. Removing property taxes from rents is based on the
assumption that higher property taxes are offset by lowering other state and local taxes (e.g. income, sales, etc.). If
this assumption holds, then including property taxes in rents to construct quality of life estimates would cause areas
that heavily rely on property taxes to have higher QOL values than they should. As a practical matter, excluding
property taxes has only a small effect on QOL estimates for most areas.

9
modern kitchen facilities, and lot size (available only for single-unit buildings). These results are
available upon request. The area fixed-effects from (6) and (7) are used to measure logarithmic
differences in rents and housing values across metropolitan areas.
To compute quality of life estimates, we also need to account for non-housing prices.
This paper estimates non-housing prices using the ACCRA Cost of Living Index. ACCRA works
with local chambers of commerce to collect local prices quarterly for 57 goods and services
intended to form a representative basket of typical consumer expenditures. Individual prices are
then aggregated for each area to create a composite price index and six sub-indices including
groceries, transportation, healthcare, miscellaneous goods and services, housing and utilities. As
discussed by Koo, Phillips and Sigalla (2000) and others, there are a number of problems with
using the ACCRA data to estimate cost of living differences across areas. In particular,
DuMond, Hirsch and Macpherson (1999) argue that the ACCRA Composite Index is
significantly over-dispersed across areas. Winters (2009) suggests that this is primarily because
of ACCRA’s heavy reliance on housing values for the housing index, but there are other issues
as well. That said, ACCRA is the single best source of data on interarea differences in non-
housing prices available and is used in this study.
We combine non-housing prices from ACCRA with the housing price fixed-effects from
(6) and (7) to construct two cost of living measures. The rent-based index is a weighted average
of rents and non-housing prices excluding utilities with rents given a weight of 0.29 and non-
housing prices given a weight of 0.71. Non-housing prices are computed as a weighted average
of the ACCRA sub-indices for groceries, transportation, healthcare, and miscellaneous goods and
services. Weights are chosen based on calculations from the 2005 Consumer Expenditure
Survey suggesting that housing including certain utilities represents 29 percent of average
10
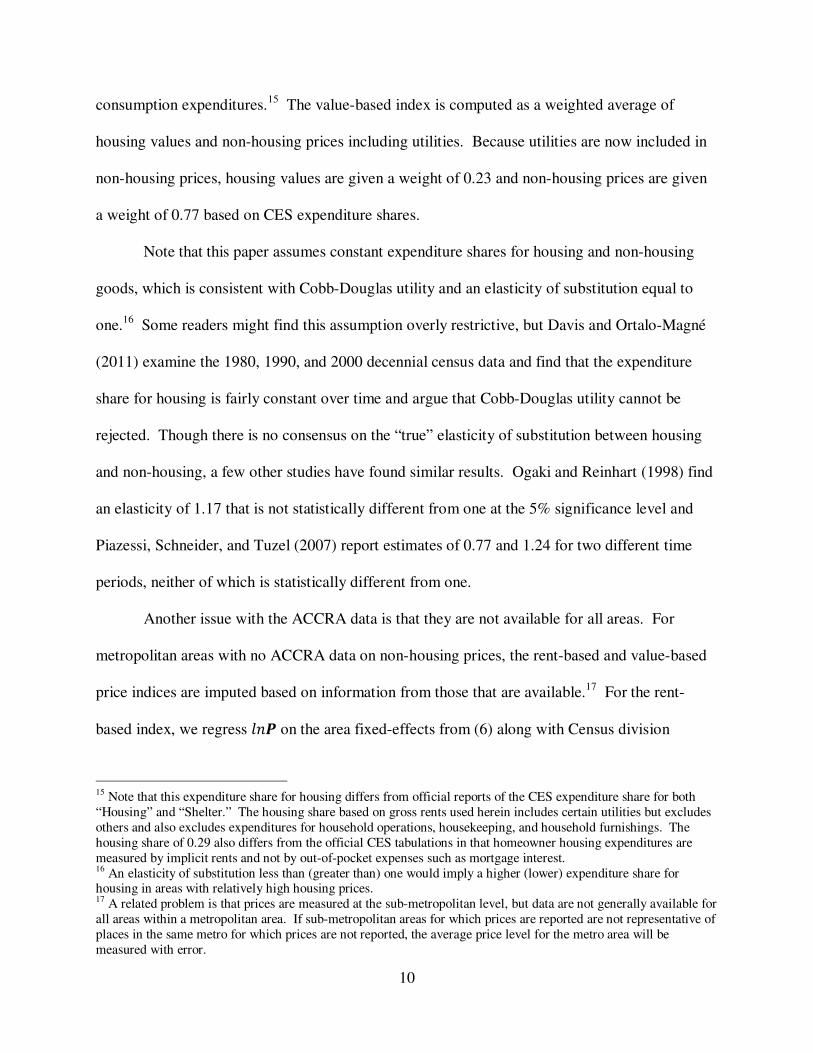
consumption expenditures.15
The value-based index is computed as a weighted average of
housing values and non-housing prices including utilities. Because utilities are now included in
non-housing prices, housing values are given a weight of 0.23 and non-housing prices are given
a weight of 0.77 based on CES expenditure shares.
Note that this paper assumes constant expenditure shares for housing and non-housing
goods, which is consistent with Cobb-Douglas utility and an elasticity of substitution equal to
one.16
Some readers might find this assumption overly restrictive, but Davis and Ortalo-Magné
(2011) examine the 1980, 1990, and 2000 decennial census data and find that the expenditure
share for housing is fairly constant over time and argue that Cobb-Douglas utility cannot be
rejected. Though there is no consensus on the “true” elasticity of substitution between housing
and non-housing, a few other studies have found similar results. Ogaki and Reinhart (1998) find
an elasticity of 1.17 that is not statistically different from one at the 5% significance level and
Piazessi, Schneider, and Tuzel (2007) report estimates of 0.77 and 1.24 for two different time
periods, neither of which is statistically different from one.
Another issue with the ACCRA data is that they are not available for all areas. For
metropolitan areas with no ACCRA data on non-housing prices, the rent-based and value-based
price indices are imputed based on information from those that are available.17
For the rent-
based index, we regress ��� on the area fixed-effects from (6) along with Census division
15 Note that this expenditure share for housing differs from official reports of the CES expenditure share for both
“Housing” and “Shelter.” The housing share based on gross rents used herein includes certain utilities but excludes
others and also excludes expenditures for household operations, housekeeping, and household furnishings. The
housing share of 0.29 also differs from the official CES tabulations in that homeowner housing expenditures are
measured by implicit rents and not by out-of-pocket expenses such as mortgage interest. 16 An elasticity of substitution less than (greater than) one would imply a higher (lower) expenditure share for housing in areas with relatively high housing prices. 17 A related problem is that prices are measured at the sub-metropolitan level, but data are not generally available for
all areas within a metropolitan area. If sub-metropolitan areas for which prices are reported are not representative of
places in the same metro for which prices are not reported, the average price level for the metro area will be
measured with error.

11
dummies and metropolitan area population dummies. The coefficients from this regression are
then used to predict values of the rent-based index for areas with missing non-housing prices.
Missing values for the value-based index are imputed similarly except that they are based on the
area fixed-effects from (7).
Once we have constructed rent-based and value-based price indices for every metro area,
we then subtract the logarithmic differences in wages from the logarithmic differences in prices
to construct the alternative rent-based and housing value-based quality of life estimates. The
next section presents these results.
4. Quality of Life Estimates
This section presents the results of the quality of life (QOL) estimates and discusses the
differences that result from separately measuring housing prices by rents and by values. This
paper differs from most previous quality of life studies because of its emphasis on measuring
housing prices solely by rents instead of using a combination of rents and housing values.
Summary statistics for the rent-based and housing value-based QOL estimates for 2007 are
presented in Table 1. Both measures have means close to zero by construction, but the value-
based estimates are considerably more dispersed. The standard deviation for the rent-based
estimates is 0.058, while the standard deviation for the value-based estimates is 0.093. Similarly,
the value-based estimates have a much wider spread between the maximum and minimum values
than the rent-based estimates. The spreads between the 90th and 10
th percentiles and the 75
th and
25th percentiles are considerably smaller than the max-min spread, but for both the value-based
QOL estimates continue to be considerably more dispersed than the rent-based estimates.

12
The 2007 quality of life estimates for the top 20 cities according to the 2007 the rent-
based series are presented in Table 2, and estimates for the additional cities are reported in
Appendix Table A. Using the rent-based index Honolulu, HI is considered to have the highest
quality of life with an estimate of 0.266. The estimate suggests that workers in Honolulu accept
roughly 27 percent lower real wages than what they would get from relocating to an average
QOL area. Well behind Honolulu is Medford, OR in second with a rent-based QOL estimate of
0.162. Santa Barbara-Santa Maria-Goleta, CA and Burlington-South Burlington, VT are third
and fourth with estimates of 0.156 and 0.154, respectively. It would be tedious to discuss the
ranking for every area, but a few general observations are useful. Metropolitan areas in
California and Florida tend to do fairly well probably because of their mild winters and
proximity to the coast. A few small to mid-size college towns, such as State College, PA and
Morgantown, WV, also rank pretty highly.18
Winters (2011a) examines the effects of a large
number of amenities on metropolitan area quality of life and finds that among other things a nice
climate, a mountainous topography, a highly educated population and a strong presence of higher
education institutions have significantly positive effects on quality of life.19
The bottom of the
rankings is more mixed but there is some tendency toward interior areas of the country such as in
parts of Indiana, Ohio and Texas. Of particular note are a few big cities that rank quite poorly
such as Houston-Baytown-Huntsville, TX at 289th and Detroit-Warren-Flint, MI at 290
th out of
293.
18 State College is home to Pennsylvania State University and Morgantown is the home of the University of West Virginia. Winters (2011b) also shows that college towns are growing faster than other metropolitan areas and
suggests that it is because recent student in-migrants often develop friendships, relationships with local employers,
and a taste for local amenities and decide to stay in the area after their education is complete. 19 Winters (2011) also finds mixed results for some other common (dis)amenities such as crime, pollution, commute
times, population density, and city size.

13
Though there are some differences, the rankings using the value-based estimates are
largely similar. In fact, the Spearman rank correlation between the two series is very high at
0.746.20
The important difference, though, is that the value-based estimates are considerably
more dispersed, especially at the very top of the rankings. Honolulu is still the top ranked area
according to the value-based series, but its QOL estimate increases to 0.402. Santa Barbara-
Santa Maria-Goleta and Medford swap the second and third positions with estimates of 0.323
and 0.311, respectively. Though there are some exceptions, the value-based estimates for the
nicest areas are generally larger than the rent-based estimates. Rents are an appropriate measure
of the present user cost of housing, but housing values are not and should not be used as a proxy
for rents. Housing values in 2007 are considerably more dispersed across areas than rents, and
quality of life estimates based on values are considerably more dispersed than QOL estimates
based on rents.
While using housing values to compute QOL estimates is certainly a problem for 2007,
one might think that it would not be much of a problem for more “normal” times. After all 2007
was the peak of the housing bubble and values were definitely inflated, especially in areas with
an inelastic supply of housing (Glaeser, Gyourko and Saiz 2008). To investigate the extent of
problems from using housing values to measure QOL in more normal times, we next compute
rent-based and value-based QOL estimates for 2000. Table 3 reports the summary statistics for
2000. Means are still small and roughly equal for the two series, and the value-based estimates
are again more dispersed than the rent-based estimates, though by considerably less than in 2000.
The standard deviation is 0.071 for the rent-based estimates and 0.080 for the value-based
estimates. The max-min, 90-10, and 75-25 spreads are also larger for the value-based estimates
than the rent-based estimates. Note also that the rent-based QOL estimates became generally
20 The correlation for the estimates themselves is also very high at 0.752.

14
less dispersed between 2000 and 2007, while the value-based estimates became more dispersed
over the same period.
Table 4 reports the QOL estimates for the top 20 areas in 2000 according to the rent-
based series; results for the additional areas are available from the author by request. Again the
value-based estimates are more dispersed, but there is a very high Spearman rank correlation
between the two series of 0.883. According to the rent-based estimates, Prescott, AZ and
Missoula, MT occupied the top two positions in 2000 with QOL estimates of 0.195 and 0.194.
Prescott is a small metro area in the mountains of central Arizona with fairly mild winters and
warm summers. Missoula is also a small metropolitan area with low population density and nice
outdoor recreation amenities and is home to the University of Montana (Howie, Murphy, and
Wicks 2010). The next three spots and several others in the top 20 are also small areas in the
Mountain Census Division.
There are some differences in the QOL rankings between 2000 and 2007, but the
rankings are quite highly correlated across the two years. The rent-based estimates in 2000 and
2007 have a Spearman rank correlation of 0.740, and the value-based estimates in 2000 and 2007
have a Spearman rank correlation of 0.731. We have also examined changes in QOL between
2000 and 2007. The biggest gainers and losers tend to be smaller metro areas. In particular,
several of the smaller metros in the Mountain Census Division saw sizable decreases in quality
of life estimates between 2000 and 2007 including Prescott, AZ, Billings, MT and Cheyenne
WY. Further inspection (not shown) reveals that the decrease in quality of life estimates for
these small metros in the Mountain states was driven largely by an apparent positive productivity
shock that increased wages. The relatively short time period and the slow migration of labor to
relatively remote areas may cause quality of life to be undervalued in 2007 for these areas. Time

15
will tell if these small mountain areas return to the top of the rankings in future years or if their
values in 2000 were actually aberrations from their long run values. An alternative explanation
is that the relatively small samples for small metros might lead to sizable measurement error and
imprecise estimates. Either way, the differences across years for small metro areas suggest that
we should be careful in placing too much confidence in quality of life estimates for small areas
in a given year.
Many large dense metro areas saw improved rankings between 2000 and 2007 including
Boston (227 to 113), Los Angeles (129 to 52), Miami (123 to 37), New York (173 to 120),
Philadelphia (275 to 161), San Jose-San Francisco (86 to 40), and Washington-Baltimore (228 to
187). Honolulu has a population of nearly one million people and saw its quality of life rank
increase from number 31 in 2000 to number 1 in 2007. Closer inspection reveals that the QOL
increase for many of these cities was driven by increases in housing costs. There were also some
notable deteriorations in relative quality of life among fairly large cities including Denver (140 to
182), Phoenix (131 to 208), and Pittsburgh (154 to 222).
One might also be interested in how the quality of life rankings in this paper compare to
others in recent studies. Table 5 reports the rent-based and value-based quality of life rankings
for the 20 largest metros in 2000 and compares these to the rankings in Chen and Rosenthal
(2008) and Albouy (2008).21
There is no single recent study considered a benchmark, but both
Chen and Rosenthal (2008) and Albouy (2008) have received considerable attention recently.
Both Chen and Rosenthal (2008) and Albouy (2008) use a combination of rents and housing
values to measure housing prices. There are a number of other important differences in how
these rankings are constructed including the number of areas that are ranked, so differences are
to be expected, e.g., New York is ranked highly by the value-based index and by Albouy (2008)
21 We are not aware of any other rankings for 2007, so we only compare rankings for 2000.

16
but ranked poorly by the rent-based index and by Chen and Rosenthal (2008). However, there
are also some similarities; San Diego does well across all the rankings and Houston ranks poorly.
Not surprisingly, the value-based index tends to be closer to the Chen and Rosenthal (2008) and
Albouy (2008) than the rent-based index.
5. Effects of Quality of Life on Changes in Rents and Values
This section examines the relationship between quality of life in 2000 and the changes in
rental prices and home values between 2000 and 2007. That home values increased during this
period both absolutely and relative to rents has been widely documented. The first two columns
of Table 6 regress the changes in log rent and log value fixed effects on the rent-based quality of
life index for 2000. The results show that both rents and values increased disproportionately in
high quality of life areas with statistically significant coefficients of 0.155 and 0.867. The
magnitudes are much larger for values than rents. Based on the summary statistics reported in
Table 3, moving from the 10th percentile to the 90
th percentile of rent-based quality of life (an
increase of 0.188) is associated with a 0.163 increase in log home values but only a 0.029
increase in log rents. These results suggest that the demand for housing in high quality of life
areas increased considerably between 2000 and 2007. However, the much greater increase in
values than rents suggests that market participants expected the demand for living in high quality
of life areas to continue to grow.
A complementary approach is to look at housing value-rent ratios (aka price-rent ratio or
inversely rent-price ratio) and examine how these relate to quality of life across areas. A higher
value-rent ratio indicates that the demand for housing in the area is expected to grow faster than
other areas (Campbell et al. 2009). Higher future demand for local housing does not affect

17
current rental payments because these reflect the present user cost of housing, but higher future
demand does increase current housing values. The third and fourth columns of Table 6 regress
the log value-rent ratios in 2000 and 2007 on the rent-based quality of life estimate for 2000.
The results in both columns suggest that a higher quality of life increases the value-rent ratio in
an area with coefficients of 0.432 and 1.144 in 2000 and 2007, respectively.22
These results
suggest that the demand for housing was expected to increase in high quality of life areas in both
years, but by 2007 the expected growth in demand had grown quite considerably as values grew
much more quickly than rents. As economists and the general public were soon reminded,
however, expectations are not always accurate and asset values based on them can often become
considerably distorted. Hence, quality of life rankings should use housing rents and not housing
values.
6. Conclusion
This paper presents quality of estimates for 293 metropolitan areas in the year 2007 based
on differences in real wages across areas, where real wages are defined as nominal wages
adjusted for the local cost of living. Households receive utility from the quality of life in an area
and are willing to accept lower real wages to live in areas with nice amenities. The spatial
equilibrium hypothesis says that utility for identical workers should be equal across locations,
and a variant of the Rosen-Roback model shows that quality of life differences across areas can
be measured by differences in real wages. An important issue, though, is whether housing prices
should be measured by rental payments, owner-occupied housing values, or some combination of
the two. On theoretical grounds, rents are the superior measure of housing prices because rents
22 Lee and You (2011) also document that the value-income ratio is higher in high quality of life areas but they do
not focus on changes over time.

18
reflect the current user cost of housing, but housing values are based on the net present value of
future rental income and do not necessarily reflect the present user cost of housing. However,
many researchers have used a combination of rents and values assuming that the two basically
measure the same thing.
We compute separate quality of life estimates that measure housing prices by rents and
by values. The two series are highly correlated, but the housing value-based estimates are
considerably more dispersed. This is likely due in large part to the recent housing bubble, but
examination of quality of life estimates using data from 2000 shows a similar result, though to a
lesser extent. Expected and actual growth in rental payments differs across areas causing
housing values to be more dispersed than rents across areas. We conclude that future researchers
should be cautious in using housing values to measure housing prices in estimating quality of life
differences across areas.

19
References
Albouy D (2008) Are big cities really bad places to live? Improving quality-of-life estimates
across cities. NBER WP 14472
Albouy D (2009) The unequal geographic burden of federal taxation. J Polit Econ 117(4):635-
667
Banzhaf HS, Farooque O (2012) Interjurisdictional housing prices and spatial amenities: which
measures of housing prices reflect local public goods? NBER WP 17809
Beeson PE, Eberts, RW (1989) Identifying productivity and amenity effects in interurban wage
differentials. Rev Econ Stat 71(3):443-452
Blomquist GC, Berger MC, Hoehn, JP (1988) New estimates of quality of life in urban areas.
Amer Econ Rev 78(1):89–107
Campbell SD, Davis MA, Gallin J, Martin RF (2011) What moves housing markets: a variance
decomposition of the rent–price ratio. J Urban Econ 66(2):90-102
Chen Y, Rosenthal SS (2008) Local amenities and life-cycle migration: Do people move for jobs
or fun? J Urban Econ, 64(3):519-537
Clark TE (1995) Rents and prices of housing across areas of the United States: a cross-section
examination of the present value model. Reg Sci Urban Econ 25(2):237-247
Davis MA, Lehnert A, Martin RF (2008) The rent-price ratio for the aggregate stock of owner-
occupied housing. Rev Income Wealth 54(2):279-284
Davis MA, Ortalo-Magné F (2011) Household expenditures, wages, rents. Rev Econ
Dyn14(2):248–261
DuMond JM, Hirsch BT, Macpherson DA (1999) Wage differentials across labor markets and
workers: does cost of living matter? Econ Inq 37(4):577-598

20
Gabriel SA, Mattey JP, Wascher WL (2003) Compensating differentials and evolution in the
quality of life among U.S. states. Reg Sci Urban Econ 33(5):619-649
Gabriel SA, Rosenthal SS (2004) Quality of the business environment versus quality of life: do
firms and households like the same cities? Rev Econ Stat 86(1):438–444
Garner TI, Verbrugge R (2009) Reconciling user costs and rental equivalence: evidence from the
US consumer expenditure survey. J Hous Econ 18(3):172-192
Glaeser EL, Gyourko J, Saiz A (2008) Housing supply and housing bubbles. J Urban Econ
64(2):198-217
Greenwood MJ, Hunt G, Rickman DS, Treyz GI (2001) Migration, regional equilibrium, and the
estimation of compensating differentials. Amer Econ Rev 81(5):1382-1390
Gyourko J, Kahn M, Tracy J (1999) Quality of life and environmental comparisons. In: Cheshire
P, Mills ES (eds) Handbook of regional and urban economics, vol. 3. North Holland,
Amsterdam, pp 1413-1454
Gyourko J, Tracy J (1991) The structure of local public finance and the quality of life. J Polit
Econ 99(4):774–806
Henderson JV (1982) Evaluating consumer amenities and interregional welfare differences. J
Urban Econ 11(1):32-59
Howie P, Murphy SM, Wicks J (2010) An application of a stated preference method to value
urban amenities. Urban Stud 47(2):235-256
Kahn ME (1995) A revealed preference approach to ranking city quality of life. J Urban Econ
38(2):221-235
Koo J, Phillips KR, Sigalla FD (2000) Measuring regional cost of living. J Bus Econ Stat
18(1):127-136

21
Krupka DJ, Donaldson K (2007) Wages, rents and heterogeneous moving costs. IZA DP 3224
Lee S, You SD (2011) The price-to-income ratio and the quality of life. University of British
Columbia Working Paper
Ogaki M, Reinhart CM (1998) Measuring intertemporal substitution: the role of durable goods. J
Polit Econ 106(5):1078–1098
Oswald AJ, Wu S (2010) Objective confirmation of subjective measures of human well-being:
evidence from the USA. Sci 327 (2010):576–579
Oswald AJ, Wu S (2011) Well-being across America. Rev Econ Stat 93(4):1118–1134
Partridge MD, Rickman DS, Olfert MR, Ali K (2012) Dwindling U.S. internal migration:
evidence of spatial equilibrium or structural shifts in local labor markets? Reg Sci Urban
Econ 42(1-2):375–388
Piazessi M, Schneider M, Tuzel S (2007) Housing, consumption, and asset pricing. J Financ
Econ 83(3):531-569
Rappaport J (2007) Moving to nice weather. Reg Sci Urban Econ 37(3):375–398
Rappaport J (2009) The increasing importance of quality of life. J Econ Geogr 9(6):779-804
Roback J (1982) Wages, rents, and the quality of life. J Polit Econ 90(6):1257-1278
Rosen S (1979) Wage-based indexes of urban quality of life. In: Mieskowski P, Straszheim M
(eds) Current issues in urban economics. Johns Hopkins University Press, Baltimore, pp
74-104
Ruggles S, Sobek M, Alexander T, Fitch CA, Goeken R, Hall PK, King M, Ronnander C
(2008) Integrated Public Use Microdata Series: Version 4.0. Minneapolis: Minnesota
Population Center

22
Shapiro JM (2006) Smart cities: quality of life, productivity, and the growth effects of human
capital. Rev Econ Stat 88(2):324-335
Stover ME, Leven CL (1992) Methodological issues in the determination of the quality of life in
urban areas. Urban Stud 29(5):737-754
Verbrugge R (2008) The puzzling divergence of aggregate rents and user costs, 1980–2004. Rev
Income Wealth 54(4):671-699
Winters JV (2009) Wages and Prices: are workers fully compensated for cost of living
differences? Reg Sci Urban Econ 39(5):632-643
Winters JV (2011a) Human capital, higher education institutions, and quality of life. Reg Sci
Urban Econ 41(5):446-454
Winters JV (2011b) Why are smart cities growing? Who moves and who stays. J Reg Sci
51(2):253-270

23
Table 1: Summary Statistics for QOL Estimates, 2007
Rent-based QOL Estimate Value-based QOL Estimate
Mean 0.005 0.001
Standard Deviation 0.058 0.093
Max - Min 0.435 0.604
90th - 10th percentile 0.143 0.225
75th - 25th percentile 0.080 0.105
N=293.

24
Table 2: Quality of Life Estimates and Rankings, 2007
CBSA/CSA Name Rent-based Rent-based Value-based Value-based
QOL Est. QOL Rank QOL Est. QOL Rank
Honolulu, HI CBSA 0.266 1 0.402 1
Medford, OR CBSA* 0.162 2 0.311 3
Santa Barbara-Santa Maria-Goleta, CA CBSA* 0.156 3 0.323 2
Burlington-South Burlington, VT CBSA 0.154 4 0.173 15
State College, PA CBSA* 0.143 5 0.126 31
Fort Walton Beach-Crestview-Destin, FL CBSA* 0.129 6 0.116 33
Chico, CA CBSA* 0.124 7 0.248 7
Morgantown, WV CBSA 0.111 8 0.066 62
Bangor, ME CBSA 0.110 9 0.098 38
Eugene-Springfield, OR CBSA 0.108 10 0.164 18
San Luis Obispo-Paso Robles, CA CBSA* 0.106 11 0.303 4
Blacksburg-Christiansburg-Radford, VA CBSA* 0.104 12 0.059 65
Coeur d'Alene, ID CBSA* 0.102 13 0.209 11
Anchorage, AK CBSA 0.098 14 0.093 45
St. George, UT CBSA 0.094 15 0.094 43
Bowling Green, KY CBSA 0.092 16 0.024 94
Panama City-Lynn Haven, FL CBSA* 0.091 17 0.088 48
Missoula, MT CBSA 0.089 18 0.154 20
New Orleans-Metairie-Bogalusa, LA CSA 0.089 19 -0.020 155
Portland-Vancouver-Beaverton, OR-WA CBSA 0.088 20 0.157 19
*Indicates non-housing prices are imputed for the CBSA/CSA.

25
Table 3: Summary Statistics for QOL Estimates, 2000
Rent-based QOL Estimate Value-based QOL Estimate
Mean -0.027 -0.029
Standard Deviation 0.071 0.080
Max - Min 0.429 0.485
90th - 10th percentile 0.188 0.208
75th - 25th percentile 0.093 0.098
N=293.

26
Table 4: Quality of Life Estimates and Rankings, 2000
CBSA/CSA Name Rent-based Rent-based Value-based Value-based
QOL Est. QOL Rank QOL Est. QOL Rank
Prescott, AZ CBSA 0.196 1 0.246 1
Missoula, MT CBSA 0.195 2 0.217 2
St. George, UT CBSA 0.157 3 0.159 7
Billings, MT CBSA* 0.131 4 0.140 13
Cheyenne, WY CBSA 0.127 5 0.105 23
Fort Walton Beach-Crestview-Destin, FL CBSA* 0.116 6 0.068 33
Flagstaff, AZ CBSA 0.105 7 0.098 27
Eugene-Springfield, OR CBSA 0.103 8 0.145 10
Great Falls, MT CBSA* 0.102 9 0.141 12
Coeur d'Alene, ID CBSA* 0.100 10 0.136 14
Grand Junction, CO CBSA 0.099 11 0.121 17
Morgantown, WV CBSA 0.089 12 0.009 82
Albany-Corvallis-Lebanon, OR CSA* 0.089 13 0.129 15
Panama City-Lynn Haven, FL CBSA* 0.089 14 0.061 36
Lake Havasu City-Kingman, AZ CBSA 0.086 15 0.102 24
Medford, OR CBSA* 0.084 16 0.153 9
Casper, WY CBSA* 0.084 17 0.101 25
Chico, CA CBSA* 0.083 18 0.116 19
Abilene, TX CBSA 0.082 19 0.025 67
Lewiston, ID-WA CBSA* 0.080 20 0.106 22
* Indicates that non-housing prices are imputed for the CBSA/CSA.

27
Table 5: Comparison of Year 2000 QOL Ranks for 20 Largest Metro Areas
CBSA/CSA Name Rent-based Value-based Chen-Rosenthal Albouy
QOL Rank QOL Rank QOL Rank QOL Rank
(out of 293) (out of 293) (out of 346) (out of 241)
New York-Newark-Bridgeport, NY-NJ-CT-PA 173 41 203 43
Los Angeles-Long Beach-Riverside, CA 129 42 20 17
Chicago-Naperville-Michigan City, IL-IN-WI 267 229 274 80
Washington-Baltimore-N. VA, DC-MD-VA-WV 228 258 316 116
Boston-Worcester-Manchester, MA-RI-NH 227 81 91 34
San Jose-San Francisco-Oakland, CA 86 6 3 6
Philadelphia-Camden-Vineland, PA-NJ-DE-MD 275 275 340 184
Dallas-Fort Worth, TX 247 285 323 176
Detroit-Warren-Flint, MI 291 289 342 186
Miami-Fort Lauderdale-Pompano Beach, FL 123 187 75 33
Houston-Baytown-Huntsville, TX 280 292 335 221
Atlanta-Sandy Springs-Gainesville, GA-AL 219 280 295 175
Seattle-Tacoma-Olympia, WA 138 74 68 30
Minneapolis-St. Paul-St. Cloud, MN-WI 215 237 313 143
Phoenix-Mesa-Scottsdale, AZ 131 201 205 62
Cleveland-Akron-Elyria, OH 230 160 288 126
San Diego-Carlsbad-San Marcos, CA 22 11 12 7
St. Louis-St. Charles-Farmington, MO-IL 272 279 307 170
Denver-Aurora-Boulder, CO 140 140 127 35
Pittsburgh-New Castle, PA 154 109 287 188

28
Table 6: Effects of Rent-based QOL on Changes in Log Rents and Home Values, 2000-2007
Dependent
Variable ∆ Ln Rent FE,
2000-2007 ∆ Ln Value FE,
2000-2007
Ln Value-Rent
Ratio, 2000
Ln Value-Rent
Ratio, 2007
Rent-based QOL 0.155*** 0.867*** 0.432*** 1.144***
(0.056) (0.143) (0.132) (0.217)
R2 0.03 0.11 0.04 0.09
Standard errors in parentheses. ***Significant at 1%.

29
Appendix Table A: Complete Quality of Life Estimates and Rankings, 2000 & 2007
CBSA/CSA Name Rent- Rent- Value- Value- Rent- Rent- Value- Value-
based based based based based based based based
Est. Rank Est. Rank Est. Rank Est. Rank
2007 2007 2007 2007 2000 2000 2000 2000
Abilene, TX CBSA 0.058 48 -0.054 209 0.082 19 0.025 67
Albany, GA CBSA -0.013 175 -0.046 200 -0.104 255 -0.115 261
Albany-Corvallis-Lebanon, OR CSA* 0.058 50 0.146 21 0.089 13 0.129 15
Albany-Schenectady-Amsterdam, NY CSA -0.034 216 -0.033 174 -0.120 265 -0.097 242
Albuquerque, NM CBSA 0.007 136 -0.009 140 0.011 91 0.009 83
Alexandria, LA CBSA* 0.056 53 -0.032 172 0.015 83 -0.013 110
Allentown-Bethlehem-Easton, PA-NJ CBSA* -0.015 178 0.023 96 -0.111 259 -0.077 213
Altoona, PA CBSA* 0.041 78 -0.005 133 -0.071 211 -0.056 181
Amarillo, TX CBSA -0.003 160 -0.067 226 -0.011 117 -0.048 167
Ames-Boone, IA CSA 0.028 100 0.014 104 -0.020 132 -0.036 139
Anchorage, AK CBSA 0.098 14 0.093 45 -0.001 105 -0.043 158
Anniston-Oxford, AL CBSA 0.051 58 -0.009 138 0.002 98 -0.016 115
Appleton-Oshkosh-Neenah, WI CSA* -0.099 286 -0.060 219 -0.132 273 -0.096 241
Asheville-Brevard, NC CSA 0.049 63 0.075 57 0.058 42 0.085 31
Athens-Clarke County, GA CBSA* 0.034 88 0.012 107 -0.010 116 -0.021 120
Atlanta-Sandy Springs-Gainesville, GA-AL CSA -0.026 206 -0.101 267 -0.074 219 -0.148 280
Atlantic City-Hammonton, NJ CBSA* -0.053 250 0.031 81 -0.232 293 -0.197 290
Augusta-Richmond County, GA-SC CBSA -0.048 241 -0.086 251 -0.062 194 -0.072 206
Austin-Round Rock, TX CBSA -0.016 185 -0.066 224 -0.028 145 -0.089 231
Bakersfield, CA CBSA -0.023 201 0.044 73 -0.063 200 -0.055 179
Bangor, ME CBSA 0.110 9 0.098 38 0.055 43 0.059 38
Barnstable Town, MA CBSA* 0.038 81 0.185 13 -0.005 111 0.113 20
Baton Rouge-Pierre Part, LA CSA -0.011 172 -0.080 243 -0.051 179 -0.074 208
Battle Creek, MI CBSA* 0.004 146 -0.040 188 -0.116 261 -0.140 274
Beaumont-Port Arthur, TX CBSA -0.097 284 -0.186 292 -0.133 274 -0.183 288
Bellingham, WA CBSA 0.028 104 0.142 22 0.070 30 0.107 21
Bend-Prineville, OR CSA* 0.059 46 0.243 8 0.061 35 0.121 18
Billings, MT CBSA* 0.031 94 0.020 99 0.131 4 0.140 13
Binghamton, NY CBSA* -0.016 184 -0.055 212 -0.040 161 -0.029 131
Birmingham-Hoover-Cullman, AL CSA -0.017 188 -0.080 244 -0.089 242 -0.118 263
Bismarck, ND CBSA* 0.009 131 -0.043 196 0.061 36 0.045 45
Blacksburg-Christiansburg-Radford, VA CBSA* 0.104 12 0.059 65 0.017 76 -0.005 96
Bloomington, IN CBSA 0.051 57 -0.021 156 0.028 65 -0.003 95
Bloomington-Normal, IL CBSA -0.043 232 -0.078 241 -0.099 249 -0.103 249
Boise City-Nampa, ID CBSA* 0.022 115 0.043 74 0.000 101 -0.027 127
Boston-Worcester-Manchester, MA-RI-NH CSA 0.022 113 0.130 27 -0.078 227 0.011 81
Bowling Green, KY CBSA 0.092 16 0.024 94 0.028 66 -0.007 103
Brownsville-Harlingen-Raymondville, TX CSA -0.089 281 -0.111 273 -0.028 144 -0.035 137
Brunswick, GA CBSA* 0.014 125 0.047 72 -0.062 196 -0.050 171
Buffalo-Niagara-Cattaraugus, NY CSA -0.061 257 -0.071 233 -0.118 264 -0.091 233
Burlington-South Burlington, VT CBSA 0.154 4 0.173 15 0.070 28 0.092 29
Canton-Massillon, OH CBSA* -0.053 251 -0.039 185 -0.064 202 -0.040 149
Cape Coral-Fort Myers, FL CBSA 0.002 148 0.030 82 0.008 92 0.001 90
Casper, WY CBSA* -0.039 226 -0.045 197 0.084 17 0.101 25
Cedar Rapids, IA CBSA -0.012 174 -0.028 163 -0.084 235 -0.067 197
Champaign-Urbana, IL CBSA 0.015 123 -0.025 160 -0.027 143 -0.063 191
Charleston, WV CBSA -0.023 200 -0.067 229 -0.075 222 -0.081 223
Charleston-North Charleston-Summerv., SC CBSA 0.069 38 0.041 75 0.018 73 -0.008 105

30
Charlotte-Gastonia-Salisbury, NC-SC CSA -0.048 238 -0.092 259 -0.062 197 -0.085 225
Charlottesville, VA CBSA 0.075 34 0.096 40 0.035 57 0.006 87
Chattanooga-Cleveland-Athens, TN-GA CSA -0.036 221 -0.047 202 -0.033 151 -0.039 147
Cheyenne, WY CBSA 0.022 114 0.007 115 0.127 5 0.105 23
Chicago-Naperville-Michigan City, IL-IN-WI CSA -0.062 259 -0.038 182 -0.126 267 -0.086 229
Chico, CA CBSA* 0.124 7 0.248 7 0.083 18 0.116 19
Cincinnati-Middletown-Wilm., OH-KY-IN CSA -0.108 287 -0.128 281 -0.144 284 -0.129 271
Clarksville, TN-KY CBSA* 0.051 59 0.006 118 0.012 89 -0.023 124
Cleveland-Akron-Elyria, OH CSA -0.040 229 -0.049 205 -0.082 230 -0.045 160
Coeur d'Alene, ID CBSA* 0.102 13 0.209 11 0.100 10 0.136 14
College Station-Bryan, TX CBSA* 0.028 102 -0.028 162 -0.016 125 -0.081 221
Colorado Springs, CO CBSA 0.058 47 -0.005 134 0.049 50 -0.020 119
Columbia, MO CBSA 0.028 101 -0.032 170 0.067 32 0.031 61
Columbia-Newberry, SC CSA -0.032 214 -0.098 262 -0.071 209 -0.095 238
Columbus-Auburn-Opelika, GA-AL CSA 0.053 56 -0.012 145 0.000 102 -0.037 143
Columbus-Marion-Chillicothe, OH CSA -0.063 261 -0.089 255 -0.126 266 -0.114 260
Corpus Christi-Kingsville, TX CSA -0.018 189 -0.113 275 -0.060 192 -0.108 256
Cumberland, MD-WV CBSA* -0.038 224 0.003 121 -0.018 128 0.026 66
Dallas-Fort Worth, TX CSA -0.071 271 -0.148 287 -0.096 247 -0.166 285
Dalton, GA CBSA* 0.011 129 -0.012 144 -0.016 124 -0.035 138
Danville, IL CBSA -0.068 266 -0.091 256 -0.050 177 -0.050 170
Danville, VA CBSA* -0.003 157 -0.082 247 -0.022 139 -0.021 122
Davenport-Moline-Rock Island, IA-IL CBSA -0.025 204 -0.030 168 -0.058 189 -0.051 172
Dayton-Springfield-Greenville, OH CSA -0.040 228 -0.065 223 -0.117 262 -0.106 253
Decatur, IL CBSA* -0.089 282 -0.169 291 -0.138 277 -0.145 277
Denver-Aurora-Boulder, CO CSA -0.015 182 -0.019 151 -0.022 140 -0.036 140
Des Moines-Newton-Pella, IA CSA -0.068 268 -0.110 272 -0.056 188 -0.085 227
Detroit-Warren-Flint, MI CSA -0.121 290 -0.132 282 -0.217 291 -0.192 289
Dothan-Enterprise-Ozark, AL CSA 0.045 70 -0.002 128 -0.009 114 -0.024 125
Dover, DE CBSA 0.008 135 -0.059 216 -0.022 137 -0.042 155
Dubuque, IA CBSA 0.036 84 0.029 83 -0.021 135 0.003 89
Duluth, MN-WI CBSA* 0.000 152 0.026 89 -0.090 244 -0.067 195
Eau Claire-Menomonie, WI CSA 0.023 112 0.000 125 -0.034 153 -0.006 99
El Centro, CA CBSA* -0.125 292 0.023 95 -0.069 207 -0.059 185
El Paso, TX CBSA -0.009 166 -0.017 148 -0.049 174 -0.060 186
Elmira, NY CBSA* 0.044 74 -0.029 166 -0.037 156 -0.059 184
Erie, PA CBSA -0.039 227 -0.031 169 -0.075 223 -0.038 146
Eugene-Springfield, OR CBSA 0.108 10 0.164 18 0.103 8 0.145 10
Evansville, IN-KY CBSA 0.007 138 -0.054 210 -0.077 226 -0.091 232
Fairbanks, AK CBSA 0.086 25 0.094 42 0.060 39 0.065 35
Fargo-Wahpeton, ND-MN CSA 0.012 128 -0.003 132 -0.003 107 -0.014 112
Farmington, NM CBSA 0.005 141 0.081 53 0.014 85 0.026 63
Fayetteville, NC CBSA 0.076 31 0.010 113 0.071 26 0.045 44
Fayetteville-Springdale-Rogers, AR-MO CBSA 0.030 95 0.010 112 -0.020 133 -0.041 152
Flagstaff, AZ CBSA 0.029 97 0.083 51 0.105 7 0.098 27
Florence, SC CBSA* -0.009 168 -0.041 190 -0.095 246 -0.079 216
Florence-Muscle Shoals, AL CBSA -0.007 165 -0.070 232 -0.032 150 -0.036 142
Fond du Lac-Beaver Dam, WI CSA* -0.049 243 -0.007 135 -0.089 243 -0.027 128
Fort Collins-Loveland, CO CBSA 0.065 43 0.088 47 0.044 51 0.041 50
Fort Smith, AR-OK CBSA -0.003 158 -0.043 195 0.012 90 -0.007 101
Fort Walton Beach-Crestview-Destin, FL CBSA* 0.129 6 0.116 33 0.116 6 0.068 33
Fort Wayne-Huntington-Auburn, IN CSA -0.087 279 -0.155 289 -0.130 271 -0.176 287
Fresno-Madera, CA CSA -0.031 213 0.069 60 -0.029 147 -0.009 107
Gadsden, AL CBSA* 0.050 60 -0.009 137 -0.063 199 -0.062 189

31
Gainesville, FL CBSA -0.048 242 -0.041 193 0.058 41 0.022 68
Goldsboro, NC CBSA* -0.006 163 0.017 102 0.024 69 0.046 43
Grand Forks, ND-MN CBSA* -0.023 199 -0.077 240 0.044 52 0.021 69
Grand Junction, CO CBSA 0.049 65 0.093 44 0.099 11 0.121 17
Grand Rapids-Muskegon-Holland, MI CSA -0.027 209 -0.037 179 -0.100 250 -0.098 243
Great Falls, MT CBSA* 0.037 82 0.073 59 0.102 9 0.141 12
Green Bay, WI CBSA -0.061 255 -0.041 192 -0.143 281 -0.105 252
Greensboro-Winston-Salem-High Point, NC CSA -0.015 180 -0.050 207 -0.077 224 -0.075 210
Greenville, NC CBSA -0.009 167 -0.040 189 -0.088 241 -0.069 198
Greenville-Spartanburg-Anderson, SC CSA -0.014 176 -0.040 186 -0.084 234 -0.096 240
Gulfport-Biloxi-Pascagoula, MS CSA 0.050 62 -0.026 161 -0.002 106 -0.043 157
Hagerstown-Martinsburg, MD-WV CBSA* -0.035 218 0.014 105 -0.084 232 -0.071 204
Hanford-Corcoran, CA CBSA* 0.066 42 0.134 24 -0.050 178 -0.071 202
Harrisburg-Carlisle-Lebanon, PA CSA* -0.010 170 -0.010 141 -0.109 257 -0.102 248
Harrisonburg, VA CBSA 0.014 124 0.027 88 -0.012 119 0.016 77
Hartford-West Hartford-Willimantic, CT CSA -0.049 244 0.008 114 -0.144 283 -0.079 217
Hattiesburg, MS CBSA 0.033 91 -0.034 176 0.051 49 0.017 75
Hickory-Lenoir-Morganton, NC CBSA 0.001 150 -0.002 129 -0.005 110 -0.006 100
Honolulu, HI CBSA 0.266 1 0.402 1 0.068 31 0.167 5
Hot Springs, AR CBSA 0.079 28 0.033 80 0.030 63 0.037 54
Houma-Bayou Cane-Thibodaux, LA CBSA* -0.037 223 -0.069 230 -0.051 182 -0.078 214
Houston-Baytown-Huntsville, TX CSA -0.116 289 -0.201 293 -0.143 280 -0.210 292
Huntington-Ashland, WV-KY-OH CBSA* 0.006 140 -0.045 198 -0.066 203 -0.081 222
Huntsville-Decatur, AL CSA -0.019 195 -0.069 231 -0.077 225 -0.107 254
Idaho Falls-Blackfoot, ID CSA 0.028 103 0.006 119 0.059 40 0.059 37
Indianapolis-Anderson-Columbus, IN CSA -0.069 269 -0.132 283 -0.103 254 -0.134 272
Iowa City, IA CBSA* 0.029 98 0.006 116 -0.004 109 -0.010 108
Ithaca-Cortland, NY CSA 0.075 32 0.024 92 0.036 56 -0.005 97
Jackson, MI CBSA* -0.016 183 -0.009 139 -0.128 269 -0.109 257
Jackson-Humboldt, TN CSA -0.049 245 -0.115 278 -0.060 191 -0.075 209
Jacksonville, FL CBSA 0.024 105 0.001 124 -0.017 126 -0.072 205
Jacksonville, NC CBSA* 0.079 29 0.026 90 0.076 21 0.036 55
Jackson-Yazoo City, MS CSA -0.020 196 -0.102 268 -0.085 237 -0.143 276
Janesville, WI CBSA 0.014 126 0.011 110 -0.154 289 -0.119 265
Jefferson City, MO CBSA -0.045 234 -0.064 222 0.007 94 0.009 85
Johnson City-Kingsport-Bristol, TN-VA CSA -0.033 215 -0.038 183 -0.039 159 -0.028 129
Johnstown, PA CBSA -0.044 233 -0.018 150 -0.086 239 -0.037 145
Jonesboro-Paragould, AR CSA 0.029 99 -0.024 158 -0.008 112 -0.035 136
Joplin, MO CBSA 0.029 96 -0.033 173 0.044 53 0.009 84
Kalamazoo-Portage, MI CBSA -0.006 164 -0.028 165 -0.102 253 -0.093 236
Kansas City-Overland Park, MO-KS CSA -0.038 225 -0.084 249 -0.075 221 -0.121 266
Kennewick-Pasco-Richland, WA CBSA -0.093 283 -0.105 269 -0.099 248 -0.115 262
Killeen-Temple-Fort Hood, TX CBSA 0.004 145 -0.059 218 0.061 34 0.020 70
Knoxville-Sevierville-La Follette, TN CSA -0.011 173 -0.032 171 -0.009 115 -0.001 93
Kokomo-Peru, IN CSA* -0.168 293 -0.150 288 -0.223 292 -0.239 293
La Crosse, WI-MN CBSA* 0.023 109 0.027 86 -0.074 218 -0.013 111
Lafayette-Acadiana, LA CSA 0.034 89 -0.010 142 -0.015 122 -0.030 132
Lafayette-Frankfort, IN CSA -0.003 159 -0.097 261 -0.054 185 -0.079 218
Lake Charles-Jennings, LA CSA -0.047 236 -0.112 274 -0.082 231 -0.105 251
Lake Havasu City-Kingman, AZ CBSA 0.043 76 0.131 25 0.086 15 0.102 24
Lakeland-Winter Haven, FL CBSA* 0.020 117 -0.001 126 -0.003 108 -0.031 133
Lancaster, PA CBSA 0.002 147 -0.003 130 -0.049 175 -0.035 135
Lansing-East Lansing-Owosso, MI CSA* -0.048 239 -0.081 246 -0.140 278 -0.161 284
Laredo, TX CBSA* -0.018 192 -0.034 175 -0.046 168 -0.040 150

32
Las Cruces, NM CBSA 0.086 22 0.113 34 0.015 81 0.034 58
Las Vegas-Paradise-Pahrump, NV CSA -0.098 285 -0.094 260 -0.085 236 -0.153 281
Lawrence, KS CBSA 0.058 49 0.028 85 0.035 58 0.001 91
Lawton, OK CBSA 0.057 51 -0.017 147 0.074 23 0.029 62
Lewiston, ID-WA CBSA* 0.063 45 0.084 50 0.080 20 0.106 22
Lexington--Frankfort--Richmond, KY CSA 0.023 108 0.006 117 -0.031 148 -0.053 174
Lima-Van Wert-Wapakoneta, OH CSA 0.007 139 -0.002 127 -0.113 260 -0.108 255
Lincoln, NE CBSA* 0.004 144 -0.020 154 -0.009 113 -0.015 114
Little Rock-N. Little Rock-Pine Bluff, AR CSA 0.031 92 -0.018 149 -0.033 152 -0.055 178
Logan, UT-ID CBSA* 0.066 41 0.012 108 0.030 62 0.011 80
Longview, WA CBSA* 0.047 68 0.173 16 -0.055 186 0.031 60
Longview-Marshall, TX CSA* 0.001 149 -0.035 178 -0.037 157 -0.064 192
Los Angeles-Long Beach-Riverside, CA CSA 0.056 52 0.213 10 -0.018 129 0.047 42
Louisville-Elizabethtown-Scotts., KY-IN CSA -0.018 190 -0.025 159 -0.071 210 -0.066 193
Lubbock-Levelland, TX CSA 0.036 85 -0.049 206 0.015 82 -0.056 180
Lynchburg, VA CBSA* 0.017 121 0.016 103 -0.042 164 -0.047 162
Macon-Warner Robins-Fort Valley, GA CSA* -0.042 231 -0.114 277 -0.086 240 -0.110 259
Madison-Baraboo, WI CSA* 0.008 133 0.027 87 -0.051 180 -0.020 118
Mansfield-Bucyrus, OH CSA -0.035 217 -0.039 184 -0.105 256 -0.067 196
McAllen-Edinburg-Mission, TX CBSA -0.047 237 -0.098 263 -0.062 195 -0.058 182
Medford, OR CBSA* 0.162 2 0.311 3 0.084 16 0.153 9
Memphis, TN-MS-AR CBSA -0.068 267 -0.146 286 -0.150 286 -0.202 291
Merced, CA CBSA* -0.082 276 0.081 52 -0.071 213 -0.044 159
Miami-Ft. Lauderdale-Pomp. Beach, FL CBSA 0.069 37 0.095 41 -0.016 123 -0.060 187
Midland-Odessa, TX CSA -0.064 263 -0.156 290 -0.018 130 -0.079 215
Milwaukee-Racine-Waukesha, WI CSA -0.084 278 -0.046 199 -0.149 285 -0.102 247
Minneapolis-St. Paul-St. Cloud, MN-WI CSA -0.015 181 -0.020 153 -0.073 215 -0.094 237
Missoula, MT CBSA 0.089 18 0.154 20 0.195 2 0.217 2
Mobile-Daphne-Fairhope, AL CSA 0.043 77 0.003 123 -0.042 165 -0.062 190
Modesto, CA CBSA* -0.019 194 0.097 39 -0.071 212 -0.070 200
Monroe-Bastrop, LA CSA* -0.064 262 -0.085 250 0.000 104 -0.023 123
Montgomery-Alexander City, AL CSA 0.023 110 -0.058 215 0.000 100 -0.050 168
Morgantown, WV CBSA 0.111 8 0.066 62 0.089 12 0.009 82
Muncie, IN CBSA* -0.060 253 -0.100 266 -0.068 206 -0.085 228
Myrtle Beach-Conway-Georgetown, SC CSA 0.044 72 0.048 71 0.053 48 0.038 52
Naples-Marco Island, FL CBSA* 0.010 130 0.122 32 -0.032 149 0.000 92
Nashville--Murfreesboro--Columbia, TN CSA 0.009 132 -0.024 157 -0.080 229 -0.100 246
New Orleans-Metairie-Bogalusa, LA CSA 0.089 19 -0.020 155 -0.021 136 -0.036 141
New York-Newark-Bridge., NY-NJ-CT-PA CSA 0.018 120 0.136 23 -0.048 173 0.049 41
Niles-Benton Harbor, MI CBSA* -0.005 162 0.035 77 -0.071 208 -0.048 166
Norwich-New London, CT CBSA -0.061 256 0.010 111 -0.084 233 -0.033 134
Ocala, FL CBSA* 0.013 127 0.051 68 0.070 29 0.039 51
Ocean City, NJ CBSA* -0.036 220 0.165 17 -0.101 252 -0.027 126
Oklahoma City-Shawnee, OK CSA 0.007 137 -0.057 214 0.003 96 -0.054 175
Omaha-Council Bluffs-Fremont, NE-IA CSA -0.026 207 -0.062 220 -0.075 220 -0.099 245
Orlando-Deltona-Daytona Beach, FL CSA 0.087 21 0.069 61 0.001 99 -0.071 203
Owensboro, KY CBSA* -0.124 291 -0.087 252 -0.047 171 -0.054 176
Palm Bay-Melbourne-Titusville, FL CBSA* 0.040 80 0.029 84 0.032 61 -0.021 121
Panama City-Lynn Haven, FL CBSA* 0.091 17 0.088 48 0.089 14 0.061 36
Parkersburg-Marietta-Vienna, WV-OH CBSA* 0.005 142 -0.040 187 -0.043 166 -0.043 156
Pensacola-Ferry Pass-Brent, FL CBSA* 0.086 24 0.033 79 0.072 24 0.032 59
Peoria-Canton, IL CSA -0.046 235 -0.072 236 -0.154 287 -0.122 267
Philadelphia-Camden-Vine., PA-NJ-DE-MD CSA -0.005 161 -0.003 131 -0.133 275 -0.140 275
Phoenix-Mesa-Scottsdale, AZ CBSA -0.026 208 -0.019 152 -0.020 131 -0.070 201

33
Pittsburgh-New Castle, PA CSA -0.037 222 -0.059 217 -0.035 154 -0.012 109
Pittsfield, MA CBSA 0.024 106 0.088 49 -0.028 146 0.057 39
Pocatello, ID CBSA* 0.031 93 -0.011 143 0.054 46 0.044 48
Port St. Lucie-Sebastian-Vero Beach, FL CSA 0.049 66 0.061 64 0.022 72 0.019 71
Portland-Lewiston-South Portland, ME CSA 0.071 36 0.130 26 0.054 47 0.122 16
Portland-Vancouver-Beaverton, OR-WA CBSA 0.088 20 0.157 19 0.002 97 0.037 53
Prescott, AZ CBSA 0.072 35 0.192 12 0.196 1 0.246 1
Provo-Orem, UT CBSA* 0.036 86 0.020 98 0.023 70 -0.006 98
Pueblo, CO CBSA -0.051 247 -0.048 204 0.016 78 0.017 73
Raleigh-Durham-Cary, NC CSA -0.025 205 -0.063 221 -0.061 193 -0.093 234
Rapid City, SD CBSA* 0.079 27 0.110 35 0.062 33 0.093 28
Redding, CA CBSA* 0.044 75 0.177 14 0.055 44 0.081 32
Reno-Sparks-Fernley, NV CSA 0.021 116 0.078 56 0.013 88 0.006 86
Richmond, VA CBSA 0.005 143 -0.008 136 -0.063 198 -0.081 220
Roanoke, VA CBSA -0.051 248 -0.075 238 -0.046 167 -0.047 163
Rochester, MN CBSA -0.030 211 -0.084 248 -0.110 258 -0.154 282
Rochester-Batavia-Seneca Falls, NY CSA -0.024 202 -0.054 211 -0.067 204 -0.087 230
Rockford-Freeport-Rochelle, IL CSA -0.064 264 -0.079 242 -0.165 290 -0.138 273
Rocky Mount, NC CBSA* -0.084 277 -0.088 254 -0.046 169 -0.042 154
Rome, GA CBSA -0.002 155 -0.038 181 -0.051 183 -0.051 173
Sacramento-Arcade-Yuba, CA-NV CSA 0.020 118 0.126 29 -0.012 120 0.015 78
Saginaw-Bay City-Saginaw Twp. N., MI CSA* -0.049 246 -0.072 234 -0.154 288 -0.147 278
Salem, OR CBSA* 0.068 39 0.126 30 0.023 71 0.066 34
Salinas, CA CBSA* 0.075 33 0.268 6 0.018 75 0.169 3
Salisbury-Ocean Pines, MD CSA* -0.076 274 -0.028 164 -0.036 155 -0.028 130
Salt Lake City-Ogden-Clearfield, UT CSA 0.048 67 0.022 97 0.008 93 -0.019 117
San Angelo, TX CBSA 0.035 87 -0.043 194 0.044 54 -0.007 104
San Antonio, TX CBSA -0.010 171 -0.067 227 -0.063 201 -0.119 264
San Diego-Carlsbad-San Marcos, CA CBSA 0.086 23 0.237 9 0.075 22 0.142 11
San Jose-San Francisco-Oakland, CA CSA 0.067 40 0.273 5 0.014 86 0.160 6
San Luis Obispo-Paso Robles, CA CBSA* 0.106 11 0.303 4 0.055 45 0.157 8
Santa Barbara-Santa Maria-Goleta, CA CBSA* 0.156 3 0.323 2 0.072 25 0.169 4
Santa Fe-Espanola, NM CSA* 0.023 111 0.079 54 0.034 60 0.100 26
Sarasota-Bradenton-Punta Gorda, FL CSA 0.081 26 0.109 36 0.060 37 0.044 46
Savannah-Hinesville-Fort Stewart, GA CSA -0.015 179 -0.041 191 -0.052 184 -0.069 199
Scranton--Wilkes-Barre, PA CBSA* 0.000 153 0.003 122 -0.073 216 -0.042 153
Seattle-Tacoma-Olympia, WA CSA 0.000 151 0.093 46 -0.022 138 0.017 74
Sheboygan, WI CBSA 0.024 107 0.057 66 -0.137 276 -0.076 212
Shreveport-Bossier City-Minden, LA CSA -0.024 203 -0.081 245 -0.073 217 -0.128 270
Sioux City-Vermillion, IA-NE-SD CSA -0.051 249 -0.092 258 -0.026 141 -0.048 165
Sioux Falls, SD CBSA* 0.040 79 0.013 106 0.015 80 0.004 88
South Bend-Elkhart-Mishawaka, IN-MI CSA -0.080 275 -0.141 284 -0.129 270 -0.158 283
Spokane, WA CBSA 0.049 64 0.053 67 0.029 64 0.026 65
Springfield, IL CBSA -0.060 254 -0.119 279 -0.118 263 -0.125 269
Springfield, MA CBSA* -0.058 252 0.024 93 -0.039 160 0.044 47
Springfield, MO CBSA 0.050 61 0.019 100 0.040 55 0.016 76
St. George, UT CBSA 0.094 15 0.094 43 0.157 3 0.159 7
St. Joseph, MO-KS CBSA -0.001 154 -0.047 201 -0.017 127 -0.050 169
St. Louis-St. Charles-Farmington, MO-IL CSA -0.076 273 -0.107 271 -0.132 272 -0.147 279
State College, PA CBSA* 0.143 5 0.126 31 0.070 27 0.050 40
Stockton, CA CBSA* -0.021 197 0.102 37 -0.101 251 -0.083 224
Sumter, SC CBSA -0.061 258 -0.106 270 0.016 77 -0.007 102
Syracuse-Auburn, NY CSA -0.019 193 -0.047 203 -0.094 245 -0.085 226
Tallahassee, FL CBSA* 0.056 54 0.036 76 0.060 38 0.036 56

34
Tampa-St. Petersburg-Clearwater, FL CBSA 0.033 90 0.018 101 0.014 87 -0.047 164
Terre Haute, IN CBSA -0.070 270 -0.099 265 -0.038 158 -0.046 161
Texarkana, TX-Texarkana, AR CBSA* -0.018 191 -0.072 235 -0.047 172 -0.079 219
Toledo-Fremont, OH CSA* -0.113 288 -0.113 276 -0.126 268 -0.103 250
Topeka, KS CBSA -0.030 212 -0.088 253 -0.041 163 -0.093 235
Tucson, AZ CBSA 0.054 55 0.078 55 0.024 68 0.041 49
Tulsa-Bartlesville, OK CSA 0.044 73 -0.013 146 0.014 84 -0.041 151
Tuscaloosa, AL CBSA -0.021 198 -0.053 208 -0.015 121 -0.037 144
Tyler-Jacksonville, TX CSA -0.010 169 -0.076 239 -0.046 170 -0.095 239
Utica-Rome, NY CBSA* -0.029 210 -0.067 228 -0.073 214 -0.073 207
Valdosta, GA CBSA 0.018 119 -0.030 167 0.005 95 -0.008 106
Victoria, TX CBSA -0.035 219 -0.092 257 -0.140 279 -0.176 286
Virg. Beach-Norfolk-Newp. News, VA-NC CBSA 0.017 122 0.012 109 0.000 103 -0.017 116
Visalia-Porterville, CA CBSA* -0.041 230 0.050 69 -0.027 142 -0.001 94
Waco, TX CBSA -0.063 260 -0.142 285 -0.041 162 -0.076 211
Washington-Balt.-N. VA, DC-MD-VA-WV CSA -0.017 187 0.004 120 -0.078 228 -0.109 258
Waterloo-Cedar Falls, IA CBSA 0.046 69 0.025 91 0.018 74 0.026 64
Wausau-Merrill, WI CSA -0.087 280 -0.074 237 -0.067 205 -0.061 188
Weirton-Steubenville, WV-OH CBSA* -0.048 240 -0.035 177 -0.059 190 -0.058 183
Wenatchee, WA CBSA* -0.014 177 0.129 28 0.035 59 0.089 30
Wheeling, WV-OH CBSA* 0.045 71 -0.038 180 -0.056 187 -0.054 177
Wichita Falls, TX CBSA* 0.008 134 -0.125 280 0.016 79 -0.040 148
Wichita-Winfield, KS CSA -0.002 156 -0.057 213 -0.049 176 -0.098 244
Williamsport-Lock Haven, PA CSA* 0.064 44 0.049 70 -0.020 134 0.014 79
Wilmington, NC CBSA 0.037 83 0.064 63 0.024 67 0.034 57
Yakima, WA CBSA* -0.016 186 0.034 78 -0.051 181 -0.014 113
York-Hanover-Gettysburg, PA CSA -0.066 265 -0.067 225 -0.085 238 -0.067 194
Youngstown-Warren-East Liverpool, OH-PA CSA -0.073 272 -0.099 264 -0.144 282 -0.125 268
Yuma, AZ CBSA 0.078 30 0.073 58 -0.012 118 0.019 72
* Indicates that non-housing prices are imputed for the CBSA/CSA.