Embed Size (px)
Citation preview

Dietary Intake, Nutritional Status of Lactating
Women and their 6-23-Months-Old Children in
Genta Afeshum District, Rural Ethiopia;
Adaptation and Validation of Calculator for
Inadequate Micronutrient Intake (CIMI)
Dissertation submitted in the fulfillment of the requirements for the
Doctoral Degree of Natural Sciences (Dr. rer. nat. / Ph.D)
Faculty of Natural Sciences
University of Hohenheim
Institute of Nutritional Science
Submitted by
Beruk Berhanu Desalegn
Born in Awassa, Ethiopia
Stuttgart-Hohenheim 2020

II
Dean: Prof. Dr. Uwe Beifuß
1st reviewer: Prof. Dr. Med. Hans Konrad Biesalski
2nd reviewer: Prof. Dr. Jan Frank
3rd
examiner: Prof. Dr. Tegene Negese
Submitted on: October 22, 2019
Oral examination on: September 11, 2020
This work was accepted by the Faculty of Natural Sciences at the University of
Hohenheim on December 27, 2019 as ―Dissertation for Obtaining the Doctoral
Degree of Natural Sciences‖.
III
General Information on Publication and Participation in the
Scientific Workshops Part of this dissertation are published and/ or submitted in internationally peer-reviewed journals,
and/or presented in the international scientific workshop and/or accepted to be presented in the
future.
The papers published are the following:
Desalegn, B. B., Lambert, C., Riedel, S., Negese, T., and Biesalski, H. K. (2018).
Ethiopian Orthodox Fasting and Lactating Mothers : Longitudinal Study on Dietary
Pattern and Nutritional Status in Rural Tigray , Ethiopia. Int. J. Environ. Res. Public
Health, 15(8),1767. https://doi.org/10.3390/ijerph15081767
Desalegn, B., Lambert, C., Riedel, S., Negese, T., and Biesalski, H. (2019). Feeding
Practices and Undernutrition in 6–23-Month-Old Children of Orthodox Christian Mothers
in Rural Tigray, Ethiopia: Longitudinal Study. Nutrients, 11(1), 138.
https://doi.org/10.3390/nu11010138
The paper submitted to journal is:
Desalegn, B., Lambert, C., Gola, U., Riedel, S., Negese, T., and Biesalski, H.K.
Calculator for Inadequate Micronutrient Intake (CIMI): Validation of the software in 12-
23-months-old children and lactating women of rural Ethiopia
The papers presented or accepted for presentation in international scientific conferences are:
Desalegn, B.B., Lambert, C., Riedel, S., Negesse, T., Biesalski, H. K. (2018). Ethiopian
Orthodox Fasting and Lactating Mothers: Longitudinal Study on Dietary Pattern and
Nutritional Status in Rural Tigray, Ethiopia. In Global food security and food safety: The
role of universities (Vol. 30, p. 2018). Ghent, Belgium: Ghent University.
Riedel, S., Lambert, C., Desalegn, B.B., Borko, T.B., Biesalski, H. K. (2019).
Development and Validation of Calculator for Inadequate Micronutrient Intake (CIMI)
Program for Ethiopian Population. In 4th
International Hidden Hunger Congress:
Hohenheim-Stuttgart, Germany: University of Hohenheim.
Desalegn, B., Lambert, C., Widmer, C., Gola, U., Riedel, S., Negese, T., and Biesalski,
H.K. Dietary Nutrient Intake of 12-23-Months-Old Children and Lactating Women in
Rural Ethiopia; Development and Validation of Calculator for Inadequate Micronutrient
Intake (CIMI) Program for Ethiopian Population. (This was accepted for poster
presentation on the Nutrition 2019: Where the Best in Science and Health Meet:
Baltimore: Maryland, USA: American Society for Nutrition, and the abstract was
published on Current Developments in Nutrition, 3(S1). DOI: 10.1093/cdn/nzz036.P13-
008-19).
IV
List of Abbreviations AOR Adjusted Odd Ratio
ANC Antenatal Care
AUC Area Under Curve
BMI Body Mass Index
BMZ Bundesministerium Für Wirtschaftliche Zusammenarbeit (German
Federal Ministry for Economic Development Cooperation)
COR Crude Odd Ratio
CIMI Calculator for Inadequate Micronutrient Intake
CDI Centre for Development Innovation
CSA Central Statistical Agency, Ethiopia
DAAD German Academic Exchange Service
DALYs Disability-adjusted life-years
DDS Diet Diversity Score
DHS Demographic and Health Survey
DRMFSS Disaster Risk Management and Food Security Sector
EDHS Ethiopian Demographic Health Survey
EPHI Ethiopian Public Health Institute, formerly EHNRI
ENA Essential Nutrition Action
ENGINE Empowering the New Generation to Improve Nutrition and Economic
Opportunities
EOTC Ethiopian Orthodox Tewahedo Church
ERSS Ethiopian Rural Socio-economic Survey
FAO Food and Agriculture Organization of the United Nations
FANTA Food and Nutrition Technical Assistance
FFQs Food Frequency Questionnaires
GDP Gross Domestic Product
GIZ Deutsche Gesellschaft für Internationale Zusammenarbeit
HDL High Density Lipoprotein
HFIAP Household Food Insecurity Access Prevalence
HFIAS Household Food Insecurity Access Scale
IMF International Monitory Fund
IYCF Infant and Young Child Feeding
LAZ Length-for-Age
LDL Low Density Lipoprotein
MAD Minimum Acceptable Diet
MDD Minimum Diet Diversity
MDD-W Minimum Diet Diversity for Women at Reproductive Age
MMF Minimum Meal Frequency
MOFED Ministry of Finance and Economic Development, Ethiopia
NBS Nutrition Baseline Survey
NNP National Nutrition Program
NNS National Nutrition Strategy
NS NutriSurvey
NSA Nutrition Sensitive Agriculture
PNC Postnatal Care
V
PCA Principal Component Analysis
RNI Recommended Nutrient Intake
SDGs Sustainable Development Goals
SPSS Statistical Package for Social Science
UOH University of Hohenheim
UNICEF United Nations Children's Fund
UNU United Nations University
USAID United States of America Aids for International Development
USDA United States Department of Agriculture
VIF Variance Inflation Factor
WASH Water Supply, Sanitation and Hygiene
WAZ Weight-for-Age
WHO World Health Organization
WLZ Weight-for-Length
VI
Acknowledgments '' ... All things were made by him; and without him was not anything made that was made...'' John
1:3. No words for me to thank the blessing of God and his mother St. Virgin Marry since I come
to this world.
Without the support of many people and institutions, this PhD work might not be real and
successfully accomplished. My supervisor, Professor Dr. Biesalski, thank you very much for
choosing me to be your student and gave me an opportunity to do my research in an area, where I
did not dream, but extremely important for me to serve the community where I was born and
grown up. Furthermore, your guidance, support and the comments you were forwarding from the
design of the proposal until the end of the write-up of this dissertation were exceptionally
important. Professor Tegene, my local supervisor, your mentorship, shaping me to improve the
scientific writing skill and your valuable comments and corrections you are providing me for the
manuscripts and this dissertation are immense. You have taught me a lot how to help people in
the situation where I was stressed in getting local supervisor from Ethiopia. Dr. Christine, my
immediate mentor for this PhD study is thanked for your close mentorship, guidance and
technical support in the CIMI project activities and for the whole this PhD work, especially on
statistical analysis, manuscript preparation and correction of the drafted manuscripts was
exceptional, in addition to your patience and immediate feedbacks whenever I need your support
in spite of your very busy schedule. Dr. Simon, project manager of Micro-gap Ethiopia, who was
very friendly and supportive for the whole CIMI project period, and for the successful and timely
delivery of the CIMI software adapted for Ethiopia population in the project schedule. Your
frequent travel to Ethiopia, moreover to the hard to reach research site and home to home
interview while we were identifying the local standard units for CIMI software in Ethiopia is
unforgettable. Thanks to Dr. Jenny, Dr. Nicole and Dr. Heinrich of the Food Security Center and
Mrs. Kasper, at the University of Hohenheim for your administrative support during my study
period.
My appreciation goes to my friends (Dr. Tibebeselassie, Birhanu, Dr. Shimelis and Habtamu) in
the University of Hohenhim and staffs (Dr. Kebede Abegaz and Dr. Samson Gebremedhin) and
friends in the Hawassa University (Alemneh, Anbisa, Dr. Temesgen, Dr. Alemayehu, Dr. Yonas,
Dr. Yonas, Biruk Ayalew, Dereje, Dagem, Wondeya and Yetnebersh) for your kind support you

VII
provided me during the course of this PhD study. Thomas, your very special friendship and
direction in both of my academic and non-academic carriers are gigantic.
I would like also to appreciate the German Federal Ministry for Economic Cooperation and
Development (BMZ) for financing me this PhD scholarship through the University of
Hohenheim, Germany. I appreciate the GIZ Nutrition Sensitive Agriculture (NSA) project in
Ethiopia for providing me office in Mekele during my stay in field work. I would like also to
thank the mothers and children who are participated in this study. The GIZ NSA experts, Genta
Afeshum woreda Nutrition coordinator, data collectors, community facilitators, data encoders
involved in this study also highly appreciated.
Abaye and Zewdeya, your question ‗How is your work?‘ is always alarming me when I met you,
beside your love and support you are providing me. Gashe Admasu and Dr. Birhanu, without you
and your families support, it might not be easy to me to be at this success. Assie, Emie, Mesay,
Engocha, Fraa, Biruk and Dagi, your care for my wife and my daughter was grateful. My special
thanks go to Addisalem, my wife for your love, support, patience and taking care of our
daughters: Aksale and Bethel, and handling a lot of issues during this doctoral study period.
Beruk Berhanu Desalegn
VIII
TABLE OF CONTENTS General Information on Publication and Participation in the Scientific Workshops ........... III
List of Abbreviations .................................................................................................................. IV
Acknowledgments ....................................................................................................................... VI
1. General Introduction ................................................................................................................. 1
1.1. Background ........................................................................................................................... 2
1.2. Outline of the Thesis ........................................................................................................... 13
1.3. References ........................................................................................................................... 16
2. Ethiopian Orthodox Fasting and Lactating Mothers: Longitudinal Study on Dietary
Pattern and Nutritional Status in Rural Tigray, Ethiopia ....................................................... 29
Abstract ...................................................................................................................................... 31
2.1. Introduction ......................................................................................................................... 32
2.2. Materials and Methods ........................................................................................................ 34
2.2.1. Study Area, Design, Participants, and Sampling .......................................................... 34
2.2.2. Data Collection ............................................................................................................. 35
2.2.3. Minimum Women Diet Diversity Score ....................................................................... 36
2.2.4. Household Food Insecurity Information ....................................................................... 37
2.2.5. Wealth Index ................................................................................................................. 37
2.2.6. Anthropometry.............................................................................................................. 38
2.2.7. Data Management and Analysis ................................................................................... 38
2.3. Results ................................................................................................................................. 39
2.4. Discussion ........................................................................................................................... 50
2.4.1. Nutritional Status of Lactating Mothers ....................................................................... 50
2.4.2. Dietary Patterns of Lactating Mothers .......................................................................... 54
2.5. Conclusions ......................................................................................................................... 58
2.6. References ........................................................................................................................... 59
3. Feeding Practices and Undernutrition in 6–23-Month-Old Children of Orthodox
Christian Mothers in Rural Tigray, Ethiopia: Longitudinal Study ........................................ 71
Abstract ...................................................................................................................................... 73
3.1. Introduction ......................................................................................................................... 74
3.2. Materials and Methods ........................................................................................................ 76
3.2.1. Study Area, Design, Participants and Sampling ........................................................... 76
3.2.2. Data Collection ............................................................................................................. 77
IX
3.2.3. Data Management and Analysis ................................................................................... 78
3.3. Results ................................................................................................................................. 80
3.3.1. Socio-Demographic Characteristics ............................................................................. 80
3.3.2. Nutritional Status and Consumption Pattern ................................................................ 81
3.3.3. Factors Associated with Child Undernutrition ............................................................. 83
3.3.4. Trend of Food Consumption Pattern and Nutritional Status of 6–23-Month-Old
Children .................................................................................................................................. 84
3.4. Discussion ........................................................................................................................... 86
3.4.1. Food Consumption Pattern of 6–23-Month-Old Children ........................................... 87
3.4.2. Nutritional Status of 6–23-month-Old Children ........................................................... 90
3.5. Conclusions ......................................................................................................................... 93
3.6. References ........................................................................................................................... 95
4. Calculator for Inadequate Micronutrient Intake (CIMI): Validation of the Software in
12-23-Months-Old Children and Lactating Women of Rural Ethiopia ............................... 106
Abstract .................................................................................................................................... 107
4.1. Introduction ....................................................................................................................... 108
4.2. Materials and Methods ...................................................................................................... 110
4.2.1. Study Area, Design, Participants, Sampling and Ethical Clearance .......................... 110
4.2.2. Data Collection ........................................................................................................... 111
4.2.3. Development of Calculator for Inadequate Micronutrient Intake (CIMI) for Ethiopia
.............................................................................................................................................. 111
4.2.4. Data Management and Analyses ................................................................................ 112
4.3. Results ............................................................................................................................... 114
4.4. Discussion ......................................................................................................................... 126
4.4.1. Validation of Calculator for Inadequate Micronutrient Intake (CIMI) ...................... 127
4.4.2. Dietary Nutrient Intakes of 12-23-Months-Old Children and Lactating Women in
Rural Ethiopia ....................................................................................................................... 131
4.5. Conclusions ....................................................................................................................... 135
4.6. References ......................................................................................................................... 136
5. General discussion ................................................................................................................. 144
5.1. Undernutrition in Lactating Women and their 6-23-Months-Old Children ...................... 144
5.1.1. Prevalence of undernutrition in lactating women and their 6-23-months-old children
.............................................................................................................................................. 144
X
5.1.2. Factors associated with undernutrition of lactating women and their 6-23-months-old
children ................................................................................................................................. 146
5.2. Feeding Practices and Nutrient Intake of Lactating Women and their 6-23-Months-Old
Children .................................................................................................................................... 150
5.3. CIMI: A Promising Dietary Assessment Application for Rural Ethiopian Population .... 154
5.4. Conclusion ......................................................................................................................... 159
5.5. References ......................................................................................................................... 162
6. Summary ................................................................................................................................. 172
Zusammenfassung...................................................................................................................... 175
List of All References ................................................................................................................. 179
Affidavit ...................................................................................................................................... 214
Curriculum Vitae ....................................................................................................................... 215

1
Chapter 1
General Introduction
2
1. General Introduction
1.1. Background
Globally, a lot of efforts have been undertaken in reducing malnutrition, even though the
achievements are far less than the global goals targeted [1]. As a result, it remains unacceptably
high and a serious public health problem in the globe. This categorizes malnutrition as the
leading cause for more illness than others [2]. Worldwide, the estimated prevalence of
undernourished people increased from 784 million (10.6%) in 2015 to 821 million (10.9%) in
2017 [3]. However, children and women at the reproductive age are more affected by
malnutrition than men. The number of stunted, wasted and overweight children under five years
of age were about 151 million, 50 million and over 38 million in 2017, respectively, while about
170 million underweight and 613.2 million anemic women at reproductive age, and more than 2
billion adult overweight (1.02 billion women vs. 984.6 million men) existed in 2016 [2]. Beside
these, deficiency of micronutrients affects more than 2 billion people living in this planet [4]. It is
also the principal cause for the 3.5 million deaths, 11% of the total global disability-adjusted life-
years (DALYs), 35% of the disease burden in young children and 20% of the maternal mortality
[5]. However, the highest prevalence of undernutrition (20.4%) is registered in Africa, but the
least improvement (0.8%) is shown between 2005 and 2017 [3].
Despite the high and rapid economic development achieved in Ethiopia since 2005/06, the
prevalence of food and nutrition insecurity remains to be high [6–8]. The number of food in-
secured Ethiopian people were about 7.8 million [9]. Since 2008, Ethiopian government has been
exerting a lot of efforts to accelerate the reduction of undernutrition by developing and launching
National Nutrition Strategy (NNS), and National Nutrition Programs (NNP) I and II, and fully
integrating nutrition issues in the health sector program of the country [10–12]. However, the
3
achievement is still much lower than the ambitious ‗Seqota declaration‘ goal set by 2030, which
is elimination of all forms of malnutrition among the children below the age of two years [13].
The recent Ethiopian demographic and health survey report showed that the prevalence of
stunted, wasted, underweight and anemic children under the age of 5 years were 38%, 10%, 24%
and 57%, respectively. Likewise, 22% and 24% of women between the age of 15-49 years was
thin (BMI < 18.5kg/m2) and anemic, respectively [6]. These burdens also co-existed with the
ever increasing over-nutrition problem such as 1% overweight in children and 8% overweight or
obese in women [6]. But, the distribution of the existing undernutrition problems vary by region,
geographical locations, people and time [14–20]. Similar studies in three sub-Saharan African
countries and Nigeria also confirmed these evidences [21,22,23]. According to UNICEF‘s
nutrition scale up approach for mothers and their children, inadequate dietary intake and disease
are the immediate causes for the maternal and child undernutrition, which are affected by the
underlying causes like household food insecurity (lack of availability, access and/or utilization of
diverse diet), inadequate care and poor feeding practices for children, unhealthy household and
surrounding environments, and inaccessible and often inadequate health care [24].
Food taboo is one of the socio-cultural practices in countries like Ethiopia, where more than 85
ethnic groups and different religious beliefs exist, and could affect the nutritional status of
women and children [24]. Food taboos refer to those foods which are strictly forbidden for
health, cultural, and religious reasons [25–31]. In different African countries including Ethiopia,
food taboos are thought to have been established more often during pregnancy than other
physiological stages of women, as a means of protecting the health of women and their babies.
As a result, most studies in Ethiopia and other African countries focused on the exploration of
food taboos during pregnancy and its association with their nutritional status and feeding
4
practices [25,26,28,31–38]. Accordingly, some studies in Ethiopia showed that 27-60% of
pregnant women are subject to food taboo [25,26,36]. They also identified that linseed, honey,
dairy products, meat, eggs, fruits and vegetables, coffee, tea, porridge, wheat bread, pimento,
groundnut, salty diet, nug, sugarcane, pumpkin and coca drinks were among the food items not
allowed for pregnant women [25,31,36]. The main reasons for avoidance of these food items
were fear of plastering on fetal head, getting a big baby which is difficult for delivery, fear of
abortion, evil eye and fetal abnormality. However, lactating mothers who required greater
amount of energy and most nutrients even by pregnant mothers, are also the victim of food taboo
although little is known in this regard [40–42]. However, if the practice of food taboos is not
identified and intervened, then it could be passed from one generation to the next generation and
may sustain the intergenerational cycle of malnutrition [43,44].
Fasting is a partial or complete abstention from all foods and water or refrain from some selected
and or/ prohibited foods for some fixed period of time in the year [45,46]. Religious fasting is
among the different types of dietary or food taboos, which may affect the dietary intake and
nutritional status of children and women. Apart from the conventional food taboos, religious
fasting has a momentary nature. In these fasting periods, abstaining from animal source foods
and/or water is done in the fixed period of time in the year and is a religious obligation [45].
Ramadan is in the ninth month of Islamic lunar calendar and is when Muslims fast for 29 to 30
days. In this period, Muslims are expected to abstain from eating, drinking, smoking, sexual
practices and other activities for an average of 12-hrs in a day from the dawn to dusk [47,48].
Beside this, the type and amount of food to be eaten during the night of Ramadan is also
significantly altered than during the rest of the year [49]. Even if fasting during Ramadan is an
obligation for Muslims; pregnant women, lactating women, children, the elderly, travelers and

5
some people with specific conditions like female at menstrual cycle or persons who cannot
withstand for longer time without food or water due to some acute or chronic diseases are
exempted from this practice [50,51]. However, usually breastfeeding and pregnant women and
other exempted people prefer to fast with their family members to show their spiritual solidarity
[50–53]. Accordingly, studies in Lebanon and Turk, pregnant women showed that the weight
gain was lower in fasting compared to non-fasting groups during Ramadan [52,54]. Similarly, the
% of recommended daily allowance of most nutrients fulfilled by the Turkish pregnant women
who were fasting were lower compared to those pregnant women who did not [54]. The cohort
study in Lebanon also showed that the mean birth weight of the women who fasted during their
pregnant period were significantly lower than the average mean birth weight of the women who
did not fast during their pregnancy period. Likewise, a study on Turkish lactating women
confirmed that the nutrient quantity of the breast milk and weight and their child‘s weight were
lower in Ramadan fasting period than after one month non-fasting period [53]. A study on
patients with a cancer-related fecal stoma revealed that the weight loss after Ramadan fasting
was about 9.5kg compared to the time right before Ramadan [50]. A systematic review and meta-
analysis in West Asia, Africa, East Asia and North America/Europe confirmed that the weight
loss was significantly higher, regardless of gender, but this loss was regained within a few weeks
after Ramadan [48].
In Orthodox Christian religion, followers are expected to fast for at least 180 days in a year
[46,55–58]. Fasting includes abstention from all animal source foods (meat, milk, butter and
eggs), but restriction of fish in Ethiopian Orthodox church is not uniform [45]. Studies in Greek
Orthodox Christian monks revealed that the consumption of dairy products, meat and eggs, and
the dietary intake of calcium, and BMI were lower in fasting weeks compared to week following
6
fasting. However, the profile of individual health biomarkers like total cholesterol, LDL-
cholesterol and HDL-cholesterol in serum were lower during fasting than non-fasting weeks [60].
Annual longitudinal study on 120 Greek Orthodox Christians (60 fasting vs. 60 non-fasting as
control) also confirmed that a significant reduction in the total and LDL-cholesterol, and BMI
was observed in an end line survey compared to control group [59]. Similar authors in the Greek
Orthodox followers also evidenced that the dietary cholesterol, protein, energy and calcium
intakes were also low in fasting groups compared to the control in the end-holidays than pre-
fasting period [57]. Two review papers focused on the health related impact of Orthodox fasting
also confirmed that BMI, lipid profile including cholesterol level of fasting individuals
decreased, and these improved their health status [46,61]. Relatively, a recent systematic review
on the effect of Orthodox fasting on human health confirmed that few researches were conducted
in this specific topic. But the results of these studies indicated that the total energy and fat intakes
are restricted, but carbohydrate and fiber intakes increased. Beside this, the overall effect of
Orthodox fasting on reduction of total cholesterol and LDL-C levels were somewhat optimal.
According to Kaufakis and colleagues, studies on the impact of Orthodox fasting are limited, but
these studies are also conflicting with each other‘s, as a result a consensus has not been reached
to draw conclusion. Therefore, further study on this regard is recommended [62]. In general,
many of the researches focused on the effect of fasting on human health specifically chronic
diseases. However, knowing the fasting effect on dietary pattern and nutritional status in
countries with high prevalence of maternal and child undernutrition is very important.
Follower of Ethiopian Orthodox and Muslim religion make up to three-fourth of people in
Ethiopia, who practice a strict fasting during their religious fasting periods [63]. But, their fasting
practices including number of fasting days, type of fasting, number of fasting hours and type of

7
food items restricted are some of the differences between this two religions [64]. According to
Ethiopian Orthodox church rule, there are seven official fasting periods and a total of these
periods cover approximately 250 out of 365 days in a year. In these days, children less than
seven years old, soldiers, severely ill or weak people, pregnant, and lactating mothers are
permitted to eat both animal source foods and other foods including water, without abstention
during the religious fasting periods or days [45,58,65]. However, little studies in Ethiopia
highlight the religious fasting in relation with feeding practices and nutritional status in
nutritionally vulnerable groups (women and children) who are the follower of the two dominant
religion. Despite these nutritionally needy groups (lactating and pregnant mothers, and children)
who are exempted from the religious fasting, yet the consumption of animal source foods during
the fasting periods are very low for different reasons [43,66]. For example, studies in Amhara
and Tigray regions explored that some mothers were not happy to prepare food for their children
from animal sources due to fear of utensils contamination during cooking family food, and this
reason increased the likelihood of feeding less diverse food for their children by 1.5 times
compared with the economic related reasons [44,67,68]. Other studies in Ethiopia also showed
that the demand of cattle meat during Orthodox fasting periods was observed to be low, resulting
in closure of abattoirs or minimizing the service provided. A further study also reported that
more than 85% of butcher houses were closed during Wednesday and Friday, which are
Orthodox Christians fasting days of the week, in Addis Ababa, a capital city of Ethiopia [70,71].
The first 1000 days of life, between the conception of a woman until her child celebrates his/her
two years‘ birthday, is a critical window of opportunity to build a foundation for optimal health
and development, and success for the child across his/her life time. Proper nutrition and care
during this window period improve the survival rate, his or her growth and learning ability, and

8
later contribute to societies long term health, stability and prosperity [72]. A mother‘s diet and
her nutrient stores are the only source of nutrition for the developing baby in her womb. When a
pregnant woman does not get the calories, key nutrients or essential proteins she needs to support
her baby‘s development, her baby is placed at risk for developmental delays, birth defects and
cognitive deficits [73]. Undernutrition in pregnant women increase the risk of maternal morbidity
and mortality and also prone to poor pregnancy outcome, which include obstruction during labor,
preterm or low birth child and postpartum hemorrhage [74]. Beside this, folate is critical to the
early development of the brain and spinal cord of the fetus. When a woman lacks this before
becoming pregnant and in the early weeks of her pregnancy, the development of the neural tube
is affected, leading to birth defects of the brain and spinal cord (anencephaly and spinal bifida)
that can cause death or lifelong disability [73]. Lactation is the second physiological stage, which
cover three-fourth of the 1000 window days. Even except iron and folate, energy and most
micronutrients need of lactation is greater compared to pregnancy [ 40,42,75–77]. During
lactation, the energy, macro- and micronutrients in breast milk come from the mother‘s diet
and/or her own body stores, which make the lactating women in high risk of malnutrition unless
she consumes adequate nutrient and energy rich foods [51,53]. The quality of breast milk could
be altered, as a result the nutritional status of the breastfed child could also change [51,78].
Furthermore, if the lactating mother is severely malnourished, then her lactation performance
will decrease and contribute to child morbidity and mortality [79].
Exclusive breast feeding during the first six months after delivery and continued breast feeding
up to one to two years in combination with introduction of appropriate, adequate and safe
complementary feeding are among the recommended IYCF practices [80]. Appropriate
complementary feeding can prevent about 6% of deaths of under-five aged children [5,81]. The
9
transition period from exclusive breastfeeding to two years is critical for optimal growth and
development of a child [81]. The prevalence of ―ever breastfeeding‖ in rural Ethiopia was about
97.8% versus 95.2% of recommended IYCF practices, which is a positive practice [ 82,83].
Likewise, many rural mothers continue breastfeeding until their child reaches the age of at least
24 months and in some cases even for a longer time. According to national study in Ethiopia,
76% of 2 years old children were continually breastfed [6]. Previous studies in Tigray, northern
Ethiopia showed that 25% of the children were breastfed for more than 3 years [ 84]. Therefore,
assessing the dietary adequacy of energy, macro- and micronutrients is very useful in the whole
population groups specially children and women. For this, a number of both qualitative and
quantitative dietary assessment techniques have been developed and implemented globally.
However, most of the quantitative dietary nutrient intake assessment techniques like food
frequency questionnaire (FFQs), food weight record and 24-h recall are time consuming, need
well trained field workers during the surveys and an expert to calculate dietary intake using
nutrition software and identify undernutrition. Therefore, the application of these methods has
been less in rural poor settings in developing countries including Ethiopia. Alternatively, many
assessment and intervention studies use a qualitative method known as diet diversity scores,
which is a proxy indicator for assessing the dietary quality at household and individual levels
[85]. Accordingly, national and different studies, elsewhere in Ethiopia showed that the
consumption of foods from different food groups in children and women (pregnant, non-
pregnant-non-lactating, and lactating women) were low [40,81–83,86–88]. However, this
technique identifies the score of the consumption of diet from different standardized food groups
regardless of the amount consumed, as this technique doesn‘t allow the serving size ideally.
Therefore, unless small amount of consumption is excluded in the count, then the validity of the

10
DDS will be in question. For this, many scholars suggested that consumption of at least 15 g
from the group should be the minimum to be considered as consumed in women at reproductive
age, otherwise the relationship between food group diversity and micronutrient adequacy is
weaker [85,90–92]. As a solution, defining the food and ingredients to count and not to count
during the construction of the questionnaire for MDD-W indicator should be done, and during
the training of enumerators to avoid biased-decisions [85]. But, still the controversy remains on
how quantification is practical in qualitative diet diversity assessment technique, unless the diet
diversity data is extracted from other quantitative dietary intake data. Minimum acceptable diet,
which is a combination of minimum diet diversity and minimum meal frequency is used to assess
the quality and quantity of children‘s diet, in addition to other IYCF indicators [80]. Many
studies at district and national levels in Ethiopia confirmed that the proportion of 6-23-months-
old children who met the minimum number of meals from minimum diversified complementary
food for their age and breastfeeding was very low (<10%) [6,43,93,94].
Human being needs, both nutrients which is called macronutrients (fat, protein and carbohydrate)
and micronutrients which are needed in small amount, but are important for the metabolic
process and function of the macronutrients are necessary [4,95]. Unlike macronutrients,
micronutrients neither substitute each other nor are synthesized in our body. Therefore, supply of
these nutrients through our diet is mandatory, although the amount required differ due to age, life
style, hormonal activity or exercise and bioavailability related with food to be consumed [4]. If
these micronutrients are inadequate, it leads to the invisible form of undernutrition called
micronutrient deficiency or ‗Hidden hunger‘. If it persists for some longer period will increase
the risk of disease, growth and cognitive development impairment in the early stage of
childhood, and later maternal illness and decrease the life expectancy. Thus, early identification

11
of micronutrient deficiencies will be an important step to design and initiate appropriate
prevention and intervention activities [96]. However, these are flouted, as the quantitative dietary
data are not available most often [2]. As a result, the hidden hunger might not be addressed
properly in Ethiopia and other African countries, where this occurrence remains high and
persistent [2,6]. Therefore, an assessment tool which can estimate the quantitative dietary intake
of an individual or a community, but easy to use, less costly and applicable method for
developing countries including Ethiopia is urgently needed to achieve the national and
international goals set for eradicating malnutrition. The Calculator for Inadequate Micronutrient
Intake (CIMI) is a simple, easy-to-use, informative, web-based application of quantitative dietary
assessment method. The first version of CIMI was developed in Indonesia using commonly
consumed Indonesian foods for Indonesian population. Thus, CIMI estimates energy and nutrient
intake correctly, and identifies nutrient inadequacy according to FAO/WHO recommended
nutrient intake (RNI) regarding age, sex and physiological stage [96].
Genta Afeshum is one of the thirty-five district‘s in the Tigray regional state in Ethiopia.
According to CSA (2007) projection, the district has a total population of 99,112, and almost all
(99%) people are Orthodox Christianity follower. The district is known with cultivation of
majorly cereals, followed by pulses, oil seeds, fruit trees and vegetables in decreasing order of
importance. Of these, wheat, barley, legumes, maize, fenugreek, teff, sorghum and orange
fleshed sweet potato are mentionable. However, Genta Afeshum is one of the hotspot districts for
food insecurity in the region. It is also known with major disaster risks like drought, hail storms
and livestock diseases; followed by human diseases, crop diseases and pests and flooding.
Deforestation, water pollution and soil erosion are the major environmental problems; whereas,
high dependency syndrome, poor economic condition, land shortage, severe shortage of drinking
12
water and poor saving are among the major vulnerability factors at household level [97]. But, to
the best of our knowledge, there was no study which assessed the dietary pattern and nutritional
status of women and children in Genta Afeshum district.
Therefore, the purpose of this study was assessing and comparing the nutritional status and
dietary intake of lactating women and their 6-23months old children in fasting and non-fasting
periods at Genta Afeshum District, rural Tigray in Northern Ethiopia, and to develop and validate
the CIMI program for Ethiopian population. For this, the following specific objectives were set
to address the three papers written as chapter two, three and four of this Dissertation,
1. Assessing and comparing the nutritional status of lactating mothers and their 6-23-months
old children in Ethiopian Orthodox lent fasting and non-fasting periods in Genta
Afeshum district, Rural Tigray, Ethiopia.
2. Assessing factors associated with undernutrition (BMI<18.5kg/m2) in lactating
mothers of Genta Afeshum district, Rural Tigray, Ethiopia.
3. Assessing factors associated with undernutrition (stunting, underweight and
wasting) in 6-23-months old children of Genta Afeshum district, Rural Tigray,
Ethiopia.
4. To compare dietary pattern of lactating mothers and their 6-23-months old children
during fasting and non-fasting periods in Genta Afeshum district, Rural Tigray,
Ethiopia.
5. To adapt CIMI program and compare with NutriSurvey for its ability to analyze
dietary nutrients and energy intakes in Genta Afeshum district, Rural Tigray,
Ethiopia.

13
1.2. Outline of the thesis
This Thesis/Dissertation has six chapters and the biography at the end. Chapter 2 of this
Thesis/Dissertation is entitled ‗‘Ethiopian Orthodox Fasting and Lactating Mothers: Longitudinal
Study on Dietary Pattern and Nutritional Status in Rural Tigray, Ethiopia ‗‘. The chapter focused
on identifying underweight (BMI < 18.5kg/m2) and food consumption pattern of fasting and non-
fasting mothers in Ethiopian Orthodox lent fasting and non-fasting periods. It also identified
whether there was a difference in each food groups consumed, diet diversity and animal source
consumption score, and anthropometric status between the lent fasting and non-fasting periods,
separately for fasting and non-fasting mothers. For this, McNemar‘s test and Wilcoxon Signed
Ranks Tests were used to check the statistical difference. Furthermore, the chapter addressed the
factors associated with the underweight of lactating mothers in the study area. The factors
included in the logistic regression to identify associated factors were from the socio-demographic
and economic characteristics, maternal and child characteristics, water, sanitation and hygiene
(WASH), feeding practices and household food security indicators. The underlying publication
was published in International Journal of Environmental Research and Public Health in 2018,
Vol 15(8), page 1-20.
Chapter 3 of the Thesis dealt with ‗‘Feeding Practices and Undernutrition in 6–23-Month-Old
Children of Orthodox Christian Mothers in Rural Tigray, Ethiopia: Longitudinal Study‘‘. Like
chapter 2, this chapter focused on differences in the consumption pattern between the general 6-
23-months-old children in the lent fasting and non-fasting periods, regardless of their mothers
fasting status, and separately both for the 6-23-months-old children of the fasting and non-fasting
mothers. It also highlighted differences between mean standard deviations of length-for-age,
weight-for-length and weight-for-age z-scores between children of fasting and non-fasting
14
mothers during lent fasting period. It also stressed on the trend of the weight for age and diet
diversity score of the whole population between the lent fasting and non-fasting periods. On top
of these, the prevalence of child undernutrition (underweight, wasting and stunting) and
associated factors were also addressed. McNemar‘s test, independent sample t-test, Wilcoxon
Signed Ranks Tests and binary logistic regression were used to analyze the data. This article was
published in nutrients in 2019, Vol 11, page 1-15.
Chapter 4 holds a paper ‗Dietary Nutrient Intake of 12-23-Months-Old Children and Lactating
Women in Rural Ethiopia; Adaptation and Validation of Calculator for Inadequate Micronutrient
Intake (CIMI)‘ and was submitted also to nutrients journal in May 22, 2019. It focuses on two
major issues. The first part was on the development of simple and rapid app for assessment of
dietary nutrient intake using commonly consumed Ethiopian food items for Ethiopian population,
followed by assessing the validity of the results produced by this software compared to
internationally established nutritional assessment software called NutriSurvey. The second part
of this chapter focused on identifying the estimated dietary energy and nutrient intakes and the
prevalence of inadequacy of the 12-23-months-old children and lactating mothers during the lent
fasting and non-fasting periods. Statistical analyses were done using descriptive statistics and
Pearson correlation test to check the relationship of the results produced by CIMI and
NutriSurvey, of each nutrients and energy for the 12-23-months old children and lactating
women.
In chapter 5, the results presented in the three chapters (2, 3 and 4) are merged and discussed
together. In this discussion, recent evidences in relation with the dietary pattern and nutritional
status of children and women; in regard to religious fasting were found and compared and argued
with/against our findings. Additionally, the development of CIMI software, and the assessment of
15
its validity compared to NutriSurvey as a reference are discussed with previous findings in the
CIMI software developed for other countries, and other dietary assessment tools in its
applicability. At the end of this chapter, the general conclusion drawn from the whole research
findings in this study are presented.
Chapter 6 encompasses the general summary of the whole findings in the Thesis/Dissertation and
is presented in both German and English languages.

16
1.3. References
1. Development Initiatives. Global Nutrition Report 2017: Nourishing the SDGs. Bristol,
UK; 2017.
2. Development initiatives. 2018 Global nutrition report: Shining a light to spur action on
nutrition [Internet]. Bristol, UK; 2018. 261 p. Available from:
http://ebrary.ifpri.org/cdm/ref/collection/p15738coll2/id/130399%5Cnhttps://www.ifpri.or
g/publication/hidden-hunger-approaches-tackling-micronutrient-deficiencies
3. FAO/IFAD/UNICEF/WFP/WHO. The State of Food Security and Nutrition in the World
2018. Building climate resilience for food security and nutrition. Rome; 2018.
4. Biesalski Hans K, Jana T. Micronutrients in the life cycle: Requirements and sufficient
supply. NFS J. 2018;11[March]:1–11. https://doi.org/10.1016/j.nfs.2018.03.001
5. Black RE, Allen LH, Bhutta ZA, Caulfield LE, de Onis M, Ezzati M, et al. Maternal and
child undernutrition: global and regional exposures and health consequences. Lancet.
2008;371[9608]:243–60.
6. CSA. Ethiopia Demographic and Health Survey 2016. Addis Ababa; 2017.
7. Endalew B, Muche M, Tadesse S. Assesment of food security situation in Ethiopia: A
review. Asian J Agric Res. 2015;9[2]:55–68.
8. IMF. The Federal Democratic Republic of Ethiopia : Poverty Reduction Strategy Paper :
Growth and transformation Plan 2010/11-2014/15-Volume I. Washington D.C; 2011.
9. FAO. Ethiopia Situation Report - May 2017. Addis Ababa, Ethiopia; 2017.
10. FMOH. The Federal Democratic Republic of Ethiopia: National Nutrition Strategy. Addis
17
Ababa, Ethiopia; 2008.
11. FMOH. National Nutrition Programme Republic of Ethiopia. Addis Ababa, Ethiopia;
2013.
12. FMOH. National Nutrition Program 2016-2020. Addis Ababa, Ethiopia; 2016.
13. Federal Demogratic Republic of Ethiopia [FDRE]. SEQOTA declaration implementation
plan [ 2016 – 2030]: Summary programme approach document. Addis Ababa, Ethiopia;
2016.
14. Ahmed A, Abdulahi A, Shab-bidar S, Rezaei S. Nutritional Status of Under Five Children
in Ethiopia : A Systematic Review and Meta-Analysis. Ethiop J Health Sci.
2017;27(2):175-188. doi: 10.4314/ejhs.v27i2.10.
15. Akombi BJ, Agho KE, Merom D, Hall JJ, Renzaho AM. Multilevel analysis of factors
associated with wasting and underweight among children under-five years in Nigeria.
Nutrients. 2017;9[1]:44. doi: 10.3390/nu9010044.
16. Alemu ZA, Ahmed AA, Yalew AW, Birhanu BS. Non random distribution of child
undernutrition in Ethiopia: Spatial analysis from the 2011 Ethiopia demographic and
health survey. International Journal for Equity in Health. 2016;15:198. DOI
10.1186/s12939-016-0480-z
17. Ali Naser I, Jalil R, Wan Muda WM, Wan Nik WS, Mohd Shariff Z, Abdullah MR.
Association between household food insecurity and nutritional outcomes among children
in Northeastern of peninsular Malaysia. Nutr Res Pract. 2014;8(3):304-11. doi:
10.4162/nrp.2014.8.3.304.

18
18. Hagos S, Hailemariam D, WoldeHanna T, Lindtjørn B. Spatial heterogeneity and risk
factors for stunting among children under age five in Ethiopia: A Bayesian geo-statistical
model. PLoS ONE, 12(2): e0170785. doi:10.1371/journal.pone.0170785
19. Sohnesen TP, Ambel AA, Fisker P, Andrews C, Khan Q. Small area estimation of child
undernutrition in Ethiopian woredas. PLoS ONE 12(4): e0175445.
https://doi.org/10.1371/journal.pone.0175445
20. Haile D, Azage M, Mola T, Rainey R. Exploring spatial variations and factors associated
with childhood stunting in Ethiopia: Spatial and multilevel analysis. BMC Pediatr
[Internet]. 2016;16[1]:1–14. Available from: http://dx.doi.org/10.1186/s12887-016-0587-9
21. Akombi BJ, Agho KE, Hall JJ, Wali N, Renzaho AMN, Merom D. Stunting, wasting and
underweight in Sub-Saharan Africa: A systematic review. Int J Environ Res Public Health.
2017; 14 [863]. doi:10.3390/ijerph14080863
22. Kandala N, Fahrmeir L, Klasen S, Priebe J. Geo-additive Models of Childhood
Undernutrition in Three Sub-Saharan African Countries 1. Popul Space Place.
2009;473[December 2008]:461–73.
23. Tolulope A, Olubukola B. Spatial Pattern of Household Food Insecurity and Childhood
Malnutrition in Akinyele Local Government Area, Nigeria. International Journal of Health
Sciences 2015; 3(1):235-250. DOI: 10.15640/ijhs.v3n1a15
24. UNICEF. UNICEF ‘ s approach to scaling up nutrition. 2015.
25. Biza Zepro N. Food Taboos and Misconceptions Among Pregnant Women of Shashemene
District, Ethiopia, 2012. Sci J Public Heal [Internet]. 2015;3[3]:410. Available from:

19
http://www.sciencepublishinggroup.com/journal/paperinfo.aspx?journalid=251&doi=10.1
1648/j.sjph.20150303.27
26. Demissie T, Muroki NM, Kogi-Makau W. Food aversions and cravings during pregnancy:
prevalence and significance for maternal nutrition in Ethiopia. Food Nutr Bull.
1998;19[1]:20–6.
27. Hadush Z, Birhanu Z, Chaka M, Gebreyesus H. Foods tabooed for pregnant women in
Abala district of Afar region, Ethiopia: an inductive qualitative study. BMC Nutr
[Internet]. 2017;3[1]:40. Available from:
http://bmcnutr.biomedcentral.com/articles/10.1186/s40795-017-0159-x
28. Kariuki LW, Lambert C, Purwestri RC, Maundu P, Konrad H, Kariuki LW, et al. Role of
food taboos in energy, macro and micronutrient intake of pregnant women in western
Kenya. Nutrition & Food Science, 47(6):795-807. https://doi.org/10.1108/NFS-09-2016-
0146
29. Meyer-Rochow VB. Food taboos: Their origins and purposes. Journal of Ethnobiology
and Ethnomedicine 2009, 5:18. doi:10.1186/1746-4269-5-18
30. Riang‘a RM, Broerse J, Nangulu AK. Food beliefs and practices among the Kalenjin
pregnant women in rural Uasin Gishu County, Kenya. Journal of Ethnobiology and
Ethnomedicine 2017;13:29. DOI 10.1186/s13002-017-0157-8.
31. Zerfu TA, Umeta M, Baye K. Dietary habits, food taboos, and perceptions towards weight
gain during pregnancy in Arsi, rural central Ethiopia: a qualitative cross-sectional study. J
Health Popul Nutr [Internet]. 2016;35[1]:22. Available from:
http://dx.doi.org/10.1186/s41043-016-0059-8

20
32. McGovern ME, Krishna A, Aguayo VM, Subramanian S V. A review of the evidence
linking child stunting to economic outcomes. Int J Epidemiol. 2017;46[4]:1171-1191. doi:
10.1093/ije/dyx017
33. Arzoaquoi SK, Essuman EE, Gbagbo FY, Tenkorang EY, Soyiri I, Laar AK. Motivations
for food prohibitions during pregnancy and their enforcement mechanisms in a rural
Ghanaian district. Journal of Ethnobiology and Ethnomedicine 2015; 11:59. DOI
10.1186/s13002-015-0044-0.
34. Herrador Z, Perez-Formigo J, Sordo L, et al. Low Dietary Diversity and Intake of Animal
Source Foods among School Aged Children in Libo Kemkem and Fogera Districts,
Ethiopia. Plos one. 2015;10(7):e0133435. DOI: 10.1371/journal.pone.0133435.
35. Ekwochi U, Osuorah CDI, Ndu IK, Ifediora C, Asinobi IN, Eke CB. Food taboos and
myths in South Eastern Nigeria: The belief and practice of mothers in the region. J
Ethnobiol Ethnomed. 2016; 12: 7. doi: 10.1186/s13002-016-0079-x
36. Getnet W, Aycheh W, Tessema T. Determinants of Food Taboos in the Pregnant Women
of the Awabel District , East Gojjam Zone , Amhara Regional State in Ethiopia. Adv
Public Heal. 2018;2018:6. Article ID 9198076, 6 pages.
https://doi.org/10.1155/2018/9198076
37. Hm HT, Ahmed EM, N AAM. Food Taboos among Pregnant Women in Health Centers,
Khartoum State Sudan, 2016. International Journal of Science and Healthcare Research,
2018; 3(1):13-25.
38. Maliwichi-nyirenda CP, Maliwichi LL, Maliwichi-nyirenda CP, Maliwichi LL. Studies on
Ethno-Medicine Food Related Taboos Observed During Pregnancy in Malawi. Stud
21
ethno-Medicine. 2017;10[2]:263–8.
39. Herrador Z, Perez-Formigo J, Sordo L, et al. Low Dietary Diversity and Intake of Animal
Source Foods among School Aged Children in Libo Kemkem and Fogera Districts,
Ethiopia. Plos one. 2015;10(7):e0133435. DOI: 10.1371/journal.pone.0133435.
40. Haileslassie K, Mulugeta A, Girma M. Feeding practices, nutritional status and associated
factors of lactating women in Samre Woreda, South Eastern Zone of Tigray, Ethiopia.
Nutr J [Internet]. 2013;12[28]. http://www.nutritionj.com/content/12/1/28
41. Picciano MF. Dietary Supplement Use in Women : Current Status and Future Directions
Pregnancy and Lactation : Physiological Adjustments , Nutritional Requirements and the
Role of Dietary Supplements 1. J Nutr. 2003;133:1997–2002.
42. Roba KT, O‘Connor TP, Belachew T, O‘Brien NM. Seasonal variation in nutritional
status and anemia among lactating mothers in two agro-ecological zones of rural Ethiopia:
A longitudinal study. Nutrition [Internet]. 2015;31[10]:1213–8. Available from:
http://dx.doi.org/10.1016/j.nut.2015.03.007
43. Desalegn B, Lambert C, Riedel S, Negese T, Biesalski H. Feeding Practices and
Undernutrition in 6–23-Month-Old Children of Orthodox Christian Mothers in Rural
Tigray, Ethiopia: Longitudinal Study. Nutrients [Internet]. 2019;11[1]:138. Available
from: http://www.mdpi.com/2072-6643/11/1/138
44. Kumera G, Tsedal E, Ayana M. Dietary diversity and associated factors among children of
Orthodox Christian mothers/caregivers during the fasting season in Dejen District, North
West Ethiopia. Nutrition & Metabolism, 2018; 15:16. https://doi.org/10.1186/s12986-018-
0248-0
22
45. Karl Knutsson E, Selinus R. Fasting in Ethiopia:An anthropological and nutritional study.
Am J Clin Nutr. 1970;23[7]:956–69.
46. Trepanowski JF, Bloomer RJ. The impact of religious fasting on human health. Nutrition
Journal 2010, 9(57). Available from: http://www.nutritionj.com/content/9/1/57.
47. Ali Z, Abizari A. Ramadan fasting alters food patterns, dietary diversity and body weight
among Ghanaian adolescents. Nutr J. 2018; 17(75). https://doi.org/10.1186/s12937-018-
0386-2
48. Sadeghirad B, Motaghipisheh S, Kolahdooz F, Zahedi MJ, Haghdoost AA. Islamic fasting
and weight loss: A systematic review and meta-analysis. Public Health Nutr.
2014;17[2]:396–406.
49. Leiper J., Molla AM, Molla AM. Effects on health of fluid restriction during fasting in
Ramadan. Eur J Clin Nutr. 2003;57[2]:S30–8.
50. Altuntas YE, Gezen FC, Sahoniz T, Kement M, Aydin H, Sahin F, et al. Ramadan fasting
in patients with a stoma: a prospective study of quality of life and nutritional status.
Ostomy Wound Manag [Internet]. 2013;59[5]:26–32. Available from:
http://www.ncbi.nlm.nih.gov/pubmed/23669258
51. Faris MA-IE, Al-Holy MA. Implications of Ramadan intermittent fasting on maternal and
fetal health and nutritional status: A review. Med J Nutrition Metab. 2014;7:107–18.
52. Awwad J, Usta IM, Succar J, Musallam KM, Ghazeeri G, Nassar AH. The effect of
maternal fasting during Ramadan on preterm delivery: A prospective cohort study. BJOG
An Int J Obstet Gynaecol. 2012;119[11]:1379–86.

23
53. RAKICIOĞLUNESLIŞAH, SAMUR G, TOPÇU A, AYAZ T. The effect of Ramadan on
maternal nutrition and composition of breast milk. Pediatr Int. 2006;48[3]:278–83. doi:
10.1111/j.1442-200X.2006.02204.x.
54. Kiziltan G, Karabudak E, Tuncay G, Avsar F, Tuncay P, Mungan O, et al. Dietary intake
and nutritional status of Turkish pregnant women during Ramadan. Saudi Med J.
2005;26[11]:1782–7.
55. Fasts FW, Fasts TP. Fasting and abstinence of the Coptic Orthodox Church of Alexandria
[Internet]. Wikepedia. 2019 [cited 2019 Mar 19]. p. 3–7. Available from:
https://en.wikipedia.org/wiki/Fasting_and_abstinence_of_the_Coptic_Orthodox_Church_
of_Alexandria
56. Sarri KO, Kafatos AG, Higgins S. Is religious fasting related to iron status in Greek
Orthodox Christians ? Br J Nutr. 2005;2001:198–203.
57. Sarri KO, Linardakis MK, Bervanaki FN, Tzanakis NE, Kafatos AG. Greek Orthodox
fasting rituals: a hidden characteristic of the Mediterranean diet of Crete. Br J Nutr
[Internet]. 2004;92:277–84. Available from:
http://www.journals.cambridge.org/abstract_S000711450400159X
58. Sellassie SH, Mikael B. Worship in the Ethiopian Orthodx church [Internet]. The
Ethiopian orthodox Tewahedo Church. 2019 [cited 2019 Mar 12]. p. 4–7. Available from:
https://www.ethiopianorthodox.org/english/ethiopian/worship.html
59. Sarri KO, Tzanakis NE, Linardakis MK, Mamalakis GD, Kafatos AG. Effects of Greek
orthodox christian church fasting on serum lipids and obesity. BMC Public Health.
2003;3[16].
24
60. Papadaki A, Vardavas C, Hatzis C, Kafatos A. Calcium , nutrient and food intake of Greek
Orthodox Christian monks during a fasting and non-fasting week. Public.
2007;11[10]:1022–9.
61. Lazarou C, Matalas A. A critical review of current evidence , perspectives and research
implications of diet-related traditions of the Eastern Christian Orthodox Church on dietary
intakes and health consequences. Int J Food Sci Nutr. 2010; 61(7):739-758, DOI:
10.3109/09637481003769782
62. Koufakis T, Karras S, Antonopoulou V, Angeloudi E, Zebekakis P, Kotsa K. Effects of
Orthodox religious fasting on human health: a systematic review. Eur J Nutr.
2017;56[8]:2439–55.
63. CSA. Population and Housing Census of Ethiopia. 2007.
64. Id ANB, Potts KS, Mulugeta A. How do pregnant and lactating women , and young
children , experience religious food restriction at the community level ? A qualitative
study of fasting traditions and feeding behaviors in four regions of Ethiopia. PLoS ONE
2018; 13(12): e0208408. https://doi.org/10.1371/journal.pone.0208408
65. EOTC/USAID. Patriarch of the Ethiopian Orthodox Tewahedo Church Endorses Nutrition
Sermon Guide Encouraging Better Nutrition for Mothers and Children . 2016 Jan 12;1–2.
66. Desalegn BB, Lambert C, Riedel S, Negese T, Biesalski HK. Ethiopian Orthodox Fasting
and Lactating Mothers : Longitudinal Study on Dietary Pattern and Nutritional Status in
Rural Tigray , Ethiopia. Int J Environ Res Public Heal. 2018;15[1767]:1–20.
67. Alive and Thrive. IYCF practices, beliefs, and influences in Tigray Region, Ethiopia.

25
Addis Ababa, Ethiopia; 2010.
68. Mulat E, Alem G, Woyraw W, Temesgen H. Uptake of minimum acceptable diet among
children aged 6 – 23 months in orthodox religion followers during fasting season in rural
area, Dembecha, north West Ethiopia. BMC Nutr. 2019;5[18]:1–10.
69. Kumera G, Tsedal E, Ayana M. Dietary diversity and associated factors among children of
Orthodox Christian mothers/caregivers during the fasting season in Dejen district, north
west Ethiopia. Nutrition & Metabolism 2018; 15:16. https://doi.org/10.1186/s12986-018-
0248-0
70. TEWODROS D. Beef Cattle Production System and Opportunities for Market Orientation
in Borena Zone, Southern. MSc Thesis, Department of Animal Science, Haromaya
University; 2008. Pp.139.
71. Avery A. Red Meat and Poultry Production and Consumption in Ethiopia and Distribution
in Addis Ababa. International Livestock Research Institute 2004, Addis Abeba,
Ethiopia.Pp.64.
72. DSM. Nutrition during the first 1 , 000 days. In: Vitamins in Motion for a brighter world.
2015. p. 1–24.
73. Williams J, Mai CT, Mulinare J. National Birth Defects Prevention Month and Folic Acid
Awareness Week — January 2015 Updated Estimates of Neural Tube Defects Prevented
by Mandatory Folic Acid Fortification — United States , 1995 – 2011. MMWR.
2015;64[1]:1–5.
74. Gebre B, Biadgilign S, Taddese Z, Legesse T, Letebo M. Determinants of malnutrition
26
among pregnant and lactating women under humanitarian setting in Ethiopia. BMC Nutr.
2018;4[11]:1–8.
75. FAO/WHO. Human Vitamin and Mineral Requirements. Rome, Italy; 2001.
76. FAO/WHO/UNU. Human energy requirements. Rome, Italy; 2001.
77. FAO/WHO/UNU. Protein and Amino acid requirements in Human Nutrition. a of Joint a
Joint. Geneva, Switzerland; 2001.
78. National Academy of Sciences. Nutrition During Lactation. 4th Editio. Washington, D.C:
National Academy Press; 1991. 326 p.
79. Demissie T, Mekonen Y, Haider J. Agroecological comparison of leveles and correlates of
nutritional status of women. Ethiop J Heal Dev. 2003;17[3]:189–96.
80. WHO. Indicators for assessing infant and young child feeding practices. Part 3 Ctry
Profiles. 2010;1–47.
81. Roba KT, Connor TPO, Belachew T, Brien NMO. Infant and Young Child Feeding [
IYCF ] Practices Among Mothers of Children Aged 6 – 23 Months in Two Agro-
ecological Zones of Rural Ethiopia. International Journal of Nutrition and Food Sciences
2016;5[3]:185–94.
82. CSA. Ethiopia Demographic and Health Survey 2011. Addis Ababa; 2012.
83. Stoecker BJ, Abebe Y. Context for food-based approaches for improved feeding of infants
and children in Ethiopia. Food Nutr Bull. 2014;35[4]:S209–13.
84. Mulugeta A, Hagos F, Kruseman G, Linderhof B, Stoecker B, Abraha Z, et al. Factors
Contributing to Child Malnutrition in Tigray , Northern Ethiopia. East Afr Med J.
2010;87[6]:248–54.

27
85. FAO and FHI 360. Minimum Dietary Diversity for Women A Guide to Measurement.
Rome; 2016. 82 p.
86. Dangura D, Gebremedhin S. Dietary diversity and associated factors among children 6-23
months of age in Gorche district, Southern Ethiopia: Cross-sectional study. BMC Pediatr
[Internet]. 2017;17[1]:1–7. Available from: http://dx.doi.org/10.1186/s12887-016-0764-x
87. Roba KT, O‘Connor TP, Belachew T, O‘Brien NM. Variations between post- and pre-
harvest seasons in stunting, wasting, and infant and young child feeding [IYCF] practices
among children 6-23 months of age in lowland and midland agro-ecological zones of rural
Ethiopia. Pan Afr Med J. 2016;24:1–9.
88. Weldehaweria NB, Misgina KH, Weldu MG, Gebregiorgis YS, Gebrezgi BH, Zewdie
SW, et al. Dietary diversity and related factors among lactating women visiting public
health facilities in Aksum town, Tigray, Northern Ethiopia. BMC Nutr [Internet].
2016;2[38]. Available from: http://bmcnutr.biomedcentral.com/articles/10.1186/s40795-
016-0077-3
89. Stoecker BJ, Abebe Y. Context for food-based approaches for improved feeding of infants
and children in Ethiopia. Food and Nutrition Bulletin 2014;35[4]:209–13.
90. Arimond M, Ruel MT. Dietary diversity is associated with child nutritional status :
Evidence from 11 demographic and health surveys. JNutr. 2004;134:2579–85.
91. FAO. Moving forward on choosing a standard operational indicator of women`s dietary
diversity. 2015. 226 p.
92. Gewa CA, Murphy SP, Weiss RE, Neumann CG. Determining minimum food intake
amounts for diet diversity scores to maximize associations with nutrient adequacy : an
analysis of schoolchildren‘ s diets in rural Kenya. Public Health Nutrition 2014; 17(12),
2667–2673. doi:10.1017/S1368980014000469

28
93. Ersino G, Henry CJ, Zello GA. Suboptimal Feeding Practices and High Levels of
Undernutrition among Infants and Young Children in the Rural Communities of Halaba
and Zeway, Ethiopia. Food Nutr Bull. 2016;37[3]:409–24.
94. Tassew AA, Tekle DY, Belachew AB, Id MA. Factors affecting feeding 6 – 23 months
age children according to minimum acceptable diet in Ethiopia : A multilevel analysis of
the Ethiopian Demographic Health Survey. PLoSONE 2019; 14(2): e0203098.
https://doi.org/10.1371/journal.pone.0203098
95. Bhandari S, Sayami JT, Thapa P, Sayami M, Kandel BP, Banjara MR. Dietary intake
patterns and nutritional status of women of reproductive age in Nepal: Findings from a
health survey. Arch Public Heal [Internet]. 2016;74[1]:1–11. Available from:
http://dx.doi.org/10.1186/s13690-016-0114-3
96. Jati IRAP, Widmer C, Purwestri RC, Wirawan NN, Gola U, Lambert C, et al. Design and
validation of a program to identify inadequate intake of iron, zinc, and vitamin A.
Nutrition [Internet]. 2014;30[11–12]:1310–7. Available from:
http://dx.doi.org/10.1016/j.nut.2014.03.015
97. Federal Republic of Ethiopia DRM and FS. Disaster risk management and [ DRMFSS ]
woreda disaster risk profile [ WDRP ] region : zone : woreda: eastern Tigray Ganta
Ahfeshum February 2015 Addis Ababa Contents. Addis Ababa; 2015.

29
Chapter 2
Paper I

30
2. Ethiopian Orthodox Fasting and Lactating Mothers: Longitudinal Study on
Dietary Pattern and Nutritional Status in Rural Tigray, Ethiopia
Beruk Berhanu Desalegn1,2,*
, Christine Lambert2, Simon Riedel
2, Tegene Negese
1 and Hans
Konrad Biesalski2
1College of Agriculture, Hawassa University, Postal code: 05, Hawassa, Ethiopia;
2Institute of Biological Chemistry and Nutrition, University of Hohenheim, Garbenstr. 30, 70593
Stuttgart, Germany; [email protected] (C.L.); simon.riedel@uni-
hohenheim.de (S.R.); [email protected] (H.K.B.)
* Correspondence: [email protected] Tel.: +251-941-048-918
A version of this chapter has been published as
Desalegn, B., Lambert, C., Riedel, S., Negese, T., Biesalski, H.K. (2018). Ethiopian Orthodox
Fasting and Lactating Mothers: Longitudinal Study on Dietary Pattern and Nutritional Status in
Rural Tigray, Ethiopia. International Journal of Environmental Research and Public Health,
15(1767). doi:10.3390/ijerph15081767.
31
Ethiopian Orthodox Fasting and Lactating Mothers: Longitudinal
Study on Dietary Pattern and Nutritional Status in Rural Tigray,
Ethiopia
Abstract
About half of Ethiopians belong to the Orthodox Tewahedo religion. Annually, more than 200
days are dedicated to religious fasting, which includes abstaining from all types of food, animal
source foods, and water. However, the association of fasting with undernutrition remains
unknown in Ethiopia. Therefore, dietary pattern and nutritional status of lactating women during
lent fasting and non-fasting periods were studied, and predictor variables for maternal
underweight were identified. To achieve this, lactating mothers in lent fasting (N = 572) and non-
fasting (N = 522) periods participated from rural Tigray, Northern Ethiopia. Average minimum
diet diversity (MDD-W) was computed from two 24-h recalls, and nutritional status was assessed
using body mass index (BMI). Binary logistic regression was used to identify potential predictors
of maternal underweight. Wilcoxon signed-rank (WSRT) and McNemar‘s tests were used for
comparison of the two periods. The prevalence of underweight in fasting mothers was 50.6%. In
the multivariate logistic regression model, younger age, sickness in the last four weeks preceding
the survey, fasting during pregnancy, lactation periods, grandfathers‘ as household decision
makers, previous aid experience, non-improved water source, and not owning chicken were
positively associated with maternal underweight. In WSRT, there was no significant (p > 0.05)
difference on maternal body weight and BMI between periods. The average number of meals,
diet diversity, and animal source foods (ASFs), consumption scores were significantly increased
in non-fasting compared to fasting periods in both fasting and non-fasting mothers (p < 0.001, p
32
< 0.05, and p < 0.001, respectively). Consumption of dark green leafy vegetables was higher in
the fasting period (11%) than non-fasting (3.6%), in the study population. As a conclusion,
Ethiopian Orthodox fasting negatively affected maternal nutritional status and dietary pattern in
rural Tigray, Northern Ethiopia. To reduce maternal malnutrition in Ethiopia, existing multi-
sectoral nutrition intervention strategies, should include religious institutions in a sustainable
manner.
Keywords: lactating mothers; Ethiopian Orthodox lent fasting; ASFs consumption; underweight;
Ethiopia
2.1. Introduction
Undernutrition is a serious public health problem worldwide. It is the underlying cause for 3.5
million deaths, 35% of the disease burden in children younger than 5 years old, 11% of total
global disability-adjusted life-years (DALYs) and accounted for at least 20% of maternal
mortality [1–4]. According to Food and Agriculture Organization of the United Nations (FAO)
estimates, the global prevalence of chronically undernourished people increased from 777
million (10.6%) in 2015 to 815 Million (11%) in 2016; however, the deterioration was most
severe in sub-Saharan Africa. Eastern Africa is one of the four sub-regions in sub-Saharan
Africa, where one-third (33.9%) of the population was estimated to be undernourished in 2016
[3].
Good nutritional status of women is important for their good health and working capacity, as
well as for the health of their offspring [1]. During pregnancy and lactation, women are more
33
vulnerable to undernutrition than others at reproductive age, due to increased energy and nutrient
requirements [5–7]. Globally in 2011, the prevalence of anemia in pregnant women was 38.2%
vs. 29% in non-pregnant women [8]. According to the Demographic and Health Survey (DHS) in
Ethiopia, the prevalence of anemia in pregnant or lactating women (19% and 29%) was higher
than in non-lactating-non-pregnant women (15% and 21%) [DHS 2011, 2016, respectively]
[9,10]. Likewise, the prevalence of underweight (BMI < 18.5 kg/m2) in lactating mothers was
25–55%, which was higher than non-pregnant-non-lactating women (22%) [5,9–12].
Food taboos refer to those foods which are strictly forbidden for health, cultural, and religious
reasons [13–16]. In Ethiopia, food taboos are thought to have been established during pregnancy
as a means of protecting the health of women and their babies. As a result, scholars in Ethiopia
focused on the exploration of food taboos during pregnancy and its association with their
nutritional status and feeding practices [15–18]. However, lactating mothers who even need more
nutrients than pregnant women [5,6,12], are ignored in this regard. Religious fasting is one of the
categories of dietary or food taboos, which may affect the dietary intake and nutritional status of
lactating mothers, and these may lead to undernourished breastfed children. The main difference
between religious fasting and the ordinary type of food taboo is its momentary nature, in which
abstention from eating animal source foods and/or from eating certain foods is done for fixed
periods of time [19]. According to previous studies, Ramadan fasting affected nutritional status,
dietary nutrient intake, birth outcome, breast milk composition, and health status of women in
reproductive age [20–28].
In Ethiopia, about half (44%) of the whole population are Ethiopian Orthodox Christians [9].
Religious fasting from any animal source foods and abstaining from any foods and water for
some hours daily is mandatory. However, if it is practiced, it affects over 200 days annually [29].
34
Apart from this, children less than seven years old, soldiers, severely ill or weak people,
pregnant, and lactating mothers are permitted to eat both animal source foods and other foods
including water, without abstention during the religious fasting periods or days [19,29,30].
Nonetheless, information is lacking on the effect of religious fasting on the dietary and
nutritional status of women in reproductive age. Therefore, the purpose of this study was to
explore the dietary pattern and nutritional status of lactating women during Ethiopian Orthodox
Lent fasting and non-fasting periods, and to identify potential predictors associated with maternal
underweight in rural Tigray, Northern Ethiopia.
2.2. Materials and Methods
2.2.1. Study Area, Design, Participants, and Sampling
The study was conducted in the Genta Afeshum woreda of rural Tigray, Northern Ethiopia. The
woreda covers an area of 1636 km2 with a total population of 99,112, and almost all people
(99%) are Orthodox Christians. The woreda reside at an altitude between 2045 and 3314 masl.
The woreda is classified as a hotspot for food insecurity [31–33]. In the woreda, drought, hail
storms, and livestock diseases are the major disaster risks; followed by human diseases, crop
diseases, pests, and flooding. Additionally, deforestation, water pollution, and soil erosion are the
major environmental problems; whereas, high dependency syndrome, poor economic conditions,
land shortage, severe shortage of drinking water, and poor saving are among the major
vulnerability factors at the household level [34].
The study had a community-based longitudinal survey design, to assess the nutritional status and
dietary pattern of lactating mothers. The data was collected during the Ethiopian Orthodox lent
fasting period (Fasting of Jesus Christ, 15 February 2017 to 15 April 2017) and non-fasting
35
periods (1 May 2017 to 30 May 2017). The sample size was calculated based on the prevalence
of underweight in lactating mothers in the Tigray region, using the formula for estimating single
population proportion and considering a 95% of confidence interval for true prevalence, and a
relative precision (d) of 5%. In lactating mothers, the prevalence of underweight (BMI < 18.5
kg/m2) was 25% elsewhere in Tigray [5]. The total number of lactating mothers was estimated to
be 3369, which was less than 10,000; therefore, the finite source population size correction
formula was used. Additionally, 10% was considered as non-responses and dropout rates.
Moreover, a 1.5 design effect was used on the final calculated sample size, and the final total
sample size was 575.
Multi-stage systematic random sampling was applied to obtain representative samples for the
study. At first, Genta Afeshum was randomly selected out of the three GIZ Ethiopia, Nutrition
Sensitive Agriculture (NSA) project woreda‘s in Tigray region. Out of twenty rural kebeles in
the Genta Afeshum woreda, seven were randomly selected. Then, the list of households which
had lactating mothers with children aged between 6 to 23 months old, who fulfilled the inclusion
criteria, was prepared for the seven kebeles (lowest local administrative unit) by health extension
workers at the nearby health posts. Subsequently, the samples were chosen using systematic
random sampling techniques.
2.2.2. Data Collection
Ten trained and well experienced data collectors who were fluent in Tigrigna, Amharic, and
English languages were recruited. Additionally, before conducting the main survey, the
questionnaire was translated to Tigrighna by a professional translator and verified by data
collectors. Then the translated questionnaire was pre-tested for its appropriateness, by
36
administering it to lactating mothers around Mekele, and corrections were made. Structured and
semi-structured questionnaires were prepared to collect information on socio-demographic and
economic characteristics, maternal and child characteristics, water, sanitation and hygiene
(WASH), feeding practices, and household food security indicators [35].
Before conducting the study, the whole study protocol was ethically approved by the Institutional
Review Board of the College of Health Sciences at Hawassa University and the Tigray Region
Health Bureau in Ethiopia; and the ethical review committee of Landesärztekammer Baden-
Württemberg, Germany. Permissions from Genta Afeshum Woreda Health Office were also
obtained. After the purpose of the study was explained to the study participants, agreement to
participate in the study was documented by signing the informed consent. Each participant was
also told that the collected information was confidential, and whenever she wanted to
discontinue, withdrawal from the study was possible.
2.2.3. Minimum Women Diet Diversity Score
The minimum-diet diversity score (MDD-W) was obtained by (a) collecting two 24-h dietary
recalls; (b) categorizing as consumed or not consumed of the food group, considering the
minimum amount (15 g) of any food items or the sum of food items eaten under a given food
group and giving a score of 1 if consumed, otherwise 0 if not; (c) calculating the diet diversity
score for each two days using 10 food groups, as the summation of consumed food groups or
scored 1 for each day separately; and (d) taking the average diet diversity score of the two days,
as an individual MDD-W score. The 10 food groups used for calculating MDD-W score were
grains, white roots and tubers, and plantains; pulses (beans, peas, and lentils); nuts and seeds;
37
dairy; meat, poultry, and fish; eggs; dark green leafy vegetables; other vitamin A-rich fruits and
vegetables; other vegetables; and other fruits [36].
2.2.4. Household Food Insecurity Information
Household food insecurity data was collected using the household food insecurity access scale
(HFIAS). It is the measure of the degree of food insecurity (access) in the household in the past 4
weeks (30 days). The questionnaire encompassed nine questions, which assess the occurrence of
food insecurity in increasing level. Under each of the nine questions, frequency of occurrence
questions were a follow up to determine how often the condition (1 = rarely, 2 = sometimes, 3 =
often) occurred.
The Household Food Insecurity Access Prevalence (HFIAP) status indicator, was used to
determine prevalence of food insecurity to report household food insecurity. Using the HFIAP
indicators four categories, the households were categorized into four levels of household food
insecurity (access). These were food secure, mild, moderately, and severely food insecure. After
creating these four categories, the HFIAP was calculated as the number of households with a
given food insecurity category divided by the total number of households with household food
insecure access category, multiplied by 100 [35].
2.2.5. Wealth Index
Principal component analysis (PCA) was carried out to compute the wealth index. To achieve
this, 17 variables: transport animals (horse/donkey/mule), goat and/or sheep, household owns
kerosene or lamp, owns bed, chair, table, radio, electric-mitad, bicycle, mobile phone, non-
mobile phone, animal drawn cart, motor bicycle, TV, electricity, windows and separate room for
animal, which could indicate the living standard of the surveyed area were included in the

38
analysis. The first factor that explained most of the variation (86.3%) was used to group study
households. Finally, the wealth tertile was performed and categorized as higher, medium, and
lower [37].
2.2.6. Anthropometry
Weighing body mass of the mothers was conducted using a portable digital scale (Seca 770,
Hanover, Germany), working with a powered battery and measured to the nearest 0.1 kg. For
height measurement, a dissembling plastic height measuring board with a sliding head bar was
used and measured to the nearest 0.1 cm. During weight and height measurements, the mothers
were advised to remove their jackets until they had light clothes to minimize the weight due to
clothes.
The measurements (height and weight) were carried out using standardized equipment and
procedures in duplicate and the average values were used. Additionally, the BMI of the mothers
was calculated as the weight of the mothers in kilograms divided by the square of their height in
meters. The BMI values of mothers were classified in three categories as underweight, normal,
and overweight (<18.5, 18.5–24.99 and 25 kg/m2), respectively [38].
2.2.7. Data Management and Analysis
Before submitting the data, variable coding was conducted in SPSS version 20. Following this,
the data was entered, cleaned, and analyzed. First, frequency and crosstab were conducted to
determine completeness of data and to present the results in descriptive statistics (frequency and
percent). Association between outcome and potential explanatory variables, was assessed using
bivariate analysis with a confidence level of 95% to declare the statistical significance. Out of all
the independent variables entered in bivariate logistic regression, seventy variables with p-values
39
of less than 0.25 were entered for multivariable logistic regression to identify predictor variables
for maternal underweight (BMI < 18.5 kg/m2). p-value < 0.05 was used to declare the variables
as predictors for the outcome variable. Hosmer and Lemeshow test and C-statistics (AUC) were
conducted to assess fitness of the final model. Meanwhile, multi-collinearity was checked using
the variance inflation factor (VIF) and standard error with <10 and <2 as a cutoff point,
respectively. Maternal nutritional status was defined as underweight (BMI < 18.5 kg/m2) and
normal if BMI =>18.5 kg/m2, since the interest ofthis study was being underweight for logistic
regression. Normality of continuous data was checked using the Kolmogorov-Smirnov test. Non-
normally distributed data was analyzed using the Wilcoxon signed-rank test; whereas the
dichotomous data was analyzed using McNemar‘s test to detect a difference between fasting and
non-fasting periods, of fasting and non-fasting mothers for their dietary pattern, separately.
2.3. Results
A total of 572 lactating mothers who were inhabitants of Genta Afeshum district of rural Tigray,
Northern Ethiopia participated during the 1st round of data collection (Ethiopian Orthodox lent
fasting) period, with a response rate of 99.5%. Out of those participants in the 1st survey, 522
mothers were again involved during the non-fasting period, with a response rate of 90.8%. The
lost for follow-up was due to age (>23 months) of breastfeeding child, migration to other areas,
and absence during the re-visit at the 2nd round survey period.
In this study, all mothers were from the Tigray ethnic group (100%) and almost all were
Ethiopian Orthodox Christians (99.7%). Majority of mothers were married (84.8%); whereas, the
rest were single, widowed, and divorced mothers. More than sixty percent of mothers were thirty
years old and above in the study. However, about eight out of ten mothers were married before
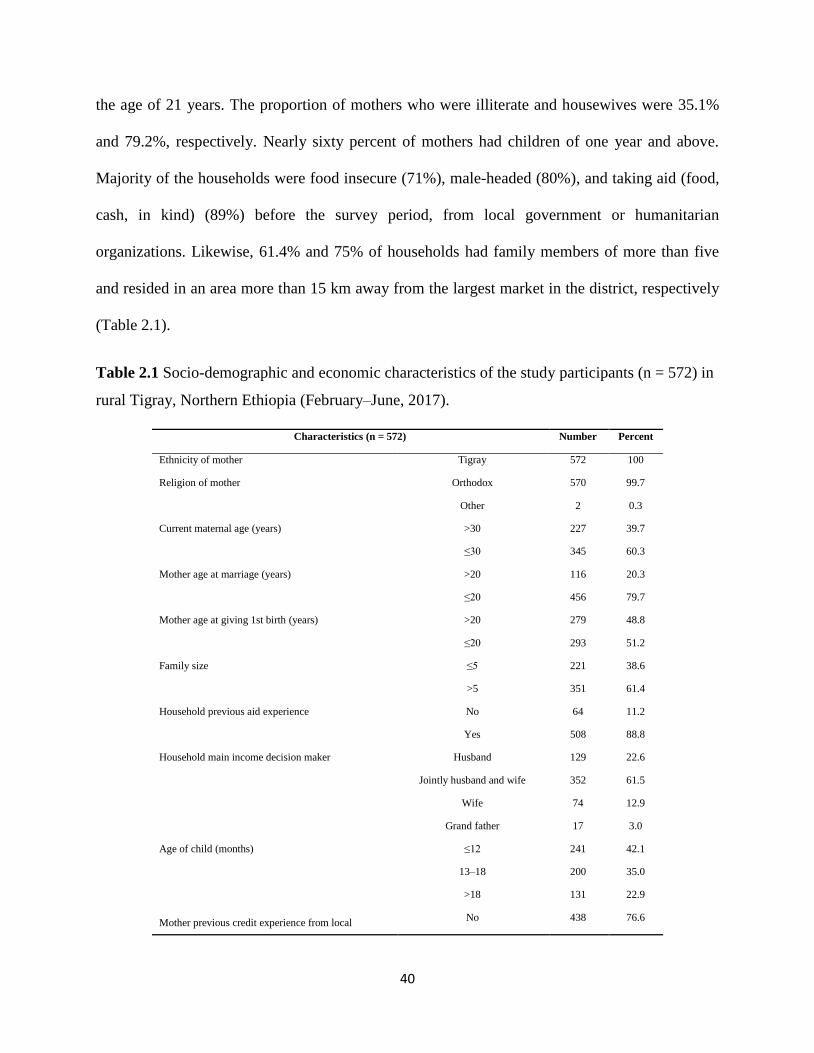
40
the age of 21 years. The proportion of mothers who were illiterate and housewives were 35.1%
and 79.2%, respectively. Nearly sixty percent of mothers had children of one year and above.
Majority of the households were food insecure (71%), male-headed (80%), and taking aid (food,
cash, in kind) (89%) before the survey period, from local government or humanitarian
organizations. Likewise, 61.4% and 75% of households had family members of more than five
and resided in an area more than 15 km away from the largest market in the district, respectively
(Table 2.1).
Table 2.1 Socio-demographic and economic characteristics of the study participants (n = 572) in
rural Tigray, Northern Ethiopia (February–June, 2017).
Characteristics (n = 572) Number Percent
Ethnicity of mother Tigray 572 100
Religion of mother Orthodox 570 99.7
Other 2 0.3
Current maternal age (years) >30 227 39.7
≤30 345 60.3
Mother age at marriage (years) >20 116 20.3
≤20 456 79.7
Mother age at giving 1st birth (years) >20 279 48.8
≤20 293 51.2
Family size ≤5 221 38.6
>5 351 61.4
Household previous aid experience No 64 11.2
Yes 508 88.8
Household main income decision maker Husband 129 22.6
Jointly husband and wife 352 61.5
Wife 74 12.9
Grand father 17 3.0
Age of child (months) ≤12 241 42.1
13–18 200 35.0
>18 131 22.9
Mother previous credit experience from local No 438 76.6
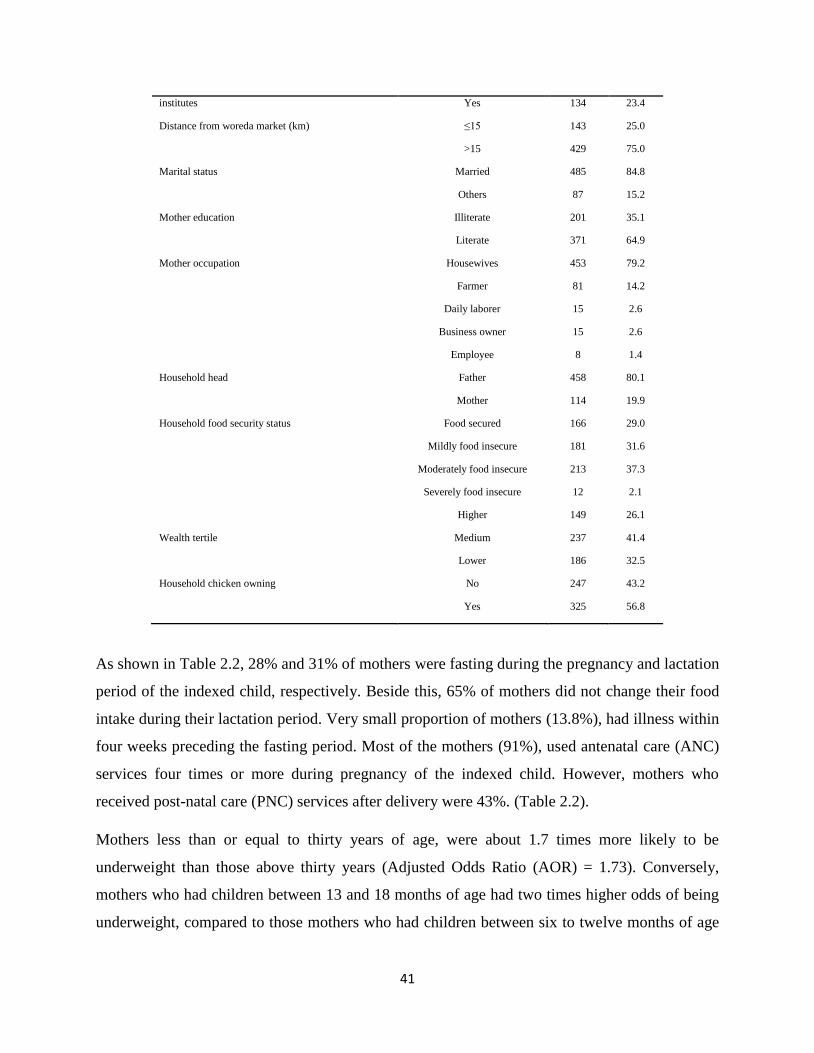
41
institutes Yes 134 23.4
Distance from woreda market (km) ≤15 143 25.0
>15 429 75.0
Marital status Married 485 84.8
Others 87 15.2
Mother education Illiterate 201 35.1
Literate 371 64.9
Mother occupation Housewives 453 79.2
Farmer 81 14.2
Daily laborer 15 2.6
Business owner 15 2.6
Employee 8 1.4
Household head Father 458 80.1
Mother 114 19.9
Household food security status Food secured 166 29.0
Mildly food insecure 181 31.6
Moderately food insecure 213 37.3
Severely food insecure 12 2.1
Wealth tertile
Higher 149 26.1
Medium 237 41.4
Lower 186 32.5
Household chicken owning No 247 43.2
Yes 325 56.8
As shown in Table 2.2, 28% and 31% of mothers were fasting during the pregnancy and lactation
period of the indexed child, respectively. Beside this, 65% of mothers did not change their food
intake during their lactation period. Very small proportion of mothers (13.8%), had illness within
four weeks preceding the fasting period. Most of the mothers (91%), used antenatal care (ANC)
services four times or more during pregnancy of the indexed child. However, mothers who
received post-natal care (PNC) services after delivery were 43%. (Table 2.2).
Mothers less than or equal to thirty years of age, were about 1.7 times more likely to be
underweight than those above thirty years (Adjusted Odds Ratio (AOR) = 1.73). Conversely,
mothers who had children between 13 and 18 months of age had two times higher odds of being
underweight, compared to those mothers who had children between six to twelve months of age
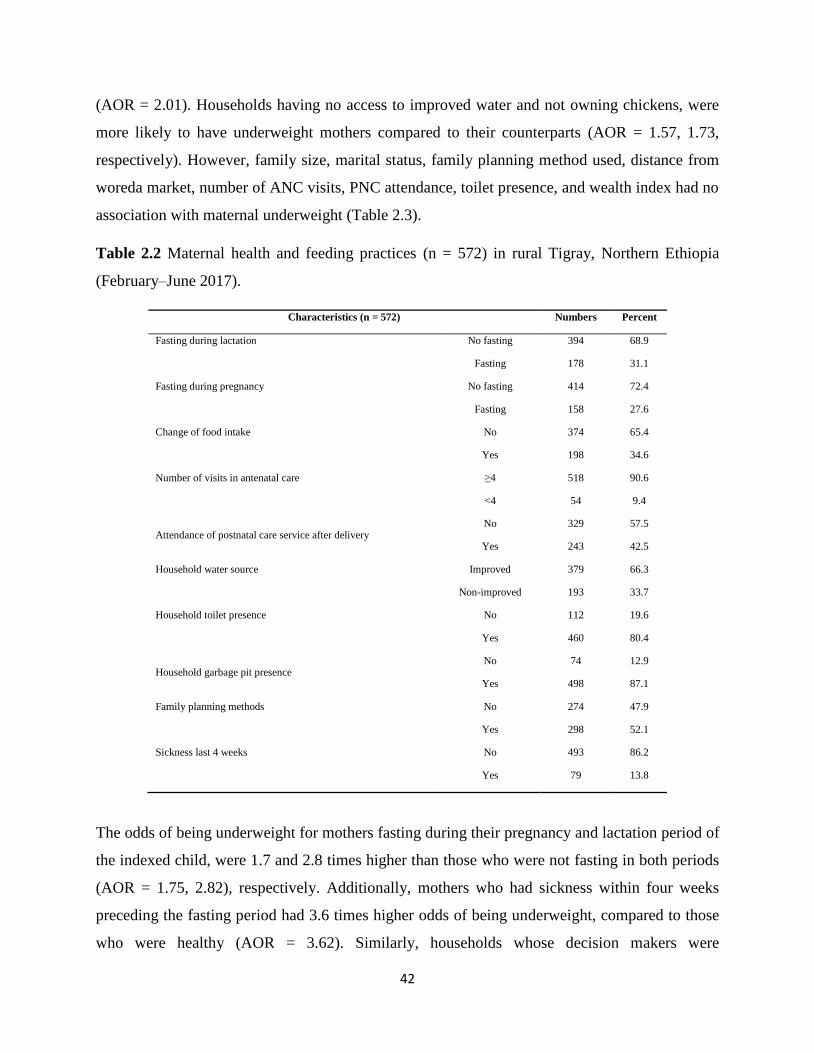
42
(AOR = 2.01). Households having no access to improved water and not owning chickens, were
more likely to have underweight mothers compared to their counterparts (AOR = 1.57, 1.73,
respectively). However, family size, marital status, family planning method used, distance from
woreda market, number of ANC visits, PNC attendance, toilet presence, and wealth index had no
association with maternal underweight (Table 2.3).
Table 2.2 Maternal health and feeding practices (n = 572) in rural Tigray, Northern Ethiopia
(February–June 2017).
Characteristics (n = 572) Numbers Percent
Fasting during lactation No fasting 394 68.9
Fasting 178 31.1
Fasting during pregnancy No fasting 414 72.4
Fasting 158 27.6
Change of food intake No 374 65.4
Yes 198 34.6
Number of visits in antenatal care ≥4 518 90.6
<4 54 9.4
Attendance of postnatal care service after delivery No 329 57.5
Yes 243 42.5
Household water source Improved 379 66.3
Non-improved 193 33.7
Household toilet presence No 112 19.6
Yes 460 80.4
Household garbage pit presence No 74 12.9
Yes 498 87.1
Family planning methods No 274 47.9
Yes 298 52.1
Sickness last 4 weeks No 493 86.2
Yes 79 13.8
The odds of being underweight for mothers fasting during their pregnancy and lactation period of
the indexed child, were 1.7 and 2.8 times higher than those who were not fasting in both periods
(AOR = 1.75, 2.82), respectively. Additionally, mothers who had sickness within four weeks
preceding the fasting period had 3.6 times higher odds of being underweight, compared to those
who were healthy (AOR = 3.62). Similarly, households whose decision makers were
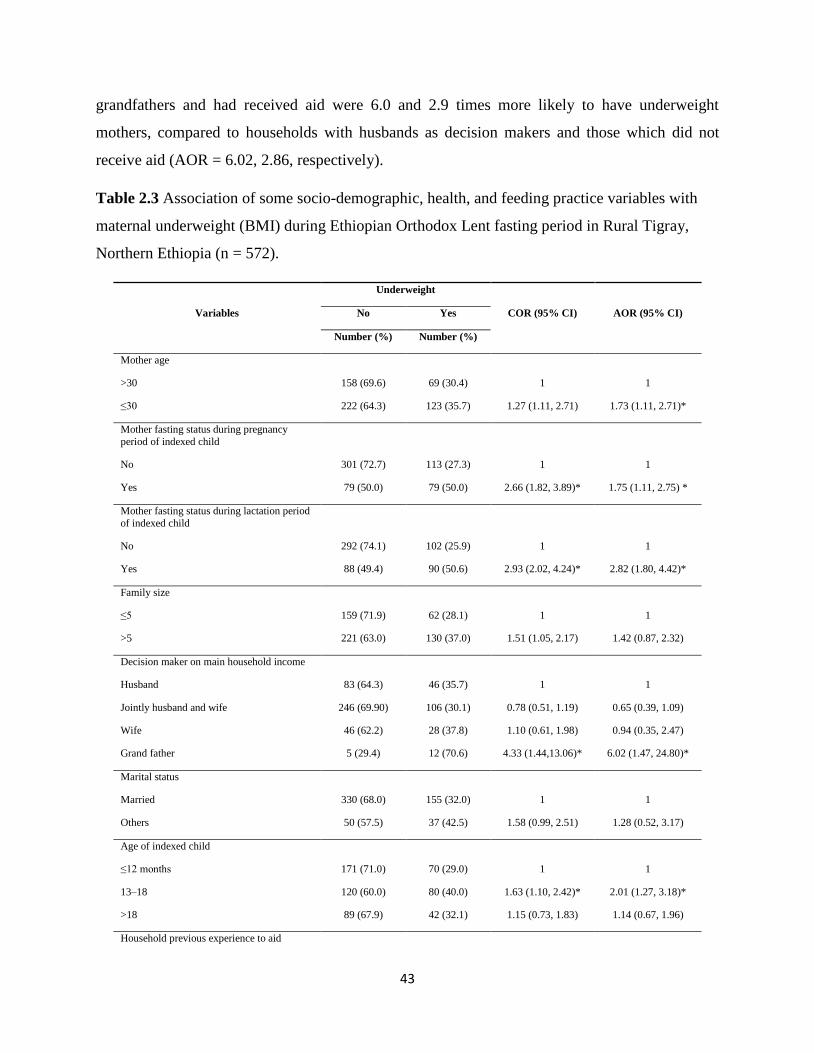
43
grandfathers and had received aid were 6.0 and 2.9 times more likely to have underweight
mothers, compared to households with husbands as decision makers and those which did not
receive aid (AOR = 6.02, 2.86, respectively).
Table 2.3 Association of some socio-demographic, health, and feeding practice variables with
maternal underweight (BMI) during Ethiopian Orthodox Lent fasting period in Rural Tigray,
Northern Ethiopia (n = 572).
Variables
Underweight
COR (95% CI) AOR (95% CI) No Yes
Number (%) Number (%)
Mother age
>30 158 (69.6) 69 (30.4) 1 1
≤30 222 (64.3) 123 (35.7) 1.27 (1.11, 2.71) 1.73 (1.11, 2.71)*
Mother fasting status during pregnancy
period of indexed child
No 301 (72.7) 113 (27.3) 1 1
Yes 79 (50.0) 79 (50.0) 2.66 (1.82, 3.89)* 1.75 (1.11, 2.75) *
Mother fasting status during lactation period
of indexed child
No 292 (74.1) 102 (25.9) 1 1
Yes 88 (49.4) 90 (50.6) 2.93 (2.02, 4.24)* 2.82 (1.80, 4.42)*
Family size
≤5 159 (71.9) 62 (28.1) 1 1
>5 221 (63.0) 130 (37.0) 1.51 (1.05, 2.17) 1.42 (0.87, 2.32)
Decision maker on main household income
Husband 83 (64.3) 46 (35.7) 1 1
Jointly husband and wife 246 (69.90) 106 (30.1) 0.78 (0.51, 1.19) 0.65 (0.39, 1.09)
Wife 46 (62.2) 28 (37.8) 1.10 (0.61, 1.98) 0.94 (0.35, 2.47)
Grand father 5 (29.4) 12 (70.6) 4.33 (1.44,13.06)* 6.02 (1.47, 24.80)*
Marital status
Married 330 (68.0) 155 (32.0) 1 1
Others 50 (57.5) 37 (42.5) 1.58 (0.99, 2.51) 1.28 (0.52, 3.17)
Age of indexed child
≤12 months 171 (71.0) 70 (29.0) 1 1
13–18 120 (60.0) 80 (40.0) 1.63 (1.10, 2.42)* 2.01 (1.27, 3.18)*
>18 89 (67.9) 42 (32.1) 1.15 (0.73, 1.83) 1.14 (0.67, 1.96)
Household previous experience to aid
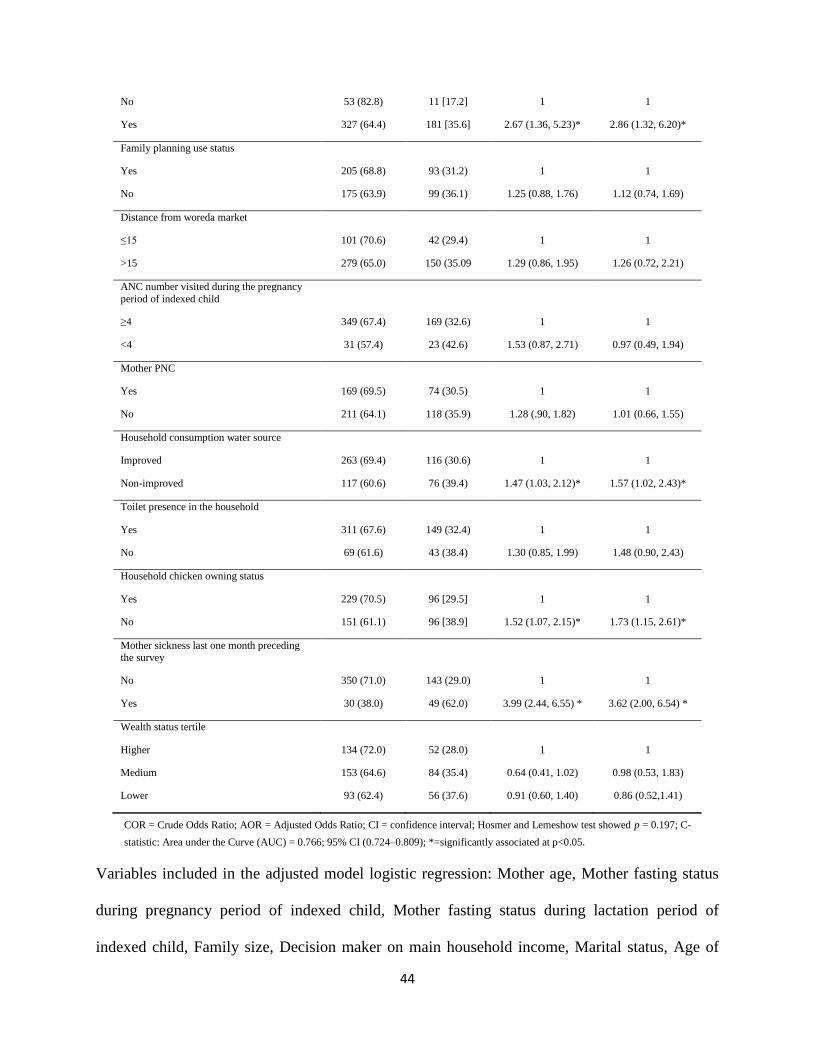
44
No 53 (82.8) 11 [17.2] 1 1
Yes 327 (64.4) 181 [35.6] 2.67 (1.36, 5.23)* 2.86 (1.32, 6.20)*
Family planning use status
Yes 205 (68.8) 93 (31.2) 1 1
No 175 (63.9) 99 (36.1) 1.25 (0.88, 1.76) 1.12 (0.74, 1.69)
Distance from woreda market
≤15 101 (70.6) 42 (29.4) 1 1
>15 279 (65.0) 150 (35.09 1.29 (0.86, 1.95) 1.26 (0.72, 2.21)
ANC number visited during the pregnancy
period of indexed child
≥4 349 (67.4) 169 (32.6) 1 1
<4 31 (57.4) 23 (42.6) 1.53 (0.87, 2.71) 0.97 (0.49, 1.94)
Mother PNC
Yes 169 (69.5) 74 (30.5) 1 1
No 211 (64.1) 118 (35.9) 1.28 (.90, 1.82) 1.01 (0.66, 1.55)
Household consumption water source
Improved 263 (69.4) 116 (30.6) 1 1
Non-improved 117 (60.6) 76 (39.4) 1.47 (1.03, 2.12)* 1.57 (1.02, 2.43)*
Toilet presence in the household
Yes 311 (67.6) 149 (32.4) 1 1
No 69 (61.6) 43 (38.4) 1.30 (0.85, 1.99) 1.48 (0.90, 2.43)
Household chicken owning status
Yes 229 (70.5) 96 [29.5] 1 1
No 151 (61.1) 96 [38.9] 1.52 (1.07, 2.15)* 1.73 (1.15, 2.61)*
Mother sickness last one month preceding the survey
No 350 (71.0) 143 (29.0) 1 1
Yes 30 (38.0) 49 (62.0) 3.99 (2.44, 6.55) * 3.62 (2.00, 6.54) *
Wealth status tertile
Higher 134 (72.0) 52 (28.0) 1 1
Medium 153 (64.6) 84 (35.4) 0.64 (0.41, 1.02) 0.98 (0.53, 1.83)
Lower 93 (62.4) 56 (37.6) 0.91 (0.60, 1.40) 0.86 (0.52,1.41)
COR = Crude Odds Ratio; AOR = Adjusted Odds Ratio; CI = confidence interval; Hosmer and Lemeshow test showed p = 0.197; C-
statistic: Area under the Curve (AUC) = 0.766; 95% CI (0.724–0.809); *=significantly associated at p<0.05.
Variables included in the adjusted model logistic regression: Mother age, Mother fasting status
during pregnancy period of indexed child, Mother fasting status during lactation period of
indexed child, Family size, Decision maker on main household income, Marital status, Age of
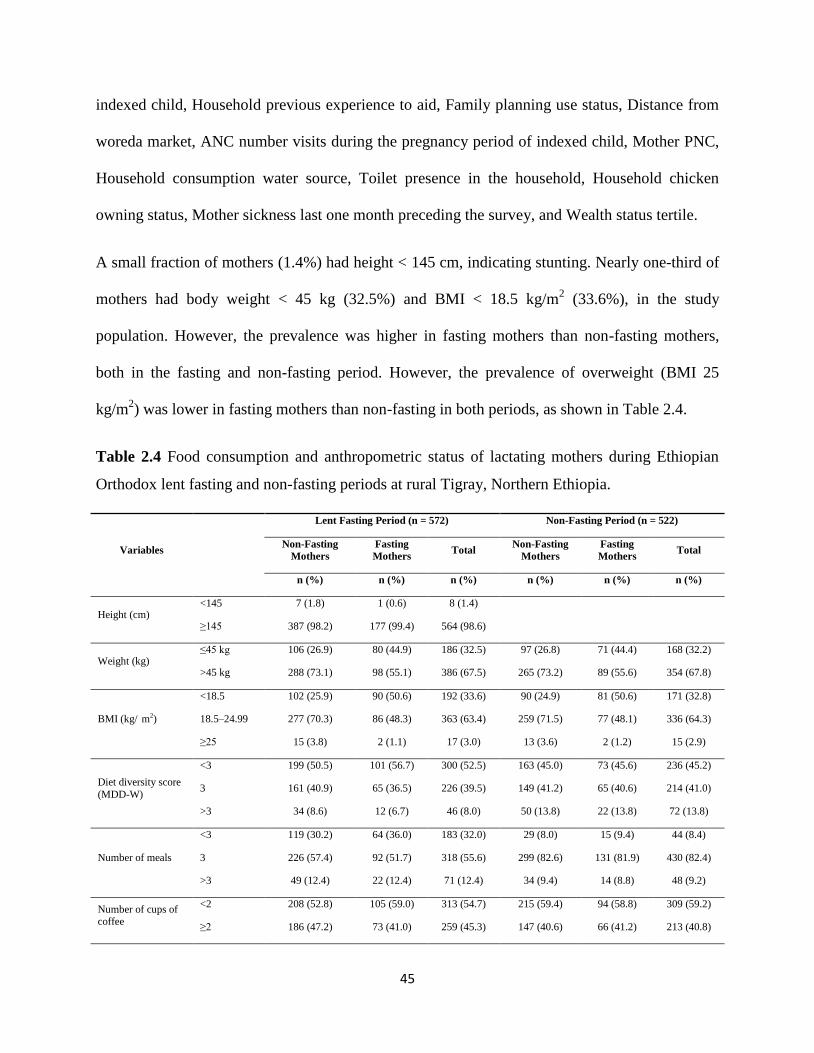
45
indexed child, Household previous experience to aid, Family planning use status, Distance from
woreda market, ANC number visits during the pregnancy period of indexed child, Mother PNC,
Household consumption water source, Toilet presence in the household, Household chicken
owning status, Mother sickness last one month preceding the survey, and Wealth status tertile.
A small fraction of mothers (1.4%) had height < 145 cm, indicating stunting. Nearly one-third of
mothers had body weight < 45 kg (32.5%) and BMI < 18.5 kg/m2 (33.6%), in the study
population. However, the prevalence was higher in fasting mothers than non-fasting mothers,
both in the fasting and non-fasting period. However, the prevalence of overweight (BMI 25
kg/m2) was lower in fasting mothers than non-fasting in both periods, as shown in Table 2.4.
Table 2.4 Food consumption and anthropometric status of lactating mothers during Ethiopian
Orthodox lent fasting and non-fasting periods at rural Tigray, Northern Ethiopia.
Variables
Lent Fasting Period (n = 572) Non-Fasting Period (n = 522)
Non-Fasting
Mothers
Fasting
Mothers Total
Non-Fasting
Mothers
Fasting
Mothers Total
n (%) n (%) n (%) n (%) n (%) n (%)
Height (cm) <145 7 (1.8) 1 (0.6) 8 (1.4)
≥145 387 (98.2) 177 (99.4) 564 (98.6)
Weight (kg) ≤45 kg 106 (26.9) 80 (44.9) 186 (32.5) 97 (26.8) 71 (44.4) 168 (32.2)
>45 kg 288 (73.1) 98 (55.1) 386 (67.5) 265 (73.2) 89 (55.6) 354 (67.8)
BMI (kg/ m2)
<18.5 102 (25.9) 90 (50.6) 192 (33.6) 90 (24.9) 81 (50.6) 171 (32.8)
18.5–24.99 277 (70.3) 86 (48.3) 363 (63.4) 259 (71.5) 77 (48.1) 336 (64.3)
≥25 15 (3.8) 2 (1.1) 17 (3.0) 13 (3.6) 2 (1.2) 15 (2.9)
Diet diversity score
(MDD-W)
<3 199 (50.5) 101 (56.7) 300 (52.5) 163 (45.0) 73 (45.6) 236 (45.2)
3 161 (40.9) 65 (36.5) 226 (39.5) 149 (41.2) 65 (40.6) 214 (41.0)
>3 34 (8.6) 12 (6.7) 46 (8.0) 50 (13.8) 22 (13.8) 72 (13.8)
Number of meals
<3 119 (30.2) 64 (36.0) 183 (32.0) 29 (8.0) 15 (9.4) 44 (8.4)
3 226 (57.4) 92 (51.7) 318 (55.6) 299 (82.6) 131 (81.9) 430 (82.4)
>3 49 (12.4) 22 (12.4) 71 (12.4) 34 (9.4) 14 (8.8) 48 (9.2)
Number of cups of coffee
<2 208 (52.8) 105 (59.0) 313 (54.7) 215 (59.4) 94 (58.8) 309 (59.2)
≥2 186 (47.2) 73 (41.0) 259 (45.3) 147 (40.6) 66 (41.2) 213 (40.8)
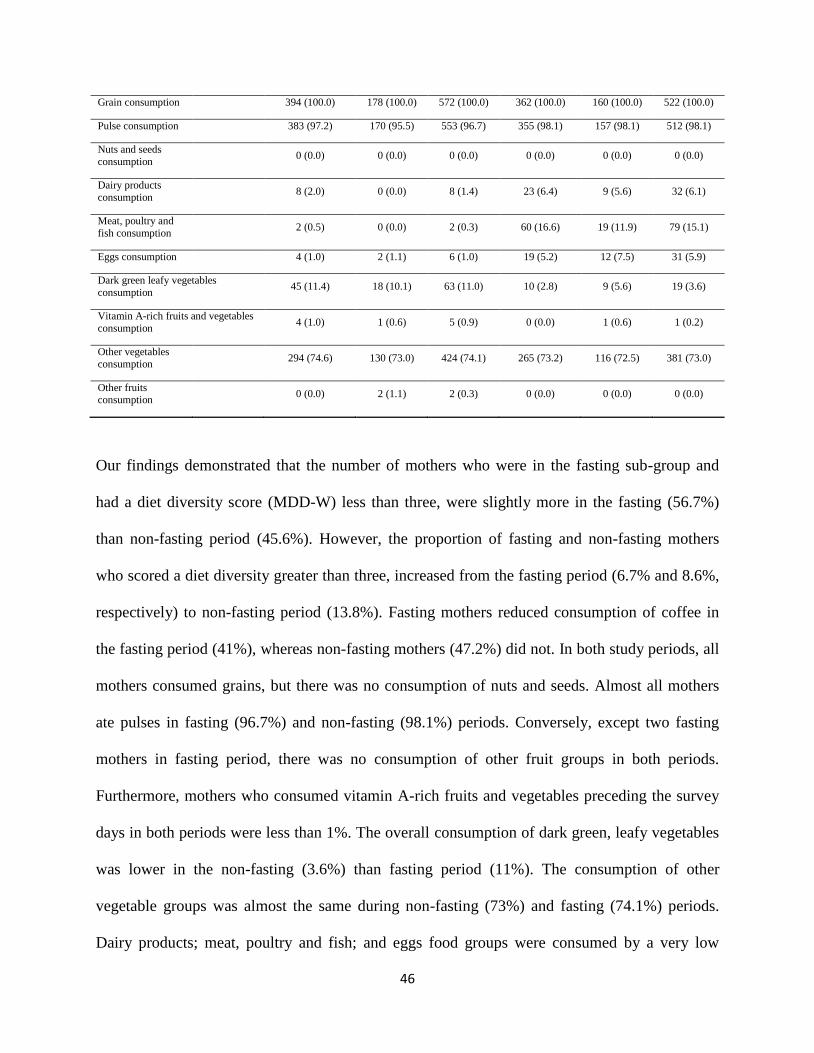
46
Grain consumption 394 (100.0) 178 (100.0) 572 (100.0) 362 (100.0) 160 (100.0) 522 (100.0)
Pulse consumption 383 (97.2) 170 (95.5) 553 (96.7) 355 (98.1) 157 (98.1) 512 (98.1)
Nuts and seeds
consumption 0 (0.0) 0 (0.0) 0 (0.0) 0 (0.0) 0 (0.0) 0 (0.0)
Dairy products
consumption 8 (2.0) 0 (0.0) 8 (1.4) 23 (6.4) 9 (5.6) 32 (6.1)
Meat, poultry and
fish consumption 2 (0.5) 0 (0.0) 2 (0.3) 60 (16.6) 19 (11.9) 79 (15.1)
Eggs consumption 4 (1.0) 2 (1.1) 6 (1.0) 19 (5.2) 12 (7.5) 31 (5.9)
Dark green leafy vegetables
consumption 45 (11.4) 18 (10.1) 63 (11.0) 10 (2.8) 9 (5.6) 19 (3.6)
Vitamin A-rich fruits and vegetables
consumption 4 (1.0) 1 (0.6) 5 (0.9) 0 (0.0) 1 (0.6) 1 (0.2)
Other vegetables
consumption 294 (74.6) 130 (73.0) 424 (74.1) 265 (73.2) 116 (72.5) 381 (73.0)
Other fruits consumption
0 (0.0) 2 (1.1) 2 (0.3) 0 (0.0) 0 (0.0) 0 (0.0)
Our findings demonstrated that the number of mothers who were in the fasting sub-group and
had a diet diversity score (MDD-W) less than three, were slightly more in the fasting (56.7%)
than non-fasting period (45.6%). However, the proportion of fasting and non-fasting mothers
who scored a diet diversity greater than three, increased from the fasting period (6.7% and 8.6%,
respectively) to non-fasting period (13.8%). Fasting mothers reduced consumption of coffee in
the fasting period (41%), whereas non-fasting mothers (47.2%) did not. In both study periods, all
mothers consumed grains, but there was no consumption of nuts and seeds. Almost all mothers
ate pulses in fasting (96.7%) and non-fasting (98.1%) periods. Conversely, except two fasting
mothers in fasting period, there was no consumption of other fruit groups in both periods.
Furthermore, mothers who consumed vitamin A-rich fruits and vegetables preceding the survey
days in both periods were less than 1%. The overall consumption of dark green, leafy vegetables
was lower in the non-fasting (3.6%) than fasting period (11%). The consumption of other
vegetable groups was almost the same during non-fasting (73%) and fasting (74.1%) periods.
Dairy products; meat, poultry and fish; and eggs food groups were consumed by a very low

47
number of both fasting (0%, 0% and 1.1%) and non-fasting mothers (1.4%, 0.3% and 1%) during
the fasting period, respectively. However, consumption of the three ASFs significantly increased
in both fasting and non-fasting mothers, in the non-fasting period compared to fasting period, as
shown in Table 2.4. According to McNemar‘s test, there was no significant difference on the
proportion of fasting mothers who consumed pulses (p = 0.289), dark green leafy vegetables (p =
0.078), vitamin A-rich fruits and vegetables (p = 1.000), and other vegetables groups (p = 1.000),
between fasting and non-fasting periods. However, the proportions of fasting and non-fasting
mothers who consumed eggs, were significantly higher in non-fasting than fasting periods (p =
0.006, p = 0.003, respectively). Similarly, the consumption of pulses and other vegetable groups
by non-fasting mothers were not significantly different (p = 0.332, p = 0.716, respectively),
between fasting and non-fasting periods. However, the number of non-fasting mothers who
consumed dairy; meat, poultry and fish products; eggs; and dark green leafy vegetables were
significantly different (p = 0.002, p = 0.001, p = 0.003 and p = 0.001, respectively), between
fasting and non-fasting periods (Table 2.5).
Using the Wilcoxon signed-rank test, the median BMI, body weight of fasting mothers, and
number of cups of coffee consumed were not significantly different between fasting and non-
fasting periods. Similarly, the median BMI and body weight of non-fasting mothers were not
statistically different between the two periods (Tables 2.6 and 2.7). However, in both fasting and
non-fasting mothers, the number of meals eaten (p = 0.001), MDD-W (p = 0.037 and p = 0.014),
and ASFs consumption scores (p = 0.001) were significantly increased in the non-fasting than
fasting periods, respectively. However, the number of cups of coffee consumed by non-fasting
mothers was significantly (p = 0.009) higher in fasting period than in the non-fasting period
(Tables 2.6 and 2.7).
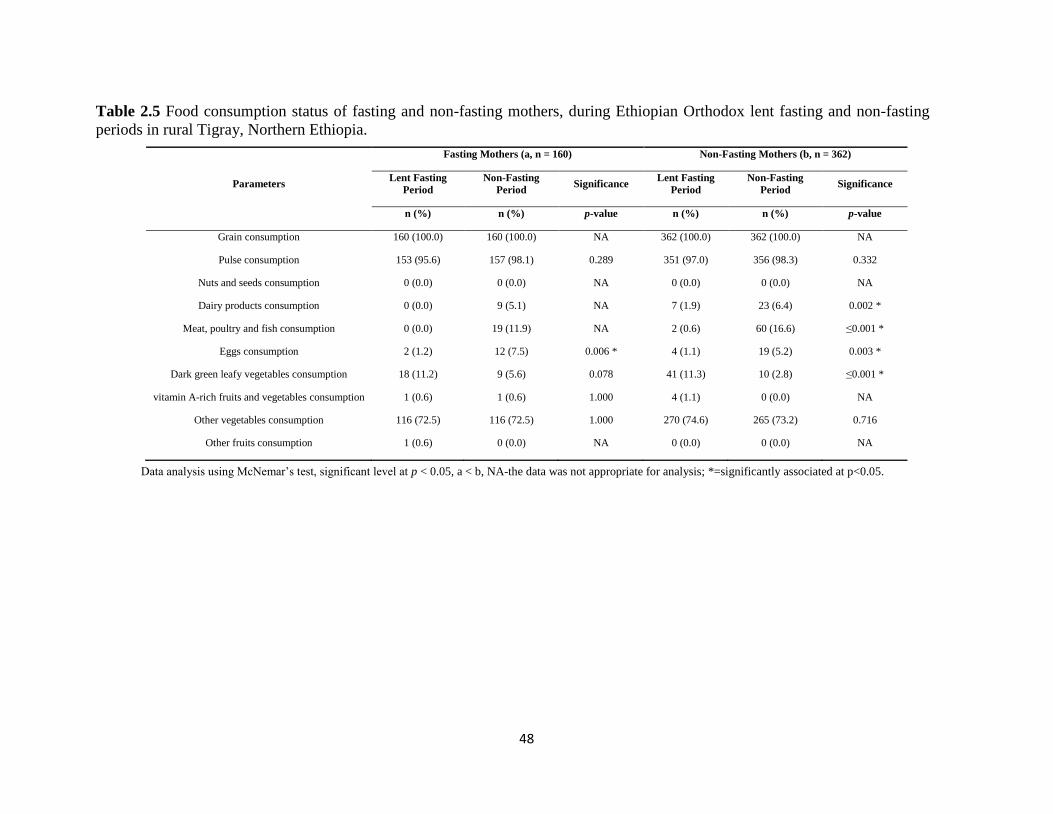
48
Table 2.5 Food consumption status of fasting and non-fasting mothers, during Ethiopian Orthodox lent fasting and non-fasting
periods in rural Tigray, Northern Ethiopia.
Parameters
Fasting Mothers (a, n = 160) Non-Fasting Mothers (b, n = 362)
Lent Fasting
Period
Non-Fasting
Period Significance
Lent Fasting
Period
Non-Fasting
Period Significance
n (%) n (%) p-value n (%) n (%) p-value
Grain consumption 160 (100.0) 160 (100.0) NA 362 (100.0) 362 (100.0) NA
Pulse consumption 153 (95.6) 157 (98.1) 0.289 351 (97.0) 356 (98.3) 0.332
Nuts and seeds consumption 0 (0.0) 0 (0.0) NA 0 (0.0) 0 (0.0) NA
Dairy products consumption 0 (0.0) 9 (5.1) NA 7 (1.9) 23 (6.4) 0.002 *
Meat, poultry and fish consumption 0 (0.0) 19 (11.9) NA 2 (0.6) 60 (16.6) ≤0.001 *
Eggs consumption 2 (1.2) 12 (7.5) 0.006 * 4 (1.1) 19 (5.2) 0.003 *
Dark green leafy vegetables consumption 18 (11.2) 9 (5.6) 0.078 41 (11.3) 10 (2.8) ≤0.001 *
vitamin A-rich fruits and vegetables consumption 1 (0.6) 1 (0.6) 1.000 4 (1.1) 0 (0.0) NA
Other vegetables consumption 116 (72.5) 116 (72.5) 1.000 270 (74.6) 265 (73.2) 0.716
Other fruits consumption 1 (0.6) 0 (0.0) NA 0 (0.0) 0 (0.0) NA
Data analysis using McNemar‘s test, significant level at p < 0.05, a < b, NA-the data was not appropriate for analysis; *=significantly associated at p<0.05.
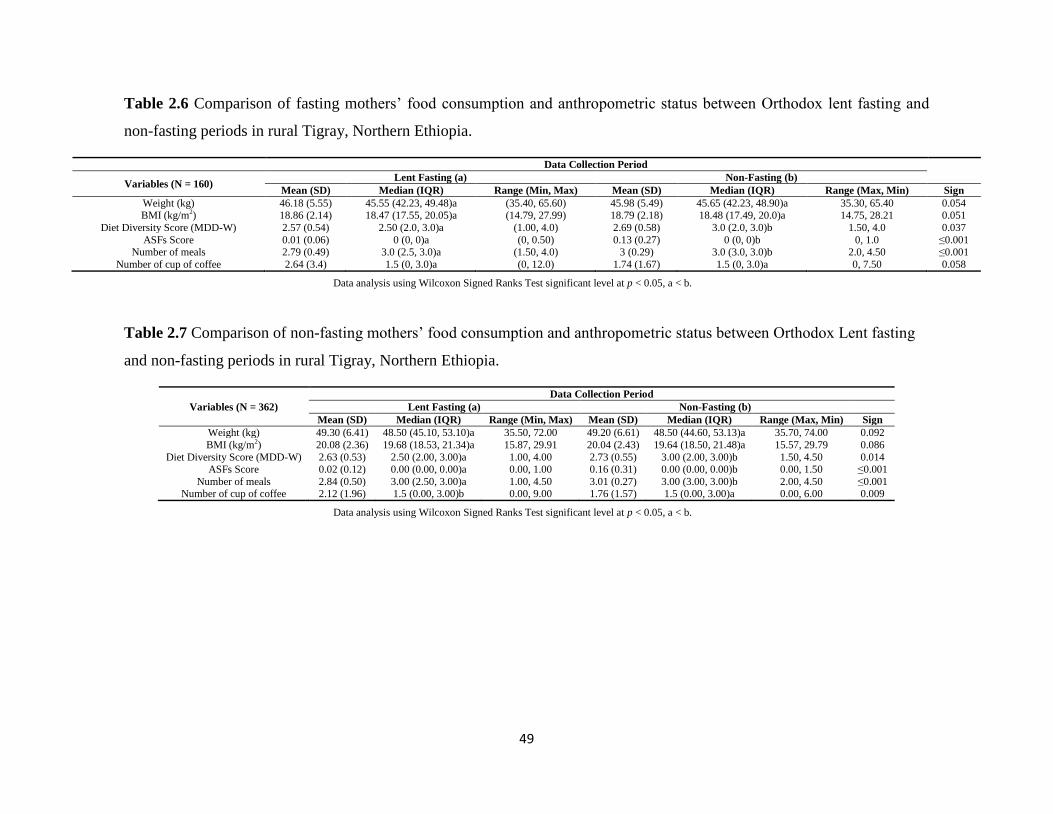
49
Table 2.6 Comparison of fasting mothers‘ food consumption and anthropometric status between Orthodox lent fasting and
non-fasting periods in rural Tigray, Northern Ethiopia.
Data Collection Period
Variables (N = 160) Lent Fasting (a) Non-Fasting (b)
Mean (SD) Median (IQR) Range (Min, Max) Mean (SD) Median (IQR) Range (Max, Min) Sign
Weight (kg) 46.18 (5.55) 45.55 (42.23, 49.48)a (35.40, 65.60) 45.98 (5.49) 45.65 (42.23, 48.90)a 35.30, 65.40 0.054 BMI (kg/m2) 18.86 (2.14) 18.47 (17.55, 20.05)a (14.79, 27.99) 18.79 (2.18) 18.48 (17.49, 20.0)a 14.75, 28.21 0.051
Diet Diversity Score (MDD-W) 2.57 (0.54) 2.50 (2.0, 3.0)a (1.00, 4.0) 2.69 (0.58) 3.0 (2.0, 3.0)b 1.50, 4.0 0.037
ASFs Score 0.01 (0.06) 0 (0, 0)a (0, 0.50) 0.13 (0.27) 0 (0, 0)b 0, 1.0 ≤0.001 Number of meals 2.79 (0.49) 3.0 (2.5, 3.0)a (1.50, 4.0) 3 (0.29) 3.0 (3.0, 3.0)b 2.0, 4.50 ≤0.001
Number of cup of coffee 2.64 (3.4) 1.5 (0, 3.0)a (0, 12.0) 1.74 (1.67) 1.5 (0, 3.0)a 0, 7.50 0.058
Data analysis using Wilcoxon Signed Ranks Test significant level at p < 0.05, a < b.
Table 2.7 Comparison of non-fasting mothers‘ food consumption and anthropometric status between Orthodox Lent fasting
and non-fasting periods in rural Tigray, Northern Ethiopia.
Variables (N = 362)
Data Collection Period
Lent Fasting (a) Non-Fasting (b)
Mean (SD) Median (IQR) Range (Min, Max) Mean (SD) Median (IQR) Range (Max, Min) Sign
Weight (kg) 49.30 (6.41) 48.50 (45.10, 53.10)a 35.50, 72.00 49.20 (6.61) 48.50 (44.60, 53.13)a 35.70, 74.00 0.092
BMI (kg/m2) 20.08 (2.36) 19.68 (18.53, 21.34)a 15.87, 29.91 20.04 (2.43) 19.64 (18.50, 21.48)a 15.57, 29.79 0.086
Diet Diversity Score (MDD-W) 2.63 (0.53) 2.50 (2.00, 3.00)a 1.00, 4.00 2.73 (0.55) 3.00 (2.00, 3.00)b 1.50, 4.50 0.014 ASFs Score 0.02 (0.12) 0.00 (0.00, 0.00)a 0.00, 1.00 0.16 (0.31) 0.00 (0.00, 0.00)b 0.00, 1.50 ≤0.001
Number of meals 2.84 (0.50) 3.00 (2.50, 3.00)a 1.00, 4.50 3.01 (0.27) 3.00 (3.00, 3.00)b 2.00, 4.50 ≤0.001 Number of cup of coffee 2.12 (1.96) 1.5 (0.00, 3.00)b 0.00, 9.00 1.76 (1.57) 1.5 (0.00, 3.00)a 0.00, 6.00 0.009
Data analysis using Wilcoxon Signed Ranks Test significant level at p < 0.05, a < b.
50
4. Discussion
This study assessed whether nutritional status and dietary pattern of lactating mothers were
different between Ethiopian Orthodox lent fasting and non-fasting periods. It also determined
factors associated with maternal underweight in rural Tigray, Northern Ethiopia.
4.1. Nutritional Status of Lactating Mothers
Adult stature is the collective outcome of the interaction between environment and inheritances,
over the critical growing period of a person [39]. Prior evidence has demonstrated that short
maternal height was associated with increased offspring mortality, underweight, and stunting in
infancy, childhood, and later in an adult age [39,40]. In our study, prevalence of maternal
stunting was 1.4%, which was less than previous findings in Ethiopia [5,9,10,41]. Shorter women
are believed to have reduced protein and energy stores, smaller size of their reproductive organs,
and smaller pelvis diameter. This may limit fetal development in the uterus, increases risk for
mother and child complication during delivery, and later infant growth through reduced breast
milk quantity and quality, resulting in stunted children. Thus, appropriate feeding behavior is
important for pregnant women health, and later for bearing healthier and well grown new born
babies. This finding suggests that health extension agents working in the rural communities
should advise mothers on appropriate feeding behavior during the pregnancy period.
The overall prevalence of maternal underweight in this study was between 32.6 and 33.6%. The
prevalence was lower than previous findings in Tigray region (34–55%), and Dedo and Seqa-
Chekorsa districts (41%), in South-west Ethiopia [9–12]. Conversely, the prevalence was higher
than in other studies in the Tigray and Oromia regions of Ethiopia [5,41–44]. The latter could be
related to climate phenomenon ‗El Nino‘, which caused the strongest famine in Ethiopia, where

51
the impact seriously affected Tigray region. It could also be related to differences in feeding
practices, study population, and period [45].
Shockingly, prevalence of underweight was 51% in fasting mothers compared with non-fasting
mothers (25%). The result was consistent with studies conducted on lactating mothers living in
the midland agro-ecology of Tigray region, which was 57% [12]. Similarly, the BMI was
significantly lower among fasting adults than non-fasting adults in Greek Orthodox Christians
[28]. This could be related to the almost 317 kcal difference between fasting and non-fasting
adults, in end-holy days of fasting periods [46].
In the present study, prevalence of overweight was between 1.1–3.8%, which was relatively
comparable with the Ethiopian Demographic and Health Survey (EDHS) 2011 report (2.9%) in
Tigray, and elsewhere (1.3–1.8%) in the region [5,24,38], but lower than the EDHS (2016) report
at national level (6%) and Tigray region (4.9%). In urban women, it was reported (6.2–25.3%) in
Ethiopia, Bengal district in India (5.4%), and Nepal (6.3–24.8%) [44,47–52]. This might be
because we attributed this finding to rural people [10], where most could engage in heavy
physical activities and walking over long distances to access services due to the mountainous
topography [53,54].
Mothers thirty years of age and younger were 1.7 times more likely to be underweight than those
above thirty. That conforms with other studies conducted in Ethiopia and Nepal, resulting in
higher prevalence of underweight in younger women [10,47]. In the current study, more than
27% of mothers fasted during their pregnancy period, and these mothers had 1.7 times more odds
to be underweight than not fasting during the same period. In a previous study, more than one-
third of mothers were fasting during their pregnancy period in Oromia region, Ethiopia [15].
Similarly, those mothers fasting during lactation period were 2.9 times more exposed to
52
underweight, than those who did not practice. Mothers who had children between the age of 13
and 18 months, were twice more likely to be underweight compared to those who had a child
aged 6–12 months. Similar result was observed in a study conducted by Haileslassie and his
colleagues in Northern Ethiopia [5]. This might be due to increased nutritional requirements of
the growing child, effort for child care in connection with food intake by the mother that is not
increased or even decreased.
Disease is one of the immediate causes of maternal and child undernutrition [1]. Mothers who
had any illness in the last four weeks preceding the survey were 3.6 times more frequently
underweight than healthy mothers. In a study conducted in the Limu area of Southern Ethiopia,
maternal sickness was positively associated with maternal underweight [55]. This could be
related to decreased food intake and absorption, alteration of metabolism, and increment in
nutritional requirements. Marital status of lactating mothers was not significantly associated with
maternal underweight. Prior evidence has also demonstrated that marital status was not
associated with Ethiopian women [56]. Otherwise, birth spacing has important implications for
the health and nutritional status of mothers and their children [57]. In our study, family planning
use was not associated with maternal underweight, which is inconsistent with the study
conducted in the Tena district of Oromia region, Ethiopia. In the latter, the prevalence of family
planning utilization was higher (65%) than our finding, which was 52% [58].
Good care during pregnancy is important for the health of the mother and development of the
unborn baby. The findings of this study indicated that a major proportion (91%) of mothers had
at least four ANC services during their pregnancy period, and were not significantly associated
with maternal underweight. This result was equal with the regional coverage of Tigray (91%),
but higher than the national prevalence (62%) [10]. The postnatal period is a critical phase in the
53
lives of a mother and the newborn baby. In this period, major changes occur, but it is the most
neglected time for the provision of quality services. As a result, the rates of provision of skilled
care are lower after childbirth when compared to rates before and during childbirth [59]. In this
study, prevalence of PNC coverage was 42.5%, which is comparable with previous findings in
Tigray region (45.4%); however, PNC attendance was not significantly associated with maternal
undernutrition. Household size was not significantly associated with maternal underweight in the
study. This coincides with studies in Southern Ethiopia and Tigray region [5,41,55]. However, it
was inconsistent with one study conducted in Nekemte town, Oromia region in Ethiopia [44].
The difference might be a higher proportion of lactating mothers who lived in rural households
with many family members, in our case. Grandfathers as a decision maker for the household
were associated with maternal underweight. This could be related to sharing the household
income to more family members or to the loss (death, departure) of the husband resulting in
lower working capacity and income, or due to most lactating mothers in grandfather headed
households being younger, which is associated with maternal underweight in our case. It has also
been reported that mothers who had more children, decreases the resources allocated including
food, resulting in underweight [60]. Access to safe drinking water, sanitation and hygiene
(WASH) services is a fundamental element of healthy communities and has an important
positive impact on child and maternal nutrition [61,62].
One-third of households included in this study, had non-improved water sources for household
consumption. The odds of being underweight for mothers from non-improved water sources
were 1.6 higher than those from households with improved water sources. This may be due to the
fact of frequent illness related to water borne diseases and contamination. Accordingly, child
undernutrition was associated with source of drinking water in Iraq and sub-Saharan Africa

54
[63,64]. In contrast, toilet presence in the household was not associated with maternal
underweight. This might apply to the majority of households included in the study, one of the
successes of the health extension program in Ethiopia. In our study, households not owning
chickens were 1.8 times more likely to have underweight mothers, than those who owned
chickens. Similarly, the proportion of mothers who ate more diversified foods were higher in
households which owned chicken, than those from households not owning chicken. Prior
research in Ethiopia, indicated that owning livestock in the household was associated with a
higher diet diversity score [65]. Studies in three East African countries also evidenced that, in
households owning livestock, the prevalence of child stunting was low [66]. Thus, promoting
chicken husbandry may also improve the low consumption of animal source foods, and the
diversity of food to be eaten at large. Among households involved in the study, more than a
quarter (32.5%) were at the lowest wealth tertile. According to the EDHS report, a lower
proportion of households (23%) was at the lowest wealth quantile [10]. Of thirty-four woreda‘s
in Tigray region, thirty-one were food insecure, including our study district [33]. The results
from the present study showed that more than two-thirds (71%) of households were food
insecure. Comparably, the prevalence of food insecurity was 76% in East Bedawacho district of
Southern Ethiopia [67]. However, the prevalence was lower than in a study conducted in two
agro-climatic zones in Sidama, Southern Ethiopia, which was 82% [68].
4.2. Dietary Patterns of Lactating Mothers
According to the essential nutrition action (ENA), mothers are recommended to take at least two
additional meals during their lactation period [69]. In the present study, nearly two-thirds of the
mothers (65.4%) did not change the food intake during their lactation period. This result is lower
than a study conducted in Samre district which reported (71%), but higher than findings in Raya
55
area (59%) of Tigray region. This could be related to the interval in the study periods and study
area [5,41].
Lactating mothers who ate more than three times a day were 9–12%. This result agreed with
findings in the Tigray, Oromia, and Southern regions in Ethiopia [11,41]. One-third of lactating
mothers ate less than three times on average of the two days preceding the survey during fasting
period, which is lower than the expected three meals to have in a day of a normal adult in real
context. Prior research in Samre district of Northern Ethiopia, showed that the proportion of
lactating mothers who had less than three meals in the last 24-h preceding their survey was 27%
[5], which is comparable with our findings. However, this prevalence reduced to 8.4% in the
non-fasting period, which is comparable with the prevalence (7.5%) of pregnant women in
Gambela town, Western Ethiopia [70]. Similarly, the number of meals eaten both by fasting and
non-fasting mothers were significantly increased after two months of fasting period. The latter
should be further studied for explanation.
Diet diversity is one important dimension of diet quality, and a proxy indicator for higher
micronutrient adequacy [36]. Majority of mothers had a diet diversity score of three and less in
the fasting period (92%) and non-fasting period (87%). This could indicate that dietary
micronutrient inadequacy is high in the study population. The median diet diversity score for
both sub-groups of fasting and non-fasting mothers, increased significantly in non-fasting period.
This was associated with higher consumption of ASFs and a higher frequency of meals in our
and related studies [65,71,72]. Thus, in the Ethiopian Orthodox fasting period, the feeding
practice of lactating mothers is sub-optimal. This finding suggests that nutrition education, which
will improve feeding practices should involve religious leaders in a sustainable manner. The
number of mothers who had consumed more cups of coffee was higher in the fasting than non-

56
fasting period, in the whole study population. Likewise, non-fasting mothers took significantly
more coffee in the fasting period than non-fasting. However, consuming more coffee during the
fasting period, where plant-based foods are the sole source of minerals, could reduce their
bioavailability, leading to increased risk for micronutrient deficiencies, especially of iron,
calcium, and zinc [73]. However, many fasting mothers consumed more cups of coffee in the
non-fasting than fasting period. This could be referred to some Ethiopian Orthodox religion
monarchist, who preached to followers not to consume coffee during fasting periods.
In this study, cereals, pulses, and other vegetables were the main food groups commonly
consumed by lactating mothers. This result agrees with previous studies in Ethiopia [65,71,74].
These plant foods usually contain dietary components that compromise digestion and inhibit
absorption of vital nutrients. For example, phytic acid chelates multivalent ions such as zinc,
calcium, and iron; therefore, their bioavailability reduced [75]. This finding suggests that
traditional processing techniques which can improve the bioavailability of minerals should be
promoted in the community.
Dark green, leafy vegetables are important plant sources of micronutrients like iron, calcium, and
vitamin A [76]. However, their consumption was very low in the non-fasting period, both in
fasting (5.6%) and non-fasting (2.8%) mothers. However, the result was lower than that
previously reported for Axum town (19%) in Northern Ethiopia. The discrepancy between these
two findings could be related to better market access, which is less in this study due to the rural
area. However, the number of non-fasting mothers who consumed dark green, leafy vegetables
was significantly higher in the fasting period than non-fasting period. This could be related to a
potential to choose and consume more diversified food, especially ASFs which were less
consumed in fasting period. Furthermore, almost all lactating mothers did not consume nuts and

57
seeds, fruits, and vitamin A rich fruits and vegetables food groups at all in both study periods,
because of a lack of cultivation on local farms and unavailability in the market [77]. Thus,
activities which can improve the dietary diversity including nuts and seeds, dark green leafy
vegetables, and vitamin A and C rich fruits consumption, as well as meal frequency are
inevitable. Moreover, the consumption of fruits which are rich in vitamin C should be taught to
improve the mineral bioavailability of plant foods, which are the predominate source of most
nutrients for a given community.
The proportion of lactating mothers who consumed ASFs was significantly lower in the fasting
than non-fasting period. In Northern Ethiopia, particularly in rural Tigray, most strict Ethiopian
Orthodox Christians abstain from eating animal source foods during the lent and other fasting
periods or days, including Wednesday and Friday. During these fasting periods, the demand for
cattle meat was observed to be low, resulting in closure of abattoirs or minimizing the service
provided [78]. A previous study, reported that more than 85% of butcher houses were closed in
Addis Ababa during Wednesday and Friday, which are Orthodox Christians fasting days of the
week [79].
This study has much strength and some limitations. It is the first study in Ethiopia, which
assessed the effect of religious fasting on maternal nutrition, particularly lactating mothers, who
need more nutrients than pregnant women. Moreover, the study was done in an area, where
almost all people were Ethiopian Orthodox Christians to minimize research bias. In addition, the
study had a longitudinal nature, which considered a large sample size, and two 24-h dietary recall
data for each study period. On top of these, this study also determined the differences in dietary
and nutritional status during fasting and non-fasting periods, for both fasting and non-fasting
mothers‘ sub-groups, separately. However, the study only considered the long Ethiopian
58
Orthodox lent fasting period out of the seven official fasting periods. This study did not measure
micronutrient levels or bio-markers in the blood, to assess micronutrient deficiencies reflecting
the consequences of qualitative malnutrition. Underweight only indicates energetic malnutrition,
representing the tip of the iceberg.
5. Conclusions
It has been found that the prevalence of underweight among fasting, lactating mothers during
Ethiopian Orthodox fasting periods is high and a serious public health problem in the district.
The dietary pattern [diet diversity and number of meals eaten] of lactating mothers is sub-
optimal, both in fasting and non-fasting periods. Cereals and pulses are the dominant food groups
eaten in the district, known to have a high amount of anti-nutrients like phytic acid, which limit
the bioavailability of minerals for absorption. Therefore, activities which will improve dietary
diversity including nuts and seeds, dark green leafy vegetables, and vitamin A and C rich fruits
consumption, as well as meal frequency are urgently needed. Additionally, consuming vitamin C
rich fruits and use of traditional processing techniques, which can improve the bioavailability of
minerals should be promoted. Furthermore, promoting chicken husbandry may also improve the
low consumption of animal source foods. Though moderate intake of coffee is beneficial,
consuming coffee closely to meals to be eaten will decrease the absorption of non-heme iron
from plant source foods and should be discouraged. Thus, households with younger mothers and
non-improved water sources should get priority in nutritional intervention. Generally, multi-
sectoral nutrition intervention strategies should include religious institutions to reduce maternal
malnutrition in Ethiopia. Otherwise, nutrition education activities will not lead to sustainable
improvements.

59
Author Contributions: B.B.D., C.L., S.R. and H.K.B. involved in research design; B.B.D.
conducted the research; B.B.D. analyzed the data; B.B.D. wrote the paper; B.B.D., C.L., S.R.,
T.N. and H.K.B. edited draft manuscript; the final content was the primary responsibility of
B.B.D. All authors read and approved the final manuscript.
Funding: This study was financially supported by German Federal Ministry for Economic
Cooperation and Development (BMZ).
Acknowledgments: We would like to thank data collectors, Genta Afeshum Woreda Health
Office Nutrition coordinator Gebretsadekane, and GIZ Nutrition Sensitive Agriculture project
staff specially Habteab and Muez, in Tigray region, Ethiopia.
Conflicts of Interest: The authors declare no conflict of interest.
6. References
1. Black, R.E.; Allen, L.H.; Bhutta, Z.A.; Caulfield, L.E.; De Onis, M.; Ezzati, M.; Mathers, C.;
Rivera, J.; Maternal and Child Undernutrition Study Group. Maternal and child
undernutrition: Global and regional exposures and health consequences. Lancet 2008, 371,
243–260. [CrossRef]
2. Caulfield, L.E.; De Onis, M.; Blössner, M.; Black, R.E. Undernutrition as an underlying
cause of child deaths associated. Am. J. Clin. Nutr. 2004, 80, 193–198. [CrossRef] [PubMed]
3. FAO; IFAD; UNICEF; WFP; WHO. The State of Food Security and Nutrition in the World;
FAO: Rome, Italy, 2017; p. 132.
4. Müller, O.; Krawinkel, M. Malnutrition and Health in Developing Countries. Can. Med.
Assoc. J. 2005, 173, 279–286. [CrossRef] [PubMed]
60
5. Haileslassie, K.A.; Mulugeta, M.; Girma, M. Feeding practices, nutritional status and
associated factors of lactating women in Samre Woreda, South Eastern Zone of Tigray,
Ethiopia. Nutr. J. 2013, 12, 28. [CrossRef] [PubMed]
6. Picciano, M.F. Dietary Supplement Use in Women: Current Status and Future Directions
Pregnancy and Lactation: Physiological Adjustments, Nutritional Requirements and the Role
of Dietary Supplements 1. J. Nutr. 2003, 133, 1997–2002. [CrossRef] [PubMed]
7. Weldehaweria, N.B.; Misgina, K.H.; Weldu, M.G.; Gebregiorgis, Y.S.; Gebrezgi, B.H.;
Zewdie, S.W.; Ngusse, H.A.; Gebrewa, H.G.; Alemu, W. Dietary diversity and related
factors among lactating women visiting public health facilities in Aksum town, Tigray,
Northern Ethiopia. BMC Nutr. 2016, 2, 38. [CrossRef]
8. WHO. The Global Prevalence of Anemia in 2011; World Health Organization: Geneva,
Switzerland, 2015; pp. 1–48.
9. Central Statistical Agency (CSA). Ethiopia Demographic and Health Survey 2011; Central
Statistical Agency: Addis Ababa, Ethiopia; ICF International Calverton: Calverton, MD,
USA, 2012; p. 452.
10. Central Statistical Agency (CSA). Ethiopia Demographic and Health Survey 2016; Central
Statistical Agency: Addis Ababa, Ethiopia; ICF International Calverton: Calverton, MD,
USA, 2017; p. 551.
11. Alemayehu, M.; Argaw, A.; Geberemariam, A. Factors Associated with Malnutrition among
Lactating Women in Subsistence Farming Households from Dedo and Seqa-Chekorsa
Districts, Jimma Zone, 2014. Dev. Ctry. Stud. 2015, 5, 114–122.

61
12. Roba, K.T.; O‘Connor, T.P.; Belachew, T.; O‘Brien, N.M. Seasonal variation in nutritional
status and anemia among lactating mothers in two agro-ecological zones of rural Ethiopia: A
longitudinal study. Nutrition 2015, 31, 1213–1218. [CrossRef] [PubMed]
13. Demissie, T.; Muroki, N.M.; Kogi-Makau, W. Food aversions and cravings during
pregnancy: Prevalence and significance for maternal nutrition in Ethiopia. Food Nutr. Bull.
1998, 19, 20–26. [CrossRef]
14. Meyer-Rochow, V.B. Food taboos: Their origins and purposes. J. Ethnobiol. Ethnomed.
2009, 5, 1–10. [CrossRef] [PubMed]
15. Zepro, N.B. Food Taboos and Misconceptions among Pregnant Women of Shashemene
District, Ethiopia, 2012. Sci. J. Public Health 2015, 3, 410–416. [CrossRef]
16. Zerfu, T.A.; Umeta, M.; Baye, K. Dietary habits, food taboos, and perceptions towards
weight gain during pregnancy in Arsi, rural central Ethiopia: A qualitative cross-sectional
study. J. Health Popul. Nutr. 2016, 35, 22. [CrossRef] [PubMed]
17. Hadush, Z.; Birhanu, Z.; Chaka, M.; Gebreyesus, H. Foods tabooed for pregnant women in
Abala district of Afar region, Ethiopia: An inductive qualitative study. BMC Nutr. 2017, 3,
40. [CrossRef]
18. Vasilevski, V.; Carolan-olah, M. Ethiopian pregnancy food taboos. J. Clin. Nurs. 2016, 25,
3069–3075. [CrossRef] [PubMed]
19. Knutsson, E.K.; Selinus, R. Fasting in Ethiopia: Anthropological and nutritional study. Am.
J. Clin. Nutr. 1970, 23, 956–969. [CrossRef] [PubMed]
20. Altuntas, Y.E.; Gezen, F.C.; Sahoniz, T.; Kement, M.; Aydin, H.; Sahin, F.; Okkabaz, N.;
Oncel, M. Ramadan fasting in patients with a stoma: A prospective study of quality of life
and nutritional status. Ostomy Wound Manag. 2013, 59, 26–32.
62
21. Almond, D.; Mazumder, B. Health Capital and the Prenatal Fasting during Pregnancy Health
Capital and the Prenatal Environment: The Effect of Maternal Fasting during Pregnancy;
Working paper 2007-22; Federal Reserve Bank of Chicago: Chicago, IL, USA, 2011; p. 74.
22. Awwad, J.; Usta, I.M.; Succar, J.; Musallam, K.M.; Ghazeeri, G.; Nassar, A.H. The effect of
maternal fasting during Ramadan on preterm delivery: A prospective cohort study. BJOG Int.
J. Obstet. Gynaecol. 2012, 119, 1379–1386. [CrossRef] [PubMed]
23. Faris, M.E.; Al-Holy, M.A. Implications of Ramadan intermittent fasting on maternal and
fetal health and nutritional status: A review. Med. J. Nutr. Metab. 2014, 7, 107–118.
24. Fayet-Moore, F.; Kim, J.; Sritharan, N.; Petocz, P. Impact of breakfast skipping and breakfast
choice on the nutrient intake and body mass index of Australian children. Nutrients 2016, 8,
487. [CrossRef] [PubMed]
25. Kiziltan, G.; Karabudak, E.; Tuncay, G.; Avsar, F.; Tuncay, P.; Mungan, O.; Meral, P.
Dietary intake and nutritional status of Turkish pregnant women during Ramadan. Saudi
Med. J. 2005, 26, 1782–1787. [PubMed]
26. Leiper, J.B.; Molla, A.M.; Molla, A.M. Effects on health of fluid restriction during fasting in
Ramadan. Eur. J. Clin. Nutr. 2003, 57, S30–S38. [CrossRef] [PubMed]
27. Rakicio ˘glu, N.; Samur, G.; Topçu, A.; Ayaz, T. The effect of Ramadan on maternal
nutrition and composition of breast milk. Pediatr. Int. 2006, 48, 278–283. [CrossRef]
[PubMed]
28. Sarri, K.O.; Tzanakis, N.E.; Linardakis, M.K.; Mamalakis, G.D.; Kafatos, A.G. Effects of
Greek orthodox christian church fasting on serum lipids and obesity. BMC Public Health
2003, 3, 16. [CrossRef] [PubMed]
63
29. Karle, C.S. Fasting among Orthodox Christians in Ethiopia: The Symbolic and Nutritional
Significance of the Fast for Reproductive Women. Bachelor‘s Thesis, Department of Public
Health, University of Copenhagen, Copenhagen, Denmark, 2017; p. 35.
30. EOTC/USAID. Patriarch of the Ethiopian Orthodox Tewahedo Church Endorses Nutrition
Sermon Guide Encouraging Better Nutrition for Mothers and Children; USAID: Addis
Ababa, Ethiopia, 2019; pp. 1–2.
31. Ludwig, C. Nutrition Baseline Survey-Ethiopia-For the Global Programme Food and
Nutrition Security and Enhanced Resilience; Bioversity International: Rome, Italy, 2017; p.
90.
32. Tigray Region Agriculture and Rural Development Bureau. Report on Food Security and
Nutrition Status of 31 Woreda‘s of the Region; Tigray Region Agriculture and Rural
Development Bureau: Mekele, Ethiopia, 2016.
33. WFP. Food Security and Vulnerability in Selected Towns of Tigray Region, Ethiopia:
Vulnerability Assessment and Mapping (VAM); WFP-Ethiopia: Addis Ababa, Ethiopia,
2009; p. 52. Available online: http://documents.wfp.
org/stellent/groups/public/documents/ena/wfp221389.pdf?iframe [accessed on 24 January
2018].
34. FDRE Disaster Risk Management and Food Security Sector [FDRE/DRMFSS]. Woreda
Disaster Risk Profile (WDRP); Tigray region; Food Security Sector: Addis Ababa, Ethiopia,
2015; p. 276.
35. Coates, J.F.; Swindale, A.; Bilinsky, P. Household Food Insecurity Access Scale (HFIAS) for
Measurement of Household Food Access: Indicator Guide (v. 3); Food and Nutrition
64
Technical Assistance Project; Academy for Educational Development: Washington DC,
USA, 2007; p. 36.
36. FAO and FHI 360. Minimum Dietary Diversity for Women a Guide to Measurement; FAO:
Rome, Italy, 2016; p. 82.
37. Abate, K.H.; Belachew, T. Women‘s autonomy and men‘s involvement in child care and
feeding as predictors of infant and young child anthropometric indices in coffee farming
households of Jimma Zone, South West of Ethiopia. PLoS ONE 2017, 12, e0172885.
[CrossRef] [PubMed]
38. Cogill, B. Anthropometric Indicators Measurement Guide; Food and Nutrition Technical
Assistance [FANTA] Project; FHI: Washington, DC, USA, 2003; p. 93.
39. 39. Addo, O.Y.; Stein, A.D.; Fall, C.H.; Gigante, D.P.; Guntupalli, A.M.; Horta, B.L.;
Kuzawa, C.W.; Lee, N.; Norris, S.A.; Prabhakaran, P.; et al. Maternal height and child
growth patterns. J. Pediatr. 2013, 163, 549–554. [CrossRef] [PubMed]
40. Özaltin, E.; Hill, K.; Subramanian, S.V. Association of Maternal Stature with Offspring
Mortality, Underweight, and Stunting in Low- to Middle-Income Countries. JAMA 2010,
303, 1507–1516. [CrossRef] [PubMed]
41. Sitotaw, I.K.; Kiday, H.; Adama, Y. Comparison of nutritional status and associated factors
of lactating women between lowland and highland communities of District Raya, Alamata.
BMC Nutr. 2017, 3, 61. [CrossRef]
42. Biru, K.; Jima, A.; Abeya, S. Prevalence of Chronic Energy Malnutrition and Maternal
Health Service Utilizations among Lactating Mothers in Adama District, Oromia Region,
Eastern Ethiopia. J. Food Process. Technol. 2017, 8, 1–5.
65
43. Hailu, C.; Dejene, T.; Tebeje, B. Prevalence and Socio-Demographic/Economic Risk Factors
of Low and High Body Mass Index of Urban versus Rural Pregnant Women at Booking for
Antenatal Care in Governmental Health Centers of Jimma Zone, Southwest Ethiopia. Open
Access Libr. J. 2015, 2, e1672.
44. Hundera, T.D.; Gemede, H.F.; Wirtu, D.; Kenie, D.N. Nutritional Status and Associated
Factors among Lactating Mothers in Nekemte Referral Hospital and Health Centers,
Ethiopia. Food Sci. Qual. Manag. 2015, 35, 64–72. [CrossRef]
45. Food and Agriculture Organization of the United Nations (FAO). FAO in Ethiopia, El Niño
Response Plan; FAO: Rome, Italy, 2016.
46. Sarri, K.O.; Linardakis, M.K.; Bervanaki, F.N.; Tzanakis, N.E.; Kafatos, A.G. Greek
Orthodox fasting rituals: A hidden characteristic of the Mediterranean diet of Crete. Br. J.
Nutr. 2004, 92, 277–284. [CrossRef] [PubMed]
47. Bhandari, S.; Sayami, J.T.; Thapa, P.; Sayami, M.; Kandel, B.P.; Banjara, M.R. Dietary
intake patterns and nutritional status of women of reproductive age in Nepal: Findings from a
health survey. Arch. Public Health 2016, 74, 1–11. [CrossRef] [PubMed]
48. Awoke, A.; Awoke, T.; Alemu, S.; Megabiaw, B. Prevalence and associated factors of
hypertension among adults in Gondar, Northwest Ethiopia: A community based cross-
sectional study. BMC Cardiovasc. Disord. 2012, 12, 113. [CrossRef] [PubMed]
49. Abrha, S.; Shiferaw, S.; Ahmed, K.Y. Overweight and obesity and its socio-demographic
correlates among urban Ethiopian women: Evidence from the 2011 EDHS. BMC Public
Health 2016, 16, 636. [CrossRef] [PubMed]
66
50. Gali, N.; Tamiru, D.; Tamrat, M. The Emerging Nutritional Problems of School Adolescents:
Overweight/Obesity and Associated Factors in Jimma Town, Ethiopia. J. Pediatr. Nurs. 2017,
35, 98–104. [CrossRef] [PubMed]
51. Tigga, P.L.; Sen, J. Maternal Body Mass Index Is Strongly Associated with Children Z-
Scores for Height and BMI. J. Anthropol. 2016, 2016, 10. [CrossRef]
52. Tebekaw, Y.; Teller, C.; Colón-Ramos, U. The burden of underweight and overweight
among women in Addis Ababa, Ethiopia. BMC Public Health 2014, 14, 1126. [CrossRef]
[PubMed]
53. Alemu, E.; Atnafu, A. Prevalence of Overweight and/or Obesity and Associated Factors
among High School Adolescents in Arada Sub city, Addis Ababa, Ethiopia. J. Nutr. Food
Sci. 2014, 4, 2. [CrossRef]
54. Anteneh, Z.A.; Gedefaw, M.; Tekletsadek, K.N.; Tsegaye, M.; Alemu, D. Risk Factors of
Overweight and Obesity among High School Students in Bahir Dar City, North West
Ethiopia: School Based Cross-Sectional Study. Adv. Prev. Med. 2015, 2015, 294902.
[CrossRef] [PubMed]
55. Demissie, T.; Mekonen, Y.; Haider, J. Agroecological Comparison of Levels and Correlates
of Nutritional Status of Women. Ethiopian. Ethiop. J. Heal. Dev. 2003, 17, 189–196.
56. Bitew, F.H.; Telake, D.S. Undernutrition among Women in Ethiopia: Rural-Urban Disparity;
DHS Working Papers No. 77; ICF Macro: Calverton, MD, USA, 2010.
57. Naik, R.; Smith, R. Linkages between Family Planning and Nutrition. Futures Group; Health
Policy Project: Washington, DC, USA, 2015.
58. Tafa, M.; Haidar, J.; Fekadu, H. Modern Family Planning Use and its Relationship with the
Nutritional Status of Women of Child Bearing Age at Tena District, Arsi Zone Oromia

67
Regional State, Ethiopia 2013: A Community based Case Control Study. Gynecol. Obstet.
2015, 5, 3.
59. World Health Organization (WHO). WHO Recommendations on Postnatal Care of the
Mother and Newborn 2013; WHO: Geneva, Switzerland, 2014; pp. 1–72.
60. Wu, X.; Li, L. Family size and maternal health: Evidence from the One-Child policy in
China. J. Popul. Econ. 2012, 25, 1341–1364. [CrossRef]
61. Cunningham, K.; Headey, D.; Singh, A.; Karmacharya, C.; Rana, P. Maternal and Child
Nutrition in Nepal: Examining drivers of progress from the mid-1990s to 2010s. Glob. Food
Secur. 2017, 13, 30–37. [CrossRef]
62. World Health Organizaton (WHO). Improving Nutrition Outcomes with Better Water,
Sanitation and Hygiene: Practical Solutions for Policies and Programmers; World Health
Organization: Geneva, Switzerland, 2015.
63. Akombi, B.J.; Agho, K.E.; Hall, J.J.; Wali, N.; Renzaho, A.M.N.; Merom, D. Stunting,
wasting and underweight in Sub-Saharan Africa: A systematic review. Int. J. Environ. Res.
Public Health 2017, 14, 863. [CrossRef] [PubMed]
64. Hasanain, F.G.; Jamsiah, M.; Zaleha, M.I.; Tamil, A.M.; Mohammed, A.A. Association
between drinking water sources and diarrhea with malnutrition among kindergarten‘s
children in Baghdad city, Iraq. Malays. J. Public Health Med. 2012, 12, 45–48.
65. Workicho, A.; Belachew, T.; Feyissa, G.T.; Wondafrash, B.; Lachat, C.; Verstraeten, R.;
Kolsteren, P. Household dietary diversity and Animal Source Food consumption in Ethiopia:
Evidence from the 2011 Welfare Monitoring Survey. BMC Public Health 2016, 16, 1192.
[CrossRef] [PubMed]

68
66. Mosites, E.M.; Rabinowitz, P.M.; Thumbi, S.M.; Montgomery, J.M. The Relationship
between Livestock Ownership and Child Stunting in Three Countries in Eastern Africa Using
National Survey Data. PLoS ONE 2015, 10, e0136686. [CrossRef] [PubMed]
67. Betebo, B.; Ejajo, T.; Alemseged, F.; Massa, D. Household Food Insecurity and Its
Association with Nutritional Status of Children 6—59 Months of Age in East Badawacho
District, South Ethiopia. J. Environ. Public Health 2017, 2017, 6373595. [CrossRef]
[PubMed]
68. Regassa, N.; Stoecker, B.J. Household food insecurity and hunger among households in
Sidama district, southern Ethiopia. Public Health Nutr. 2012, 157, 1276–1283. [CrossRef]
[PubMed]
69. Essential Nutrition Action (ENA). Key Behaviours for Optimal Breastfeeding,
Complementary Feeding and Maternal Nutrition at Critical Stages in the Life Cycle of
Women and Children; ENA Counselor‘s guide—LINKAGES Project; World Health
Organization: Geneva, Switzerland, 2008.
70. Nigatu, M.; Gebrehiwot, T.T.; Gemeda, D.H. Household Food Insecurity, Low Dietary
Diversity, and Early Marriage Were Predictors for Undernutrition among Pregnant Women
Residing in Gambella, Ethiopia. Adv. Public Health 2018, 2018, 1350195. [CrossRef]
[PubMed]
71. Mekuria, G.; Wubneh, Y.; Tewabe, T. Household dietary diversity and associated factors
among residents of finote selam town, north west Ethiopia: A cross sectional study. BMC
Nutr. 2017, 3, 28. [CrossRef]
69
72. Schwei, R.J.; Tesfay, H.; Asfaw, F.; Jogo, W.; Busse, H. Household dietary diversity,
vitamin A consumption and food security in rural Tigray, Ethiopia. Public Health Nutr. 2017,
20, 1540–1547. [CrossRef] [PubMed]
73. Gebremedhin, S.; Enquselassie, F.; Umeta, M. Prevalence of prenatal zinc deficiency and its
association with socio-demographic, dietary and health care related factors in Rural Sidama,
Southern Ethiopia: A cross-sectional study. BMC Public Health 2011, 11, 898. [CrossRef]
[PubMed]
74. Ethiopian Public Health Institute (EPHI). Ethiopian National Food Consumption Survey;
EPHI: Addis Ababa, Ethiopia, 2013.
75. Schlemmer, U.; Frølich, W.; Prieto, R.M.; Grases, F. Phytate in foods and significance for
humans: Food sources, intake, processing, bioavailability, protective role and analysis. Mol.
Nutr. Food Res. 2009, 53, S330–S375. [CrossRef] [PubMed]
76. Amagloh, F.K.; Atuna, R.A.; Richard McBride, R.; Edward Ewing Carey, E.E.; Christides,
T. Nutrient and Total Polyphenol Contents of Dark Green Leafy Vegetables, and Estimation
of Their Iron Bioaccessibility Using the In-Vitro Digestion/Caco-2 Cell Model. Foods 2017,
6, 54. [CrossRef] [PubMed]
77. Demissie, T.; Ali, A.; Zerfu, D. Availability and consumption of fruits and vegetables in nine
regions of Ethiopia with special emphasis to vitamin A deficiency. Ethiop. J. Health Dev.
2009, 23, 216–222. [CrossRef]
78. Tewodros, D. Beef Cattle Production System and Opportunities for Market Orientation in
Borena Zone, Southern Ethiopia. Master‘s Thesis, Haromaya University, Dire Dawa,
Ethiopia, 2008.
70
79. Avery, A. Red Meat and Poultry Production and Consumption in Ethiopia and Distribution in
Addis Ababa; Borlaug-Ruan World Food Prize Intern, International Livestock Research
Institute: Addis Ababa, Ethiopia, 2004.

71
Chapter 3
Paper II
72
3. Feeding Practices and Undernutrition in 6–23-Month-Old Children of
Orthodox Christian Mothers in Rural Tigray, Ethiopia: Longitudinal Study
Beruk Berhanu Desalegn1,2,*
, Christine Lambert2, Simon Riedel
2, Tegene Negese
1 and Hans
Konrad Biesalski2
1College of Agriculture, Hawassa University, Postal code: 05, Hawassa, Ethiopia;
2Institute of Biological Chemistry and Nutrition, University of Hohenheim, Garbenstr. 30, 70593
Stuttgart, Germany; [email protected] (C.L.); simon.riedel@uni-
hohenheim.de (S.R.); [email protected] (H.K.B.)
* Correspondence: [email protected] Tel.: +251-941-048-918
A version of this chapter has been published as
Desalegn, B., Lambert, C., Riedel, S., Negese, T., Biesalski, H.K. (2019). Feeding Practices and
Undernutrition in 6–23-Month-Old Children of Orthodox Christian Mothers in Rural Tigray,
Ethiopia: Longitudinal Study. Nutrients, 11(138). doi:10.3390/nu11010138.
73
Feeding Practices and Undernutrition in 6–23-Month-Old Children
of Orthodox Christian Mothers in Rural Tigray, Ethiopia:
Longitudinal Study
Abstract
Fasting period and fasting status affect the feeding practices and nutritional status of Ethiopian
Orthodox mothers. Even if children are exempted from fasting, some mothers do not prepare
their food from animal sources as it could contaminate utensils for cooking family foods.
Therefore, the objective of this study was to assess feeding practices and undernutrition in 6–23-
months old children whose mothers are Ethiopian Orthodox religion followers during lent fasting
and non-fasting periods in rural Tigray, Northern Ethiopia, and to identify associated factors. A
community-based longitudinal study was carried out in Ethiopian Orthodox lent fasting and non-
fasting periods. Using a multi-stage systematic random sampling technique, 567 and 505 children
aged 6–23 months old participated in the fasting and non-fasting assessments, respectively.
Statistical analyses were done using logistic regression, an independent sample t-test, Wilcoxon
signed-rank (WSRT) and McNemar‘s tests. The prevalences of stunting, underweight and
wasting were 31.6–33.7%, 11.7–15.7% and 4.4–4.8%, respectively. The weight-for-length
(WLZ) and length-for-age (LAZ) values for children of fasting mothers were significantly lower
(p < 0.05) compared to those of non-fasting mothers. Likewise, the median weight-for-age
(WAZ) and diet diversity score (DDS) of children of fasting mothers were also significantly
higher in non-fasting than in fasting periods. A small proportion of children (2.3–6.7%) met the
minimum acceptable diet (MAD) in the study population, but these measures were significantly
increased (p < 0.001) in the children of non-fasting mothers. Mother‘s fasting during lactation
period of the indexed child was amongst the independent factors common in child stunting,
74
underweight and wasting. Nutritional status and feeding practices of 6–23-month-old children are
affected by maternal fasting during the fasting period. Therefore, without involvement of
religious institutions in the existing nutritional activities, reduction of undernutrition would not
be successful and sustainable.
Keywords: stunting; wasting; undernutrition; minimum acceptable diet; minimum diet diversity;
Tigray; Orthodox fasting; Ethiopia
3.1. Introduction
Despite the efforts undertaken globally, little has been achieved in reducing undernutrition with a
sizeable gap from the global targets and goals still to fill. Worldwide, the number of stunted and
wasted children under five years of age were about 154.8 and 52 million, respectively, in 2016,
while more than 40 million children are overweight [1]. About 38%, 27% and 24% of stunted,
wasted and overweight children under five years of age, respectively, were from Africa. Even
worse, the number of stunted and overweight children increased by 9 and 9.8 million,
respectively, between 2000 and 2016 [1]. The long-term impact of malnutrition on people‘s lives,
most notably in health, education, and productivity, highly affects the human capital of a country.
For example, an estimated loss of 4.7 billion US$ (equivalent to 16.5% of the national GDP) was
recorded in 2009 due to child undernutrition in Ethiopia [2]. Therefore, the government of
Ethiopia has been following different approaches to reduce maternal and childhood
undernutrition significantly. Recently, the ―Seqota‖ Declaration [2015–2030] was launched with
the goal of eliminating all forms of malnutrition among children under age 2 by 2030 [3].
However, this cannot be achieved unless the socio-cultural and religious issues related with
75
feeding practices are deeply investigated and addressed in Ethiopia, where more than 85 ethnic
groups with diversified religious practices exist. As these practices have been passed from one
generation to the next generation, they might have resulted in an intergenerational cycle of
malnutrition. This could be worse in physiologically nutrient needy groups like pregnant and
lactating mothers, and young and growing children.
Previous studies in Ethiopia and other parts of the world showed that maternal nutritional status
and feeding practices are associated with growth indices of their children [4–8]. A more recent
study by Desalegn and colleagues showed that maternal Body Mass Index (BMI) and dietary
pattern of lactating mothers were negatively affected by maternal fasting status, and during
Ethiopian Orthodox lent fasting period regardless of fasting status in rural Ethiopia [9]. Even if
children are exempted from fasting, some mothers said that they were not happy to prepare food
for them from animal sources as it could contaminate utensils for cooking family food [10].
Furthermore, a study on 6–23-month-old children of Ethiopian Orthodox mothers from the
Gojam district also showed that mothers/caregivers who did not feed a diet containing animal
products to their children due to fear of utensil contamination for family food preparation were
less likely to feed the recommended dietary diversity. Economic limitations were a minor reason
[11]. However, to the best of our knowledge, the effect of maternal fasting status and feeding
practices on the nutritional status of the children and how these differ between fasting and non-
fasting periods are not known. Therefore, the purpose of this study was to assess and compare the
feeding practices and nutritional status of 6–23-month-old children of fasting and non-fasting
lactating mothers during Ethiopian Orthodox lent fasting and non-fasting periods in rural Tigray
of Ethiopia, where the majority are Orthodox religion followers.
76
3.2. Materials and Methods
3.2.1. Study Area, Design, Participants and Sampling
A longitudinal community-based survey was conducted in lent fasting (15 February–15 April
2017) and non-fasting (1–30 May 2017) periods in rural Genta Afeshum woreda (the third-level
administrative division in Ethiopia), in rural Tigray, Ethiopia. The district is one of the hot spot
areas of food insecurity and has a total population of 99,112 and 19 health posts to serve the
community. Almost all people in the woreda belong to the ethnic group of Tigray and are
followers of Ethiopian Orthodox Christianity.
For this study, the sample size was calculated using a single population proportion formula and
considering the prevalence of stunting (57.1%) elsewhere in Tigray region [12], 95% of
confidence interval for true prevalence and a relative precision (d) of 5%. The total population of
children aged between 6–23 months old in the district was 4906, so that the finite source
population size correction formula was used. Additionally, a 1.5 design effect and 10% non-
response rate was used in the calculated sample size so as to get the final sample size of 575.
To obtain representative samples, multi-stage systematic random sampling was used. First, of the
three woredas where the Deutsche Gesellschaft für Internationale Zusammenarbeit (GIZ, Bonn,
Germany) are implementing a nutrition sensitive agriculture (NSA) project in Ethiopia, Genta
Afeshum was randomly selected. Then, seven kebeles (smallest administrative unit in Ethiopia)
were selected randomly out of the twenty kebeles residing in the woreda. Children who were
aged between 6–23 months, apparently healthy and breastfeeding during the study periods, were
included, whereas children who were twins and whose mothers were not permanent residents of
the study area during the study period were excluded from the study. Based on these, the list of
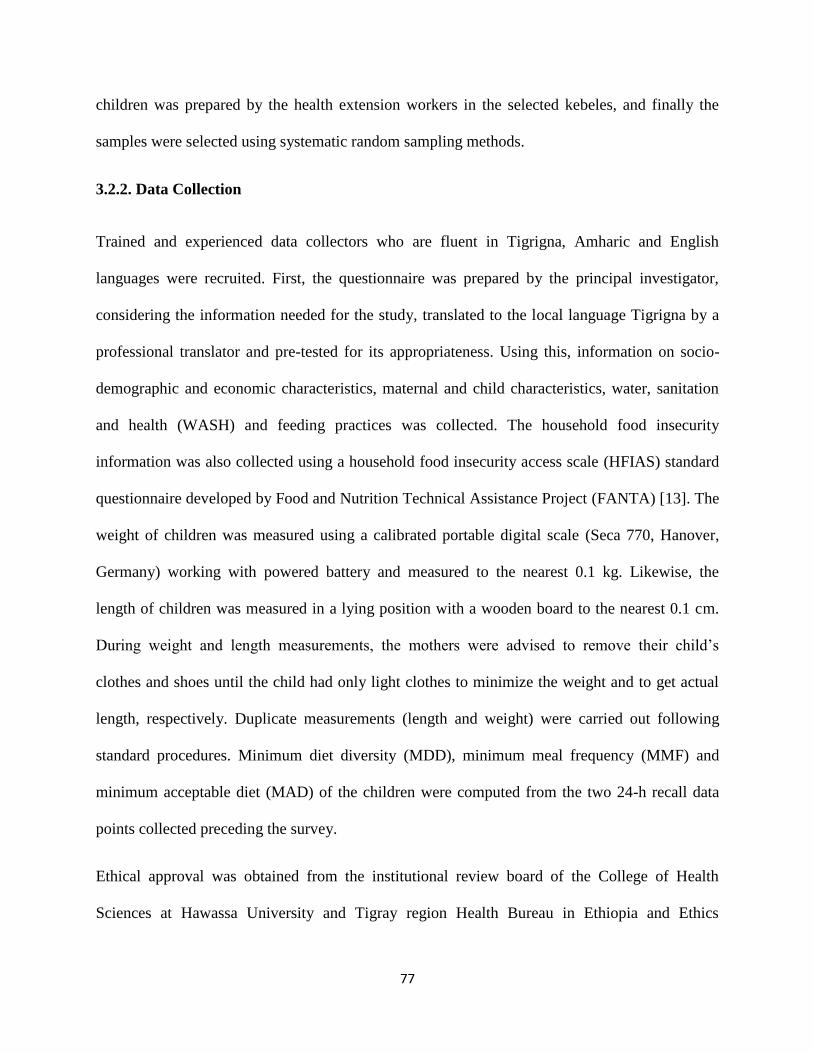
77
children was prepared by the health extension workers in the selected kebeles, and finally the
samples were selected using systematic random sampling methods.
3.2.2. Data Collection
Trained and experienced data collectors who are fluent in Tigrigna, Amharic and English
languages were recruited. First, the questionnaire was prepared by the principal investigator,
considering the information needed for the study, translated to the local language Tigrigna by a
professional translator and pre-tested for its appropriateness. Using this, information on socio-
demographic and economic characteristics, maternal and child characteristics, water, sanitation
and health (WASH) and feeding practices was collected. The household food insecurity
information was also collected using a household food insecurity access scale (HFIAS) standard
questionnaire developed by Food and Nutrition Technical Assistance Project (FANTA) [13]. The
weight of children was measured using a calibrated portable digital scale (Seca 770, Hanover,
Germany) working with powered battery and measured to the nearest 0.1 kg. Likewise, the
length of children was measured in a lying position with a wooden board to the nearest 0.1 cm.
During weight and length measurements, the mothers were advised to remove their child‘s
clothes and shoes until the child had only light clothes to minimize the weight and to get actual
length, respectively. Duplicate measurements (length and weight) were carried out following
standard procedures. Minimum diet diversity (MDD), minimum meal frequency (MMF) and
minimum acceptable diet (MAD) of the children were computed from the two 24-h recall data
points collected preceding the survey.
Ethical approval was obtained from the institutional review board of the College of Health
Sciences at Hawassa University and Tigray region Health Bureau in Ethiopia and Ethics

78
Commission, Landesärztekammer Baden-Württemberg, Germany. Permission was also obtained
from the Genta Afeshum woreda Health Office in the Tigray Province of Ethiopia. Additionally,
the purpose of the study and the confidentiality of the information to be collected were explained
to the mothers, and their agreement to participate with their indexed child in the study was
documented by signing the informed consent. Each participating mother was also told that
whenever the mothers felt they wanted to discontinue the participation with their child,
withdrawal from the study was possible.
3.2.3. Data Management and Analysis
Before submitting the data, variable coding was conducted in SPSS for window version 20 (IBM
Corporation, Armonk, NY, USA). Following this, the data were entered, cleaned and analyzed.
First, frequency and crosstab were conducted to check completeness of data and to present the
results in descriptive statistics (frequency and percent).
In our case, the diet diversity score was calculated as the summation of the number of food
groups consumed for each of the two days, and averaged. Seven food groups were created, which
included: grains, roots and tubers; legumes and nuts; dairy products; flesh foods; eggs; vitamin
A-rich fruits and vegetables; and other fruits and vegetables. Likewise, meal frequency was
computed as sum of the number of solid, semi-solid, or soft foods eaten by the child within 24-h
for each of the two days, and averaged. A child who ate an average of at least four food groups in
their meals of the two days fulfilled MDD. In breastfed children, the MMF was two times if aged
6–8 months and three times for 9–23 months. If a child fulfilled both the criteria for MDD and
MMF, then he/she was considered as having met MAD.
79
The nutritional status (stunting, underweight and wasting) was identified using length-for-age,
weight-for-age, and weight-for-length Z scores and compared with WHO reference data. For
this, the length, weight, age and sex data of the children were entered in WHO Anthro software
version 3.2.2 (World Health Organization, Geneva, Switzerland). A child who was below -2
standard deviations (-2SD) for WAZ, WLZ or LAZ was considered as stunted, wasted or
underweight, respectively.
First, potential predicting variables for the outcome variables (stunting, underweight and
wasting) were assessed from previous studies and included in bivariate analysis, and those with
p-value < 0.25 were selected for multivariate logistic regression. Then, multi-collinearity was
checked between the candidate variables separately for the three outcome variables using a
variance inflation factor (VIF), and all were less than 10. Then, the candidate variables were
entered in a multivariate logistic regression model with the stepwise forward Wald method. A p-
value < 0.05 was used to declare the variables as predictors of the outcome variables. Hosmer
and Lemeshow test and C-statistics (Area under the curve (AUC)) were used for model tests and
were verified. Normality of continuous data was checked using the Kolmogorov-Smirnov test.
An independent sample t-test was used to identify the difference between the children of fasting
and non-fasting mothers‘ LAZ, WLZ and WAZ score values during the lent fasting period. Non-
normally distributed data were analyzed using the Wilcoxon signed-rank test, whereas
dichotomous data were analyzed by McNemar‘s test to identify the difference between children
of fasting and non-fasting mothers‘ sub-groups dietary patterns between fasting and non-fasting
periods.

80
3.3. Results
A survey was conducted with 567 children during Ethiopian Orthodox lent fasting with a
response rate of 98.6%. Of those children who participated in the lent fasting survey, 505 were
again involved in the non-fasting period, with a response rate of 87.8%. The reasons for
excluding some children of the non-fasting period for the follow-up study were that some were
older than 23 months or migrated with their family to other areas or were absent during the 2nd
round survey.
3.3.1. Socio-Demographic Characteristics
In this study, almost all children belong to mothers who were from Ethiopian Orthodox
Christians. Most of the mothers were house-wives, and more than half of the mothers were
literate.
Table 3.1 Socio-demographic and economic characteristics of the study participants (n = 567) in
rural Tigray, Northern Ethiopia (February–June, 2017).
Characteristics (n = 567) Number Percent
Religion of mother Orthodox 565 99.6
Other 2 0.4
Mother fasting during pregnancy period of indexed child Yes 156 27.5
Mother fasting during lactation period of indexed child Yes 176 31.0
Mother‘s education Literate 369 65.1
Mother‘s occupation Housewives 449 79.2
Farmer 80 14.1
Other 38 6.7
Family size ≤5 218 38.4
Household food security status Food secure 166 29.3
Household toilet presence Yes 455 80.2
81
About one-third of the mothers included in the study were fasting while they were pregnant and
lactating. Only about one-third of 6–23-month-old children were from food secured and small
family size households (HH) although most of them were from HH that owned toilets (Table
3.1).
3.3.2. Nutritional Status and Consumption Pattern
Almost all children included in this study consumed colostrum during the first few days after
birth. More children were stunted (31.6–33.7%) than underweight (11.7–15.7%) and wasted
(4.4–4.8%) in the study. Consumption of grains, roots and tubers, legumes and nuts, and fruits
and vegetable foods was lower in children born of fasting than non-fasting mothers, both in
fasting and non-fasting periods. Likewise, the proportion of 6–23-month-old children of non-
fasting mothers who consumed dairy products, and food groups containing egg was higher
compared to children of fasting mothers, both in fasting and non-fasting periods. Additionally,
the proportion of 6–23-month-old children who consumed meat and vitamin A-rich fruits and
vegetables was higher during non-fasting than fasting periods. Moreover, a lower proportion of
6–23-month-old children fulfilled the MMF, MDD and MAD standards during fasting (74.3%,
2.5% and 2.3%) than during non-fasting periods (75.0%, 6.9% and 6.7%), respectively (Table
3.2).
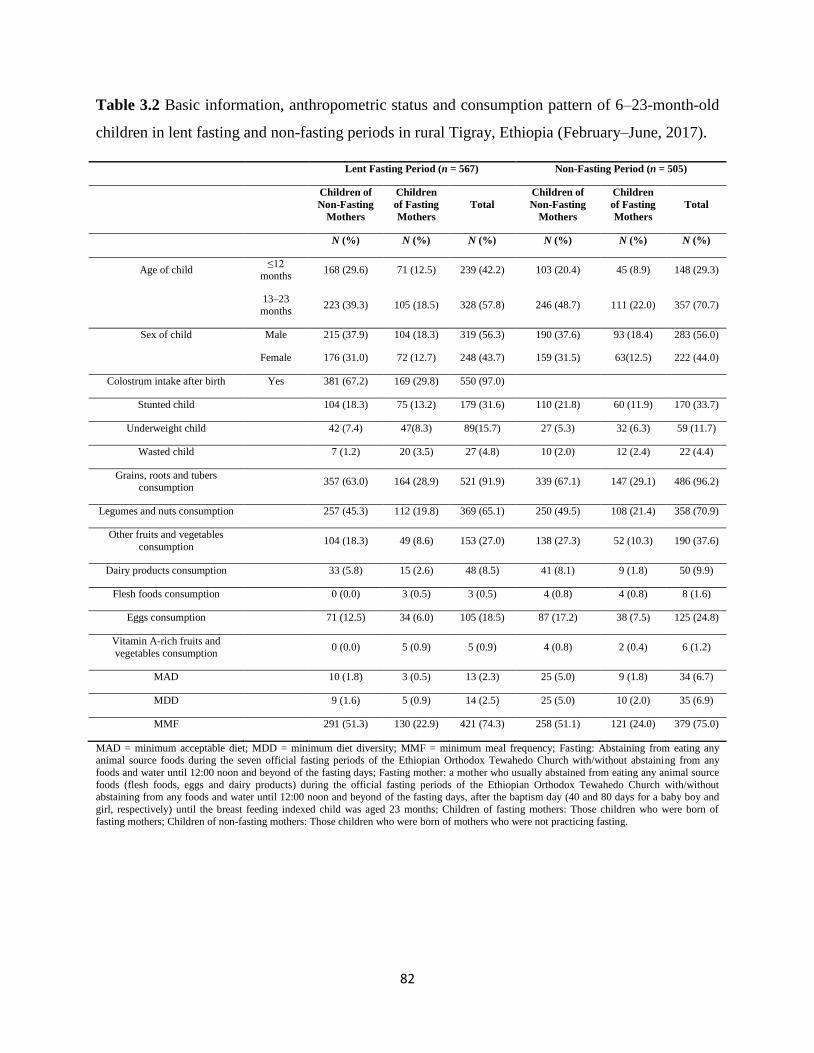
82
Table 3.2 Basic information, anthropometric status and consumption pattern of 6–23-month-old
children in lent fasting and non-fasting periods in rural Tigray, Ethiopia (February–June, 2017).
Lent Fasting Period (n = 567) Non-Fasting Period (n = 505)
Children of
Non-Fasting
Mothers
Children
of Fasting
Mothers
Total
Children of
Non-Fasting
Mothers
Children
of Fasting
Mothers
Total
N (%) N (%) N (%) N (%) N (%) N (%)
Age of child ≤12
months 168 (29.6) 71 (12.5) 239 (42.2) 103 (20.4) 45 (8.9) 148 (29.3)
13–23 months
223 (39.3) 105 (18.5) 328 (57.8) 246 (48.7) 111 (22.0) 357 (70.7)
Sex of child Male 215 (37.9) 104 (18.3) 319 (56.3) 190 (37.6) 93 (18.4) 283 (56.0)
Female 176 (31.0) 72 (12.7) 248 (43.7) 159 (31.5) 63(12.5) 222 (44.0)
Colostrum intake after birth Yes 381 (67.2) 169 (29.8) 550 (97.0)
Stunted child 104 (18.3) 75 (13.2) 179 (31.6) 110 (21.8) 60 (11.9) 170 (33.7)
Underweight child 42 (7.4) 47(8.3) 89(15.7) 27 (5.3) 32 (6.3) 59 (11.7)
Wasted child 7 (1.2) 20 (3.5) 27 (4.8) 10 (2.0) 12 (2.4) 22 (4.4)
Grains, roots and tubers consumption
357 (63.0) 164 (28.9) 521 (91.9) 339 (67.1) 147 (29.1) 486 (96.2)
Legumes and nuts consumption 257 (45.3) 112 (19.8) 369 (65.1) 250 (49.5) 108 (21.4) 358 (70.9)
Other fruits and vegetables
consumption 104 (18.3) 49 (8.6) 153 (27.0) 138 (27.3) 52 (10.3) 190 (37.6)
Dairy products consumption 33 (5.8) 15 (2.6) 48 (8.5) 41 (8.1) 9 (1.8) 50 (9.9)
Flesh foods consumption 0 (0.0) 3 (0.5) 3 (0.5) 4 (0.8) 4 (0.8) 8 (1.6)
Eggs consumption 71 (12.5) 34 (6.0) 105 (18.5) 87 (17.2) 38 (7.5) 125 (24.8)
Vitamin A-rich fruits and
vegetables consumption 0 (0.0) 5 (0.9) 5 (0.9) 4 (0.8) 2 (0.4) 6 (1.2)
MAD 10 (1.8) 3 (0.5) 13 (2.3) 25 (5.0) 9 (1.8) 34 (6.7)
MDD 9 (1.6) 5 (0.9) 14 (2.5) 25 (5.0) 10 (2.0) 35 (6.9)
MMF 291 (51.3) 130 (22.9) 421 (74.3) 258 (51.1) 121 (24.0) 379 (75.0)
MAD = minimum acceptable diet; MDD = minimum diet diversity; MMF = minimum meal frequency; Fasting: Abstaining from eating any animal source foods during the seven official fasting periods of the Ethiopian Orthodox Tewahedo Church with/without abstaining from any
foods and water until 12:00 noon and beyond of the fasting days; Fasting mother: a mother who usually abstained from eating any animal source
foods (flesh foods, eggs and dairy products) during the official fasting periods of the Ethiopian Orthodox Tewahedo Church with/without abstaining from any foods and water until 12:00 noon and beyond of the fasting days, after the baptism day (40 and 80 days for a baby boy and
girl, respectively) until the breast feeding indexed child was aged 23 months; Children of fasting mothers: Those children who were born of
fasting mothers; Children of non-fasting mothers: Those children who were born of mothers who were not practicing fasting.
83
3.3.3. Factors Associated with Child Undernutrition
Children between 13–23 months of age were about 1.8 times more likely to be underweight than
those who were between 6–12 months (AOR = 1.79 (1.07, 3.0)). Children who were born of
mothers fasting during their pregnancy and lactation periods had 2.1 and 2.6 times higher odds of
being underweight than those born of mothers not fasting during their pregnancy and lactation
periods (AOR = 2.12 (1.29, 3.51) and AOR = 2.57 (1.56, 4.23), respectively). Children from
illiterate and farming mothers were 1.8 and 2.3 times more likely to be underweight compared to
those whose mothers were literate and housewives (AOR = 1.79 (1.10, 2.90) and AOR = 2.28
(1.25, 4.16), respectively]. Similarly, children between 13–23 months of age had 3.1 times higher
odds of stunting than those between 6–12 months of age (AOR = 3.07 (2.04, 4.63)).
Children who did not consume colostrum after their birth were about 4.1 times as likely to be
stunted compared to those who did (AOR = 4.10 (1.42, 11.82)). Additionally, children born of
mothers fasting during their pregnancy and lactation periods were 1.8 times more likely to be
stunted (AOR = 1.83 (1.21, 2.77)) than those children from mothers who did not fast during both
periods (AOR = 1.81 (1.20, 2.72)). Furthermore, children living in households who did not own a
latrine were 1.7 times more likely to be stunted compared to those owning a latrine (AOR = 1.67
(1.06, 2.64)). Children whose mothers were fasting during their lactation period and who were
illiterate were 6.8 and 2.2 times more exposed to wasting when compared with the references
(not fasting and literate, respectively) (Table 3.3).
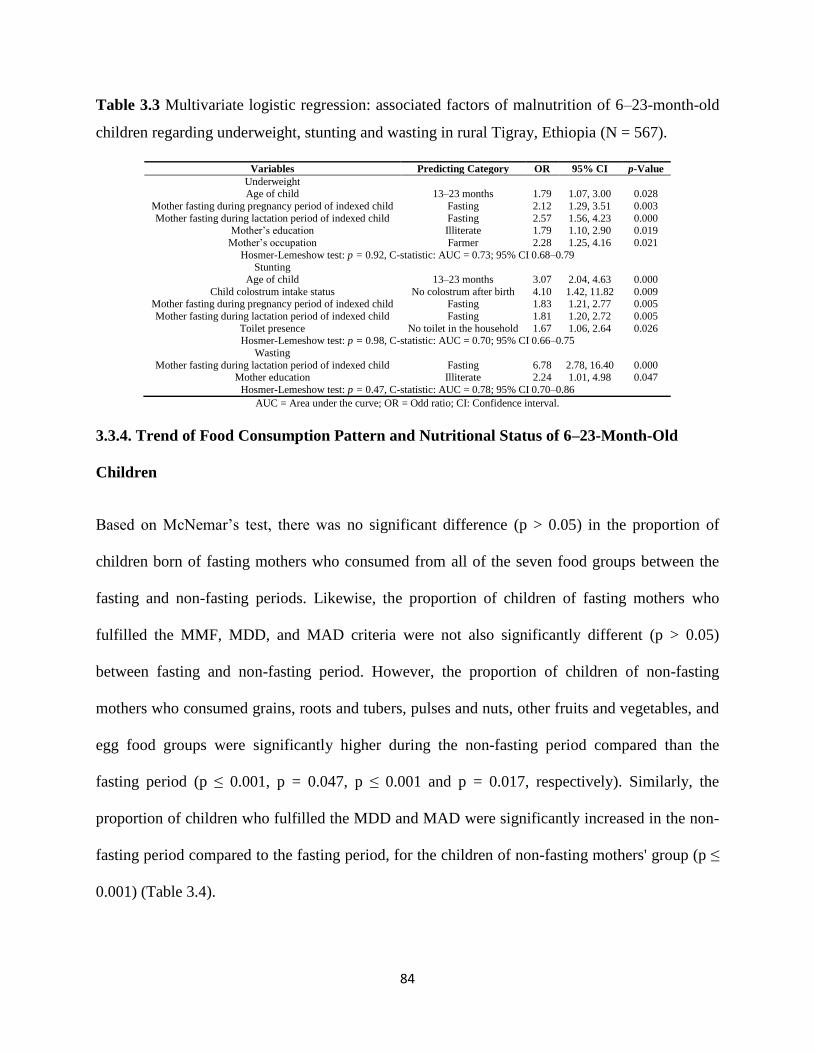
84
Table 3.3 Multivariate logistic regression: associated factors of malnutrition of 6–23-month-old
children regarding underweight, stunting and wasting in rural Tigray, Ethiopia (N = 567).
Variables Predicting Category OR 95% CI p-Value
Underweight Age of child 13–23 months 1.79 1.07, 3.00 0.028
Mother fasting during pregnancy period of indexed child Fasting 2.12 1.29, 3.51 0.003
Mother fasting during lactation period of indexed child Fasting 2.57 1.56, 4.23 0.000 Mother‘s education Illiterate 1.79 1.10, 2.90 0.019
Mother‘s occupation Farmer 2.28 1.25, 4.16 0.021
Hosmer-Lemeshow test: p = 0.92, C-statistic: AUC = 0.73; 95% CI 0.68–0.79 Stunting
Age of child 13–23 months 3.07 2.04, 4.63 0.000
Child colostrum intake status No colostrum after birth 4.10 1.42, 11.82 0.009 Mother fasting during pregnancy period of indexed child Fasting 1.83 1.21, 2.77 0.005
Mother fasting during lactation period of indexed child Fasting 1.81 1.20, 2.72 0.005
Toilet presence No toilet in the household 1.67 1.06, 2.64 0.026 Hosmer-Lemeshow test: p = 0.98, C-statistic: AUC = 0.70; 95% CI 0.66–0.75
Wasting
Mother fasting during lactation period of indexed child Fasting 6.78 2.78, 16.40 0.000 Mother education Illiterate 2.24 1.01, 4.98 0.047
Hosmer-Lemeshow test: p = 0.47, C-statistic: AUC = 0.78; 95% CI 0.70–0.86
AUC = Area under the curve; OR = Odd ratio; CI: Confidence interval.
3.3.4. Trend of Food Consumption Pattern and Nutritional Status of 6–23-Month-Old
Children
Based on McNemar‘s test, there was no significant difference (p > 0.05) in the proportion of
children born of fasting mothers who consumed from all of the seven food groups between the
fasting and non-fasting periods. Likewise, the proportion of children of fasting mothers who
fulfilled the MMF, MDD, and MAD criteria were not also significantly different (p > 0.05)
between fasting and non-fasting period. However, the proportion of children of non-fasting
mothers who consumed grains, roots and tubers, pulses and nuts, other fruits and vegetables, and
egg food groups were significantly higher during the non-fasting period compared than the
fasting period (p ≤ 0.001, p = 0.047, p ≤ 0.001 and p = 0.017, respectively). Similarly, the
proportion of children who fulfilled the MDD and MAD were significantly increased in the non-
fasting period compared to the fasting period, for the children of non-fasting mothers' group (p ≤
0.001) (Table 3.4).

85
Table 3.4 Food consumption pattern of 6–23-month-old children of fasting and non-fasting
mothers during lent fasting and non-fasting periods in rural Tigray, Northern Ethiopia.
Parameters Children of Fasting Mothers (n = 156) Children of Non-Fasting Mothers (n = 349)
Lent Fasting
Period
Non-Fasting
Period Significance
Lent Fasting
Period
Non-fasting
Period Significance
N (%) N (%) p-Value N (%) N (%) p-Value
Grains, roots and tubers
consumption 145 (92.9) 147 (94.2) 0.815 ns 317 (90.8) 339 (97.1) 0.000 *
Pulses and nuts
consumption 97 (62.2) 108 (69.2) 0.228 ns 228 (65.3) 250 (71.6) 0.047 *
Other fruits and vegetables 45 (28.8) 52 (33.3) 0.427 ns 91 (26.1) 138 (39.5) 0.000 *
Dairy products
consumption 14 (9.0) 9 (5.8) 0.332 ns 31 (8.9) 41 (11.7) 0.203 ns
Flesh food consumption 3 (1.9) 4 (2.6) 1.000 ns 0 (0.0) 4 (1.1) NA
Eggs consumption 30 (19.2) 38 (24.4) 0.302 ns 64 (18.3) 87 (24.9) 0.017 *
Vitamin A fruits and
vegetables 5 (3.2) 2 (1.3) 0.453 ns 0 (0.0) 4 (1.4) NA
MAD 3 (1.9) 9 (5.8) 0.146 ns 7 (2.0) 25 (7.5) 0.001 *
MDD 5 (3.2) 10 (6.4) 0.302 ns 6 (1.7) 25 (7.2) 0.001 *
MMF 114 (73.1) 121 (77.6) 0.349 ns 256 (73.4) 258 (73.9) 0.927 ns
Data analysis using McNemar‘s test, significant level at p < 0.05; NA = the data were not appropriate for analysis; MAD: minimum acceptable
diet, MDD = minimum diet diversity, MMF: minimum meal frequency; ns- not significantly different at p < 0.05; * = significantly different at p < 0.05.
Likewise, the WAZ, WLZ and LAZ of children of non-fasting mothers were significantly higher
than those of children of the fasting sub-group during the lent fasting period (p ≤ 0.001, p ≤ 0.001
and p = 0.003, respectively) (Table 3.5). A Wilcoxon signed-rank test showed that except for the
median of WAZ (p = 0.153) for children of the non-fasting mothers‘ sub-group, the median
WAZ (p = 0.034) for the children of fasting mothers, and the DDS of both, the children of the
fasting and non-fasting mothers' sub-groups were significantly increased in the non-fasting than
in the fasting period (p ≤ 0.001) (Table 3.6).
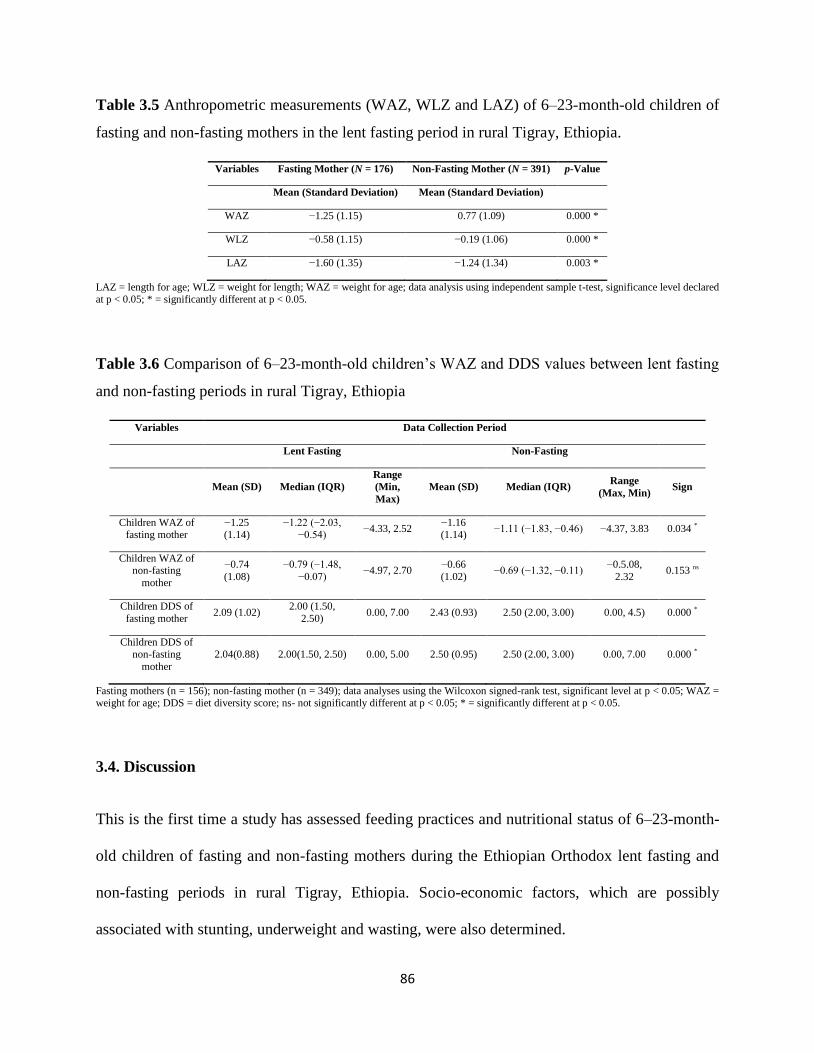
86
Table 3.5 Anthropometric measurements (WAZ, WLZ and LAZ) of 6–23-month-old children of
fasting and non-fasting mothers in the lent fasting period in rural Tigray, Ethiopia.
Variables Fasting Mother (N = 176) Non-Fasting Mother (N = 391) p-Value
Mean (Standard Deviation) Mean (Standard Deviation)
WAZ −1.25 (1.15) 0.77 (1.09) 0.000 *
WLZ −0.58 (1.15) −0.19 (1.06) 0.000 *
LAZ −1.60 (1.35) −1.24 (1.34) 0.003 *
LAZ = length for age; WLZ = weight for length; WAZ = weight for age; data analysis using independent sample t-test, significance level declared at p < 0.05; * = significantly different at p < 0.05.
Table 3.6 Comparison of 6–23-month-old children‘s WAZ and DDS values between lent fasting
and non-fasting periods in rural Tigray, Ethiopia
Variables Data Collection Period
Lent Fasting Non-Fasting
Mean (SD) Median (IQR)
Range
(Min,
Max)
Mean (SD) Median (IQR) Range
(Max, Min) Sign
Children WAZ of fasting mother
−1.25 (1.14)
−1.22 (−2.03, −0.54)
−4.33, 2.52 −1.16 (1.14)
−1.11 (−1.83, −0.46) −4.37, 3.83 0.034 *
Children WAZ of non-fasting
mother
−0.74
(1.08)
−0.79 (−1.48,
−0.07) −4.97, 2.70
−0.66
(1.02) −0.69 (−1.32, −0.11)
−0.5.08,
2.32 0.153 ns
Children DDS of
fasting mother 2.09 (1.02)
2.00 (1.50,
2.50) 0.00, 7.00 2.43 (0.93) 2.50 (2.00, 3.00) 0.00, 4.5) 0.000 *
Children DDS of non-fasting
mother
2.04(0.88) 2.00(1.50, 2.50) 0.00, 5.00 2.50 (0.95) 2.50 (2.00, 3.00) 0.00, 7.00 0.000 *
Fasting mothers (n = 156); non-fasting mother (n = 349); data analyses using the Wilcoxon signed-rank test, significant level at p < 0.05; WAZ = weight for age; DDS = diet diversity score; ns- not significantly different at p < 0.05; * = significantly different at p < 0.05.
3.4. Discussion
This is the first time a study has assessed feeding practices and nutritional status of 6–23-month-
old children of fasting and non-fasting mothers during the Ethiopian Orthodox lent fasting and
non-fasting periods in rural Tigray, Ethiopia. Socio-economic factors, which are possibly
associated with stunting, underweight and wasting, were also determined.

87
3.4.1. Food Consumption Pattern of 6–23-Month-Old Children
According to the UNICEF conceptual framework of malnutrition, inadequate dietary intake is
one of the immediate causes of child malnutrition [14]. In our study, cereals, roots and tubers,
and pulses and nuts are the food groups majorly prepared for the 6–23-month-old children in the
rural Tigray in Ethiopia, regardless of fasting period. This result is consistent with previous
studies in Ethiopia [11,15–20]. A similar finding was reported on the consumption of grains,
roots and tubers for children from Vietnam, Bangladesh, Pakistan, Indian and the U.S. [21–25].
According to Demissie and his colleagues [21], consumption of fruits and vegetables is sub-
optimal in the Tigray region and Ethiopia in general [26]. Supporting this evidence, we also
found that only 1% of children consumed vitamin A-rich fruits and vegetables. The result is also
comparable with a previous study in rural Tigray [27]. However, our finding was lower than
findings of two national surveys [14.8, 27.7%] in Ethiopia and Pakistan (18.7%) [22,28,29]. This
could be related to the fact that cultivation on the farm and availability in the markets are rare in
the study area, probably resulting in a less diverse diet. Another explanation could be a
difference in feeding practices [26]. However, the consumption of other fruits and vegetables
food group was between 27.0–37.6% in the present study. This result is higher than national
figures, which are 3.3% and 10.1% [28,29].
Animal source foods are both energy and nutrient dense, and an excellent source of high quality
and easily digestible protein, in addition to being an efficient and easily absorbable source of
micronutrients like iron, zinc, vitamin A, vitamin B12, riboflavin and calcium [30]. In the present
study, the consumption of a diet composed of flesh foods was 0.5% and 1.6% in fasting and non-
fasting periods, respectively. These results are comparable with a previous study during the
Ethiopian Orthodox fasting period in the Dejen district (0.0%), and studies conducted in
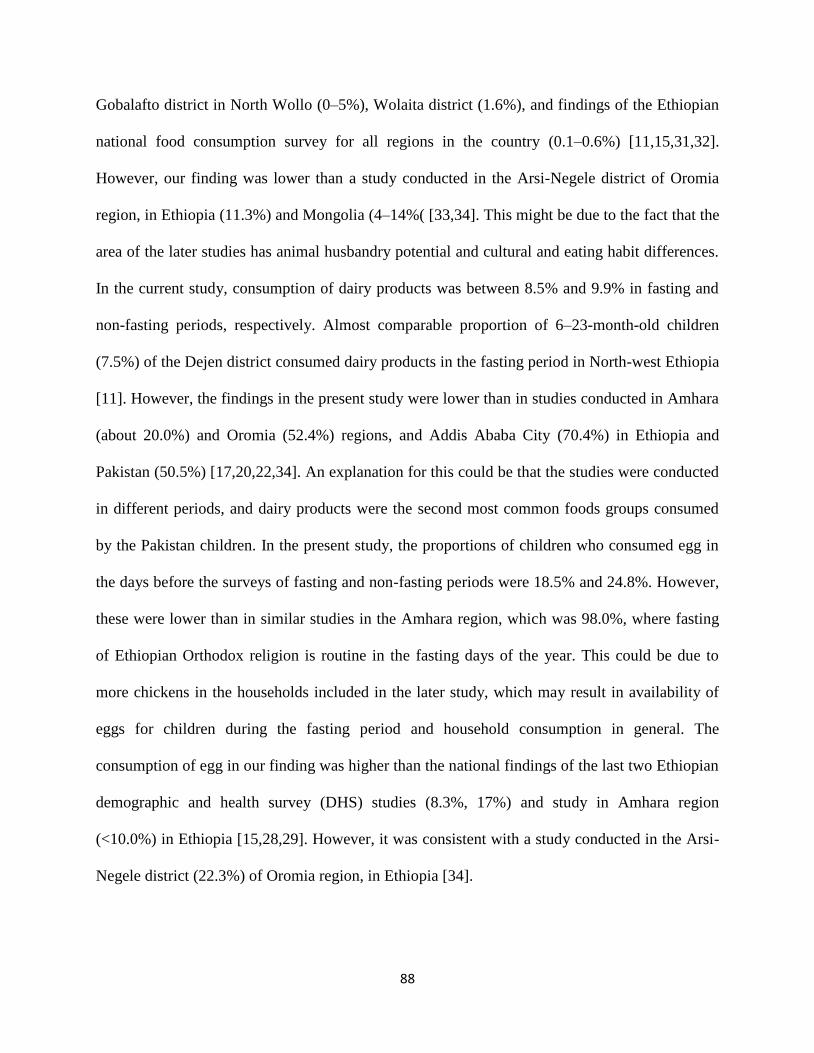
88
Gobalafto district in North Wollo (0–5%), Wolaita district (1.6%), and findings of the Ethiopian
national food consumption survey for all regions in the country (0.1–0.6%) [11,15,31,32].
However, our finding was lower than a study conducted in the Arsi-Negele district of Oromia
region, in Ethiopia (11.3%) and Mongolia (4–14%( [33,34]. This might be due to the fact that the
area of the later studies has animal husbandry potential and cultural and eating habit differences.
In the current study, consumption of dairy products was between 8.5% and 9.9% in fasting and
non-fasting periods, respectively. Almost comparable proportion of 6–23-month-old children
(7.5%) of the Dejen district consumed dairy products in the fasting period in North-west Ethiopia
[11]. However, the findings in the present study were lower than in studies conducted in Amhara
(about 20.0%) and Oromia (52.4%) regions, and Addis Ababa City (70.4%) in Ethiopia and
Pakistan (50.5%) [17,20,22,34]. An explanation for this could be that the studies were conducted
in different periods, and dairy products were the second most common foods groups consumed
by the Pakistan children. In the present study, the proportions of children who consumed egg in
the days before the surveys of fasting and non-fasting periods were 18.5% and 24.8%. However,
these were lower than in similar studies in the Amhara region, which was 98.0%, where fasting
of Ethiopian Orthodox religion is routine in the fasting days of the year. This could be due to
more chickens in the households included in the later study, which may result in availability of
eggs for children during the fasting period and household consumption in general. The
consumption of egg in our finding was higher than the national findings of the last two Ethiopian
demographic and health survey (DHS) studies (8.3%, 17%) and study in Amhara region
(<10.0%) in Ethiopia [15,28,29]. However, it was consistent with a study conducted in the Arsi-
Negele district (22.3%) of Oromia region, in Ethiopia [34].

89
Minimum meal frequency is a proxy indicator to determine whether the energy requirement of a
child is met and examines the frequency of meals where the children received foods other than
breastmilk, considering specific age and breastfeeding status of the child [29]. In this study,
three-fourths of children of fasting and non-fasting mothers had eaten the minimum number of
meals in the days preceding the fasting and non-fasting surveys. This result is in line with studies
conducted in the Dabat (69.3–75.0%) and Gorche (78.0%) districts of northern and southern
Ethiopia, respectively [35,36]. However, our finding is higher than studies in Kemba (14.5–
33.6%), Bale (44.7%), Arsi-Negele (67.3%), Wolaita (69.3%) districts, elsewhere in Tigray
region (66.0%) and findings for the Tigray region (55.6%, 49.4%), and national averages (47.9%,
44.6%) in Ethiopian DHS studies of 2011 and 2016, respectively, and Pakistan (38.2%)
[16,19,28,29,34,37,38]. However, it is lower than findings on children from the South Wollo
district, in Ethiopia, which were 91.0–97.0% and Nepal (87.8–98.2%) [15,39].
Minimum dietary diversity is one of the indicators to assess the quality of food consumed by 6–
23-month-old children. Consumption of at least four different food groups in a day is the
minimum requirement [29,40]. In this study, the proportion of children who consumed foods
prepared from at least four diversified food groups (MDD) was 2.5% and 6.9% in fasting and
non-fasting periods, respectively. This finding indicates that children aged 6–23 months in the
study area are consuming a poor quality complementary diet. A study conducted in 6–23-month-
old children of Orthodox Christian mothers in Gojam indicated that 13.6% had four diversified
food groups in the food they consumed preceding the survey during the fasting period [11].
Similarly, our findings are also lower than findings in children living in the Gorche (10.4%),
Kemba (23.3%), Bale (28.5%), and Wollo (23.0–41.0%) districts in Ethiopia, India (38%),
Bangladesh (48.4%) and Vietnam (83.2%) [15,16,25,35,41,42]. Generally, these findings

90
indicate that undernutrition specifically stunting and micronutrient deficiencies could be the
public health problem in the area. This is supported by studies conducted in children from
different parts of the world and ours [43–46].
For appropriate growth and development, infants and young children should be fed with at least
four diversified food groups from the minimum number of meals (MAD) recommended
according to specific to the age and breastfed status of the child [40]. In the present study, the
proportion of 6–23-month-old children who met both the minimum diversity and the number of
meals (MAD) preceding the surveys was 2.3–6.7% in the study population. The result is
consistent with DHS 2011 and 2016 findings for the Tigray region (4.5% and 5.7%, respectively)
and the national figure (4.0%) in DHS 2016 for Ethiopia [28,29]. However, it is lower than
research findings conducted in three districts (17.0%) of the Tigray region, in northern Ethiopia,
India (9%), Nepal (32%), Bangladesh (40%) and Sri Lanka (68%) [31,38,47]. Moreover, the
proportion of 6–23-month-old children who fulfilled the criteria for MAD was higher for non-
fasting mothers (2.0–7.5%) and in non-fasting period (6.7%) compared with their counterparts.
This finding suggests that activities which can improve the child feeding practices should include
improving maternal feeding behavior, as many scholars evidenced their association, including
ours [9,21,48].
3.4.2. Nutritional Status of 6–23-month-Old Children
In the present study, the prevalence of wasting, underweight and stunting in the 6–23 months old
children was between 4.4–4.8%, 11.7–15.7% and 31.6–33.7%, respectively. These results are
lower than the findings for the Tigray region and national figures in last two DHS studies in
Ethiopia. For example, wasting, underweight, and stunting in under-five aged children were
91
10.3% and 9.7%, 35.1% and 28.7%, and 51.4% and 44.4% in DHS 2011 (Tigray region and
national, respectively). Except for wasting, these figures further decreased to 23.0% and 23.6%
for underweight, and 39.3% and 38.4% for stunting in the DHS 2016 study [28,29]. This could
indicate an improvement in child nutritional status, both regionally, and at the national level.
In this study, the median WAZ of children of fasting mothers was lower compared to children of
non-fasting mothers, both in fasting and non-fasting periods. The WAZ of children from non-
fasting mothers‘ sub-group also improved during the non-fasting period. Similarly, the
prevalence of underweight children from the fasting sub-group was higher than that of children
from the non-fasting sub-group, in both periods. Likewise, the mean standard deviations (SD) of
WAZ, WLZ and LAZ of children from the fasting mothers sub-group were lower compared to
children from non-fasting mothers during the fasting period. Similarly, the proportion of wasted
children was higher in the fasting sub-group compared to those children from non-fasting
mothers during the fasting period. Conversely, relatively more children from non-fasting mothers
were stunted than from fasting mothers. This could be due to the higher number of older children
in the non-fasting group. Similar findings were observed in studies conducted in the Tigray
region, northern Ethiopia [4]. Multivariate logistic regression showed that children of mothers
who fasted during the pregnancy and lactation period were more likely to be undernourished
(stunting, underweight, and wasting) than those children of mothers who were not fasting in the
same periods. These indicate that, maternal fasting during pregnancy, and lactation not only
affect the nutritional status of the mother themselves [9], but also their fetus/breastfed child. To
increase the awareness on the effect of fasting practices on the undernutrition, the Ethiopian
Orthodox Church (EOTC) with the United States Agency for International Development
(USAID) multi-sectoral nutrition project, Empowering New Generations to Improve Nutrition
92
and Economic opportunities (ENGINE) held a consultative meeting with religious leaders and
church scholars to clarify fasting practices for children, pregnant and lactating women in line
with religious guidelines. This was done after a sermon guide was developed in 2016, based on
the church teachings and outlining the laws and regulations related with fasting and nutrition.
According to the joint press release by EOTC and USAID/ENGINE, the sermon guide
highlighted the exemption of mothers and their babies from fasting during the first 1000 days
[49]. The sermon guide also emphasized the cooking utensils to be used for complementary food
preparation during fasting seasons, as many mothers were not happy to prepare complementary
food from the animal sources during fasting seasons due to fear of contamination of family food
[10]. Therefore, strengthening the activities started by the Church and the involvement of
religious institutions and leaders in the existing national multi-sectoral approach activities would
accelerate and sustain the reduction of nutrition-related problems in the country.
Previous studies in Africa and Southeast Asian countries demonstrated that children in the age
between 13–23 months were more associated with underweight and stunting compared to those
who were aged 6–12 months [28,29,50–61]. Similar findings were also revealed in our study.
This could be related to feeding practices, contamination and poor quality complementary food,
which is mainly cereal based [4]. Similarly, maternal illiteracy was found to be a predictor
variable for underweight and wasting. The former result is consistent with previous studies in
Ethiopia and other low and middle income countries [28,29,62–65]. Similarly, findings in
Ethiopian DHS also showed that childhood wasting was associated with maternal illiteracy
[28,29]. This indicates that educating mothers will be an important activity for improving the
nutritional status of children in a given community. Likewise, compared to children whose
mothers were housewives, children of farmer mothers were more exposed to being underweight.
93
This might be related to less time allocation for child care due to a high work load and absence
from the home. Farm work also expends more energy, and mothers may be more frequently
exhausted, which could result in poor appetite and might affect the quality and quantity of breast
milk. Moreover, children who did not take the first milk (colostrum) after their birth were more
stunted than those who did. This could be related to infection emanating from pre-lacteal foods,
which is a predictor for child stunting in North-west Ethiopia [58]. Therefore, activities which
improve the colostrum intake (e.g.,- antenatal care) should be done in the study area [66].
Furthermore, children who were living in households without toilets were more exposed to
stunting compared to those from households owning toilets. This could be related to poverty in
general, a well-known factor for malnutrition. Additionally, contamination of the soil due to open
defecation increases the risk for frequent episodes of childhood diarrhea, which has a negative
impact on the nutritional status of sub-Saharan African children [50].
However, this study has the following limitations: This study considered only the lent fasting
period, among the seven official fasting periods in Ethiopian Orthodox religion. It also included
only children aged between 6–23 months, out of those children below seven years of age, who
are exempted from the official fasting in the religion.
3.5. Conclusions
This study showed that there is high prevalence of stunting (31.6–33.7%), underweight (11.7–
15.7%), and wasting (4.4–4.8%) in the study area; however, these values are lower than those
reported earlier in the Tigray region (39.3%, 23.0% and 11.1%), and of national figures (38.4%,
23.6% and 9.9%). These are indications of improvement of child nutrition in rural Tigray.
However, the prevalence‘s are still higher, both in children of fasting mothers and the study

94
population especially during Ethiopian Orthodox lent fasting period. Thus, religious fasting
should not go against the existing nutritional intervention modalities. Mother‘s fasting during the
lactation period of an indexed child was the common predictor for child stunting, underweight
and wasting. Maternal illiteracy and age of children and maternal fasting during pregnancy of
indexed children were also common variables affecting combined effects of underweight and
wasting, and underweight and stunting, whereas, the type of job of mothers and lack of colostrum
feeding of children after birth were associated with underweight and absence of a toilet in the
household with the stunting of children. Hence, improving maternal education and reducing the
work burden in farming activities or promotion and support of mothers in off-farm income
generation nearby their households are recommended. Improving household latrine coverage and
breastfeeding of colostrum should be encouraged and strengthened. ‗Grains, roots, and tubers‘
was the most frequently eaten food group by 6–23-month-old children, followed by ‗legumes and
nuts‘ and then ‗other fruits and vegetables‘. Therefore, to increase nutrients and improve the
palatability of grains and legumes, traditional food processing techniques like
dehulling/dehusking, soaking and germination, and slightly roasting are crucial. Additionally, the
proportion of children who consumed dairy products, flesh foods and eggs who met the MDD
was small. The average DDS of the children was also low, being worst in children of fasting
mothers especially during the lent fasting period. Thus, regardless of the fasting period, diet
diversity should be properly addressed in preparation of complementary foods by incorporating
animal products [dairy products; flesh foods; eggs], vitamin A-rich fruits and vegetables. In
general, nutritional status is affected by maternal fasting status during pregnancy and lactation
periods, and during the lent fasting period in rural Tigray, Ethiopia. Therefore, without
strengthening and involvement of religious institutions and leaders in the existing nutrition
95
improvement activity by the Church and in the National Nutrition Program (NNP) of, in
particular nursing mothers and growing children, reduction of undernutrition would not be
successful and sustainable. As this study is focused on the food consumption and growth index
pattern of 6–23-month-old children, further studies on physiological consequences of levels of
micronutrients or bio-markers are recommended.
Author Contributions: B.B.D., C.L., S.R. and H.K.B. involved in research design; B.B.D.
conducted the research; B.B.D. analyzed the data; B.B.D. wrote the paper; B.B.D., C.L., S.R.,
T.N., and H.K.B. edited draft manuscript; the final content was the primary responsibility of
B.B.D. All authors read and approved the final manuscript.
Funding: This study was financially supported by German Federal Ministry for Economic
Cooperation and Development (BMZ).
Acknowledgments: This study is part of the PhD work of the first author and was conducted with
the financial support from the German Federal Ministry for Economic Cooperation and
Development (BMZ). The authors would also like to thank the data collectors of this study, and
Habteab and Muez, the staff of GIZ Nutrition Sensitive Agriculture project in the Tigray region
and Gebretsadekane, Genta Afeshum Woreda Health Office Nutrition coordinator, in Ethiopia.
They would also like to thank Andrea Flaccus for English language editing.
Conflicts of Interest: No conflict of interest among authors.
3.6. References
1. UNICEF. Levels and Trend in Child Malnutrition: UNICEF/WHO/World Bank Group Joint
Estimates, Key Findings of the 2017 Edition. 2017, p. 16. Available online:
http://www.who.int/nutgrowthdb/jme_brochoure2017.pdf [accessed on 15 May 2018].
96
2. Ethiopian Public Health Institute [EPHI]. The Cost of Hunger in Ethiopia; EPHI: Addis
Ababa, Ethiopia, 2013.
3. Federal Democratic Republic of Ethiopia [FDRE]. Seqota Declaration Implementation Plan
[2016–2030]: Summary Program Approach Document; FDRE: Addis Ababa, Ethiopia, 2016.
4. Mulugeta, A.; Hagos, F.; Kruseman, G.; Linderhof, B.; Stoecker, B.; Abraha, Z.; Yohannes,
M.; Samuel, G.G. Factors Contributing to Child Malnutrition in Tigray, Northern Ethiopia.
East Afr. Med. J. 2010, 87, 248–254. [PubMed]
5. Felisbino-mendes, M.; Villamor, E.; Velasquez-melendez, G. Association of maternal and
child nutritional status in Brazil: A population based cross-sectional study. PLoS ONE 2014,
9, e87486. [CrossRef] [PubMed]
6. Negash, C.; Whiting, S.J.; Henry, C.J.; Belachew, T.; Hailemariam, T.G. Association
between maternal and child nutritional status in Hula, rural southern Ethiopia: A cross
sectional study. PLoS ONE 2015, 10, e0142301. [CrossRef] [PubMed]
7. Silva, D.E.; Valente, A.; Borges, A.; Almeida, F.; Neves, E.; Afonso, C. Relationship
between the mothers‘ nutritional status with that of a child population from São Tomé
Principe, ―Africa‖. Rev. Bras. Saúde Matern. Infant. Recif. 2017, 17, 327–335. [CrossRef]
8. Zhang, J.; Kang, H.; Wang, L.; Zhao, X.; Liu, R.; He, L. A Prevalence Analysis to Assess the
Relationship between Maternal and Children‘s Nutritional Status in North-Western Rural
China Clinics in Mother and Child Health. Clin. Mother Child Health 2016, 13, 100242.
[CrossRef]
9. Desalegn, B.B.; Lambert, C.; Riedel, S.; Negese, T.; Biesalski, H.K. Ethiopian Orthodox
Fasting and Lactating Mothers: Longitudinal Study on Dietary Pattern and Nutritional Status
97
in Rural Tigray Tigray, Ethiopia. Int. J. Environ. Res. Public Health 2018, 15, 1767.
[CrossRef] [PubMed]
10. Alive and Thrive. IYCF Practices, Beliefs, and Influences in Tigray Region, Ethiopia; Alive
and Thrive: Addis Ababa, Ethiopia, 2010.
11. Kumera, G.; Tsedal, E.; Ayana, M. Dietary diversity and associated factors among children
of Orthodox Christian mothers/caregiversduring the fasting season in Dejen district, north
west Ethiopia. Nutr. Metab. 2018, 15, 16. [CrossRef]
12. Tamiru, M.W.; Tolessa, B.E.; Abera, S.F. Under Nutrition and Associated Factors Among
Under-Five Age Children of Kunama Ethnic Groups in Tahtay Adiyabo Woreda, Tigray
Regional State, Ethiopia: Community Based Study. Int. J. Nutr. Food Sci. 2015, 4, 277–288.
[CrossRef]
13. Coates, J.F.; Swindale, A.; Bilinsky, P. Household Food Insecurity Access Scale [HFIAS] for
Measurement of Household Food Access: Indicator Guide [v. 3]; Food and Nutrition
Technical Assistance Project; Academy for Educational Development: Washington, DC,
USA, 2007; p. 36.
14. UNICEF. The Status of the World‘s Children; Oxford University Press: Geneva, Switzerland,
1998; p. 135.
15. Baye, K.; Guyot, J.P.; Icard-Vernière, C.; Mouquet-Rivier, C. Nutrient intakes from
complementary foods consumed by young children [aged 12–23 months] from North Wollo,
northern Ethiopia: The need for agro-ecologically adapted interventions. Public Health Nutr.
2013, 16, 1741–1750. [CrossRef]
98
16. Gatahun, E.A. Dietary Diversity Feeding Practice and Determinants among Children Aged 6-
23 Months in Kemba Woreda, Southern Ethiopia Implication for Public Health Intervention.
J. Nutr. Food Sci. 2015. [CrossRef]
17. Gebremedhin, S.; Baye, K.; Bekele, T.; Tharaney, M.; Asrat, Y.; Abebe, Y.; Reta, N.
Predictors of dietary diversity in children ages 6 to 23 months in largely food-insecure area of
South Wollo, Ethiopia. Nutrition 2017, 33, 163–168. [CrossRef] [PubMed]
18. Hirvonen, K.; Hoddinott, J.; Minten, B.; Stifel, D. Children‘s Diets, Nutrition Knowledge,
and Access to Markets. World Dev. 2017, 95, 303–315. [CrossRef]
19. Mekonnen, T.C.; Workie, S.B.; Yimer, T.M.; Mersha, W.F. Meal frequency and dietary
diversity feeding practices among children 6–23 months of age in Wolaita Sodo town,
Southern Ethiopia. J. Health Popul. Nutr. 2017, 36, 18. [CrossRef] [PubMed]
20. Solomon, D.; Aderaw, Z.; Tegegne, T.K. Minimum dietary diversity and associated factors
among children aged 6–23 months in Addis Ababa, Ethiopia. Int. J. Equit. Health 2017, 16,
1–9. [CrossRef] [PubMed]
21. Nguyen, P.H.; Avula, R.; Ruel, M.T.; Saha, K.K.; Ali, D.; Tran, L.M; Frongillo, E.A.;
Menon, P.; Rawat, R. Maternal and Child Dietary Diversity Are Associated in Bangladesh,
Vietnam, and Ethiopia. J. Nutr. 2013, 143, 1176–1183. [CrossRef] [PubMed]
22. Iqbal, S.; Zakar, R.; Zakar, M.Z.; Fischer, F. Factors associated with infants‘ and young
children‘s [6–23 months] dietary diversity in Pakistan: Evidence from the demographic and
health survey 2012–2013. Nutr. J. 2017, 16, 78. [CrossRef] [PubMed]
23. Hamner, H.C.; Perrine, C.G.; Gupta, P.M.; Herrick, K.A.; Cogswell, M.E. Food consumption
patterns among U.S. children from birth to 23 months of age, 2009–2014. Nutrients 2017, 9,
942. [CrossRef] [PubMed]
99
24. Gladys, C. Dietary Assessment and Nutritional Status of Children [6 23 Months] Consuming
Local Food Recipes in Vihiga County, Western Kenya; University of Nairobi Digital
Repository: Nairobi, Kenya, 2017.
25. Divya, N.; Rajanish, K.V.; Malavika, J.; Sharma, A. The study of dietary diversity score in
children between 6 months to 23 months: A hospital based study. Int. J. Contemp. Pediatrics
2018, 5, 1053–1057.
26. Demissie, T.; Ali, A.; Zerfu, D. Availability and consumption of fruits and vegetables in nine
regions of Ethiopia with special emphasis to vitamin A deficiency. Ethiop. J. Health Dev.
2009, 23, 216–222. [CrossRef]
27. Schwei, R.J.; Tesfay, H.; Asfaw, F.; Jogo, W.; Busse, H. Household dietary diversity,
vitamin A consumption and food security in rural Tigray, Ethiopia. Public Health Nutr. 2017,
20, 1540–1547. [CrossRef]
28. Central Statistical Agency [CSA]. Ethiopia Demographic and Health Survey 2011; Central
Statistical Agency: Addis Ababa, Ethiopia; ICF International Calverton: Calverton, MD,
USA, 2012; p. 452.
29. Central Statistical Agency [CSA]. Ethiopia Demographic and Health Survey 2016; Central
Statistical Agency: Addis Ababa, Ethiopia; ICF International Calverton: Calverton, MD,
USA, 2017; p. 551.
30. Neumann, C.; Harris, D.M.; Rogers, L.M. Contribution of animal source foods in improving
diet quality and function in children in the developing world. Nutr. Res. 2002, 22, 193–220.
[CrossRef]
31. Ethiopian Public Health Institute [EPHI]. Ethiopia National Food Consumption Survey;
EPHI: Addis Ababa, Ethiopia, 2013.
100
32. Gamo, S.G. Dietary Diversity and Associated Factors among Infants and Young Children in
Wolaita Zone, Southern Ethiopia. Sci. J. Clin. Med. 2017, 6, 53. [CrossRef]
33. Lander, R.; Enkhjargal, T.S.; Batjargal, J.; Bolormaa, N.; Enkhmyagmar, D.; Tserendolgor,
U.; Tungalag, S.; Bailey, K.; Gibson, R.S. Poor dietary quality of complementary foods is
associated with multiple micronutrient deficiencies during early childhood in Mongolia.
Public Health Nutr. 2010, 13, 1304–1313. [CrossRef] [PubMed]
34. Kassa, T.; Meshesha, B.; Haji, Y.; Ebrahim, J. Appropriate complementary feeding practices
and associated factors among mothers of children age 6–23 months in Southern Ethiopia,
2015. BMC Pediatr. 2016, 16, 1–10. [CrossRef] [PubMed]
35. Dangura, D.; Gebremedhin, S. Dietary diversity and associated factors among children 6–23
months of age in Gorche district, Southern Ethiopia: Cross-sectional study. BMC Pediatr.
2017, 17, 1–7. [CrossRef] [PubMed]
36. Belew, A.K.; Ali, B.M.; Abebe, Z.; Dachew, B.A. Dietary diversity and meal frequency
among infant and young children: A community based study. Ital. J. Pediatr. 2017, 43, 6–15.
[CrossRef] [PubMed]
37. Khan, G.N.; Ariff, S.; Khan, U.; Habib, A.; Umer, M.; Suhag, Z.; Hussain, I.; Bhatti, Z.;
Ullah, A.; Turab, A.; et al. Determinants of infant and young child feeding practices by
mothers in two rural districts of Sindh, Pakistan: A cross-sectional survey. Int. Breastfeed J.
2017, 12, 1–8. [CrossRef] [PubMed]
38. Ludwig, C.; Bau, A. Nutrition Baseline Survey—Ethiopia-for the Global Programme: Food
and Nutrition Security and Enhanced Resilence; Food and Nutrition Security and Enhanced
Resilence: Addis Ababa, Ethiopia, 2007.
101
39. Morseth, M.S.; Torheim, L.E.; Gebremariam, M.K.; Chandyo, R.K.; Ulak, M.; Shrestha,
S.K.; Shrestha, B.; Henjum, S. Tracking of infant and young child feeding practices among 9-
to 24-month-old children in Nepal: The MAL-ED Birth Cohort Study. Public Health Nutr.
2018, 21, 355–364. [CrossRef] [PubMed]
40. WHO. Indicators for Assessing Infant and Young Child Feeding Practices. Part 3 Country
Profiles; WHO: Geneva, Switzerland, 2010; pp. 1–47.
41. Ali, D.; Saha, K.K.; Nguyen, P.H.; Diressie, M.T.; Ruel, M.T.; Menon, P.; Rawat, R.
Household Food Insecurity Is Associated with Higher Child Undernutrition in Bangladesh,
Ethiopia, and Vietnam, but the Effect Is Not Mediated by Child Dietary Diversity. J. Nutr.
2013, 143, 2015–2021. [CrossRef]
42. Tegegne, M.; Sileshi, S.; Benti, T.; Teshome, M.; Woldie, H. Factors associated with
minimal meal frequency and dietary diversity practices among infants and young children in
the predominantly agrarian society of Bale zone, Southeast Ethiopia: A community based
cross sectional study. Arch. Public Health 2017, 75, 1–11.
43. Arimond, M.; Ruel, M.T. Dietary diversity is associated with child nutritional status:
Evidence from 11 demographic and health surveys. J. Nutr. 2004, 134, 2579–2585.
[CrossRef] [PubMed]
44. Ogechi, U.P.; Chilezie, O.V. Assessment of Dietary Diversity Score, Nutritional Status and
Socio-demographic Characteristics of Under-5 Children in Some Rural Areas of Imo State,
Nigeria. Mal. J. Nutr. 2017, 23, 425–435.
45. Steyn, N.P.; Nell, J.H.; Nantel, G.; Kennedy, G.; Labadarios, D. Food variety and dietary
diversity scores in children: Are they good indicators of dietary adequacy? Public Health
Nutr. 2006, 9, 644–650. [CrossRef] [PubMed]

102
46. Zhao, W.; Yu, K.; Tan, S.; Zheng, Y.; Zhao, A.; Wang, P.; Zhang, Y. Dietary diversity
scores: An indicator of micronutrient inadequacy instead of obesity for Chinese children.
BMC Public Health 2017, 17, 440. [CrossRef] [PubMed]
47. Senarath, U.; Godakandage, S.S.P.; Jayawickrama, H.; Siriwardena, I.; Dibley, M.J.
Determinants of inappropriate complementary feeding practices in young children in Sri
Lanka: Secondary data analysis of Demographic and Health Survey 2006–2007. Matern.
Child Nutr. 2012, 8 [Suppl. 1], 60–77. [CrossRef] [PubMed]
48. Amugsi, D.A.; Mittelmark, M.B.; Oduro, A. Association between Maternal and Child
Dietary Diversity: An Analysis of the Ghana Demographic and Health Survey. PLoS ONE
2015, 10, e0136748. [CrossRef] [PubMed]
49. EOTC/USAID. Patriarch of the Ethiopian Orthodox Tewahedo Church Endorses Nutrition
Sermon Guide. Encouraging Better Nutrition for Mothers and Children; USAID: Addis
Ababa, Ethiopia, 2019; pp. 1–2. Available online: https://2012-
2017.usaid.gov/ethiopia/news-information/press-releases/patriarchethiopian-orthodox-
tewahedo-church-endorses [accessed on 29 March 2018].
50. Akombi, B.J.; Agho, K.E.; Hall, J.J.; Wali, N.; Renzaho, A.M.N.; Merom, D. Stunting,
wasting and underweight in Sub-Saharan Africa: A systematic review. Int. J. Environ. Res.
Public Health 2017, 14, 863. [CrossRef]
51. Alemayehu, M.; Tinsae, F.; Haileslassie, K.; Seid, O.; Gebregziabher, G.; Yebyo, H.
Undernutrition status and associated factors in under-5 children, in Tigray, Northern
Ethiopia. Nutrition 2015, 31, 964–970. [CrossRef]

103
52. Altare, C.; Delbiso, T.D.; Mutwiri, G.M.; Kopplow, R.; Guha-Sapir,D. Factors associated
with stunting among pre-school children in southern highlands of Tanzania. J. Trop. Pediatr.
2016, 62, 390–408. [CrossRef]
53. Birhanu, A.; Mekonen, S.; Atenafu, A. Stunting and associatedfactors among children aged
6-59 months in Lasta woreda, north east Ethiopia, 2015: A community based cross sectional
study design. J. Fam. Med. 2017, 4, 1112.
54. Derso, T.; Tariku, A.; Biks, G.A.; Wassie, M.M. Stunting, wasting and associated factors
among children aged 6–24 months in Dabat health and demographic surveillance system site:
A community based cross-sectional study in Ethiopia. BMC Pediatr. 2017, 17, 1–9.
[CrossRef] [PubMed]
55. Desalegn, B.B.; Kinfe, E.; Fikre, K.; Bosha, T. Stunting and It‘sAssociated Factors in Under
Five Years Old Children: The Case of Hawassa University Technology Villages, Southern
Ethiopia. IOSR. J. Environ. Sci. Toxicol. Food Technol. 2016, 10, 25–31.
56. Endris, N.; Asefa, H.; Dube, L. Prevalence of Malnutrition and Associated Factors among
Children in Rural Ethiopia. Biomed. Res.Int. 2017, 2017. [CrossRef] [PubMed]
57. Ettyang, G.A.K.; Sawe, C.J. Factors Associated with Stunting in Children under Age 2 in the
Cambodia and Kenya 2014 Demographic and Health Surveys. DHS Work Pap No 126. 2016.
Available online: http://dhsprogram.com/pubs/pdf/WP126/WP126.pdf [accessed on 11
March 2018].
58. Fentahun, W.; Wubshet, M.; Tariku, A. Undernutrition and associated factors among children
aged 6–59 months in East Belesa District, northwest Ethiopia: A community based cross-
sectional study. BMC Public Health 2016, 16, 1–10. [CrossRef] [PubMed]
104
59. Jayatissa, R.; Bekele, A.; Piyasena, C.L.; Mahamithawa, S. Assessment of nutritional status
of children under five years of age, pregnant women, and lactating women living in relief
camps after the tsunami in Sri Lanka. Food Nutr. Bull. 2006, 27, 144–152. [CrossRef]
[PubMed]
60. Nkurunziza, S.; Meessen, B.; Van geertruyden, J.P.; Korachais, C.; Nkurunziza, S.; Meessen,
B.; Van geertruyden, J.P.; Korachais, C. Determinants of stunting and severe stunting among
Burundian children aged 6–23 months: Evidence from a national cross-sectional household
survey, 2014. BMC Pediatr. 2017, 17. [CrossRef] [PubMed]
61. Ocampo-Guirindola, M.L.; Garcia-Malabad, C.J.; Valdeabella-Maniego, M.L.M.; Punzalan,
S.L.M. Association between dietary diversity score and nutritional status of Filipino children
aged 6–23 months. Philipp. J. Sci. 2016, 145, 57–69.
62. Bbaale, E. Maternal education and child nutritional status: Evidence from Uganda. Afr. J.
Econ. Manag. Stud. 2014, 5, 52–74. [CrossRef]
63. Makoka, D.; Masibo, P.K. Is there a threshold level of maternaleducation sufficient to reduce
child undernutrition? Evidence from Malawi, Tanzania and Zimbabwe. BMC Pediatr. 2015,
1–10. [CrossRef]
64. Nyaruhucha, C.N.M.; Msuya, J.M.; Mamiro, P.S.; Kerengi, A.J. Nutritional status and
feeding practices of under-five children in Simanjiro District, Tanzania. Tanzan. Health Res.
Bull. 2006, 8, 162–167. [CrossRef]
65. Vollmer, S.; Bommer, C.; Krishna, A.; Harttgen, K.; Subramanian, S.V. The association of
parental education with childhood undernutrition in low- and middle-income countries:
Comparing the role of paternal and maternal education. Int. J. Epidemiol. 2017, 46, 312–323.
[CrossRef] [PubMed]
66. Tessema, M.; Belachew, T.; Ersino, G. Feeding patterns and stunting during early childhood
in rural communities of Sidama, south Ethiopia. Pan. Afr. Med J. 2013, 14, 1–12.

105
Chapter 4
Paper III

106
4. Calculator for Inadequate Micronutrient Intake (CIMI): Validation of the
Software in 12-23-Months-old Children and Lactating Women of Rural
Ethiopia
Beruk Berhanu Desalegn1,2*
, Christine Lambert2, Ute Gola
3, Simon Riedel
2, Tegene Negese
1 and
Hans Konrad Biesalski2
1College of Agriculture, Hawassa University, Postal code: 05, Hawassa, Ethiopia;
2Institute of Biological Chemistry and Nutrition, University of Hohenheim, Garbenstr. 30,
70593 Stuttgart, Germany; [email protected] (C.L.);
[email protected] (S.R.); [email protected] (H.K.B.)
3Day-med-concept GmbH, Garbenstr. 30, 70593 Berlin, Germany; [email protected]
(U.G.)
* Correspondence: [email protected] Tel.: +251-941-048-918
A version of this chapter was submitted to Nutrients on 22/05/2019 as
Desalegn, B., Lambert, C., Widmer, C., Gola, U., Riedel, S., Negese, T., Biesalski, H.K.
Calculator for Inadequate Micronutrient Intake (CIMI): Validation of the software in 12-23-
months-old children and lactating women of rural Ethiopia.
107
Calculator for Inadequate Micronutrient Intake (CIMI): Validation
of the Software in 12-23-Months-Old Children and Lactating
Women of Rural Ethiopia
Abstract
Background: Religion and religious activities like fasting play a pivotal role in the dietary pattern
of an individual in countries like Ethiopia. However, micronutrient intake and its effect during
Ethiopian fasting vs. non-fasting periods have not been assessed. Many of the dietary assessment
studies in Ethiopia use only diet diversity score (DDS), a proxy indicator for micronutrient
adequacy because most of the quantitative dietary assessment techniques are time consuming and
need experts to calculate dietary intake. Therefore, the objective of this study was to assess the
dietary nutrient intakes of 12-23-months-old children and lactating women at fasting vs. non-
fasting period in rural Ethiopia; to be able develop and validate a Calculator for Inadequate
Micronutrient Intake (CIMI) program, which is a simple, easy-to-use app based on amounts of
different food and beverage groups which calculates dietary micronutrient intake of an
individual. Methods: A community-based longitudinal assessments were conducted using 12-23-
months-old children and lactating women in lent fasting (n=377 and 568) and non-fasting (n=404
and 518) periods in rural Ethiopia. Statistical analyses were performed using SPSS and Excel.
For validation, individual nutrient intake was analyzed by two different methods: CIMI and the
established nutrition assessment software NutriSurvey (NS). Afterwards, average mean intake
and percentage of participants identified with an inadequate intake of <2/3 of recommended
nutrient intake (RNI) were compared using the two methods. Results: Energy and almost all
macro- and micronutrients intakes of children and women were lower in lent fasting period
compared to non-fasting. Likewise, the prevalence of inadequate intake of energy, protein and

108
most micronutrients were higher in both children (1.7-9.1%) and lactating women (1.6-21.4%)
during lent fasting than non-fasting period. Based on CIMI and NS calculations, average dietary
nutrient intake for children (R=0.741-0.956) and lactating mothers (R=0.779-0.920) were
comparable. Conclusion: More attention should be given to nutrition intervention related to diet
improvement activities of young children and lactating women especially during religious fasting
periods. CIMI developed for the rural Ethiopian setting estimates the average nutrient intake
accurately; and identifies inadequate micronutrient intake of individuals using the RNI of
FAO/WHO enabling enumerators to provide feedback and suggest improvements.
Keywords: lent fasting; children; lactating mothers; CIMI; micronutrient; dietary intake; Ethiopia
4.1. Introduction
Religious fasting plays a pivotal role for changing the dietary pattern of households, as a result
the nutritional status of individuals living in the households, especially nutritionally vulnerable
children and women [1–4]. In Ethiopia, more than two-third of the population are either a
follower of Ethiopian Orthodox or Muslim, who practice a strict fasting during their religious
fasting periods [5]. But, the fasting traditions and the number of fasting days in the calendar year
are prominently different between these two religions [6]. In Ethiopian orthodox religion, lent
fasting is the longest among the seven official fasting periods. In this term, abstaining from any
animal source foods completely, and any foods and water for at least some hours daily, except
Saturday and Sunday is religious obligatory. Accordingly, studies in the 6-23-months-old
children and lactating mothers in Ethiopia indicated that maternal and child undernutrition and
consumption of foods prepared from low diverse food groups were higher in lent fasting
compared to non-fasting period in rural Ethiopia [1,2]. To the best of our knowledge, there is no
109
study which has assessed the dietary micronutrient intake of Ethiopian Orthodox women and
their children.
For appropriate growth and development, micronutrients are crucial apart from the
macronutrients (carbohydrates, proteins and fats) [7]. The inadequate intake of these
micronutrients below the amount required leads to the invisible form of malnutrition called
micronutrient deficiency or ‗Hidden hunger‘ [8]. If this inadequate supply of micronutrient
persists for a longer period, then it will be increasing the risk of disease, growth and cognitive
development impairment at the early stage of childhood, and maternal illness and decrease their
life expectancy. Therefore, early identification of micronutrient deficiencies will be an important
step to design and initiate appropriate prevention and intervention activities. But these are
lacking, because quantitative nutrient intake data are often not available. As many of the existing
dietary nutrient intake assessment techniques (food frequency questionnaires (FFQs), food
weight record and 24-h recall) are time consuming, need well trained field workers during the
surveys and an expert to calculate dietary intake using a nutrition software and identify
undernutrition. Alternatively, many researches use different types of diet diversity scores as
proxy indicator for dietary adequacy. These might be one of the reason why hidden hunger is not
addressed properly in Ethiopia and other African countries, where this phenomenon remains
high and persistent at large [9]. Thus, developing a tool that can evaluate the nutrient intake and
detect the gap between the nutrient intake and the recommended intake, but easy-to-use, fast and
applicable in rural poor setting is important to early identify the problem, set an appropriate
prevention and intervention activities and monitor the progress.
The Calculator for Inadequate Micronutrient Intake (CIMI) is a simple, easy-to-use, informative,
web-based application method, which was first developed using commonly consumed

110
Indonesian foods for Indonesian population. CIMI calculates energy and nutrient intake
accurately, and identifies nutrient inadequacy according to FAO/WHO recommended nutrient
intake (RNI) regarding age, sex and physiological stage [10]. Therefore, the purpose of this study
was
1) to assess the dietary nutrient intakes of 12-23-months-old children and lactating women during
Ethiopian Orthodox fasting and non-fasting periods, in rural Tigray, North Ethiopia
2) to adapt and validate CIMI, a simple, easy-to-use, informative, web-based application method
which can calculate the micronutrient intake of Ethiopian population based on their traditional
dietary patterns.
4.2. Materials and Methods
4.2.1. Study Area, Design, Participants, Sampling and Ethical Clearance
The survey was conducted during lent fasting and non-fasting period in Rural Genta Afeshum
woreda of North Ethiopia, between February–April and May 2017, respectively. Description of
the whole study areas, sample size calculations, sampling methods, inclusion and exclusion
criteria and ethical issues were published, elsewhere [1,2]. However, in this study, the children
between 6-11-month and > 23 months of age in either of the surveys, and those lost for follow-up
study were excluded and thus the final total sample size was reduced to 377 and 404 in lent
fasting and non-fasting assessments, respectively. Those children who were < 12-month in the
lent fasting but aged ≥ 12-month in the non-fasting period were included in the study. Lactating
mothers also participated in the present study in lent fasting (n=568) and non-fasting periods
(n=518). The lactating mothers participated in the lent fasting period, but their children > 23
months of age were excluded from the survey during non-fasting period.

111
4.2.2. Data Collection
Before conducting the quantitative dietary survey, the principal investigator identified food
items, recipes, cooking and serving materials and how they were served commonly for the
children and women in the study area. Food items were measured using a laboratory weight
balance (2 kg maximum weight: Model CS 2000, Ohaus Corporation, Newark, NJ, USA).
Then, common food pictures and utensils were also used to support the mothers for estimating
the amount of food consumed by them and their children. Following this, trainings were given
for the 10 experienced data collectors who participated in the surveys. Details about the data
collectors and the questionnaires used are found in previous published articles [1,2].
4.2.3. Development of Calculator for Inadequate Micronutrient Intake (CIMI) for Ethiopia
Before structuring the food groups for the CIMI program, the type of food items commonly
consumed in Ethiopian population were identified from Socio-economic survey dataset (2016)
based on the amount consumed in kg per capita per day. Beside this, we also reviewed literatures
and published articles which provide information related to food consumed in Ethiopia.
Accordingly, 93 food items were identified and categorized into 31 food groups (Table 4.1).
Then, the energy, macro-, and micro-nutrients composition of each food item in the 31 food
groups was adopted from Ethiopian composition table III and IV, published articles elsewhere in
Ethiopia or Kenyan food composition tables [11]. Additionally, missing nutrients were taken
from US Department of Agriculture database (USDA) 2018. Based on this, the nutrient profile of
each food group was identified, using the share contribution of each food item contributing to the
specific food group and calculated accordingly. Following this, the amount of nutrient intake was
calculated by CIMI out of the sum of nutrient intakes of all food groups. An algorithm for
112
classifying the bioavailability of iron and zinc was adapted from CIMI developed for Indonesia
[10]. Then, CIMI automatically calculated the absolute intake and percent of RNI fulfillment of
energy and each of the 14 nutrients included.
4.2.4. Data Management and Analyses
The 93 food items considered for the development of CIMI for Ethiopia with their nutrient
compositions were entered in NutriSurvey (NS) software version 2007 as database for analysis.
Beside for the development of CIMI software, CIMI server was created. The purpose of this
server is to store the dietary data entered in the CIMI software after the data automatically synced
when the tablet gets Wi-Fi network. Then, the estimated amount of food items consumed in the
last 24 hours by the children and women involved in this study were entered in NS, which
calculated the nutrient intake. However, the estimated amount of food items was sorted into the
31 food groups categorized and summed up together to get the amount consumed as a food group
and then entered into CIMI software. NS is an internationally established nutritional assessment
software. In this software, each food item eaten has to be entered with the estimated amount
individually. Data entries on NS were carried out by the principal investigator, but for CIMI, five
experienced data entrant were trained and entered the data. Then, the tablets with CIMI data were
synced in the Wi-Fi network to the server daily after the data entry and finally the results were
downloaded from the server. Following these, variables coding, data transfer, cleaning and
completeness of data were carried out in SPSS for window version 20 (IBM Corporation,
Armonk, NY, USA), consecutively. The average nutrient intakes and the number/percentage of
participants below the inadequate intake cutoff of <2/3 RNI were calculated both for NS and
CIMI software‘s. Specifically, for iron and zinc, the RNI could be different because only CIMI
considers different bioavailability levels, as a result the cutoff differs for individuals. The

113
average mean differences (Z) of each nutrient intake was calculated as an average of the mean
difference results obtained by subtracting the results produced by CIMI (Y) from NS results (X)
of the participants included in the study (Equation a), and the average mean difference % (R) for
each nutrient was calculated as the average mean difference (Z) divided by the average nutrient
result produced by NS and then multiplying the dividend by 100 (Equation b).
∑ -
[ Equation a]
∑
[Equation b]
where Z is the average mean difference of each nutrient and energy, X is the nutrient value of each participant calculated by NS, Y is the nutrient
value of each participant calculated by CIMI, n is the number of participants, R is the average mean difference % of each nutrient and energy.
Based on this, the mean difference % expressed in terms of NS was used to categorize the
nutrient intake result produced by CIMI as very high accurate (+/-0<5%), good accuracy (+/-5-
15%) moderate accuracy (+/-15-30%) and low accuracy (+/->30%) [12]. Additionally, the
correlation on each nutrient intake results between CIMI and NS for 12-23-months-old children
and lactating women were analyzed using Pearson correlation test at the significance level of
p=0.001. Microsoft Excel 2010 was also used to compute dietary intake data.
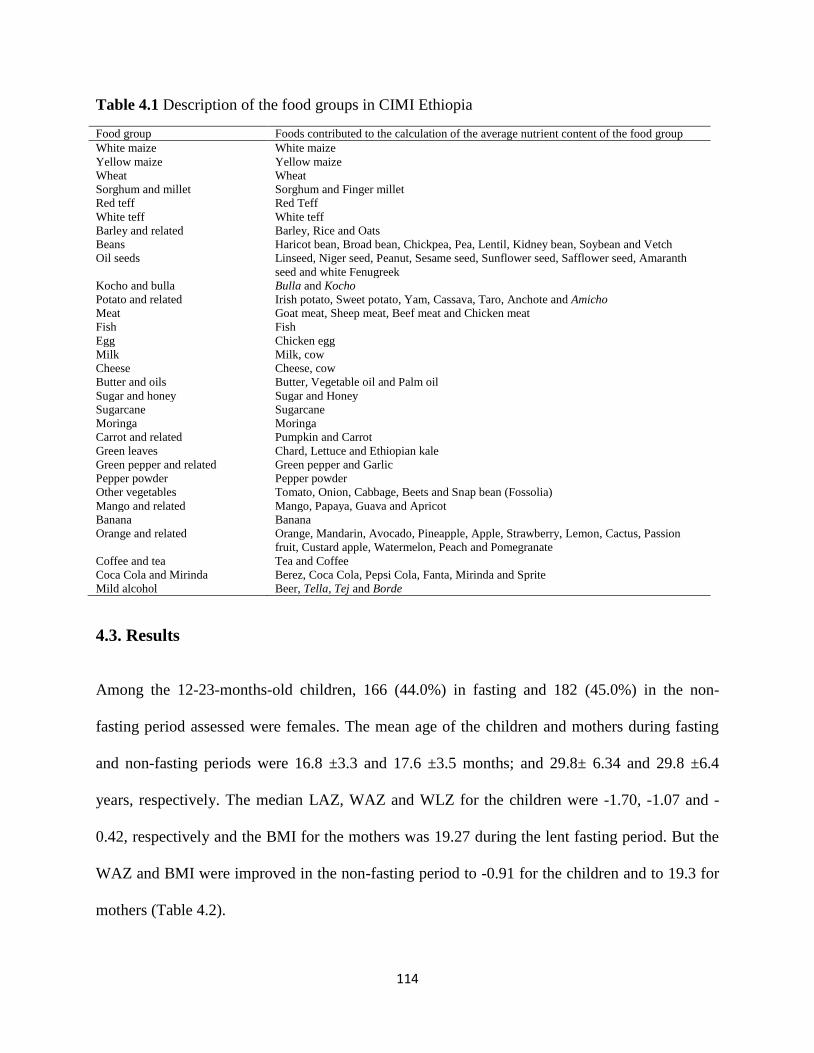
114
Table 4.1 Description of the food groups in CIMI Ethiopia
Food group Foods contributed to the calculation of the average nutrient content of the food group
White maize White maize
Yellow maize Yellow maize
Wheat Wheat
Sorghum and millet Sorghum and Finger millet
Red teff Red Teff
White teff White teff
Barley and related Barley, Rice and Oats
Beans Haricot bean, Broad bean, Chickpea, Pea, Lentil, Kidney bean, Soybean and Vetch
Oil seeds Linseed, Niger seed, Peanut, Sesame seed, Sunflower seed, Safflower seed, Amaranth
seed and white Fenugreek
Kocho and bulla Bulla and Kocho
Potato and related Irish potato, Sweet potato, Yam, Cassava, Taro, Anchote and Amicho
Meat Goat meat, Sheep meat, Beef meat and Chicken meat
Fish Fish
Egg Chicken egg
Milk Milk, cow
Cheese Cheese, cow
Butter and oils Butter, Vegetable oil and Palm oil
Sugar and honey Sugar and Honey
Sugarcane Sugarcane
Moringa Moringa
Carrot and related Pumpkin and Carrot
Green leaves Chard, Lettuce and Ethiopian kale
Green pepper and related Green pepper and Garlic
Pepper powder Pepper powder
Other vegetables Tomato, Onion, Cabbage, Beets and Snap bean (Fossolia)
Mango and related Mango, Papaya, Guava and Apricot
Banana Banana
Orange and related Orange, Mandarin, Avocado, Pineapple, Apple, Strawberry, Lemon, Cactus, Passion
fruit, Custard apple, Watermelon, Peach and Pomegranate
Coffee and tea Tea and Coffee
Coca Cola and Mirinda Berez, Coca Cola, Pepsi Cola, Fanta, Mirinda and Sprite
Mild alcohol Beer, Tella, Tej and Borde
4.3. Results
Among the 12-23-months-old children, 166 (44.0%) in fasting and 182 (45.0%) in the non-
fasting period assessed were females. The mean age of the children and mothers during fasting
and non-fasting periods were 16.8 ±3.3 and 17.6 ±3.5 months; and 29.8± 6.34 and 29.8 ±6.4
years, respectively. The median LAZ, WAZ and WLZ for the children were -1.70, -1.07 and -
0.42, respectively and the BMI for the mothers was 19.27 during the lent fasting period. But the
WAZ and BMI were improved in the non-fasting period to -0.91 for the children and to 19.3 for
mothers (Table 4.2).
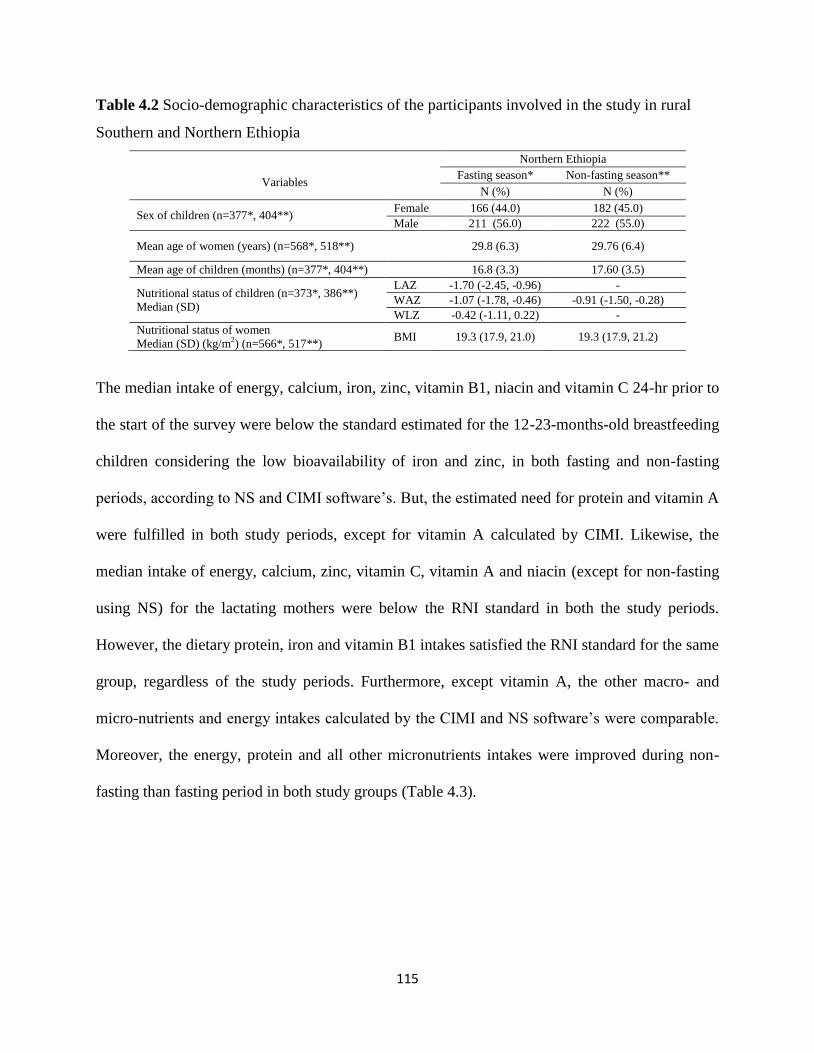
115
Table 4.2 Socio-demographic characteristics of the participants involved in the study in rural
Southern and Northern Ethiopia
Variables
Northern Ethiopia
Fasting season* Non-fasting season**
N (%) N (%)
Sex of children (n=377*, 404**) Female 166 (44.0) 182 (45.0)
Male 211 (56.0) 222 (55.0)
Mean age of women (years) (n=568*, 518**) 29.8 (6.3) 29.76 (6.4)
Mean age of children (months) (n=377*, 404**) 16.8 (3.3) 17.60 (3.5)
Nutritional status of children (n=373*, 386**)
Median (SD)
LAZ -1.70 (-2.45, -0.96) -
WAZ -1.07 (-1.78, -0.46) -0.91 (-1.50, -0.28)
WLZ -0.42 (-1.11, 0.22) -
Nutritional status of women
Median (SD) (kg/m2) (n=566*, 517**) BMI 19.3 (17.9, 21.0) 19.3 (17.9, 21.2)
The median intake of energy, calcium, iron, zinc, vitamin B1, niacin and vitamin C 24-hr prior to
the start of the survey were below the standard estimated for the 12-23-months-old breastfeeding
children considering the low bioavailability of iron and zinc, in both fasting and non-fasting
periods, according to NS and CIMI software‘s. But, the estimated need for protein and vitamin A
were fulfilled in both study periods, except for vitamin A calculated by CIMI. Likewise, the
median intake of energy, calcium, zinc, vitamin C, vitamin A and niacin (except for non-fasting
using NS) for the lactating mothers were below the RNI standard in both the study periods.
However, the dietary protein, iron and vitamin B1 intakes satisfied the RNI standard for the same
group, regardless of the study periods. Furthermore, except vitamin A, the other macro- and
micro-nutrients and energy intakes calculated by the CIMI and NS software‘s were comparable.
Moreover, the energy, protein and all other micronutrients intakes were improved during non-
fasting than fasting period in both study groups (Table 4.3).
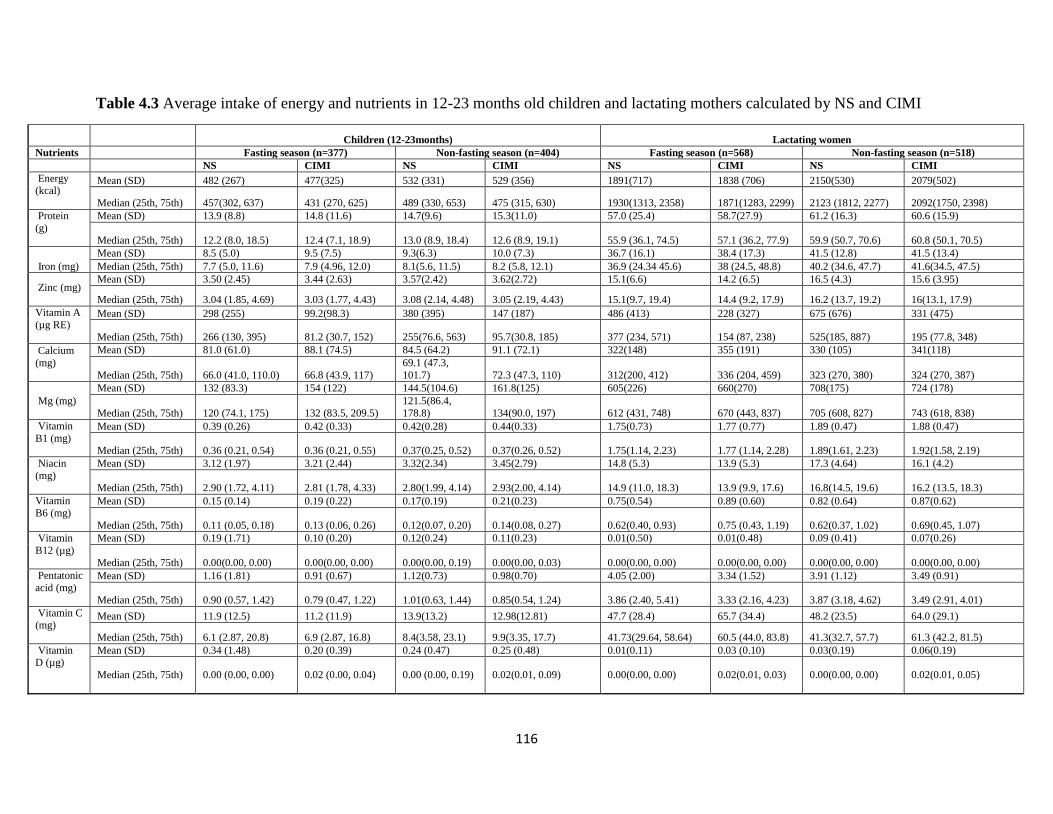
116
Table 4.3 Average intake of energy and nutrients in 12-23 months old children and lactating mothers calculated by NS and CIMI
Children (12-23months) Lactating women
Nutrients Fasting season (n=377) Non-fasting season (n=404) Fasting season (n=568) Non-fasting season (n=518)
NS CIMI NS CIMI NS CIMI NS CIMI
Energy (kcal)
Mean (SD) 482 (267) 477(325) 532 (331) 529 (356) 1891(717) 1838 (706) 2150(530) 2079(502)
Median (25th, 75th) 457(302, 637) 431 (270, 625) 489 (330, 653) 475 (315, 630) 1930(1313, 2358) 1871(1283, 2299) 2123 (1812, 2277) 2092(1750, 2398)
Protein
(g)
Mean (SD) 13.9 (8.8) 14.8 (11.6) 14.7(9.6) 15.3(11.0) 57.0 (25.4) 58.7(27.9) 61.2 (16.3) 60.6 (15.9)
Median (25th, 75th) 12.2 (8.0, 18.5) 12.4 (7.1, 18.9) 13.0 (8.9, 18.4) 12.6 (8.9, 19.1) 55.9 (36.1, 74.5) 57.1 (36.2, 77.9) 59.9 (50.7, 70.6) 60.8 (50.1, 70.5)
Iron (mg)
Mean (SD) 8.5 (5.0) 9.5 (7.5) 9.3(6.3) 10.0 (7.3) 36.7 (16.1) 38.4 (17.3) 41.5 (12.8) 41.5 (13.4)
Median (25th, 75th) 7.7 (5.0, 11.6) 7.9 (4.96, 12.0) 8.1(5.6, 11.5) 8.2 (5.8, 12.1) 36.9 (24.34 45.6) 38 (24.5, 48.8) 40.2 (34.6, 47.7) 41.6(34.5, 47.5)
Zinc (mg)
Mean (SD) 3.50 (2.45) 3.44 (2.63) 3.57(2.42) 3.62(2.72) 15.1(6.6) 14.2 (6.5) 16.5 (4.3) 15.6 (3.95)
Median (25th, 75th) 3.04 (1.85, 4.69) 3.03 (1.77, 4.43) 3.08 (2.14, 4.48) 3.05 (2.19, 4.43) 15.1(9.7, 19.4) 14.4 (9.2, 17.9) 16.2 (13.7, 19.2) 16(13.1, 17.9)
Vitamin A
(µg RE)
Mean (SD) 298 (255) 99.2(98.3) 380 (395) 147 (187) 486 (413) 228 (327) 675 (676) 331 (475)
Median (25th, 75th) 266 (130, 395) 81.2 (30.7, 152) 255(76.6, 563) 95.7(30.8, 185) 377 (234, 571) 154 (87, 238) 525(185, 887) 195 (77.8, 348)
Calcium
(mg)
Mean (SD) 81.0 (61.0) 88.1 (74.5) 84.5 (64.2) 91.1 (72.1) 322(148) 355 (191) 330 (105) 341(118)
Median (25th, 75th) 66.0 (41.0, 110.0) 66.8 (43.9, 117)
69.1 (47.3,
101.7) 72.3 (47.3, 110) 312(200, 412) 336 (204, 459) 323 (270, 380) 324 (270, 387)
Mg (mg)
Mean (SD) 132 (83.3) 154 (122) 144.5(104.6) 161.8(125) 605(226) 660(270) 708(175) 724 (178)
Median (25th, 75th) 120 (74.1, 175) 132 (83.5, 209.5)
121.5(86.4,
178.8) 134(90.0, 197) 612 (431, 748) 670 (443, 837) 705 (608, 827) 743 (618, 838)
Vitamin
B1 (mg)
Mean (SD) 0.39 (0.26) 0.42 (0.33) 0.42(0.28) 0.44(0.33) 1.75(0.73) 1.77 (0.77) 1.89 (0.47) 1.88 (0.47)
Median (25th, 75th) 0.36 (0.21, 0.54) 0.36 (0.21, 0.55) 0.37(0.25, 0.52) 0.37(0.26, 0.52) 1.75(1.14, 2.23) 1.77 (1.14, 2.28) 1.89(1.61, 2.23) 1.92(1.58, 2.19)
Niacin
(mg)
Mean (SD) 3.12 (1.97) 3.21 (2.44) 3.32(2.34) 3.45(2.79) 14.8 (5.3) 13.9 (5.3) 17.3 (4.64) 16.1 (4.2)
Median (25th, 75th) 2.90 (1.72, 4.11) 2.81 (1.78, 4.33) 2.80(1.99, 4.14) 2.93(2.00, 4.14) 14.9 (11.0, 18.3) 13.9 (9.9, 17.6) 16.8(14.5, 19.6) 16.2 (13.5, 18.3)
Vitamin
B6 (mg)
Mean (SD) 0.15 (0.14) 0.19 (0.22) 0.17(0.19) 0.21(0.23) 0.75(0.54) 0.89 (0.60) 0.82 (0.64) 0.87(0.62)
Median (25th, 75th) 0.11 (0.05, 0.18) 0.13 (0.06, 0.26) 0.12(0.07, 0.20) 0.14(0.08, 0.27) 0.62(0.40, 0.93) 0.75 (0.43, 1.19) 0.62(0.37, 1.02) 0.69(0.45, 1.07)
Vitamin
B12 (µg)
Mean (SD) 0.19 (1.71) 0.10 (0.20) 0.12(0.24) 0.11(0.23) 0.01(0.50) 0.01(0.48) 0.09 (0.41) 0.07(0.26)
Median (25th, 75th) 0.00(0.00, 0.00) 0.00(0.00, 0.00) 0.00(0.00, 0.19) 0.00(0.00, 0.03) 0.00(0.00, 0.00) 0.00(0.00, 0.00) 0.00(0.00, 0.00) 0.00(0.00, 0.00)
Pentatonic
acid (mg)
Mean (SD) 1.16 (1.81) 0.91 (0.67) 1.12(0.73) 0.98(0.70) 4.05 (2.00) 3.34 (1.52) 3.91 (1.12) 3.49 (0.91)
Median (25th, 75th) 0.90 (0.57, 1.42) 0.79 (0.47, 1.22) 1.01(0.63, 1.44) 0.85(0.54, 1.24) 3.86 (2.40, 5.41) 3.33 (2.16, 4.23) 3.87 (3.18, 4.62) 3.49 (2.91, 4.01)
Vitamin C (mg)
Mean (SD) 11.9 (12.5) 11.2 (11.9) 13.9(13.2) 12.98(12.81) 47.7 (28.4) 65.7 (34.4) 48.2 (23.5) 64.0 (29.1)
Median (25th, 75th) 6.1 (2.87, 20.8) 6.9 (2.87, 16.8) 8.4(3.58, 23.1) 9.9(3.35, 17.7) 41.73(29.64, 58.64) 60.5 (44.0, 83.8) 41.3(32.7, 57.7) 61.3 (42.2, 81.5)
Vitamin D (µg)
Mean (SD) 0.34 (1.48) 0.20 (0.39) 0.24 (0.47) 0.25 (0.48) 0.01(0.11) 0.03 (0.10) 0.03(0.19) 0.06(0.19)
Median (25th, 75th) 0.00 (0.00, 0.00) 0.02 (0.00, 0.04) 0.00 (0.00, 0.19) 0.02(0.01, 0.09) 0.00(0.00, 0.00) 0.02(0.01, 0.03) 0.00(0.00, 0.00) 0.02(0.01, 0.05)
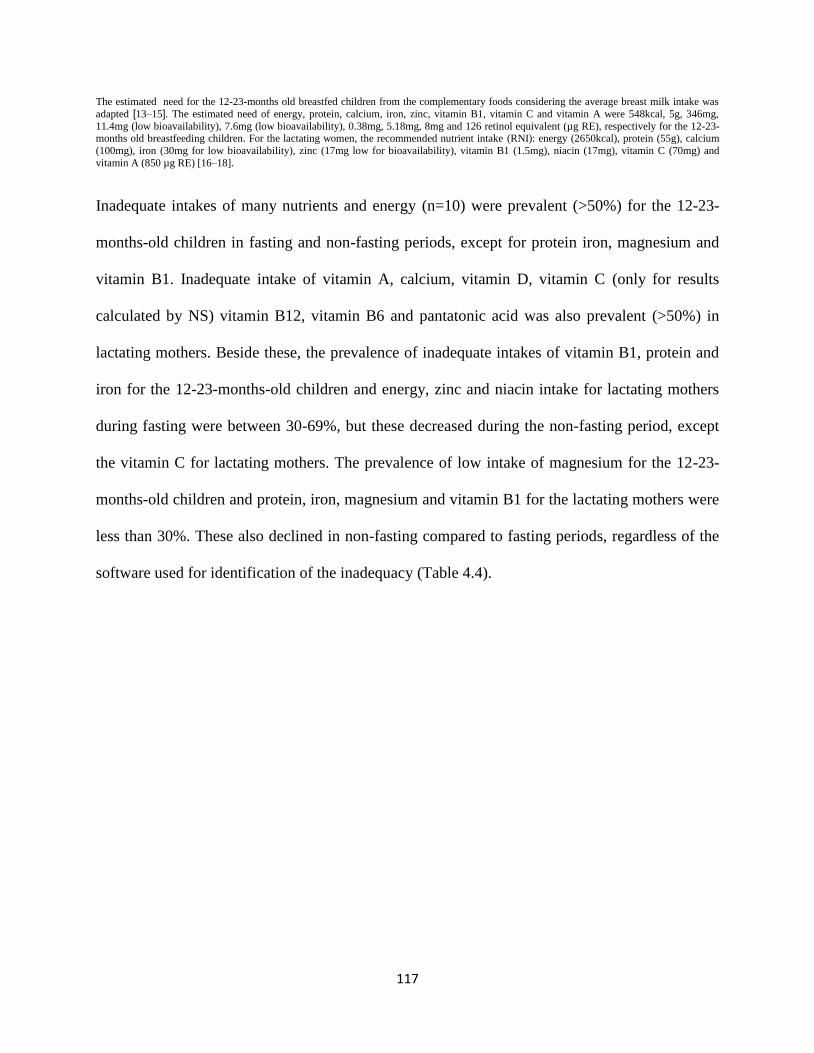
117
The estimated need for the 12-23-months old breastfed children from the complementary foods considering the average breast milk intake was
adapted [13–15]. The estimated need of energy, protein, calcium, iron, zinc, vitamin B1, vitamin C and vitamin A were 548kcal, 5g, 346mg,
11.4mg (low bioavailability), 7.6mg (low bioavailability), 0.38mg, 5.18mg, 8mg and 126 retinol equivalent (µg RE), respectively for the 12-23-months old breastfeeding children. For the lactating women, the recommended nutrient intake (RNI): energy (2650kcal), protein (55g), calcium
(100mg), iron (30mg for low bioavailability), zinc (17mg low for bioavailability), vitamin B1 (1.5mg), niacin (17mg), vitamin C (70mg) and
vitamin A (850 µg RE) [16–18].
Inadequate intakes of many nutrients and energy (n=10) were prevalent (>50%) for the 12-23-
months-old children in fasting and non-fasting periods, except for protein iron, magnesium and
vitamin B1. Inadequate intake of vitamin A, calcium, vitamin D, vitamin C (only for results
calculated by NS) vitamin B12, vitamin B6 and pantatonic acid was also prevalent (>50%) in
lactating mothers. Beside these, the prevalence of inadequate intakes of vitamin B1, protein and
iron for the 12-23-months-old children and energy, zinc and niacin intake for lactating mothers
during fasting were between 30-69%, but these decreased during the non-fasting period, except
the vitamin C for lactating mothers. The prevalence of low intake of magnesium for the 12-23-
months-old children and protein, iron, magnesium and vitamin B1 for the lactating mothers were
less than 30%. These also declined in non-fasting compared to fasting periods, regardless of the
software used for identification of the inadequacy (Table 4.4).
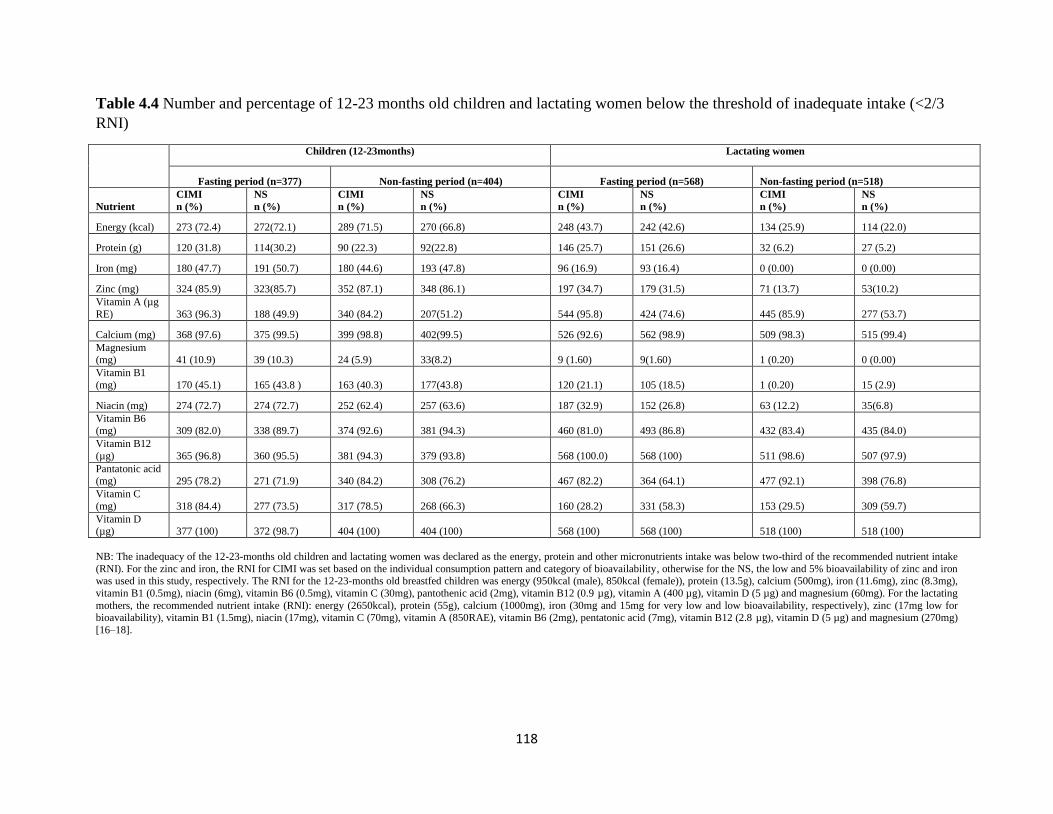
118
Table 4.4 Number and percentage of 12-23 months old children and lactating women below the threshold of inadequate intake (<2/3
RNI)
Children (12-23months) Lactating women
Fasting period (n=377) Non-fasting period (n=404) Fasting period (n=568) Non-fasting period (n=518)
Nutrient
CIMI
n (%)
NS
n (%)
CIMI
n (%)
NS
n (%)
CIMI
n (%)
NS
n (%)
CIMI
n (%)
NS
n (%)
Energy (kcal) 273 (72.4) 272(72.1) 289 (71.5) 270 (66.8) 248 (43.7) 242 (42.6) 134 (25.9) 114 (22.0)
Protein (g) 120 (31.8) 114(30.2) 90 (22.3) 92(22.8) 146 (25.7) 151 (26.6) 32 (6.2) 27 (5.2)
Iron (mg) 180 (47.7) 191 (50.7) 180 (44.6) 193 (47.8) 96 (16.9) 93 (16.4) 0 (0.00) 0 (0.00)
Zinc (mg) 324 (85.9) 323(85.7) 352 (87.1) 348 (86.1) 197 (34.7) 179 (31.5) 71 (13.7) 53(10.2)
Vitamin A (µg
RE) 363 (96.3) 188 (49.9) 340 (84.2) 207(51.2) 544 (95.8) 424 (74.6) 445 (85.9) 277 (53.7)
Calcium (mg) 368 (97.6) 375 (99.5) 399 (98.8) 402(99.5) 526 (92.6) 562 (98.9) 509 (98.3) 515 (99.4)
Magnesium (mg) 41 (10.9) 39 (10.3) 24 (5.9) 33(8.2) 9 (1.60) 9(1.60) 1 (0.20) 0 (0.00)
Vitamin B1
(mg) 170 (45.1) 165 (43.8 ) 163 (40.3) 177(43.8) 120 (21.1) 105 (18.5) 1 (0.20) 15 (2.9)
Niacin (mg) 274 (72.7) 274 (72.7) 252 (62.4) 257 (63.6) 187 (32.9) 152 (26.8) 63 (12.2) 35(6.8)
Vitamin B6 (mg) 309 (82.0) 338 (89.7) 374 (92.6) 381 (94.3) 460 (81.0) 493 (86.8) 432 (83.4) 435 (84.0)
Vitamin B12
(µg) 365 (96.8) 360 (95.5) 381 (94.3) 379 (93.8) 568 (100.0) 568 (100) 511 (98.6) 507 (97.9)
Pantatonic acid (mg) 295 (78.2) 271 (71.9) 340 (84.2) 308 (76.2) 467 (82.2) 364 (64.1) 477 (92.1) 398 (76.8)
Vitamin C
(mg) 318 (84.4) 277 (73.5) 317 (78.5) 268 (66.3) 160 (28.2) 331 (58.3) 153 (29.5) 309 (59.7)
Vitamin D (µg) 377 (100) 372 (98.7) 404 (100) 404 (100) 568 (100) 568 (100) 518 (100) 518 (100)
NB: The inadequacy of the 12-23-months old children and lactating women was declared as the energy, protein and other micronutrients intake was below two-third of the recommended nutrient intake
(RNI). For the zinc and iron, the RNI for CIMI was set based on the individual consumption pattern and category of bioavailability, otherwise for the NS, the low and 5% bioavailability of zinc and iron was used in this study, respectively. The RNI for the 12-23-months old breastfed children was energy (950kcal (male), 850kcal (female)), protein (13.5g), calcium (500mg), iron (11.6mg), zinc (8.3mg),
vitamin B1 (0.5mg), niacin (6mg), vitamin B6 (0.5mg), vitamin C (30mg), pantothenic acid (2mg), vitamin B12 (0.9 µg), vitamin A (400 µg), vitamin D (5 µg) and magnesium (60mg). For the lactating
mothers, the recommended nutrient intake (RNI): energy (2650kcal), protein (55g), calcium (1000mg), iron (30mg and 15mg for very low and low bioavailability, respectively), zinc (17mg low for bioavailability), vitamin B1 (1.5mg), niacin (17mg), vitamin C (70mg), vitamin A (850RAE), vitamin B6 (2mg), pentatonic acid (7mg), vitamin B12 (2.8 µg), vitamin D (5 µg) and magnesium (270mg)
[16–18].
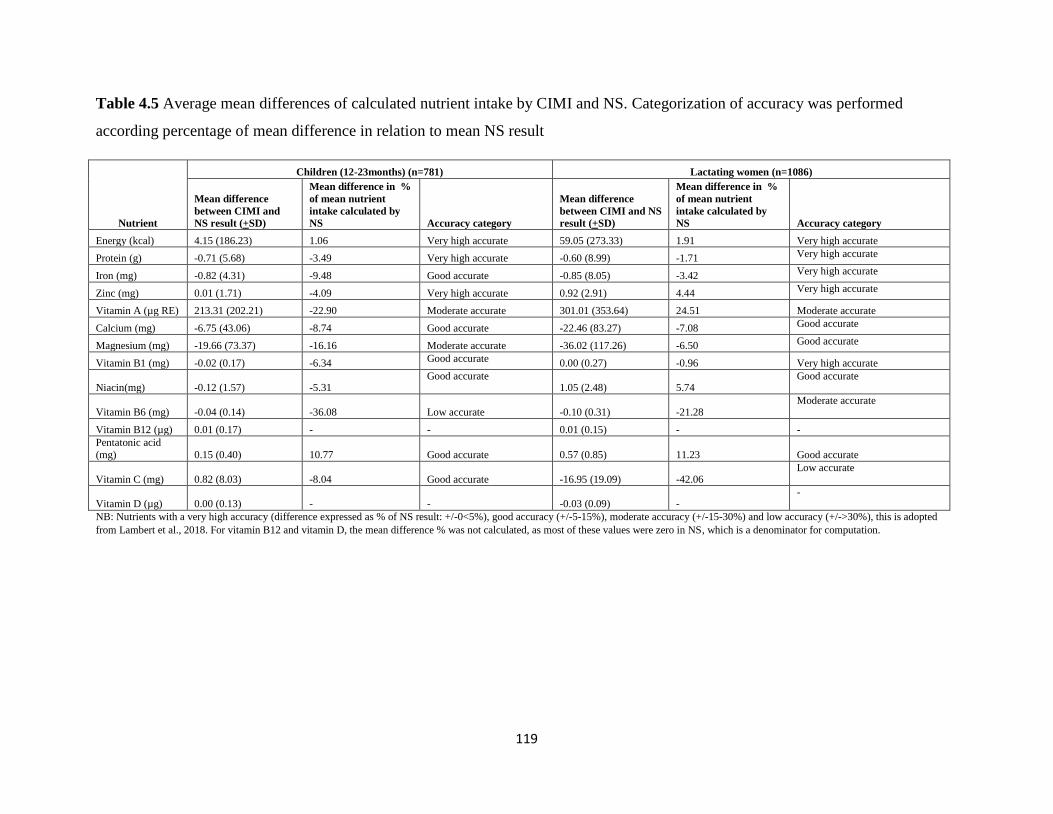
119
Table 4.5 Average mean differences of calculated nutrient intake by CIMI and NS. Categorization of accuracy was performed
according percentage of mean difference in relation to mean NS result
Nutrient
Children (12-23months) (n=781) Lactating women (n=1086)
Mean difference
between CIMI and
NS result (+SD)
Mean difference in %
of mean nutrient
intake calculated by
NS Accuracy category
Mean difference
between CIMI and NS
result (+SD)
Mean difference in %
of mean nutrient
intake calculated by
NS Accuracy category
Energy (kcal) 4.15 (186.23) 1.06 Very high accurate 59.05 (273.33) 1.91 Very high accurate
Protein (g) -0.71 (5.68) -3.49 Very high accurate -0.60 (8.99) -1.71 Very high accurate
Iron (mg) -0.82 (4.31) -9.48 Good accurate -0.85 (8.05) -3.42 Very high accurate
Zinc (mg) 0.01 (1.71) -4.09 Very high accurate 0.92 (2.91) 4.44 Very high accurate
Vitamin A (µg RE) 213.31 (202.21) -22.90 Moderate accurate 301.01 (353.64) 24.51 Moderate accurate
Calcium (mg) -6.75 (43.06) -8.74 Good accurate -22.46 (83.27) -7.08 Good accurate
Magnesium (mg) -19.66 (73.37) -16.16 Moderate accurate -36.02 (117.26) -6.50 Good accurate
Vitamin B1 (mg) -0.02 (0.17) -6.34 Good accurate 0.00 (0.27) -0.96 Very high accurate
Niacin(mg) -0.12 (1.57) -5.31 Good accurate
1.05 (2.48) 5.74 Good accurate
Vitamin B6 (mg) -0.04 (0.14) -36.08 Low accurate -0.10 (0.31) -21.28 Moderate accurate
Vitamin B12 (µg) 0.01 (0.17) - - 0.01 (0.15) - -
Pentatonic acid
(mg) 0.15 (0.40) 10.77 Good accurate 0.57 (0.85) 11.23 Good accurate
Vitamin C (mg) 0.82 (8.03) -8.04 Good accurate -16.95 (19.09) -42.06 Low accurate
Vitamin D (µg) 0.00 (0.13) - - -0.03 (0.09) - -
NB: Nutrients with a very high accuracy (difference expressed as % of NS result: +/-0<5%), good accuracy (+/-5-15%), moderate accuracy (+/-15-30%) and low accuracy (+/->30%), this is adopted
from Lambert et al., 2018. For vitamin B12 and vitamin D, the mean difference % was not calculated, as most of these values were zero in NS, which is a denominator for computation.
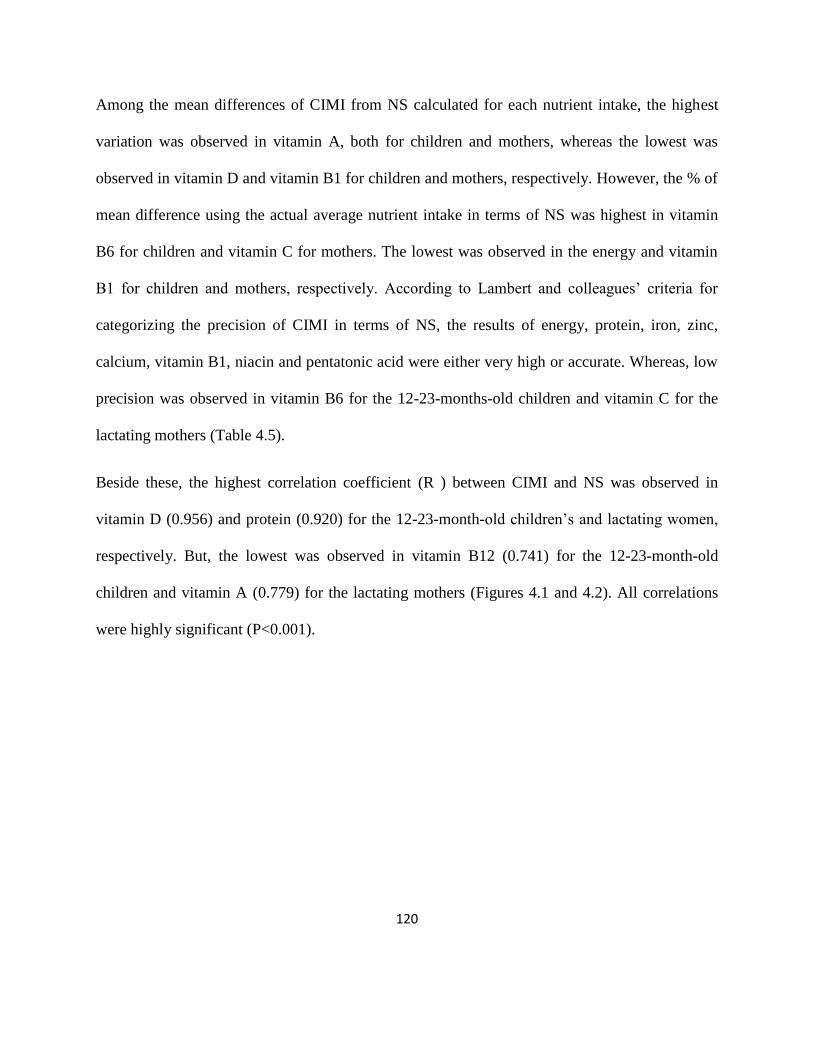
120
Among the mean differences of CIMI from NS calculated for each nutrient intake, the highest
variation was observed in vitamin A, both for children and mothers, whereas the lowest was
observed in vitamin D and vitamin B1 for children and mothers, respectively. However, the % of
mean difference using the actual average nutrient intake in terms of NS was highest in vitamin
B6 for children and vitamin C for mothers. The lowest was observed in the energy and vitamin
B1 for children and mothers, respectively. According to Lambert and colleagues‘ criteria for
categorizing the precision of CIMI in terms of NS, the results of energy, protein, iron, zinc,
calcium, vitamin B1, niacin and pentatonic acid were either very high or accurate. Whereas, low
precision was observed in vitamin B6 for the 12-23-months-old children and vitamin C for the
lactating mothers (Table 4.5).
Beside these, the highest correlation coefficient (R ) between CIMI and NS was observed in
vitamin D (0.956) and protein (0.920) for the 12-23-month-old children‘s and lactating women,
respectively. But, the lowest was observed in vitamin B12 (0.741) for the 12-23-month-old
children and vitamin A (0.779) for the lactating mothers (Figures 4.1 and 4.2). All correlations
were highly significant (P<0.001).

121
Fig. 4.1 Correlation of energy and nutrient intake of Ethiopian women calculated by NS and
CIMI
R=0.909 R=0.920
R=0.862 R=0.862
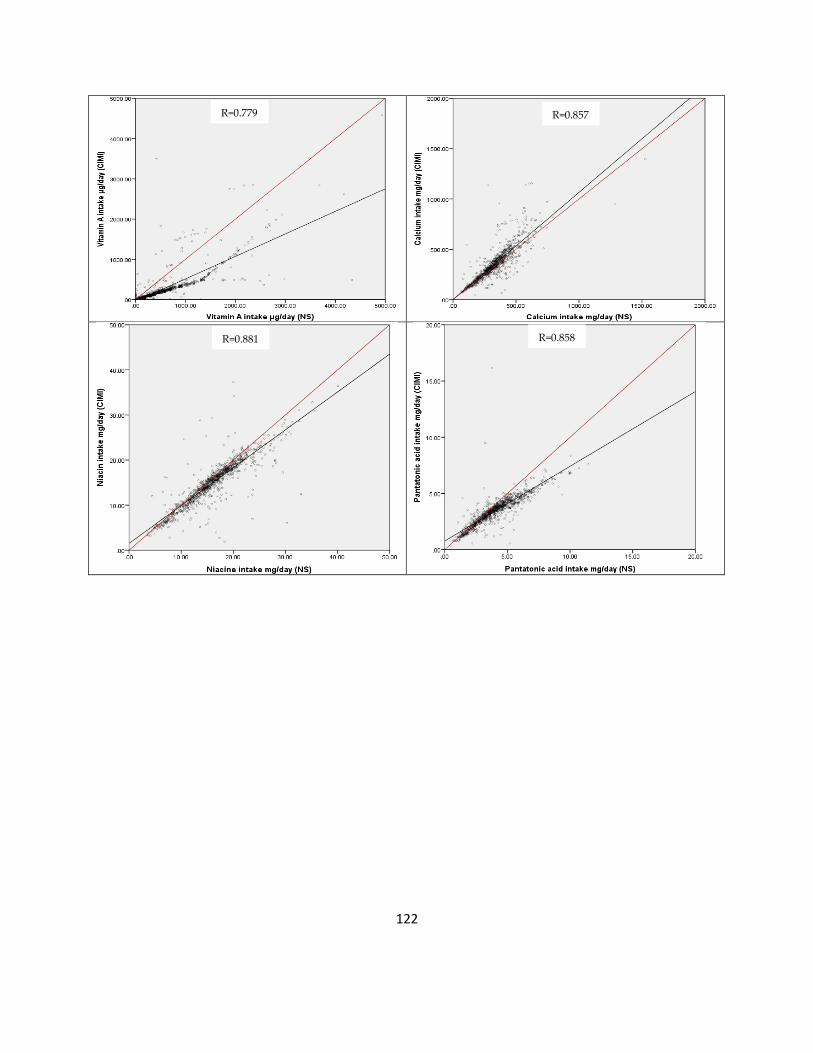
122
R=0.779 R=0.857
R=0.881 R=0.858

123
NB: The red line in these scatter plots is the reference line (y=x; R=1), which means the results produced from the two programs are identical.
The black line represents the regression line of the data pairs calculated by CIMI and NS.
R=0.913 R=0.888
R=0.913 R=0.868
R=0.802 R=0.835
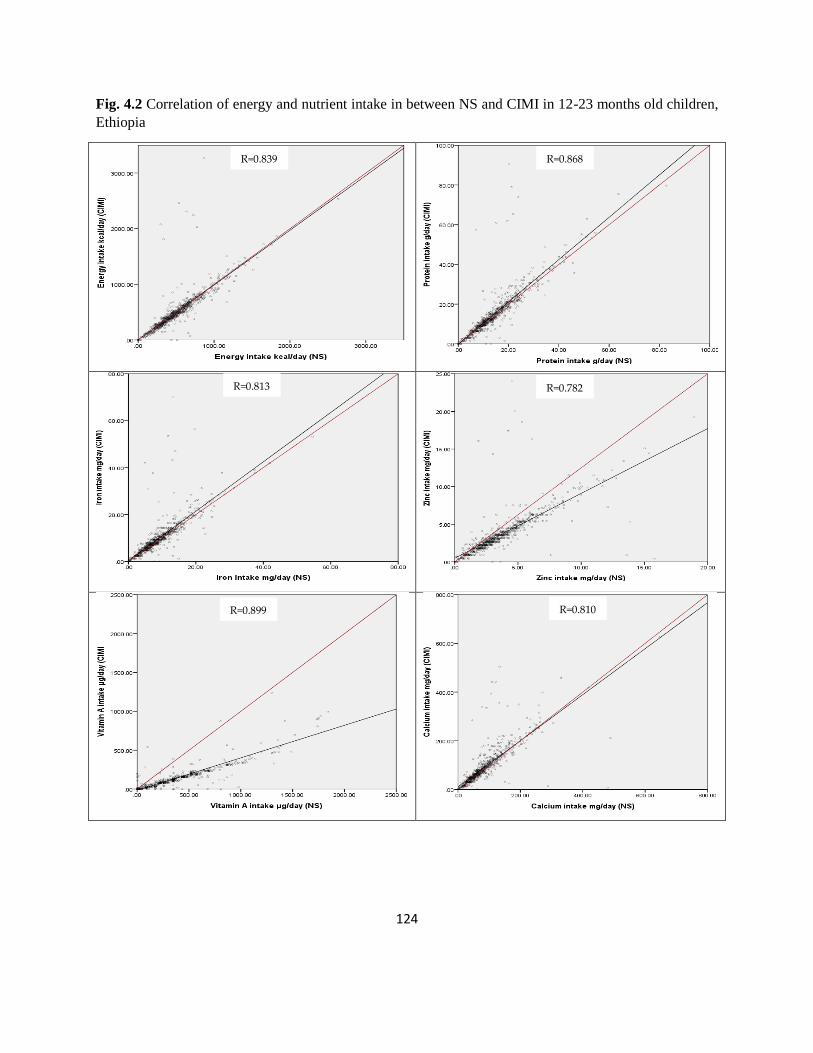
124
Fig. 4.2 Correlation of energy and nutrient intake in between NS and CIMI in 12-23 months old children,
Ethiopia
R=0.839 R=0.868
R=0.813 R=0.782
R=0.899 R=0.810
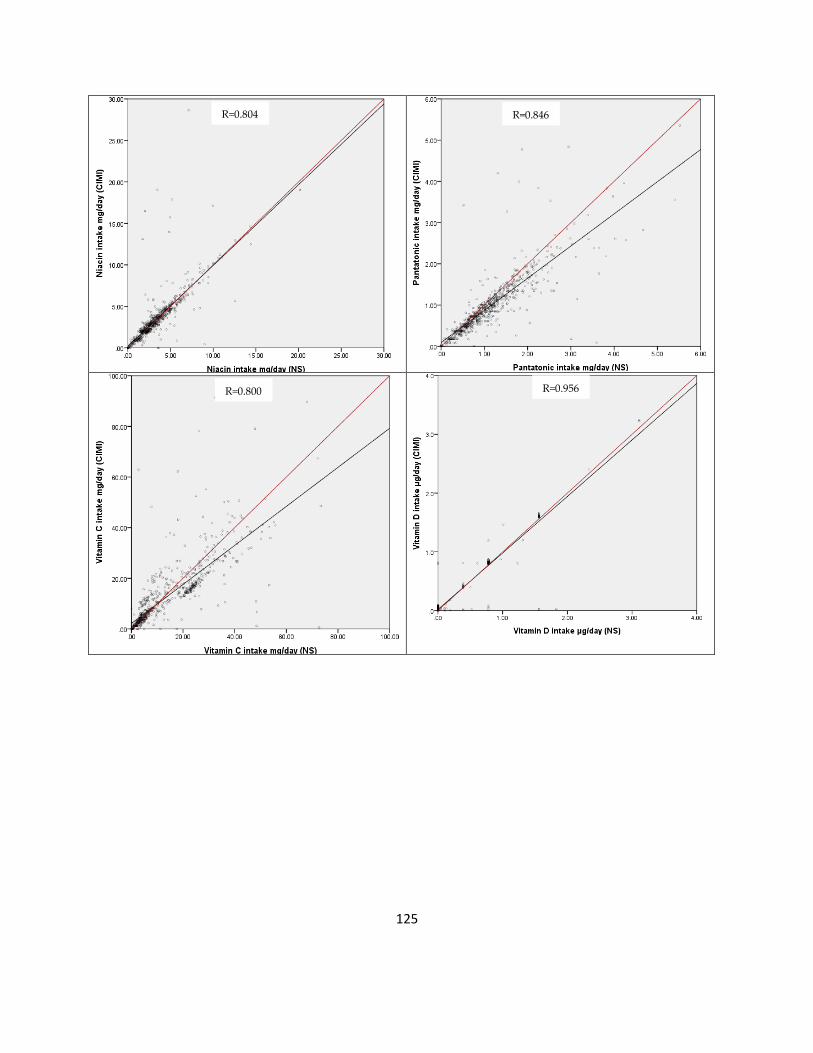
125
R=0.804 R=0.846
R=0.800 R=0.956

126
NB: The red line in these scatter plots is the reference line (y=x; R=1), which means the results produced from the two programs are identical.
The black line represents the regression line of the data pairs calculated by CIMI and NS.
4.4. Discussion
To the best of our knowledge, this is the first study in Ethiopia, which focuses on a) adaptation
and validation of a simple and rapid web-based dietary nutrient intake assessment tool for
Ethiopian population, b) assessment of dietary nutrient and energy intakes of the 12-23-months-
R=0.847 R=0.787
R=0.741 R=0.806

127
old children and their lactating mothers during religious fasting and non-fasting periods in
Northern Ethiopia.
4.4.1. Validation of Calculator for Inadequate Micronutrient Intake (CIMI)
For the first time, CIMI was developed in Indonesia for the Indonesian population [10]. The
CIMI software presented in this study is the second next to Indonesia, which is developed for
Ethiopian population, using commonly consumed Ethiopian foods. Like CIMI developed in
Indonesia, we used the food group approach which considered the amount of food consumed per
capita per day, the nutrient composition of the food items specially the micronutrients that are of
public health importance in Ethiopia (vitamin A, Fe, and Zn) and standard food grouping (e.g.:-
vegetable to vegetable) [9,19–22]. Shape and volume of food items, local utensils or food size or
volume used in local market as standardized local units and varietal differences were included to
create the 31 food groups. For example, chard, lettuce and Ethiopian kale were under ‗green
leaves‘ food group based on their micronutrient contents (Fe, Zn and vitamin A), shape and
because of being vegetables. Likewise, sweet potato, potato, taro, cassava, yam, amicho (boiled
decorticated root part of false banana) and anchote (Coccinia abysinica) are aggregated based
on their shape and natural group into ‗potato and related foods‘ group. Maize and teff are
grouped into two groups each as white and yellow, and white and red, because these grains are
highly consumed by majority of Ethiopians and based on their pro-vitamin A and Fe contents,
respectively [11]. Beside this, assessment of food amounts a slider with 15 intervals, which
considered the minimum and maximum amount estimated to be eaten by the young children and
adult was also considered.

128
Accordingly, the average intake of most nutrients and energy calculated by CIMI and NS were
nearly similar, except for vitamin A, in both the children and lactating women, and vitamin C in
the lactating women, regardless of the periods. Our vitamin A result is in line with previous
CIMI study in Indonesia [10]. The possible explanation for variable vitamin A intake estimation
by CIMI in our case was, the average vitamin A content of the butter and oil food group was
lower than the palm oil, which is one of the item created this group, but was available by the
cooperative enterprises in the present study area and consumed during the fasting and non-
fasting surveys. The availability of different oil types at different time in the country depends on
the massive import oil types by the subsidy of the Ethiopian government. Therefore, deselecting
the unconsumed oil type from this food group will be an important activity for future CIMI use.
The reason for the high vitamin C values of CIMI for the lactating women was due to the great
share (43.8%) of the tomato for the ‗other vegetables` group, but less consumed compared to the
cabbage, which has relatively lower vitamin C increased the average vitamin C content of the
‗other vegetables` group.
Protein, iron, calcium, magnesium, vitamin B1, and B6 intake estimated by CIMI were slightly
higher than NS, in both the study groups. The reason for the high CIMI of protein, iron and
calcium could be due to the consumption of high amount of peas, although peas‘ contribution to
the relevant food group is only 12.4%, which does not represent the real share of peas in this
group. Peas have got a lower content of these nutrients compared to most food items in the
group. Beside this, the intervals to set up the amount with the slider get larger if the consumption
is increasing in most of the food groups in CIMI. Therefore, the selection of the slider either
below or above the estimated amount of the food group will depend on the nearest amount set up
129
in the sliders. So if the amount approaches to the upper slider, then automatically the upper slider
will be selected and these will lead to overestimation of intake of specific nutrients when
compared to NS. The later could also work for magnesium and vitamin B1 in pepper and egg
food groups, respectively. Ethiopian kale, which has got a higher vitamin B6 content than other
vegetables in the ‗green leaves‘ food group, contributed 58.4% for this group. But Ethiopian kale
was less consumed in the study area and this leads to an overestimation of vitamin B6 intake in
CIMI.
The number (percentage) of participants identified as inadequate in nutrients (<2/3 RNI) by
CIMI and NS were similar in most nutrients considered, except for vitamin A for 12-23-months-
old children and lactating women, and vitamin C only for the lactating women, regardless of the
study period. These could be due to the high and low average values of the vitamin A and
vitamin C in the ‗butter and oil`, and ‗other vegetable groups` for individuals than the values in
NS, respectively.
According to Lambert et al. (2018), vitamin A was moderately calculated by CIMI for the 12-23-
months-old children and lactating women. The reason mentioned earlier for variation in the
average values of vitamin A produced by CIMI and NS, leads to higher mean % difference,
which is the criteria for this classification. Likewise, CIMI calculated the vitamin B6 intake with
low and moderate precisions for the 12-23-months-old children and lactating women,
respectively. The possible reason could be the small mean vitamin B6 differences between CIMI
and NS in few individuals that increased their mean difference (%) dramatically (Table 4.5). The
moderate precision of magnesium in the 12-23-months-old children might be related with the
average CIMI of the group which was higher than the commonly consumed pea entered in NS.

130
The low precision in the vitamin C variation could be due to the average vitamin C value of the
‗other vegetables‘ group, which was relatively high because of tomato. Strong correlations
between CIMI and NS were found in all the nutrients and energy for both study groups (Figure
4.1 and 4.2). The correlation coefficients between CIMI and NS of protein, iron, zinc and
vitamin A for the 12-23-months-old children and energy, protein, iron and zinc for lactating
mothers were higher compared with the previous study in Indonesian population [10]. This could
be attributed to the smaller sample size in the Indonesian study. Furthermore, the correlation
coefficients of most nutrients in our study were higher than validation results of CIMI in
Tanzania women, except for energy [12]. In general, our validation study confirmed that CIMI
developed for rural Ethiopian population with commonly consumed Ethiopian foods calculates
the average nutrient intake accurately. Additionally, it identifies the inadequate micronutrient
intake of individuals using FAO/WHO recommendation for nutrient intake (RNI). Unlike other
dietary assessment techniques, CIMI provides result immediately after the interview is
completed, which enables the enumerator to provide immediate feedback to the interviewee and
suggest dietary improvements considering the socio-economic status of the household, culture of
the society, availability of potential and alternative food items in local farms and/or market.
Currently, most of the dietary assessment and intervention studies use diet diversity scores, a
proxy indicator for assessing the dietary quality at household and individual levels [23].
However, this technique only focus on the assessment of diversity of food groups consumed,
because the smaller amount of intake from the food groups will challenge the validity of the diet
diversity score result, as a proxy indicator for micronutrient adequacy of an individual. To
overcome this problem, many studies have used a cutoff of ≥15 g to count the food group as
131
consumed in women in reproductive age [23]. But, still the controversy remains on how
quantification is practical in real qualitative diet diversity assessment technique, unless the diet
diversity data is extracted from other quantitative dietary intake data. Thus, CIMI can replace the
qualitative diet diversity, by producing much more results on the diet quality of an individual,
and overcoming the challenges encountered by DDS. CIMI can also be used in cross-sectional
and/or longitudinal/ intervention studies, in situation where the conventional diet diversity score
is not appropriate or requires the quantitative dietary assessment methods. These indicate that
CIMI developed for Ethiopian population is applicable for dietary micronutrient assessment at
individual level in rural setting. The accumulation of this individual data can provide information
on dietary nutrient intake at population level for designing targeted micronutrient prevention and
intervention activities. In general, CIMI can be an important tool for nutrition and related
researchers, practitioners, policy makers and planners in Ethiopia.
4.4.2. Dietary Nutrient Intakes of 12-23-months-old Children and Lactating Women in
Rural Ethiopia
The median intake of energy, iron, zinc, thiamin, niacin and calcium in this study were below the
estimated need from complementary food for the 12-23-months-old breastfeeding children,
regardless of the study periods. But, the median intake of dietary protein, and vitamin C (only
during non-fasting period) met their needs. These results are in line with previous studies in
different parts of Ethiopia [13,24–26]. The vitamin A intake of the 12-23-months children in the
present study was also above the estimated need and higher than its median intake in the 6-35-
months-old children of Tigray region and other findings, elsewhere in Ethiopia [13,24–27]. This
could be due to the consumption of palm oil fortified with vitamin A for preparation of
132
complementary food as noticed during the survey periods. Furthermore, the prevalence of
inadequate dietary intakes (<2/3 RNI) of zinc was very high (>75%) in the 12-23-months-old
children, followed by vitamin C, energy and niacin (51-75%), and protein, iron, vitamin A and
vitamin B1 (20-50%), respectively. But, the prevalence of low intake of energy, protein, niacin
and vitamin C were decreased during non-fasting compared to fasting period. The finding of
recent investigation in the same study area evidenced that the prevalence of 6-23-months-old
children who fulfilled the minimum acceptable diet (MAD) criteria was 2.3% during fasting and
6.7% during non-fasting period. A study in Libo Kemkem and Fogera districts in Ethiopia
showed that zinc and vitamin A deficiencies were prevalent in the school-age children [28].
Furthermore, a recent national study in Ethiopia revealed that the average dietary zinc intake of
6-35-months-old children from Tigray region and at national level were low [22]. A study
conducted in four African countries including Ethiopia also revealed that anemia, vitamin A and
zinc deficiencies are of public health concern in these countries [29].
In the present study, the median intake of energy, protein, vitamin A, calcium, vitamin C and
niacin (fasting period only) were below the recommended nutrient intake (RNI) for lactating
mothers, but not for iron, zinc and vitamin B1. Except for iron, the intake of energy, protein, zinc
and vitamin A were very close to the values for Tigray region and national average [27]. Our
findings on iron and calcium intake were higher than earlier studies on lactating and pregnant
women in Northern part of Ethiopia [30,31]. These might be due to the fact that food taboos may
be related to a reduction of food intake by mothers during pregnancy. Main reasons for food
taboos are fear of obstetric complications associated with the delivery of a bigger baby,
plastering on the fetal head, fear of abortion, evil eye and fetal abnormality [32–34]. The
133
prevalence of inadequate dietary intake of vitamin A and vitamin C was higher, followed by
energy, zinc, niacin, vitamin B1 and iron. Previous studies in Ethiopian children and women
confirmed that the prevalence of iron, zinc and vitamin A deficiencies was high using blood
biomarkers [35–40]. Except for calcium and vitamin C, the inadequacies were decreased after
the two months lent fasting periods. Therefore, considering the continuously high prevalence of
inadequate intake of vitamin C in both study groups lead to the assumption that consumption of
vitamin C rich foods are chronically low in the study area. Therefore, the deficiency of these
micronutrients is expected to be higher in our study district and further studies using biomarkers
should be done. The possible explanation for this might be related with the low consumption of
fruits, animal source foods including dairy products, root crops like potato, anchote in the study
area [1,2]. Surprisingly, almost all the 12-23-months-old children and lactating mothers did not
take vitamin B12, vitamin D and calcium. Previous national study in Ethiopia found that only
15.1% of non-pregnant women were deficient in vitamin B12 using blood biomarker [35]. The
big difference from our finding could be related to the method of assessment where the serum
total vitamin B12 was used as biomarker, which gives less information in identifying vitamin
B12 deficiency [41,42]. Therefore, urgent investigation on the deficiency of vitamin B12 should
consider the biomarker like methyl malonic acid or Holotranscobalamin in urine and blood
samples, to understand the situation in the study area more precisely[42,43]. Likewise, earlier
study in Ethiopian non-pregnant women showed that there was no participant that ever
consumed vitamin D–rich foods, fortified foods, or dietary supplements, and as a result Vitamin
D insufficiency is a serious problem, even though Ethiopia is located near the Equator [44].
Highest prevalence of inadequate intake of calcium was also found in studies conducted in
134
Gondar (90.4%), Butajira (99%) districts, and at national (89-96%) level [30,45,46]. Therefore,
the proposed universal calcium supplementation in Ethiopia should be implemented [46].
Therefore, nutrition sensitive agriculture in both plant and livestock production should be
promoted and implemented in sustainable manner.
Previous studies in the same study population and study area evidenced that the dietary diversity
score were low in general, lower in the lent fasting compared to non-fasting period, both in the
lactating mothers and their 6-23-months-old children [1,2]. In line with this, our present study
confirmed that dietary nutrient intake (DNI) is lower in lent fasting compared to non-fasting
period, both in the young children and lactating women. These indicate that, dietary nutrient
intake in the district was sub-optimal, which might be one of the multi-faceted cause for the
highest prevalence of maternal and child undernutrition in the study district, Tigray region and
Ethiopia at large (Table 4.2).
Our present study has many strengths. Among these, the average DNI of the young children and
women and the prevalence of inadequate intake of most important nutrients were addressed with
a large sample size in rural Ethiopia. The longitudinal study design considered the longest
religious fasting period among the seven official Ethiopian Orthodox fasting periods, whereas
the non-fasting period was the fifty days after the fasting period. For the first time in Ethiopia,
dietary assessment software is developed using commonly consumed foods in rural Ethiopia.
Additionally, the validity of this software was assessed using groups (children and women)
vulnerable for malnutrition in religious fasting/non-fasting periods. However, only one 24-hr
dietary recall was used for this assessment, and the study was conducted in only one
administrative region in Ethiopia, out of the eleven, are limitations of this study.
135
4. 5. Conclusions
Our study indicated that except protein and magnesium, the prevalence of inadequate intake
(<2/3 RNI) of energy and most micronutrients was high in the 12-23-months-old children.
Likewise, the prevalence of inadequate intake of vitamin A, calcium, vitamin B6, vitamin B12,
pentatonic acid and vitamin C were also high in the lactating mothers. However, these high
prevalences of inadequacy in energy and macro-and micronutrients in the 12-23-months-old
children and lactating mothers were more affected during the lent fasting period. Therefore, the
present nutrition intervention should give more attention on diet improvement activities of the
children and women especially during religious fasting periods. Alarmingly, almost all the 12-
23-months-old children and lactating mother‘s in the study area obtained below two-third of the
RNI for vitamin B12, vitamin D and calcium from their diet. Therefore, urgent further
investigation should be done for immediate public health nutrition intervention in the district, in
addition to the implementation of the proposed universal calcium supplementation in Ethiopia.
Our result also confirmed that CIMI developed for rural Ethiopian population estimates the
average nutrient intake accurately. It also identifies inadequate micronutrient intake of
individuals using FAO/WHO recommended nutrient intake (RNI) directly after the interview.
This enables the enumerator to provide immediate nutrition education and suggest context based
dietary improvements, unlike other dietary assessment techniques. CIMI can also replace the
DDS, a qualitative dietary assessment tool, by overcoming the drawback, which is related with
counting insignificant intake in the score and by producing more results. CIMI can also be used
in cross-sectional and/or longitudinal/ intervention studies, in situation where the conventional
136
diet diversity is not appropriate or requires the quantitative dietary assessment methods.
Therefore, CIMI can be used for dietary assessment survey in Ethiopia.
Funding: German Federal Ministry for Economic Cooperation and Development (BMZ).
Acknowledgments: We, the authors would like to thank the mothers and children who are
participated in this study. We would like also to forward our felt thank to the data collectors,
community facilitators and data encoders involved during the course of this study. Last, but not
least, the first authors would like to extend the appreciation the generous financial support of
German Federal Ministry for Economic Cooperation and Development (BMZ) for his PhD study
at University of Hohenheim, Germany.
Conflicts of Interest: No conflict of interest among authors.
4.6. References
1. Desalegn, B,B.; Lambert, C.; Riedel, S.; Negese, T.; Biesalski, H.K. Ethiopian orthodox
fasting and lactating mothers: Longitudinal study on dietary pattern and nutritional status
in rural tigray, Ethiopia. Int. J. Environ. Res. Public Health 2018, 15 (8), 1767.
2. Desalegn, B.; Lambert, C.; Riedel, S.; Negese, T.; Biesalski, H.K. Feeding Practices and
Undernutrition in 6–23-Month-Old Children of Orthodox Christian Mothers in Rural
Tigray, Ethiopia: Longitudinal Study. Nutrients 2019, 11(1), 138.
3. Hirvonen, K.; Taffesse, A.S.; Worku, H.I. Seasonality and household diets in Ethiopia.
Public Health Nutr. 2016,19(10), 1723–30.
4. Kumera, G.; Tsedal, E.; Ayana, M. Dietary diversity and associated factors among

137
children of Orthodox Christian mothers/caregivers during the fasting season in Dejen
District, North West Ethiopia. Nutr Metab. 2018, 15, 16.
5. CSA. Population and Housing Census of Ethiopia. 2007.
6. Bazzano, A. N.; Potts, K. S.; Mulugeta, A. How do pregnant and lactating women , and
young children , experience religious food restriction at the community level ? A
qualitative study of fasting traditions and feeding behaviors in four regions of Ethiopia.
PLoS ONE 2018, 13(12), e0208408. https://doi. org/10.1371/journal.pone.0208408
7. Bhandari. S.; Banjara, M.R. Micronutrients Deficiency, a Hidden Hunger in Nepal:
Prevalence, Causes, Consequences, and Solutions. Int. Sch. Res. Not. 2015, Volume 2015,
Article ID 276469. Available from: http://www.hindawi.com/journals/isrn/2015/276469/
8. Biesalski, H.K.; Jana, T. Micronutrients in the life cycle: Requirements and sufficient
supply. NFS J. 2018, 1, 1–11.
9. Central Statistical Agency (CSA). Ethiopia Demographic and Health Survey 2016;
Central Statistical Agency:Addis Ababa, Ethiopia; ICF International Calverton: Calverton,
MD, USA, 2017; p. 551.
10. Jati, I.R.A.P.; Widmer, C.; Purwestri, R.C.; Wirawan, N.N.; Gola, U.; Lambert, C.;
Biesaslki, H.K. Design and validation of a program to identify inadequate intake of iron,
zinc, and vitamin A. Nutrition 2014, 30, 1310–1317. Available from:
http://dx.doi.org/10.1016/j.nut.2014.03.015
11. Abebe, Y.; Bogale, A.; Hambidge, K.; Stoecker, J.; Bailey, K.; Gibson, R. Phytate, zinc ,
138
iron and calcium content of selected raw and prepared foods consumed in rural Sidama ,
Southern Ethiopia, and implications for bioavailability. J. Food Compos. Anal. 2007, 20,
161–168.
12. Lambert, C.; Eleraky, L.; Mbwana, H.; Kinabo, J.; Biesalski, H.K.; Riedel, S, et al.
Validation of a food group based nutrition software to assess nutrient intake in Tanzania.
In: Global food security and food safety: The role of universities. Ghent, Belgium: Ghent
University; 2018. p. 2018.
13. Gibson, R.S.; Abebe, Y.; Hambidge, K.M.; Arbide. I.; Teshome, A.; Stoecker, B.J.
Original Article Inadequate feeding practices and impaired growth among children from
subsistence farming households in. Matern Child Nutr. 2009, 5, 260–75.
14. Dewey, K.G.; Brown, K.H. Update on technical issues concerning complementary feeding
of young children in developing countries and implications for intervention programs.
Food Nutr. Bull. 2003, 24 (1), 5–28.
15. WHO. Complementary feeding of young children in developing countries: a review of
current scientific knowledge. Geneva, Switzerland, 1998; p. 248.
16. FAO/WHO. Vitamin and mineral requirements in human nutrition : report of a joint
FAO/WHO expert consultation, Bangkok, Thailand, 21–30 September 1998, 2004; p.362.
17. FAO/WHO/UNU. Human energy requirements: report of a joint FAO/WHO/UNU expert
consultation. Rome, Italy, 2001; p.103.
18. FAO/WHO/UNU. Protein and amino acid requirements in human nutrition : report of a

139
joint FAO/WHO/UNU expert consultation. Geneva, Switzerland, 2002, 2007; p.284.
19. Tessema, M.; Groote, H. De.; Brouwer.,I.D.; Feskens, E.J.M.; Belachew, T.; Zerfu, D.; et
al. Soil Zinc Is Associated with Serum Zinc But Not with Linear Growth of Children in
Ethiopia. Nutrients 2019, 11, 221.
20. Tezera, R.; Sahile, Z.; Yilma, D.; Misganaw, E.; Mulu, E. Prevalence of anemia among
school-age children in Ethiopia : a systematic review and meta-analysis. Systematic
Reviews 2018, 7, 80.
21. Demissie, T.; Ali, A.; Mekonen, Y.; Haider, J.; Umeta, M. Magnitude and distribution of
vitamin A deficiency in Ethiopia. Food and Nutrition Bulletin 2010, 31(2), 234–41.
22. Ayana, G.; Moges, T.; Samuel, A.; Asefa, T.; Eshetu, S.; Kebede, A. Dietary zinc intake
and its determinants among Ethiopian children 6–35 months of age. BMC Nutrition 2018,
4(1), 30.
23. FAO and FHI 360. Minimum Dietary Diversity for Women A Guide to Measurement.
Rome, 2016; p.82.
24. Mesfin, A.; Henry, C.; Girma, M.; Whiting, S.J. Use of pulse crops in complementary
feeding of 6-23-month-old infants and young children in Taba Kebele, Damot Gale
District, Southern Ethiopia. J. Public Health Africa 2016, 6(1), 1–6.
25. Baye, K.; Guyot, J.P.; Icard-Vernière, C.; Mouquet-Rivier, C. Nutrient intakes from
complementary foods consumed by young children (aged 12-23 months) from North
Wollo, northern Ethiopia: the need for agro-ecologically adapted interventions. Public
140
Health Nutr. 2013, 16(10), 1741–50.
26. Mengistu, G.; Moges, T.; Samuel, A.; Baye, K. Energy and nutrient intake of infants and
young children in pastoralist communities of Ethiopia. Nutrition 2017, 41, 1–6.
27. Ethiopian Public Health Institute (EPHI). Ethiopia National Food Consumption Survey,
2013; p.95.
28. Herrador, Z.; Sordo, L.; Gadisa, E.; Moreno, J.; Nieto, J.; Benito, A.; et al. Cross-sectional
study of malnutrition and associated factors among school aged children in rural and
urban settings of fogera and libo kemkem districts, ethiopia. PLoS One. 2014, 9(9),
e105880.
29. Harika, R.; Faber, M.; Samuel, F.; Mulugeta, A.; Kimiywe, J.; Eilander, A. Are Low
Intakes and Deficiencies in Iron, Vitamin A, Zinc, and Iodine of Public Health Concern in
Ethiopian, Kenyan, Nigerian, and South African Children and Adolescents? Food Nutr
Bull. 2017, 38 (3), 405–27.
30. Amare, B.; Moges, B.; Moges, F.; Fantahun, B.; Admassu, M. Nutritional status and
dietary intake of urban residents in Gondar , Northwest Ethiopia. BMC Public Health
2012, 12, 752.
31. Haileslassie, K.; Mulugeta, A.; Girma, M. Feeding practices, nutritional status and
associated factors of lactating women in Samre Woreda, South Eastern Zone of Tigray,
Ethiopia. Nutr. J. 2013, 12(1), 1.
32. Biza, Z.N. Food Taboos and Misconceptions Among Pregnant Women of Shashemene

141
District, Ethiopia, 2012. Sci.J. Public Heal. 2015, 3(3), 410.
33. Zerfu, T.A.; Umeta, M.; Baye, K. Dietary habits, food taboos, and perceptions towards
weight gain during pregnancy in Arsi, rural central Ethiopia: a qualitative cross-sectional
study. J. Health Popul. Nutr. 2016, 35 (1), 22.
34. Getnet, W, Aycheh W, Tessema T. Determinants of Food Taboos in the Pregnant Women
of the Awabel District , East Gojjam Zone , Amhara Regional State in Ethiopia. Adv
Public Heal. 2018;2018:6.
35. Ethiopian Public Health Institute (EPHI). Ethiopian National Micronutrient Survey
Report. Addis Ababa, Ethiopia, 2016; p.126.
36. Herrador, Z.; Sordo, L.; Gadisa E, Buño A, Gómez-Rioja R, Iturzaeta, J.M.; et al.
Micronutrient deficiencies and related factors in school-aged children in ethiopia: A cross-
sectional study in Libo Kemkem and Fogera Districts, Amhara Regional State. PLoS One
2014, 9(12), 1–20.
37. Lebso, M.; Anato, A.; Loha, E. Prevalence of anemia and associated factors among
pregnant women in Southern Ethiopia: A community based cross-sectional study. PLoS
One 2017, 12(12), 1–11.
38. Gebremedhin, S.; Enquselassie, F.; Umeta, M. Prevalence of prenatal zinc deficiency and
its association with socio-demographic, dietary andhealth care related factors in Rural
Sidama, Southern Ethiopia: A cross-sectional study. BMC Public Health 2011, 11, 898.
39. Gebreselassie, S.G.; Gase, F.E.; Deressa, M.U. Prevalence and Correlates of Prenatal

142
Vitamin A Deficiency in Rural Sidama , Southern Ethiopia. J. Heal. Popul. Nutr. 2013,
31(2), 185–94.
40. Gebremedhin, S; Enquselassie, F.; Umeta, M. Prevalence and Correlates of Maternal
Anemia in Rural Sidama, Southern Ethiopia. Afr. J. Reprod. Health. 2014, 18, 44–53.
41. Herrmann, W.; Obeid, R. Utility and limitations of biochemical markers of vitamin B12
deficiency. Eur. J. Clin. Invest. 2013, 43, 3, 231–7.
42. Hannibal, L.; Lysne, V.; Behringer, S. Biomarkers and Algorithms for the Diagnosis of
Vitamin B 12 Deficiency. Front. Mol. Biosci. 2016, 3, 27.
43. Kwok, T.; Cheng, G.; Lai, W.K.; Poon, P.; Woo, J.; Pang, C. P. Use of Fasting Urinary
Methylmalonic Acid to Screen for Metabolic Vitamin B12 Deficiency in Older Persons.
Nutrition 2004, 20, 764-768.
44. Gebreegziabher T, Stoecker BJ. Vitamin d insufficiency in a sunshine-sufficient area:
Southern ethiopia. Food Nutr Bull. 2013;34[4]:429–33
45. Asayehu, T.T.; Lachat, C.; Henauw, S. D.; Gebreyesus, S.H. Dietary behaviour, food and
nutrient intake of women do not change during pregnancy in Southern Ethiopia. Matern
Child Nutr. 2017, 13, e12343.
46. Tesfaye, B.; Sinclair, K.; Wuehler, S.E.; Moges, T.; De-regil, L.M.; Dickin, K.L.
Applying international guidelines for calcium supplementation to prevent pre-eclampsia :
simulation of recommended dosages suggests risk of excess intake in Ethiopia. Public
Health Nutr. 2018, 22(3), 531–41.

143
Chapter 5
General discussion

144
5. General discussion
In this chapter, the core findings on the dietary pattern and undernutrition of lactating women
(underweight) and 6-23-months-old children (underweight, wasting and stunting) in relation with
the Ethiopian Orthodox lent fasting and non-fasting periods, considering the fasting status of
lactating mothers are discussed. The factors associated with undernutrition of the lactating
mothers and their breastfeeding 6-23-months-old children are also dealt. Furthermore, the trend
on estimated dietary energy and macro- and micronutrients intake and the prevalence of
inadequacy of the lactating mothers and their 12-23-months-old children between/during fasting
and non-fasting periods are discussed. Moreover, the development of CIMI app and the
validation of the results in comparison with an established nutrition assessment software called
NutriSurvey are discussed. Finally, the conclusion of the whole study is also conferred.
5.1. Undernutrition in Lactating Women and their 6-23-Months-Old Children
5.1.1. Prevalence of undernutrition in lactating women and their 6-23-months-old children
In low and middle income countries, undernutrition in mothers and their children persists
as an inescapable and devastating condition [1]. It is also the principal cause among the total
morbidity, mortality and disability-adjusted-life-years. Maternal undernutrition is an independent
factor of the nutritional status of their children. Earlier studies in different countries have shown
that mothers who were short (<145 cm) and had low body mass index were linked with low birth
weight (LBW) of their children, increased offspring mortality, underweight, stunting during the
childhood, and these undernutrition problems appear later at the adulthood [2–5]. Likewise,
studies elsewhere, in Ethiopia also confirmed that maternal undernutrition is associated with
145
child birth outcome, stunting and underweight [6–9]. The reason for some of the cases could be,
as the woman is shorter, then the storing of protein and energy is expected to reduce and have
smaller size of reproductive organs and pelvis diameter. These, could limit the intra-uterine
growth of the fetus, and later the growth of an infant by reducing the quantity and quality of
breast milk, as a result a stunted child [10]. In the present study, the prevalence of short maternal
height (< 145cm) was 1.4% (Chapter 2, Table 2.4), which was lower than previous findings in
Tigray region and national average, in Ethiopia [11–13]. Similarly, the prevalence of
underweight in the lactating mothers was 32.6-32.8% in the study area, which was lower than
results reported in earlier studies in Ethiopia [13–15]. But, alarmingly, this prevalence was very
high (51%) in fasting lactating mothers compared to the 25% prevalence in non-fasting mothers
(Chapter 2, Table 2.4). The later finding was comparable with results of earlier studies in
lactating mothers living in mid-land agro-ecology of North Ethiopia [15]. At the same time, the
average body mass index (BMI) values of the fasting mothers was lower compared to non-
fasting group, which is consistent with the findings of studies conducted on Greek Orthodox
Christians [16]. This could be related to the decreased number of meals, resulting from lower
calorie intake in fasting people compared to non-fasting during fasting days [10,17].
In addition to the very high prevalence of underweight in fasting mothers found in our
study, the prevalence of wasting, underweight and stunting were 4.0-4.8%, 11.7-15.7% and 31.6-
33.7% in the 6-23-months-old children of the study area (Chapter 3, Table 3.2). Our findings
were lower than earlier findings for the Tigray region and national prevalence‘s of the last
Demographic and Health Survey (DHS) in Ethiopia. According to Ethiopian DHS (2016), the
prevalence of stunting and underweight decreased from 58% and 41% in 2000 to 38% and 24%,
146
with only 2% decrease in wasting in 16 years‘ interval, at national level, which was the aggregate
for the regions including Tigray [13]. These trends in reduction of undernutrition indicated that
nutritional status of Ethiopia children is improving, although the existing prevalence is
unacceptably high. The present study also showed that the average z-scores of stunting (LAZ),
underweight (WAZ) and wasting (WLZ) of the children of the fasting mothers were significantly
lower compared to the non-fasting group (Chapter 3, Table 3.5). Additionally, the average z-
scores of WAZ of children of both fasting and non-fasting mothers showed improvement in non-
fasting period after the lent fasting period (Chapter 3, Table 3.6). These indicated that fasting
affect the nutritional status of women at lactation, and it also impaired the nutritional status of
their breastfeeding children. Furthermore, during the long fasting period, the nutritional status of
the children was also affected, regardless of their mother fasting status.
5.1.2. Factors associated with undernutrition of lactating women and their 6-23-months-old
children
Maternal and child undernutrition is the problem in the community caused by several factors of
multi-dimensional nature. According to UNICEF conceptual framework of undernutrition, the
immediate causes are inadequate intake and disease condition of an individual, whereas, the long
term causes are household food insecurity, inadequate care, unhealthy household environment
and lack of health services and shortage of income leading to poverty at the household and
community level, and the basic causes for undernutrition are closely linked with social, political
and economic basis of the society [1,18]. Accordingly, lots of efforts have been exerted in
separate ways for long time, but the outcome was far below the global targets by most of the
countries. As a result, fighting undernutrition shifted its focus from the narrow approach of
147
undernutrition to multi-sectoral approach using multi-sectoral forces to synergize the efforts and
accelerate the reduction of undernutrition in different countries and worldwide [19]. Therefore,
nutrition is the core of the sustainable development goal (SDG), and it is a vital way for
achieving the 12 SDGs out of the 17. Even, the remaining 5 also contribute for the improvement
of nutrition worldwide [19]. In this regard, the government of Ethiopia has been doing a lot of
activities using a multi-sectoral approach by integrating different national sector ministries. But,
undernutrition as a public health problem still remains, due to inadequate commitment and lack
of conducive structure in government system. As a result, the SEQOTA declaration, which needs
a strong and high level commitment of government, with a goal of ending undernutrition by
2030, under the National Nutrition Program II was launched [19,20]. This goal is planned to be
achieved through integrating community development in agriculture, health, nutrition, education,
water, sanitation and hygiene and social protection activities [19]. However, our findings urged
the involvement of religious institution in the implementation of multi-sectoral approach to
accelerate reduction of undernutrition and achieve the goal set in 2030. For example, about one-
third of lactating mothers included in our study fasted during their pregnancy and lactation
periods (Chapter 2, Table 2.2), which is slightly lower than earlier finding (38%) in pregnant
mothers of Shashemene district in Ethiopia [21]. Mothers who were fasting during their
pregnancy and lactation periods in this study had 1.7 and 2.9 times more odds to be underweight
than respective none fasting groups during the same periods, respectively (Chapter 2, Table 2.3).
Likewise, children of fasted mothers during the pregnancy and lactation period were also more
exposed to undernutrition (stunting, underweight, and wasting (only during lactation)) than those
children whose mothers did not fast in the same periods (Chapter 3, Table 3.3). These show that
148
fasting during pregnancy and lactation periods of the mothers affects, not only the nutritional
status of mothers, but also the health and nutritional status of their fetus and/or breastfed child
[10,22]. Earlier studies in sub-Saharan African including Ethiopia and Asian countries confirmed
that younger mothers and children between 13-23-months-old had a higher probability of being
underweight, and underweight and stunted compared to older and children between 6-12 months
of age, respectively [13,23–26]. The later (underweight and stunted) might be related with the
contamination of complementary food coupled with poor nutritionally quality, which is mainly
cereal based food in Tigray region, in Ethiopia [27]. Similarly, mothers whose children were 13-
18 months old were more likely to be underweight compared to those who had children between
6-12 months old, which is in line with the result found in a study conducted by Hailselassie and
his colleagues [12]. The possible reasons could be, as the child becomes older his/her nutritional
requirements increases, which is also supported by the extra energy expenditure related with
child care, and no increase in the food intake, which is even aggravated by the decreased intake
of the mother [10]. Mothers who experienced any illness in the last four weeks preceding our
lent fasting survey had higher odds of being underweight compared to healthy lactating mothers,
which is in line with another study conducted in Limu district of Southern Ethiopia [28]. Related
with this, about one-third of the lactating mothers were living in households with non-improved
water source. This was also associated with increased odds of underweight compared to mothers
living in households with an improved water source for the household consumption. This is
basically due to frequent illness related to water borne diseases and contamination. Illness
usually affects the appetite of an individual and decreases food intake and also absorption of
nutrients. It may also change the metabolism, and as a result increase the nutrient requirements
149
[10]. Mothers who were living with relatives‘ /parents grandfather was the decision maker for
the income, and received aid in the form of food and/or cash and/or in kind before our fasting
survey and were more likely to be underweight than mothers living in households, the income
decision was her husband and not had any aid experience. The former could be due to the fact
that sharing a household income to more family members or due to decreased working power
and resulted in lower income, which is related with loss of father or divorce or it might be related
to living in households headed by the grandfathers. This affects usually young mothers, which is
associated with underweight in this study. Furthermore, it could be related to an extended family,
and given the allocation of food priority given to the children, which could lead to reducing of
the serving size of the meal or skipping the meal by mothers [29]. Households experiencing aid
are most of the time food insecure and don‘t have farming land or sufficient household income,
which affect quality of food of household members, especially children and women, could be the
reason for the presence of more underweight women in this households. Mothers who were
living in households who did not own chicken during the survey were more exposed to
underweight compared to their counterparts. Earlier study in three African countries indicated
that households owning livestock had lower prevalence of child stunting than those without
livestock [30]. Therefore, in general promotion of animal husbandry could improve the low
consumption of animal source food in the study area.
In addition to these, studies in other low and mid-income countries and Ethiopia showed that
maternal educational status was a predictor for childhood wasting [13,25,31–34]. In line with
this, our study confirmed that maternal illiteracy was associated with childhood wasting and
150
stunting. Therefore, improving the education status of the mother is one of the important
interventions for reduction of child undernutrition in the study district.
Maternal occupation was also one of the predictor variables of child underweight in our study.
Compared to children whose mothers were housewives, children born of farmer mothers were
more exposed to underweight. This could be due to high work load and absence from home,
which leads to provision of less time for child care. Additionally, expending more energy on
farming activity might cause poor appetite of mothers reduce the quantity and quality of breast
milk produced. Beside these, children who were living in households without toilet and who
were not fed colostrum after their birth were more likely to be stunted compared to those who
were living in households owning toilet and did not take colostrum. The potential reason for the
first case could be the infection related with pre-lacteal foods, which was associated with child
stunting in a study conducted in Ethiopia [35]. Due to absence of toilet in households, open
defecation increases the risk of frequent diarrhea episodes, this affects the nutritional status of
children [23]. For these, promoting health education by relevant institutions on the importance of
colostrum feeding during the antenatal care should be provided. Strengthening the construction
of low cost latrine through the existing health extension package should be continued.
5.2. Feeding Practices and Nutrient Intake of Lactating Women and their 6-23-Months-Old
Children
Ensuring the recommended diversification of diet and number of meals in a day to day life of an
individual is an important component for supplying energy, macro- and micronutrients in
required amount to fight against maternal and child undernutrition [1,36]. In this regard, mothers
are recommended to take at least two additional meals during their lactation period, from at least
151
five defined food groups out of ten, in a day [37,38]. Similarly, if a 6-23-months-old child eats
from at least four food groups in his/her daily meals, then he/she fulfills the minimum diet
diversity (MDD). This should be obtained from two or more meals (MMF) if he/she is 6–8
months old and three or more for 9–23 months for the breastfeeding children. Therefore, the
minimum acceptable diet (MAD), a combination of both the MDD and MMF criterion, leads to
appropriate growth and development of infant and young children [39].
In this survey, two-thirds of the mothers (65.4%) did not change the food intake during their
lactation period. Even worse, one-third of lactating mothers ate less than three times during
fasting period, which is lower than the expected daily three meals of a normal adult in real
context. Comparable finding was observed in a study conducted in lactating women of Samre
district in North Ethiopia [12]. However, the prevalence of those mothers who had less than three
meals in a day was reduced to 8.4% in the non-fasting period in this survey. But, the number of
meals eaten both by the fasting and non-fasting mothers were improved in the non-fasting period
after the two months of lent fasting. Therefore, further study should be done for understanding
how the non-fasting mothers` were affected in this regard. Likewise, three out of four children
from fasting and non-fasting mothers ate the minimum number of meals recommended, during
the fasting and non-fasting periods, which was in line with studies conducted in the northern and
southern part of Ethiopia [40,41].
In this study, most of the mothers had a diet from a maximum of three food groups during the
fasting period, regardless of their fasting status. However, the consumption of diet from more
diversified food groups were increased during the non-fasting period (Chapter 2, Table 2.4). This
is because the consumption of animal source foods (ASFs) and the number of meals eaten during
152
the non-fasting period was increased. As a result, the energy, macro- and micronutrients intake
were increased, although the prevalence of inadequacy of these energy and micronutrients
remain higher, except iron, magnesium, vitamin B1 and niacin. However, almost all the lactating
mothers and their 12-23-months-old children included in the study did not take vitamin B12,
vitamin D and calcium, in both the study periods (Chapter 4, Table 4.3 and 4.4). Earlier national
study in Ethiopia using blood biomarkers found that about 20% women at reproductive age were
deficient of vitamin B12 [42]. However, this high discrepancy could be due to the fact that serum
total vitamin B12 used for assessment can give less information to identify vitamin B12
deficiency [43,44]. Further study should be done using methyl malonic acid in urine or
Holotranscobalamin in blood samples, to get more reliable information to be able to design
appropriate preventive or intervention measures [43,45]. In line with our finding in the present
study, there were no pregnant women ever consumed vitamin D-rich foods, fortified foods or
dietary supplements, which might have resulted in vitamin D deficiency, as a serious problem,
in spite of the fact that Ethiopia is located near the Equator [46]. Beside these, the highest
prevalence of dietary calcium inadequacy were found in studies conducted in Gondar and
Butajira districts, and at national (89-96%) level in Ethiopia [47–49]. Therefore, nutrition
sensitive agriculture in both plant and livestock production should be promoted and implemented
in sustainable manner, in addition to the implementation of proposed universal calcium
supplementation [49].
In the present study, only 2.5% and 6.9% of the 6-23-months-old children consumed
complementary foods prepared from four and more diversified food groups, in the fasting and
non-fasting periods, respectively, which was lower than those found in a study conducted in the
153
same age group of children of Orthodox mothers during the fasting period, in Gojam district of
Ethiopia [50]. It was also lower than the results of studies conducted in India, Bangladesh and
Vietnam, which were 38%, 48.4% and 83.2%, respectively. Furthermore, only 2.3-6.7% of the
6–23-month-old children met the minimum acceptable diet criteria in the study population,
which was in line with findings for the Tigray region and national figure, in the DHS 2016 report
for Ethiopia [13]. However, it was lower than that found on the 6-23-months-old children of
Orthodox religion follower (8.6%) in North west Ethiopia [51]. Furthermore, the proportion of
6–23-month-old children of fasting mothers who fulfilled the criteria for MAD was lower
compared to children of non-fasting mothers. It was also lower during the fasting compared to
non-fasting period, which implied that the inadequate dietary micronutrients intakes were
prevalent in the fasting period. In support of these, the average dietary intake of energy, protein
and all micronutrients included in this study were higher in non-fasting compared to fasting
period, despite the average intake of these were below the estimated need of the breastfeeding
children from the complementary food and high prevalence of energy and nutrient inadequacies
in the study population. For example, the prevalence of inadequate dietary intakes (<2/3 RNI) of
zinc, vitamin C, energy and niacin was very high (>50%) in the 12-23-months-old children,
followed by protein, iron, vitamin A and vitamin B1 (20-50%), respectively. Studies conducted
in Amhara and Tigray regions, and at national level in Ethiopia confirmed that zinc and vitamin
A deficiencies are high in children [52,53]. Another study conducted in three other African
countries and Ethiopia also revealed that anemia, vitamin A and zinc deficiencies are public
health problems in these countries [54]. The prevalence of dietary inadequacy (2/3 RNI) of
Vitamin C was high in both the children and lactating mothers and almost steady in both study
154
periods. This can indicate that low consumption of vitamin C rich foods is the chronic problem
in the study area, which might be related with the low consumption of fruits, animal source foods
including dairy products, root crops like potato, anchote in the study area [10,22]. Therefore,
consumption of vitamin C rich foods should be promoted to improve the bioavailability of
minerals. This alone can‘t be enough, unless a traditional processing techniques is used to
improve the bioavailability of iron, zinc and calcium, in a population, in which cereals and
legumes are the main staple foods and a source of energy and most of the nutrients needed for an
individual (Chapter 2, Table 2.4). Beside these, the proportion of mothers who consumed more
cups of coffee was higher in the fasting than non-fasting period, in the whole study population,
and these were due to higher proportion of the non-fasting mothers included in this study who
took significantly more coffee in the fasting than non-fasting periods. However, the reason for
less consumption for the fasting mothers could be related to some Ethiopian Orthodox religion
monarchist, who preached to followers not to consume coffee during fasting periods. Therefore,
moderate intake of coffee, coupled with discouraging intake close to meals to be eaten should be
done, otherwise, it could also reduce their bioavailability, leading to increased risk of
micronutrient deficiencies, especially of iron, calcium, and zinc [55].
5.3. CIMI: A Promising Dietary Assessment Application for Rural Ethiopian Population
Assessing the dietary pattern of an individual, and a community at large, is the fundamental for
setting an appropriate prevention and intervention activities in a given country. It can also help to
identify, both poor and good dietary habits, and identify the extent of risk and deficiency for
specific nutrients in a certain community, by the practitioners, researchers and development
agencies [56]. As a result, qualitative and quantitative dietary intake data have been collected

155
using dietary assessment techniques, which have been developed and implemented globally.
However, most of the quantitative dietary assessment methods are time consuming, need an
experienced and well trained data collectors, and an expert to calculate the energy and nutrient
intakes using software before identifying extent of the nutritional problem in the study
population. Thus, quantitative dietary assessment methods are less applicable in developing
countries like Ethiopia, where more than three-fourth of the population are living in rural poor
settings, which most often leads to less availability of quantitative dietary data [57]. In this study,
a web-based nutritional assessment application called Calculator for Inadequate Micronutrient
Intake (CIMI), which is simple, easy-to-use and informative and consider the 93 commonly
consumed Ethiopian foods was adapted for Ethiopian population and validated against
internationally established nutrition assessment software called NutriSurvey (NS). Accordingly,
the average intake values of energy, protein and most nutrients produced by CIMI and NS were
almost similar, for the lactating women and their 12-23-months-old children, regardless of the
two study periods. Exceptions were observed in vitamin A in both women and children, and
vitamin C only in the lactating women, which were higher in NS and CIMI, compared to the
results produced by CIMI and NS, respectively. The findings on the vitamin A was in line with
the result found in the validation study of Indonesian CIMI [58]. The reason for the vitamin A in
our case was, the butter and oil food group in CIMI has got a lower average vitamin A content
compared to the fortified palm oil consumed by almost all of the study households surveyed
during the fasting and non-fasting periods. The consumption of different oil types in the district
depends on the availability of oil types through the cooperatives provided under the massive
import by the subsidy of the Ethiopian government and the distribution through the aid in the
156
district. To solve the problem related with vitamin A, deselection of the unconsumed oil type in
the oil and butter food will be important in future CIMI use. The increased result produced in the
vitamin C was due to the greater share of the tomato (43.8%) for the ‗other vegetables` food
group in the CIMI and its relatively high vitamin C content, but less consumed compared to the
highly consumed cabbage by the adults in the study area. The average intakes of protein, iron
and calcium produced by CIMI were also higher than NS in both the study groups, which was
related with the consumption of high amount of peas, despite its share in the ‗beans` food group
is small (12.4%). The other reason was the higher contents of protein, iron and calcium in the
food items compared to peas, which created the ‗beans‘ food group. Furthermore, if the amount
to be set up between the two sliders gets larger, then the consumption is increasing in most of the
food groups created the CIMI. The selection of the lower or upper, where the amount consumed
in the group fails depends on the nearest amount in the setup of the sliders, which also affects the
beans group. Therefore, if the amount approaches to the upper slider, then automatically the
upper slider will be selected and this will lead to overestimation of intake of specific nutrients
compared to NS, otherwise underestimate for lower slider selection. Similarly, the average intake
results produced for magnesium in the pepper and vitamin B1 and egg food groups were
overestimated by selecting the upper slider during the data entry of CIMI in the higher
proportion of an individual. The vitamin B6 was also slightly higher in results produced by
CIMI, which was due to the fact that Ethiopian kale, which was less consumed in the study area,
but contributed much (58.4%) to the ‗green leaves‘ food group overestimated the average intake
in the study groups, regardless of the study periods.
157
The results in the present study also showed that the proportion of lactating women and the 12-
23-months old children who were identified as having inadequate intake of energy and most
nutrients (<2/3 RNI) were similar by CIMI and NS, in the study periods. Like the average intake
for the vitamin A of the lactating women and the 12-23-months-old children, and vitamin C for
the lactating women group, the prevalence identified by the CIMI and NS was also variable, in
both the study periods. The reasons for these discrepancies are also similar with those earlier
stated for the average differences for vitamin A and vitamin C intakes in our study. Additionally,
according to criteria set by Lambert and her colleagues (2018), the results of vitamin A for both
of the study groups, magnesium for the 12-23-months-old children and vitamin B6 for the
lactating women, were produced by CIMI had moderate accuracy compared to NS. Similarly, the
accuracy of results produced by CIMI of the vitamin B6 in the 12-23-months-old children and
vitamin C for the lactating women were low. The reason for the vitamin B6 was due to the actual
small average values produced, so that the small mean differences in few individuals between
CIMI and NS dramatically increased the mean difference %, which is the drawback of the
accuracy classification method we used. Whereas, the vitamin C was due to the reasons
mentioned for the discrepancies observed in the average results produced. Despite these, the
intake of energy, protein and most micronutrients, for both of the study groups, in both study
periods were calculated either in good or very high accuracy by CIMI. Beside these, strong
correlations were found between CIMI and NS results in all the nutrients and energy for the 12-
23-months-old children (R=0.741-0.956) and lactating women (R=0.779-0.920) (Chapter 4,
Figure 4.1 and 4.2). Our results found in the correlation analysis of results produced by NS and
CIMI for energy, protein, iron, zinc and vitamin A in both the study groups were higher than

158
previous study in Indonesian children and women, except that of energy for lactating women.
This discrepancy could be related to the smaller sample size of the study participants compared
to this study. Additionally, the correlation coefficients of all nutrients, except energy in our study
were higher than those found in a CIMI trial conducted on Tanzanian women [59]. Thus, CIMI
developed for rural Ethiopian population calculates the average nutrient intake accurately, and
identifies the inadequate micronutrient intake of individuals using FAO/WHO recommendation
for nutrient intake (RNI).
Unlike other dietary assessment methods, CIMI provides result immediately after the interview
is completed, which allows the enumerator to provide direct feedback to the interviewee to
improve the dietary habits considering the socio-cultural and economic status of the community,
and the potential crops available in the farm and market of the district. Currently, most of the
dietary quality information have been collected using the qualitative method called diet diversity
score, which is a proxy indicator at the individual and household levels, in most of the
developing countries, as most of the quantitative assessment methods are not feasible in these
countries [38]. In this technique, the principal focus is assessing the diversity of the standardized
food groups consumed in the diet and quantifying in to the score to indirectly predict the
micronutrients adequacy in general, using an established cutoff points mentioned earlier.
Therefore, the information that can be produced from this method is limited unless an alternative
method is used to identify specific nutrient deficiency in the given community. Considering
these, CIMI can replace the diet diversity, by producing much more results on the diet quality of
an individual, and solving the problems that can be encountered by diet diversity assessment
method. In situations where the diet diversity and other quantitative dietary assessment methods
159
are not appropriate, CIMI can be also used in cross-sectional and/or longitudinal/intervention
studies. Cumulative analysis of individual results, can be used in mapping nutrition situation of a
given district or country using the GPS information to be produced during the survey carried out
by CIMI. Therefore, appropriate and specific prevention or intervention activities can be planned
and done timely. Therefore, our results indicate that, the CIMI developed for Ethiopian
population using the commonly consumed Ethiopian foods are applicable in rural setting, where
85% of the population is living and suffering from multiple malnutrition problems. In general,
the use of CIMI is wider, which covers from the simple cross-sectional study in a certain area to
the complex longitudinal study at the national level in Ethiopia.
5.4. Conclusion
Based on our findings on the anthropometric measurements of lactating women and their 6-23-
months-old children, maternal and child undernutrition is a serious public health problem in the
study district. But, it was lower than the prevalences of undernutrition in children and women at
the reproductive age group (15-49 years) reported in the Ethiopian Demographic and Health
Survey (2016) for Tigray region, where this study was conducted. Therefore, these indicated that
the nutritional status of women and their children in the Tigray region was improving, despite the
unacceptable higher prevalences of undernutrition in fasting mothers (underweight) and children
(stunting, underweight and wasting) born of these fasting mothers and the study population
especially during the Ethiopian Orthodox lent fasting period. Mother fasting status during
pregnancy and lactation periods of the indexed child was amongst the predictor variables of the
undernutrition for the lactating women and their 6-23-months-old children in the study
population. Thus, the existing maternal and child nutrition intervention activities should consider
160
religious fasting periods. Mothers who were young, had sickness within four weeks preceding
the fasting period, and children between 13 and 18 months of age were more exposed to maternal
underweight. Mothers who were living in the households whose decision makers were
grandfathers, received aid, not owning chickens and had no access to water were also associated
with maternal underweight. Therefore, households with younger mothers and non-improved
water sources should get priority in nutritional intervention. Furthermore, promoting chicken
husbandry, and improving the WASH in the community may also improve the low consumption
of animal source foods and reduce maternal undernutrition in the study district. Likewise,
maternal education and occupational status, child age, colostrum intake status, in addition to
toilet presence in the household where the child was living associated with child undernutrition
in the study district. Therefore, improving the maternal education, reducing the work burden in
farming activities and/or supporting of mothers in non-farm income generating nearby by their
living residence, household latrine coverage and breastfeeding of colostrum should be promoted
and strengthened. The number of meals eaten, both by the lactating women and their 6-23-
months-old children are below the recommendation, from the less diversified food groups. These
food groups are mainly from the cereals and legumes, which are known to have high amount of
phytic acid and tannin which limit the absorption of minerals and protein by chelating with it. In
addition to the low consumption of all other food groups, by both the study groups in the study
population, the proportion of fasting lactating women and their 6-23-months-old children who
consumed animal source foods (dairy, meat, poultry and fish) were very low compared to the
lactating women and their 6-23-months-old in the non-fasting group. Similarly, the consumption
of animal source foods was affected during the lent fasting than non-fasting period at the study

161
population level. This sub-optimal dietary pattern was synergized with more cup of coffee
consumption by the lactating women, and even worst in the lent fasting period. Furthermore, we
also concluded that the prevalence of inadequate intakes (<2/3 RNI) of dietary energy and most
micronutrients, except protein and magnesium are high in the 12-23-months-old children.
Similarly, the proportion of lactating women who did not take adequate amount of vitamin A,
calcium, vitamin B6, vitamin B12, pentatonic acid and vitamin C were also high. These high
prevalences of inadequacy was more affected during the lent fasting period, in both the young
children and lactating women. Thus, activities which will improve the diet diversity by
incorporating the nuts and seeds, dark green leafy vegetables, vitamin A and C rich fruits and
animal source products, and increasing the meal frequency, for both the lactating women and
children should be done urgently. Besides these, use of traditional processing techniques like
dehulling/dehusking, soaking and germination, and slightly roasting are crucial during
preparation of food for the nutrient needy groups like lactating and pregnant women, and their
young children. Additionally, moderate intake of coffee after some hour interval of meal to be
eaten should be promoted to increase the absorption of non-heme iron from plant source foods.
Shockingly, the intake of the vitamin B12, vitamin D and calcium by almost all the lactating
women and their 12-23-months-old children were below the recommended intake (2/3 RNI)
from their diet in the 24-hr preceding the fasting and non-fasting surveys. Thus, implementation
of the proposed universal calcium supplementation in Ethiopia, in addition to urgent
investigation and appropriate other public health nutrition activities should be done in the
district. In general, the activities which will focus on the dietary improvement (quality and
quantity) should get more priority, and special attention should be given for fasting periods.
162
We also concluded that, the Calculator for Inadequate Micronutrient Intake (CIMI) adapted
using commonly consumed Ethiopian foods for rural Ethiopian population estimates the average
nutrient intake accurately. CIMI also identifies the individual inadequate intake of energy,
macro- and micronutrients using the FAO/WHO recommended nutrient intake (RNI)
immediately after the interview. Therefore, this feature enables the interviewers to give
immediate feedback and suggest context based dietary improvements for the interviewee. CIMI
can also replace the DDS by solving the problem encounter by this technique and producing
more quantitative results to design specific nutrition intervention. It can be also used in cross-
sectional and/or longitudinal and/or intervention studies, where the DDS and other quantitative
dietary assessment techniques are not appropriate. In general, CIMI can be used in Ethiopia, as a
simple dietary assessment tool for nutrition and related researchers, policy makers, implementers
and evaluators.
5.5. References
1. Black RE, Allen LH, Bhutta ZA, Caulfield LE, de Onis M, Ezzati M, et al. Maternal and
child undernutrition: global and regional exposures and health consequences. Lancet.
2008;371[9608]:243–60.
2. Addo OY, Stein AD, Fall CH, Gigante DP, Guntupalli AM, Horta BL, et al. Maternal
height and child growth patterns. J Pediatr [Internet]. 2013;163[2]:549–554.e1. Available
from: http://dx.doi.org/10.1016/j.jpeds.2013.02.002
3. Özaltin E, Hill K, Subramanian S V. Association of Maternal Stature With Offspring
Mortality, Underweight, and Stunting in Low- to Middle-Income Countries. JAMA.
2011;303[15]:1507–16.
163
4. Silva D e, Valente A, Borges A, Almeida F, Neves E, Afonso C. Relationship between the
mothers ‘ nutritional status with that of a child population from São Tomé Principe , ―
Africa .‖ Rev Bras Saúde Matern Infant, Recife. 2017;17[2]:327–35.
5. Felisbino-mendes M, Villamor E, Velasquez-melendez G. Association of maternal and
child nutritional status in Brazil : A population based cross-sectional study. PLoS One.
2014;9[1]:e87486.
6. Negash C, Whiting SJ, Henry CJ, Belachew T, Hailemariam TG. Association between
maternal and child nutritional status in Hula, rural Southern Ethiopia: A cross sectional
study. PLoS One. 2015;10[11].
7. Endalamaw A, Engeda EH, Ekubagewargies DT, Belay GM. Low birth weight and its
associated factors in Ethiopia : a systematic review and meta- analysis. 2018;6:1–12.
8. Bililign N, Legesse M, Akibu M. iMedPub Journals A Review of Low Birth Weight in
Ethiopia : Socio-Demographic and Obstetric Risk Factors Abstract Magnitude of low birth
weight. 2018;1–5.
9. Gebremedhin M, Ambaw F, Admassu E, Berhane H. Maternal associated factors of low
birth weight : a hospital based cross-sectional mixed study in Tigray , Northern Ethiopia.
BMC Pregnancy Childbirth [Internet]. 2015;15[22]:1–8. Available from:
http://dx.doi.org/10.1186/s12884-015-0658-1
10. Desalegn BB, Lambert C, Riedel S, Negese T, Biesalski HK. Ethiopian Orthodox Fasting
and Lactating Mothers : Longitudinal Study on Dietary Pattern and Nutritional Status in

164
Rural Tigray , Ethiopia. Int J Environ Res Public Heal. 2018;15[1767]:1–20.
11. Sitotaw IK, Kiday H, Adama Y. Comparison of nutritional status and associated factors of
lactating women between lowland and highland communities of District Raya , Alamata ,.
BMC Nutr. 2017;3[61]:1–12.
12. Haileslassie K, Mulugeta A, Girma M. Feeding practices, nutritional status and associated
factors of lactating women in Samre Woreda, South Eastern Zone of Tigray, Ethiopia.
Nutr J [Internet]. 2013;12[1]:1.
13. CSA. Ethiopia Demographic and Health Survey 2016. Addis Ababa; 2017.
14. Alemayehu M, Argaw A, Geberemariam A. Factors Associated with Malnutrition among
Lactating Women in Subsistence Farming Households from Dedo and Seqa-Chekorsa
Districts, Jimma Zone, 2014. Dev Ctry Stud [Internet]. 2015;5[21]:114–22. Available
from: http://www.iiste.org/Journals/index.php/DCS/article/view/27469
15. Roba KT, O‘Connor TP, Belachew T, O‘Brien NM. Seasonal variation in nutritional
status and anemia among lactating mothers in two agro-ecological zones of rural Ethiopia:
A longitudinal study. Nutrition [Internet]. 2015;31[10]:1213–8. Available from:
http://dx.doi.org/10.1016/j.nut.2015.03.007
16. Sarri KO, Tzanakis NE, Linardakis MK, Mamalakis GD, Kafatos AG. Effects of Greek
orthodox christian church fasting on serum lipids and obesity. BMC Public Health.
2003;8:1–8.
17. Sarri KO, Tzanakis NE, Linardakis MK, Mamalakis GD, Kafatos AG. Effects of Greek

165
orthodox christian church fasting on serum lipids and obesity. BMC Public Health.
2003;3[16].
18. UNICEF. The status of the world‘s children. Geneva, Switzerland: Oxford University
Press; 1998. 135 p.
19. FMOH. National Nutrition Program 2016-2020. Addis Ababa, Ethiopia; 2016.
20. Federal Demogratic Republic of Ethiopia [FDRE]. SEQOTA declaration implementation
plan [ 2016 – 2030]: Summary programme approach document. Addis Ababa, Ethiopia;
2016.
21. Biza Zepro N. Food Taboos and Misconceptions Among Pregnant Women of Shashemene
District, Ethiopia, 2012. Sci J Public Heal [Internet]. 2015;3[3]:410. Available from:
http://www.sciencepublishinggroup.com/journal/paperinfo.aspx?journalid=251&doi=10.1
1648/j.sjph.20150303.27
22. Desalegn B, Lambert C, Riedel S, Negese T, Biesalski H. Feeding Practices and
Undernutrition in 6–23-Month-Old Children of Orthodox Christian Mothers in Rural
Tigray, Ethiopia: Longitudinal Study. Nutrients [Internet]. 2019;11[1]:138. Available
from: http://www.mdpi.com/2072-6643/11/1/138
23. Akombi BJ, Agho KE, Hall JJ, Wali N, Renzaho AMN, Merom D. Stunting, wasting and
underweight in Sub-Saharan Africa: A systematic review. Int J Environ Res Public Health.
2017;14[8]:1–18.
24. Alemayehu M, Tinsae F, Haileslassie K, Seid O, Gebregziabher G, Yebyo H.

166
Undernutrition status and associated factors in under-5 children, in Tigray, Northern
Ethiopia. Nutrition [Internet]. 2015;31[7–8]:964–70. Available from:
http://dx.doi.org/10.1016/j.nut.2015.01.013
25. CSA. Ethiopia Demographic and Health Survey 2011. Addis Ababa; 2012.
26. Bhandari S, Sayami JT, Thapa P, Sayami M, Kandel BP, Banjara MR. Dietary intake
patterns and nutritional status of women of reproductive age in Nepal: Findings from a
health survey. Arch Public Heal [Internet]. 2016;74[1]:1–11. Available from:
http://dx.doi.org/10.1186/s13690-016-0114-3
27. Mulugeta A, Hagos F, Kruseman G, Linderhof B, Stoecker B, Abraha Z, et al. Factors
Contributing to Child Malnutrition in Tigray , Northern Ethiopia. East Afr Med J.
2010;87[6]:248–54.
28. Demissie T, Mekonen Y, Haider J. Agroecological comparison of leveles and correlates of
nutritional status of women. Ethiop J Heal Dev. 2003;17[3]:189–96.
29. Wu X, Li L. Family size and maternal health: Evidence from the One-Child policy in
China. J Popul Econ. 2012;25[4]:1341–64.
30. Mosites EM, Rabinowitz PM, Thumbi SM, Montgomery JM. The Relationship between
Livestock Ownership and Child Stunting in Three Countries in Eastern Africa Using
National Survey Data. PLoS One. 2015;10[9]:1–10.
31. Bbaale E. Maternal education and child nutritional status : evidence from Uganda. African
J Econ Manag Stud. 2014;5[1]:52–74.
167
32. Makoka D, Masibo PK. Is there a threshold level of maternal education sufficient to
reduce child undernutrition ? Evidence from Malawi , Tanzania and Zimbabwe. BMC
Pediatr [Internet]. 2015;15:1–10. Available from: http://dx.doi.org/10.1186/s12887-015-
0406-8
33. Nyaruhucha CNM, Msuya JM, Mamiro PS, Kerengi AJ. Nutritional status and feeding
practices of under-five children in Simanjiro District , Tanzania. Tanzan Health Res Bull.
2006;8[3]:162–7.
34. Vollmer S, Bommer C, Krishna A, Harttgen K, Subramanian S V. The association of
parental education with childhood undernutrition in low- and middle-income countries :
comparing the role of paternal and maternal education. Int J Epidemiol. 2017;46[August
2016]:312–23.
35. Fentahun N, Belachew T, Lachat C. Determinants and morbidities of multiple
anthropometric deficits in southwest rural Ethiopia. Nutrition [Internet]. 2016;32[11–
12]:1243–9. Available from: http://dx.doi.org/10.1016/j.nut.2016.03.023
36. WHO. Complementary feeding of young children in developing countries: a review of
current scientific knowledge. Geneva, Switzerland; 1998. p. 248.
37. Essential Nutrition Action [ENA]. Key behaviours for optimal breastfeeding ,
complementary feeding and maternal nutrition at critical stages in the life cycle of women
and children. 2008.
38. FAO and FHI 360. Minimum Dietary Diversity for Women A Guide to Measurement.
168
Rome; 2016. 82 p.
39. WHO. Indicators for assessing infant and young child feeding practices. Part 3 Ctry
Profiles. 2010;1–47.
40. Belew AK, Ali BM, Abebe Z, Dachew BA. Dietary diversity and meal frequency among
infant and young children: A community based study. Ital J Pediatr. 2017;43[1]:6–15.
41. Dangura D, Gebremedhin S. Dietary diversity and associated factors among children 6-23
months of age in Gorche district, Southern Ethiopia: Cross-sectional study. BMC Pediatr
[Internet]. 2017;17[1]:1–7. Available from: http://dx.doi.org/10.1186/s12887-016-0764-x
42. Ethiopian National Micronutrient Survey Report. Addis Ababa, Ethiopia; 2016.
43. Hannibal L, Lysne V, Behringer S. Biomarkers and Algorithms for the Diagnosis of
Vitamin B 12 Deficiency. Front. Mol. Biosci. 2016;3(27). doi: 10.3389/fmolb.2016.00027
44. Herrmann W, Obeid R. Utility and limitations of biochemical markers of vitamin B12
deficiency. Eur J Clin Invest. 2013;43[3]:231–7.
45. Kwok T, Cheng G, Lai WK, Poon P, Woo J, Pang CP. Use of Fasting Urinary
Methylmalonic Acid to Screen for Metabolic Vitamin B12 Deficiency in Older Persons.
Nutrition. 2004;20:1–4.
46. Gebreegziabher T, Stoecker BJ. Vitamin d insufficiency in a sunshine-sufficient area:
Southern ethiopia. Food Nutr Bull. 2013;34[4]:429–33.
47. Amare B, Moges B, Moges F, Fantahun B, Admassu M. Nutritional status and dietary
intake of urban residents in Gondar , Northwest Ethiopia. BMC Public Health.
169
2012;12[752].
48. Asayehu TT, Lachat C, Henauw S De, Gebreyesus SH. Dietary behaviour, food and
nutrient intake of women do not change during pregnancy in Southern Ethiopia. Matern
Child Nutr. 2017; 13, e12343.
49. Tesfaye B, Sinclair K, Wuehler SE, Moges T, De-regil LM, Dickin KL. Applying
international guidelines for calcium supplementation to prevent pre-eclampsia : simulation
of recommended dosages suggests risk of excess intake in Ethiopia. Public Health Nutr.
2018;22[3]:531–41.
50. Kumera G, Tsedal E, Ayana M. Dietary diversity and associated factors among children of
Orthodox Christian mothers/caregivers during the fasting season in Dejen district, north
west Ethiopia. Nutr Metab [Lond]. 2018;15[16].
51. Mulat E, Alem G, Woyraw W, Temesgen H. Uptake of minimum acceptable diet among
children aged 6 – 23 months in orthodox religion followers during fasting season in rural
area , DEMBECHA , north West Ethiopia. BMC Nutr. 2019;5[18]:1–10.
52. Herrador Z, Sordo L, Gadisa E, Buño A, Gómez-Rioja R, Iturzaeta JM, et al.
Micronutrient deficiencies and related factors in school-aged children in ethiopia: A cross-
sectional study in Libo Kemkem and Fogera Districts, Amhara Regional State. PLoS One.
2014;9[12]:1–20.
53. Ayana G, Moges T, Samuel A, Asefa T, Eshetu S, Kebede A. Dietary zinc intake and its
determinants among Ethiopian children 6–35 months of age. BMC Nutr [Internet].
170
2018;4[1]:30. Available from:
https://bmcnutr.biomedcentral.com/articles/10.1186/s40795-018-0237-8
54. Harika R, Faber M, Samuel F, Mulugeta A, Kimiywe J, Eilander A. Are Low Intakes and
Deficiencies in Iron, Vitamin A, Zinc, and Iodine of Public Health Concern in Ethiopian,
Kenyan, Nigerian, and South African Children and Adolescents? Food Nutr Bull.
2017;38[3]:405–27.
55. Gebremedhin S. Prevalence of prenatal zinc deficiency and its association with socio-
demographic, dietary and health care related factors in Rural Sidama, Southern Ethiopia:
A cross-sectional study. BMC Public [Internet]. 2011;11[898]. Available from:
http://bmcpublichealth.biomedcentral.com/articles/10.1186/1471-2458-11-898
56. Lyu L, Hsu Y, Chen H, Lo C, Lin C. Taiwanese Journal of Obstetrics & Gynecology
Comparisons of four dietary assessment methods during pregnancy in Taiwanese women.
Taiwanese Journal of Obstetrics & Gynecology [Internet]. 2014;53[2]:162–9. Available
from: http://dx.doi.org/10.1016/j.tjog.2014.04.007
57. Development initiatives. 2018 Global nutrition report: Shining a light to spur action on
nutrition [Internet]. Bristol, UK; 2018. 261 p. Available from:
http://ebrary.ifpri.org/cdm/ref/collection/p15738coll2/id/130399%5Cnhttps://www.ifpri.or
g/publication/hidden-hunger-approaches-tackling-micronutrient-deficiencies
58. Jati IRAP, Widmer C, Purwestri RC, Wirawan NN, Gola U, Lambert C, et al. Design and
validation of a program to identify inadequate intake of iron, zinc, and vitamin A.
Nutrition [Internet]. 2014;30[11–12]:1310–7. Available from:
171
http://dx.doi.org/10.1016/j.nut.2014.03.015
59. Lambert C, Eleraky L, Mbwana H, Kinabo J, Biesalski HK, Riedel S, et al. Validation of a
food group based nutrition software to assess nutrient intake in Tanzania. In: Global food
security and food safety: The role of universities. Ghent, Belgium: Ghent University;
2018. p. 2018.
172
6. Summary
Religious fasting is one of the categories of dietary or food taboos, which may affect the dietary
intake and nutritional status of individuals. In Ethiopia, about half of the population are followers
of Ethiopian Orthodox Tewahedo religion, and approximately 250 days per annum are fasting
days. In these fasting days, lactating and pregnant women and children are exempted from
fasting. However, lactating and pregnant women fast and are not also happy to prepare non-
fasting foods for their children during the fasting days due to fear of contamination of family
food.
Early identification of micronutrient deficiencies in Ethiopia are flouted, as most often the
quantitative dietary data are not available. As a result, the hidden hunger might have not been
addressed properly, where it remains high and persistent. Therefore, easy to use, less costly and
applicable assessment tool which can estimate the quantitative dietary intake of an individual or
a community is urgently needed to achieve the national and international goals set for eradicating
malnutrition. The Calculator for Inadequate Micronutrient Intake (CIM) is a simple, easy-to-use,
informative, web-based application of quantitative dietary assessment method, which was first
developed in Indonesia for Indonesian population. It estimates energy and nutrient intake
correctly, and identifies nutrient inadequacy according to FAO/WHO recommended nutrient
intake (RNI) regarding age, sex and physiological stage. Thus, the present study was conducted
with the aim of assessing and comparing the nutritional status and dietary intake of lactating
women and their 6-23-months-old children in fasting and non-fasting periods, and to adapt and
validate the CIMI program for Ethiopian population.
173
This study was conducted in rural Genta Afeshum district, in Tigray, Ethiopia, where almost all
people in the woreda are followers of Ethiopian Orthodox Christianity. A longitudinal study was
conducted using575 and 522 lactating women and their 6-23-months-old children in the lent
fasting and non-fasting.
In the present study it was found out that the prevalence of underweight (BMI < 18.5 kg/m2) in
fasting lactating women was high (50.6%) which is associated with maternal age, maternal
illness within four weeks preceding the fasting survey, fasting status during their pregnancy and
lactation period of their children included in this study. Additional predictor variables for
maternal underweight were grandfathers‘ as household decision maker, use of non-improved
water source, household aid experience and the absence of chicken in the household. The
average number of meals, diet diversity, and animal source foods consumption scores were
significantly higher in non-fasting compared to fasting periods, regardless of the fasting status (p
< 0.001, p < 0.05 and p < 0.001, respectively). Whereas, 31.6–33.7%, 11.7–15.7% and 4.4–4.8%
of the 6-23-months-old children in the study population were stunted, underweight and wasted,
respectively. In the fasting period, the weight-for-length (WLZ) and length-for-age (LAZ) values
for the 6-23-months-old children of non-fasting mothers were significantly higher (p < 0.05) than
the children of the fasting mothers‘ group. Similarly, the median weight-for-age (WAZ) and diet
diversity score (DDS) of children of fasting mothers were also significantly lower in fasting
compared to non-fasting period. The proportion of the 6-23-months-old children who met the
minimum acceptable diet (MAD) was small (2.3-6.7%) in the study population; however, this
proportion was significantly (p < 0.001) higher in the non-fasting than fasting period in the
children of fasting mothers. Age of the child, maternal fasting status during pregnancy and

174
lactation periods, maternal education and occupation were associated with child underweight.
Likewise, age of the child, colostrum intake status, maternal fasting status during pregnancy and
lactation period and toilet presence in the household were associated with child stunting. But,
maternal fasting status during lactation period and maternal education predicted wasting in the
children precisely. The average energy, protein and almost all micronutrients intakes of children
and women were lower in fasting compared to non-fasting period. At the same time, the
prevalence of inadequate intakes of energy, protein and most micronutrients were higher in both
the children and lactating women during fasting than non-fasting period. The result of this study
revealed that the correlation coefficients for the average dietary nutrient intake calculated by
CIMI and the reference software NutriSurvey (NS) were between 0.741-0.956 for the children
and between 0.779-0.920 for the lactating women groups. As a conclusion, the dietary pattern
and nutritional status of lactating women and their breastfed children are affected during the
fasting period. Therefore, the existing multi-sectoral nutrition intervention strategies in Ethiopia
should include religious institutions in a sustainable manner. CIMI adapted for the rural
Ethiopian setting estimates the average nutrient intake accurately; and identifies inadequate
micronutrient intake of individuals enabling enumerators to provide feedback and suggest
improvements. Thus, CIMI can be used in Ethiopia, as a simple dietary assessment tool by
nutrition and related researchers, policy makers, implementers and evaluators.
175
Zusammenfassung
Beim religiösen Fasten werden Lebensmitteltabus praktiziert, die die Nährstoffaufnahme und
den Ernährungszustand eines Individuums beeinflussen können. In Äthiopien besteht etwa die
Hälfte der Bevölkerung aus äthiopisch-orthodoxen Anhängern der Tewahedo-Religion. In dieser
Religion wird an ungefähr 250 Tagen im Jahr gefastet, wobei stillende und schwangere Frauen
und Kinder vom Fasten ausgeschlossen sind. In der Regel wird das Fasten jedoch auch von
laktierenden und schwangeren Frauen praktiziert, und diese Frauen bereiten ihren Kindern
während der Fastentage nicht gerne tierische Lebensmittel zu, aus Angst, das Familienessen zu
„verunreinigen―.
Die frühzeitige Erkennung von Mikronährstoffmängeln in Äthiopien scheitert meist an der
mangelnden Verfügbarkeit von quantitativen Daten zur Nährstoffaufnahme. Infolgedessen wird
der verborgene Hunger nicht richtig wahrgenommen und bekämpft, wodurch er dauerhaft und in
einer hohen Prävalenz auftritt. Um die nationalen und internationalen Ziele zur Beseitigung der
Unterernährung zu erreichen, ist ein einfaches, kostengünstiges und praktisch anzuwendendes
Erhebungsinstrument mit dem die quantitative Nährstoffaufnahme einer Einzelperson oder einer
Gemeinschaft geschätzt werden kann, dringend erforderlich. Der Calculator for Inadequate
Micronutrient Intake (CIMI) ist eine simple, benutzerfreundliche, informative App zur
quantitativen Ergebung der Micro- und Makronährstoffzufuhr, deren Vorläuferversion für die
indonesische Bevölkerung entwickelt wurde. CIMI schätzt die Energie- und Nährstoffaufnahme
korrekt ein und identifiziert gemäß der FAO / WHO empfohlenen Nährstoffzufuhr (RNI) eine
unangemessen niedrige Nährstoffaufnahme in Bezug auf Alter, Geschlecht und
Schwangerschaft/Stillzeit.
176
Ziel der vorliegenden Studie war die Erfassung und Beurteilung des Ernährungsstatus und der
Nahrungsaufnahme laktierender Frauen und ihrer 6-23 Monate alten Kinder in Fasten- und
Nicht-Fastenzeiten. Desweiteren sollte das CIMI-Programm an die äthiopische Bevölkerung
angepasst und dessen Anwendbarkeit untersucht werden.
Diese Studie wurde im ländlichen Bezirk Genta Afeshum in Tigray, Äthiopien durchgeführt, in
dem fast alle Menschen Anhänger des äthiopisch-orthodoxen Christentums sind. Es handelte sich
um eine longitudinale Studie an der 575 und 522 stillende Frauen und ihre 6-23 Monate alten
Kinder während einer Fasten- und einer Nicht-Fastenperiode teilnahmen.
Die vorliegende Studie ergab, dass die Prävalenz von Untergewicht (BMI <18,5 kg / m2) bei
fastenden laktierenden Frauen hoch war (50,6%). Diese hohe Prävalenz an Untergewicht war mit
dem mütterlichen Alter, einer Erkrankung der Mutter innerhalb von vier Wochen vor der
Befragung, des Fastens während der Schwangerschaft und der Stillzeit ihrer in diese Studie
eingeschlossenen Kinder assoziiert. Weitere Prädiktoren für ein mütterliches Untergewicht
waren Großväter als Entscheidungsträger im Haushalt, die Verwendung einer unsicheren
Wasserquelle, der Erhalt von Haushaltshilfen und das Fehlen von Hühnern im Haushalt. Die
durchschnittliche Mahlzeitenanzahl, die Nahrungsvielfalt und der Konsum von tierischen
Lebensmitteln war in der Nicht-Fastenperiode signifikant höher (p <0,001, p <0,05 bzw. p
<0,001), unabhängig vom Fastenstatus. Dem gegenüber waren 31,6–33,7%, 11,7–15,7% und
4,4–4,8% der 6-23 Monate alten Kinder in der Studienpopulation zu klein für ihr Alter,
untergewichtig und zu leicht für ihr Alter. In der Fastenperiode waren die Werte für das Gewicht
für die Körpergröße (WLZ) und für die Größe des Alters (LAZ) für die 6-23 Monate alten
Kinder nicht fastenden Müttern signifikant höher (p <0,05) als die Kinder der Gruppe der

177
fastenden Müttern. In ähnlicher Weise waren auch der Median des Altersgewichts (WAZ) und
des Diet Diversity Scores (DDS) der Kinder von fastenden Müttern während der Fastenperiode
signifikant niedriger als im fastenfreien Zeitraum. Der Anteil der 6-23 Monate alten Kinder, die
die akzeptable Mindestdiät (MAD) verzehrten, war in der Studienpopulation gering (2,3-6,7%).
Bei Kindern von fastenden Müttern war dieser Anteil jedoch in der Nicht-Fastenphase (n <p
<0,001) signifikant höher als in der Fastenzeit. Das Alter des Kindes, der Fastenstatus der Mutter
während der Schwangerschaft und Stillzeit, die Bildung und Beschäftigung der Mutter waren mit
kindlichem Untergewicht assoziiert. Ebenso waren das Alter des Kindes, die Kolostrumgabe, der
Fastenstatus der Mutter während der Schwangerschaft und Stillzeit und die Verfügbarkeit einer
Toilette im Haushalt mit Stunting verbunden. Der Fastenstatus der Mutter während der Stillzeit
und die Bildung der Mutter sagten das Risiko für ein zu geringes alterspezifisches
Körpergewicht des Kindes präzise voraus. Die durchschnittliche Zufuhr an Energie-, Eiweiß-
und fast aller Mikronährstoffe von Kindern und Frauen waren im Vergleich zu Nicht-
Fastenzeiten niedriger. Gleichzeitig war die Prävalenz einer unzureichenden Zufuhr von Energie,
Eiweiß und den meisten Mikronährstoffen sowohl bei Kindern als auch bei stillenden Frauen
während des Fastens höher als bei Nicht-Fasten. Das Ergebnis dieser Studie zeigt, dass die von
CIMI und der Referenzsoftware Nutrisurvey (NS) berechneten Korrelationskoeffizienten für die
durchschnittliche Nährstoffaufnahme zwischen 0,741-0,956 bei Kinder und 0,779-0,920 bei
laktierenden Frauen lagen.
Zusammenfassen lässt sich sagen, dass durch das Fasten das Ernährungsmuster und der
Ernährungszustand von stillenden Frauen und deren Kindern während der Fastenzeit betroffen
ist. Daher sollten in Äthiopien religiöse Institutionen in multisektorale Ernährungsinterventionen
178
einbezogen werden. CIMI, angepasst an die ländliche äthiopische Ernährungsweise, schätzt die
durchschnittliche Nährstoffaufnahme präzise ein und identifiziert eine unzureichende
Mikronährstoffaufnahme von Individuen, die es Enumeratoren ermöglicht Feedback zu geben
und Verbesserungen vorzuschlagen. Daher kann CIMI in Äthiopien als einfaches Instrument zur
Beurteilung der Ernährung von Wissenschaftlern, politischen Entscheidungsträgern und
Mitarbeitern von Ernährungserhebungen und -interventionen verwendet werden.

179
List of all references
Abate, K. H., & Belachew, T. (2017). Women‘s autonomy and men‘s involvement in child care
and feeding as predictors of infant and young child anthropometric indices in coffee
farming households of Jimma Zone, South West of Ethiopia. PLoS ONE, 12(3), 1–16.
https://doi.org/10.1371/journal.pone.0172885
Abebe, Y., Bogale, A., Hambidge, K., Stoecker, J., Bailey, K., & Gibson, R. (2007). Phytate ,
zinc , iron and calcium content of selected raw and prepared foods consumed in rural
Sidama , Southern Ethi ... foods consumed in rural Sidama , Southern Ethiopia , and impl.
Journal of Food Composition and Analysis, 20(July), 161–168.
https://doi.org/10.1016/j.jfca.2006.09.003
Abrha, S., Shiferaw, S., & Ahmed, K. Y. (2016). Overweight and obesity and its socio-
demographic correlates among urban Ethiopian women: Evidence from the 2011 EDHS.
BMC Public Health, 16(1), 1–7. https://doi.org/10.1186/s12889-016-3315-3
Addo, O. Y., Stein, A. D., Fall, C. H., Gigante, D. P., Guntupalli, A. M., Horta, B. L., …
Martorell, R. (2013). Maternal height and child growth patterns. Journal of Pediatrics,
163(2), 549–554.e1. https://doi.org/10.1016/j.jpeds.2013.02.002
Ahmed, A., Abdulahi, A., Shab-bidar, S., and Rezaei, S. (2017). Nutritional Status of Under Five
Children in Ethiopia : A Systematic Review and Meta-Analysis. Ethiopian Journal of
Health Science, 27(2), 175-188
Akombi, B. J., Agho, K. E., Hall, J. J., Wali, N., Renzaho, A. M. N., and Merom, D. (2017).
Stunting, wasting and underweight in Sub-Saharan Africa: A systematic review.
180
International Journal of Environmental Research and Public Health, 14(8), 1–18.
https://doi.org/10.3390/ijerph14080863
Alemayehu, M., Tinsae, F., Haileslassie, K., Seid, O., Gebregziabher, G., & Yebyo, H. (2015).
Undernutrition status and associated factors in under-5 children, in Tigray, Northern
Ethiopia. Nutrition, 31(7–8), 964–970. https://doi.org/10.1016/j.nut.2015.01.013
Alemayehu, M., Argaw, A., & Geberemariam, A. (2015). Factors Associated with Malnutrition
among Lactating Women in Subsistence Farming Households from Dedo and Seqa-
Chekorsa Districts, Jimma Zone, 2014. Developing Country Studies, 5(21), 114–122.
Retrieved from http://www.iiste.org/Journals/index.php/DCS/article/view/27469
Alemayehu, M., Tinsae, F., Haileslassie, K., Seid, O., Gebregziabher, G., & Yebyo, H. (2015).
Undernutrition status and associated factors in under-5 children, in Tigray, Northern
Ethiopia. Nutrition, 31(7–8), 964–970. https://doi.org/10.1016/j.nut.2015.01.013
Alemu, Z. A., Ahmed, A. A., Yalew, A. W., and Birhanu, B. S. (2016). Non random distribution
of child undernutrition in Ethiopia: Spatial analysis from the 2011 Ethiopia demographic
and health survey. International Journal for Equity in Health.
https://doi.org/10.1186/s12939-016-0480-z.
Ali, D., Saha, K. K., Nguyen, P. H., Diressie, M. T., Ruel, M. T., Menon, P., & Rawat, R.
(2013). Household Food Insecurity Is Associated with Higher Child Undernutrition in
Bangladesh, Ethiopia, and Vietnam, but the Effect Is Not Mediated by Child Dietary
Diversity. Journal of Nutrition, 143(12), 2015–2021. https://doi.org/10.3945/jn.113.175182
181
Ali Naser, I., Jalil, R., Wan Muda, W. M., Wan Nik, W. S., Mohd Shariff, Z., & Abdullah, M. R.
(2014). Association between household food insecurity and nutritional outcomes among
children in Northeastern of peninsular Malaysia. Nutrition Research and Practice, 8(3),
304–311. https://doi.org/10.4162/nrp.2014.8.3.304
Ali, Z., and Abizari, A. (2018). Ramadan fasting alters food patterns , dietary diversity and body
weight among Ghanaian adolescents. Nutrition Journal, 17(75), 1–14.
Alive & Thrive. (2010). IYCF Practices , Beliefs , and Influences in Tigray Region , Ethiopia.
Alive & Thrive.
Altare, C., Delbiso, T. D., Mutwiri, G. M., Kopplow, R., & Guha-Sapir, D. (2016). Factors
associated with stunting among pre-school children in southern highlands of Tanzania.
Journal of Tropical Pediatrics, 62(5), 390–408. https://doi.org/10.1093/tropej/fmw024
Altuntas, Y. E., Gezen, F. C., Sahoniz, T., Kement, M., Aydin, H., Sahin, F., … Oncel, M.
(2013). Ramadan fasting in patients with a stoma: a prospective study of quality of life and
nutritional status. Ostomy Wound Management, 59(5), 26–32. Retrieved from
http://www.ncbi.nlm.nih.gov/pubmed/23669258
Amare, B., Moges, B., Moges, F., Fantahun, B., Admassu, M., Mulu, A., & Kassu, A. (2012).
Nutritional status and dietary intake of urban residents in Gondar, Northwest Ethiopia.
BMC Public Health, 12(1). https://doi.org/10.1186/1471-2458-12-752
Amagloh, F., Atuna, R., McBride, R., Carey, E., & Christides, T. (2017). Nutrient and Total
Polyphenol Contents of Dark Green Leafy Vegetables, and Estimation of Their Iron
Bioaccessibility Using the In Vitro Digestion/Caco-2 Cell Model. Foods, 6(7), 54.
182
https://doi.org/10.3390/foods6070054
Amugsi, D. A., Mittelmark, M. B., & Oduro, A. (2015). Association between Maternal and Child
Dietary Diversity : An Analysis of the Ghana Demographic and Health Survey. PLoS ONE,
10(8), e0136748. https://doi.org/10.1371/journal.pone.0136748
Anteneh, Z. A., Gedefaw, M., Tekletsadek, K. N., Tsegaye, M., & Alemu, D. (2015). Risk
Factors of Overweight and Obesity among High School Students in Bahir Dar City, North
West Ethiopia: School Based Cross-Sectional Study. Advances in Preventive Medicine,
2015, 1–9. https://doi.org/10.1155/2015/294902
Arimond, M., & Ruel, M. T. (2004). Dietary diversity is associated with child nutritional status :
Evidence from 11 demographic and health surveys. J.Nutr., 134, 2579–2585.
Alemu, E., & Atnafu, A. (2014). Prevalence of Overweight and/or Obesity and Associated
Factors among High School Adolescents in Arada Sub city, Addis Ababa, Ethiopia. Journal
of Nutrition & Food Sciences, 4(2), 10–14. https://doi.org/10.4172/2155-9600.1000261
Almond, D., & Mazumder, B. Federal Reserve Bank of Chicago Health Capital and the Prenatal
Fasting During Pregnancy Health Capital and the Prenatal Environment : The Effect of
Maternal Fasting During Pregnancy ∗, No. 2007-2 FRB of Chicago Working Paper 74
(2011).
Altuntas, Y. E., Gezen, F. C., Sahoniz, T., Kement, M., Aydin, H., Sahin, F., … Oncel, M.
(2013). Ramadan fasting in patients with a stoma: a prospective study of quality of life and
nutritional status. Ostomy Wound Management, 59(5), 26–32. Retrieved from
http://www.ncbi.nlm.nih.gov/pubmed/23669258

183
Arimond, M., and Ruel, M. T. (2004). Dietary diversity is associated with child nutritional
status : Evidence from 11 demographic and health surveys. J.Nutr., 134, 2579–2585.
Arzoaquoi, S. K., Essuman, E. E., Gbagbo, F. Y., Tenkorang, E. Y., Soyiri, I., and Laar, A. K.
(2015). Motivations for food prohibitions during pregnancy and their enforcement
mechanisms in a rural Ghanaian district. Journal of Ethnobiology and Ethnomedicine,
11(1). https://doi.org/10.1186/s13002-015-0044-0
Asayehu, T. T., Lachat, C., Henauw, S. D., & Gebreyesus, S. H. (2017). Dietary behaviour, food
and nutrient intake of women do not change during pregnancy in Southern Ethiopia.
Maternal and Child Nutrition, 13(2). https://doi.org/10.1111/mcn.12343
Avery, A. (2004). Red Meat and Poultry Production and Consumption in Ethiopia and
Distribution in Addis Ababa, Ethiopia (August).
Awoke, A., Awoke, T., Alemu, S., & Megabiaw, B. (2012). Prevalence and associated factors of
hypertension among adults in Gondar, Northwest Ethiopia: A community based cross-
sectional study. BMC Cardiovascular Disorders, 12(1), 1. https://doi.org/10.1186/1471-
2261-12-113
Awwad, J., Usta, I. M., Succar, J., Musallam, K. M., Ghazeeri, G., and Nassar, A. H. (2012). The
effect of maternal fasting during Ramadan on preterm delivery: A prospective cohort study.
BJOG: An International Journal of Obstetrics and Gynaecology, 119(11), 1379–1386.
https://doi.org/10.1111/j.1471-0528.2012.03438.x
Ayana, G., Moges, T., Samuel, A., Asefa, T., Eshetu, S., & Kebede, A. (2018). Dietary zinc
184
intake and its determinants among Ethiopian children 6–35 months of age. BMC Nutrition,
4(1), 30. https://doi.org/10.1186/s40795-018-0237-8
Ayana, G., Moges, T., Samuel, A., Asefa, T., Eshetu, S., & Kebede, A. (2018). Dietary zinc
intake and its determinants among Ethiopian children 6–35 months of age. BMC Nutrition,
4(1), 30. https://doi.org/10.1186/s40795-018-0237-8
Baye, K., Guyot, J. P., Icard-Vernière, C., & Mouquet-Rivier, C. (2013). Nutrient intakes from
complementary foods consumed by young children (aged 12-23 months) from North Wollo,
northern Ethiopia: the need for agro-ecologically adapted interventions. Public Health
Nutrition, 16(10), 1741–1750. https://doi.org/10.1017/S1368980012005277.
Bbaale, E. (2014). Maternal education and child nutritional status : evidence from Uganda.
African Journal of Economic and Management Studies, 5(1), 52–74.
https://doi.org/10.1108/AJEMS-06-2012-0040.
Belew, A. K., Ali, B. M., Abebe, Z., & Dachew, B. A. (2017). Dietary diversity and meal
frequency among infant and young children: A community based study. Italian Journal of
Pediatrics, 43(1), 6–15. https://doi.org/10.1186/s13052-017-0384-6.
Betebo, B., Ejajo, T., Alemseged, F., & Massa, D. (2017). Household Food Insecurity and Its
Association with Nutritional Status of Children 6 – 59 Months of Age in East Badawacho
District, South Ethiopia. Journal of Environmental and PublicHealth, 2017.
https://doi.org/10.1155/2017/6373595.
Bhandari, S., and Banjara, M. R. (2015). Micronutrients Deficiency, a Hidden Hunger in Nepal:
Prevalence, Causes, Consequences, and Solutions. International Scholarly Research
185
Notices, 2015, 1–9. https://doi.org/10.1155/2015/276469.
Bhandari, S., Sayami, J. T., Thapa, P., Sayami, M., Kandel, B. P., & Banjara, M. R. (2016).
Dietary intake patterns and nutritional status of women of reproductive age in Nepal:
Findings from a health survey. Archives of Public Health, 74(1), 1–11.
https://doi.org/10.1186/s13690-016-0114-3.
Biesalski Hans, K., and Jana, T. (2018). Micronutrients in the life cycle: Requirements and
sufficient supply. NFS Journal, 11(March), 1–11. https://doi.org/10.1016/j.nfs.2018.03.001.
Bililign, N., Legesse, M., & Akibu, M. (2018). A Review of Low Birth Weight in Ethiopia :
Socio-Demographic and Obstetric Risk Factors. Global Journal of Research and Review.
5(1:4). https://doi.org/10.21767/2393-8854.100033.
Birhanu, A., Mekonen, S., & Atenafu, A. (2017). Stunting and associated factors among children
aged 6-59 months in Lasta woreda , north east Ethiopia , 2015 : A community based cross
sectional study design. Journal of Family Medicine, 4(3), 1112.
Belew, A. K., Ali, B. M., Abebe, Z., & Dachew, B. A. (2017). Dietary diversity and meal
frequency among infant and young children: A community based study. Italian Journal of
Pediatrics, 43(1), 6–15. https://doi.org/10.1186/s13052-017-0384-6.
Biza Zepro, N. (2015). Food Taboos and Misconceptions Among Pregnant Women of
Shashemene District, Ethiopia, 2012. Science Journal of Public Health, 3(3), 410.
https://doi.org/10.11648/j.sjph.20150303.27.
Black, R. E., Allen, L. H., Bhutta, Z. A., Caulfield, L. E., de Onis, M., Ezzati, M., … Rivera, J.
186
(2008). Maternal and child undernutrition: global and regional exposures and health
consequences. The Lancet, 371(9608), 243–260. https://doi.org/10.1016/S0140-
6736(07)61690-0.
Biru, K., Jima, A., & Abeya, S. (2017). Prevalence of Chronic Energy Malnutrition and Maternal
Health Service Utilizations among Lactating Mothers in Adama District, Oromia Region,
Eastern Ethiopia. Journal of Food Processing & Technology, 8(1), 1–5.
https://doi.org/10.4172/2157-7110.1000650
Bitew, F. H., & Telake, D. S. (2010). Undernutrition among Women in Ethiopia. B
Undernutrition among Women in Ethiopia: Rural-Urban Disparity. DHS Working Papers,
(77).
Caulfield, L. E., Onis, M. De, Blössner, M., & Black, R. E. (2004). Undernutrition as an
underlying cause of child deaths associated. Am J Clin Nutr, 80, 193–198.
Cogill, B. (2003). Anthropometric Indicators Measurement Guide Anthropometric Indicators
Measurement Guide. Food and Nutritional Technical Assistance, 2003 Revis, 1–93.
Retrieved from http://www.fantaproject.org/sites/default/files/resources/anthropometry-
2003-ENG.pdf.
CSA Central Statistical Agency of Ethiopia. (2007). Population and Housing Census 2007
Report. Central Statistical Agency, Addis Ababa, 385. Retrieved from
http://www.csa.gov.et/surveys/Population and Housing census/ETH-pop-
2007/survey0/data/Doc/Reports/National_Statistical.pdf
187
CSA. (2012). Ethiopia Demographic and Health Survey 2011. Addis Ababa.
CSA. (2017). Ethiopia Demographic and Health Survey 2016. Addis Ababa.
Cunningham, K., Headey, D., Singh, A., Karmacharya, C., & Rana, P. (2017). Maternal and
Child Nutrition in Nepal : Examining drivers of progress from the mid-1990s to 2010s.
Global Food Security, 13(February), 30–37. https://doi.org/10.1016/j.gfs.2017.02.001
Custodio, E., Perez-Formigo, J., Gadisa, E., Sordo, L., Cruz, I., Canavate, C., … Moreno, J.
(2013). Low dietary diversity is associated with child stunting in rural Ethiopia. Annals of
Nutrition and Metabolism. Conference paper.
Dangura, D., & Gebremedhin, S. (2017). Dietary diversity and associated factors among children
6-23 months of age in Gorche district, Southern Ethiopia: Cross-sectional study. BMC
Pediatrics, 17(1), 1–7. https://doi.org/10.1186/s12887-016-0764-x.
Demissie, T., Muroki, N. M., and Kogi-Makau, W. (1998). Food aversions and cravings during
pregnancy: prevalence and significance for maternal nutrition in Ethiopia. Food and
Nutrition Bulletin, 19(1), 20–26. https://doi.org/10.1177/156482659801900104.
Demissie, T., Mekonen, Y., and Haider, J. (2003). Agroecological comparison of leveles and
correlates of nutritional status of women. Ethiopian Journal of Health Development, 17(3),
189–196.
Demissie, T., Ali, A., & Zerfu, D. (2009). Availability and consumption of fruits and vegetables
in nine regions of Ethiopia with special emphasis to vitamin A deficiency. Ethiopian
Journal of Health Development, 23(3), 216–222.
188
Demissie, T., Ali, A., Mekonen, Y., Haider, J., & Umeta, M. (2010). Magnitude and distribution
of vitamin A deficiency in Ethiopia. Food and Nutrition Bulletin, 31(2), 234–241.
https://doi.org/10.1177/156482651003100206
Derso, T., Tariku, A., Biks, G. A., & Wassie, M. M. (2017). Stunting, wasting and associated
factors among children aged 6-24 months in Dabat health and demographic surveillance
system site: A community based cross-sectional study in Ethiopia. BMC Pediatrics, 17(1),
1–9. https://doi.org/10.1186/s12887-017-0848-2
Desalegn, B. B., Kinfe, E., Fikre, K., & Bosha, T. (2016). Stunting and Its Associated Factors in
Under Five Years Old Children : The Case of Hawassa University Technology Villages ,
Southern Ethiopia. IOSR Journal of Environmental Science, Toxicology and Food
Technology, 10(11), 25–31. https://doi.org/10.9790/2402-1011022531
Divya, N., Rajanish, K. V, Malavika, J., & Sharma, A. (2018). The study of dietary diversity
score in children between 6 months to 23 months : a hospital based study. International
Journal of Contemporary Pediatrics, 5(3), 1053–1057. DOI:
http://dx.doi.org/10.18203/2349-3291.ijcp20181541
Desalegn, B. B., Lambert, C., Riedel, S., Negese, T., & Biesalski, H. K. (2018). Ethiopian
orthodox fasting and lactating mothers: Longitudinal study on dietary pattern and nutritional
status in rural tigray, Ethiopia. International Journal of Environmental Research and Public
Health, 15(8). https://doi.org/10.3390/ijerph15081767
Desalegn, B., Lambert, C., Riedel, S., Negese, T., & Biesalski, H. (2019). Feeding Practices and
Undernutrition in 6–23-Month-Old Children of Orthodox Christian Mothers in Rural
Tigray, Ethiopia: Longitudinal Study. Nutrients, 11(1), 138.
189
https://doi.org/10.3390/nu11010138
Development Initiatives. (2017). Global Nutrition Report 2017: Nourishing the SDGs. Bristol,
UK: Development Initiative, 115. https://doi.org/10.1891/1058-1243.21.1.9
Development initiatives. (2018). 2018 Global nutrition report: Shining a light to spur action on
nutrition. Bristol, UK. https://doi.org/10.2499/9780896295643
Dewey, K. G., & Brown, K. H. (2003). Update on technical issues concerning complementary
feeding of young children in developing countries and implications for intervention
programs. Food and Nutrition Bulletin, 24(1), 5–28.
DSM. (2015). Nutrition during the first 1 , 000 days. In Vitamins in Motion for a brighter world
(pp. 1–24).
Ekwochi, U., Osuorah, C. D. I., Ndu, I. K., Ifediora, C., Asinobi, I. N., and Eke, C. B. (2016).
Food taboos and myths in South Eastern Nigeria: The belief and practice of mothers in the
region. Journal of Ethnobiology and Ethnomedicine, 12(1). https://doi.org/10.1186/s13002-
016-0079-x
Endalamaw, A., Engeda, E. H., Ekubagewargies, D. T., & Belay, G. M. (2018). Low birth
weight and its associated factors in Ethiopia : a systematic review and meta- analysis.
Italian Journal of Pediatrics, 44 (141). https://dx.doi.org/10.1186%2Fs13052-018-0586-6
Endalew, B., Muche, M., and Tadesse, S. (2015). Assesment of food security situation in
Ethiopia: A review. Asian Journal of Agricultural Research, 9(2), 55–68.
https://doi.org/10.3923/ajar.2015.55.68
190
Endris, N., Asefa, H., & Dube, L. (2017). Prevalence of Malnutrition and Associated Factors
among Children in Rural Ethiopia. BioMed Research International, 2017, 8–10.
https://doi.org/10.1155/2017/658785
EOTC/USAID. (2016, January 12). Patriarch of the Ethiopian Orthodox Tewahedo Church
Endorses Nutrition Sermon Guide Encouraging Better Nutrition for Mothers and Children .,
pp. 1–2.
Ersino, G., Henry, C. J., and Zello, G. A. (2016). Suboptimal Feeding Practices and High Levels
of Undernutrition among Infants and Young Children in the Rural Communities of Halaba
and Zeway, Ethiopia. Food and Nutrition Bulletin, 37(3), 409–424.
https://doi.org/10.1177/0379572116658371
Essential Nutrition Action (ENA). (2008). Key behaviours for optimal breastfeeding,
complementary feeding and maternal nutrition at critical stages in the life cycle of women
and children.
Ethiopian Public Health Institute (EPHI). (2013). Ethiopia National Food Consumption Survey.
Addis Ababa, Ethiopia.
Ethiopian National Micronutrient Survey Report. (2016). Addis Ababa, Ethiopia.
Ettyang, G. A. K., & Sawe, C. J. (2016). Factors associated with stunting in children under age 2
in the Cambodia and Kenya 2014 Demographic and Health Surveys. DHS Working Papers
No. 126 , (August). Retrieved from http://dhsprogram.com/pubs/pdf/WP126/WP126.pdf
191
FAO. (2016). FAO in Ethiopia El Nino response plan 2016. Addis Ababa, Ethiopia.
FAO. (2017). Ethiopia Situation Report - May 2017. Addis Ababa, Ethiopia.
FAO, & FHI360. (2016). Minimum Dietary Diversity for Women- A Guide to Measurement.
Minimum Dietary Diversity for Women: A Guide for Measurement (p. 82).
FAO, IFAD, UNICEF, WFP, & WHO. (2018). The State of Food Security and Nutrition in the
World 2018. Building climate resilience for food security and nutrition. Rome, FAO (pp.
3157–3166). https://doi.org/10.1109/JSTARS.2014.2300145
FAO and, & WHO. (2001). Human Vitamin and Mineral Requirements. Food and Nutrition
Division, 181–94.
FAO, WHO, & UNU. (2001). Human Energy Requirements. FAO Food and nutrition technical
report (pp. 1–105).
Protein and amino acid requirements in human nutrition. (2007). World Health Organization
Technical Report Series.
Faris, M. A.-I. E., and Al-Holy, M. A. (2014). Implications of Ramadan intermittent fasting on
maternal and fetal health and nutritional status: A review. Mediterranean Journal of
Nutrition and Metabolism, 7, 107–118. https://doi.org/10.3233/MNM-140011
Fayet-Moore, F., Kim, J., Sritharan, N., & Petocz, P. (2016). Impact of breakfast skipping and
breakfast choice on the nutrient intake and body mass index of Australian children.
Nutrients, 8(8). https://doi.org/10.3390/nu8080487
Fasts, F. W., and Fasts, T. P. (2019). Fasting and abstinence of the Coptic Orthodox Church of
192
Alexandria.
https://en.wikipedia.org/wiki/Fasting_and_abstinence_of_the_Coptic_Orthodox_Church_of
_Alexandria. Accessed on March19,2019
Federal Republic of Ethiopia, D. R. M. and F. S. (2015). Disaster Risk Management and Food
Security Sector: Werdeda Disaster Risk Profile: Genta Ahfeshum, Eastern Tigray. February
2015 Addis Ababa.
Federal Demogratic Republic of Ethiopia (FDRE). (2016). SEQOTA declaration implementation
plan ( 2016 – 2030): Summary programme approach document. Addis Ababa, Ethiopia.
Felisbino-mendes, M., Villamor, E., & Velasquez-melendez, G. (2014). Association of maternal
and child nutritional status in Brazil : A population based cross-sectional study. PLoS ONE,
9(1), e87486. https://doi.org/10.1371/journal.pone.0087486
Fentahun, W., Wubshet, M., & Tariku, A. (2016). Undernutrition and associated factors among
children aged 6-59 months in East Belesa District, northwest Ethiopia: A community based
cross-sectional study. BMC Public Health, 16(1), 1–10. https://doi.org/10.1186/s12889-016-
3180-0
Fentahun, N., Belachew, T., & Lachat, C. (2016). Determinants and morbidities of multiple
anthropometric deficits in southwest rural Ethiopia. Nutrition, 32(11–12), 1243–1249.
https://doi.org/10.1016/j.nut.2016.03.023
FMOH. (2008). The Federal Democratic Republic of Ethiopia: National Nutrition Strategy.
Addis Ababa, Ethiopia.
193
FMOH. (2013). National Nutrition Program Republic of Ethiopia. Addis Ababa, Ethiopia.
FMOH. (2016). National Nutrition Program 2016-2020. Addis Ababa, Ethiopia.
Gali, N., Tamiru, D., & Tamrat, M. (2017). The Emerging Nutritional Problems of School
Adolescents : Overweight / Obesity and Associated Factors in Jimma Town , Ethiopia.
Journal of Pediatric Nursing, 35, 98–104. https://doi.org/10.1016/j.pedn.2017.03.002
Gamo Sagaro, G. (2017). Dietary Diversity and Associated Factors Among Infants and Young
Children in Wolaita Zone, Southern Ethiopia. Science Journal of Clinical Medicine, 6(4),
53. https://doi.org/10.11648/j.sjcm.20170604.12
Gebre, B., Biadgilign, S., Taddese, Z., Legesse, T., and Letebo, M. (2018). Determinants of
malnutrition among pregnant and lactating women under humanitarian setting in Ethiopia.
BMC Nutrition, 4(11), 1–8. https://doi.org/https://doi.org/10.1186/s40795-018-0222-2
Gebreegziabher, T., & Stoecker, B. J. (2013). Vitamin D insufficiency in a sunshine-sufficient
area: Southern ethiopia. Food and Nutrition Bulletin, 34(4), 429–433.
https://doi.org/10.1177/156482651303400408
Gebremedhin, S., Enquselassie, F., & Umeta, M. (2011). Prevalence of prenatal zinc deficiency
and its association with socio-demographic, dietary and health care related factors in Rural
Sidama, Southern Ethiopia: A cross-sectional study. BMC Public Health, 11.
https://doi.org/10.1186/1471-2458-11-898
Gebremedhin, M., Ambaw, F., Admassu, E., & Berhane, H. (2015). Maternal associated factors
of low birth weight : a hospital based cross-sectional mixed study in Tigray , Northern
194
Ethiopia. BMC Pregnancy and Childbirth, 15(22), 1–8. https://doi.org/10.1186/s12884-015-
0658-1
Gebremedhin, S., Enquselassie, F., & Umeta, M. (2014). Prevalence and Correlates of Maternal
Anemia in Rural Sidama, . Southern Ethiopia. African Journal of Reproductive Health,
18(1), 44–53.
Gebremedhin, S., Baye, K., Bekele, T., Tharaney, M., Asrat, Y., Abebe, Y., & Reta, N. (2017).
Predictors of dietary diversity in children ages 6 to 23 mo in largely food-insecure area of
South Wollo, Ethiopia. Nutrition, 33, 163–168. https://doi.org/10.1016/j.nut.2016.06.002
Gebreselassie, S. G., Gase, F. E., & Deressa, M. U. (2013). Prevalence and Correlates of Prenatal
Vitamin A Deficiency in Rural Sidama , Southern Ethiopia. Journal of Health, Population
and Nutrition, 31(2), 185–194.
Getnet, W., Aycheh, W., and Tessema, T. (2018). Determinants of Food Taboos in the Pregnant
Women of the Awabel District , East Gojjam Zone , Amhara Regional State in Ethiopia.
Advances in Public Health, 2018, 6. https://doi.org/https://doi.org/10.1155/2018/9198076
Gewa, C. A., Murphy, S. P., Weiss, R. E., & Neumann, C. G. (2013). Determining minimum
food intake amounts for diet diversity scores to maximize associations with nutrient
adequacy: An analysis of schoolchildren‘s diets in rural Kenya. Public Health Nutrition,
17(12), 2667–2673. https://doi.org/10.1017/S1368980014000469
Gibson, R. S., Abebe, Y., Hambidge, K. M., Arbide, I., Teshome, A., & Stoecker, B. J. (2009).
Inadequate feeding practices and impaired growth among children from subsistence farming
households in Sidama, Southern Ethiopia. Maternal and Child Nutrition, 5, 260–275.

195
https://doi.org/10.1111/j.1740-8709.2008.00179.x
Gladys, C. (2017). Dietary Assessment and Nutritional Status of Children (6-23 Months)
Consuming Local Food Recipes in Vihiga County, Western Kenya. MSc Thesis. University
of Nairobi, 2015(December).Pp, 137.
Hadush, Z., Birhanu, Z., Chaka, M., & Gebreyesus, H. (2017). Foods tabooed for pregnant
women in Abala district of Afar region, Ethiopia: an inductive qualitative study. BMC
Nutrition, 3(1), 40. https://doi.org/10.1186/s40795-017-0159-x
Haile, D., Azage, M., Mola, T., and Rainey, R. (2016). Exploring spatial variations and factors
associated with childhood stunting in Ethiopia: Spatial and multilevel analysis. BMC
Pediatrics, 16(1), 1–14. https://doi.org/10.1186/s12887-016-0587-9
Harika, R., Faber, M., Samuel, F., Mulugeta, A., Kimiywe, J., & Eilander, A. (2017). Are Low
Intakes and Deficiencies in Iron, Vitamin A, Zinc, and Iodine of Public Health Concern in
Ethiopian, Kenyan, Nigerian, and South African Children and Adolescents? Food and
Nutrition Bulletin, 38(3), 405–427. https://doi.org/10.1177/0379572117715818
Hagos, S., Hailemariam, D., WoldeHanna, T., and Lindtjørn, B. (2017). Spatial heterogeneity
and risk factors for stunting among children under age five in Ethiopia: A Bayesian geo-
statistical model. PLoS ONE, 12(2). https://doi.org/10.1371/journal.pone.0170785
Haileslassie, K., Mulugeta, A., & Girma, M. (2013). Feeding practices, nutritional status and
associated factors of lactating women in Samre Woreda, South Eastern Zone of Tigray,
Ethiopia. Nutrition Journal, 12(1), 1. https://doi.org/10.1186/1475-2891-12-28
196
Hannibal, L., Lysne, V., Bjørke-Monsen, A.-L., Behringer, S., Grünert, S. C., Spiekerkoetter, U.,
… Blom, H. J. (2016). Biomarkers and algorithms for the diagnosis of vitamin B12
deficiency. Frontiers in Molecular Biosciences, 3, 27.
https://doi.org/10.3389/fmolb.2016.00027
Hailu, C., Dejene, T., & Tebeje, B. (2015). Prevalence and Socio-Demographic/Economic Risk
Factors of Low and High Body Mass Index of Urban versus Rural Pregnant Women at
Booking for Antenatal Care in Governmental Health Centers of Jimma Zone, Southwest
Ethiopia. OALib, 2(7), 1–17.
Hamner, H. C., Perrine, C. G., Gupta, P. M., Herrick, K. A., & Cogswell, M. E. (2017). Food
consumption patterns among U.S. children from birth to 23 months of age, 2009–2014.
Nutrients, 9(9), 2009–2014. https://doi.org/10.3390/nu9090942
Hasanain, F. G., Jamsiah, M., Zaleha, M. I., Tamil, A. M., & Mohammed, A. A. (2012).
Association between drinking water sources and diarrhea with malnutrition among
kindergarten‘s children in Baghdad city, Iraq. Malaysian Journal of Public Health
Medicine, 12(1), 45–48.
Herrador, Z., Sordo, L., Gadisa, E., Buño, A., Gómez-Rioja, R., Iturzaeta, J. M., … Custodio, E.
(2014). Micronutrient deficiencies and related factors in school-aged children in ethiopia: A
cross-sectional study in Libo Kemkem and Fogera Districts, Amhara Regional State. PLoS
ONE, 9(12), 1–20. https://doi.org/10.1371/journal.pone.0112858
Herrador, Z., Sordo, L., Gadisa, E., Moreno, J., Nieto, J., Benito, A., … Custodio, E. (2014).
Cross-sectional study of malnutrition and associated factors among school aged children in
197
rural and urban settings of fogera and libo kemkem districts, ethiopia. PLoS ONE, 9(9):
e105880. doi:10.1371/journal.pone.0105880
Herrmann, W., & Obeid, R. (2013). Utility and limitations of biochemical markers of vitamin
B12 deficiency. Eur J Clin Invest, 43(3), 231–237. https://doi.org/10.1111/eci.12034
Hirvonen, K., Taffesse, A. S., & Worku Hassen, I. (2016). Seasonality and household diets in
Ethiopia. Public Health Nutrition, 19(10), 1723–1730.
https://doi.org/10.1017/S1368980015003237
Hirvonen, K., Hoddinott, J., Minten, B., & Stifel, D. (2017). Children‘s Diets, Nutrition
Knowledge, and Access to Markets. World Development, 95, 303–315.
https://doi.org/10.1016/j.worlddev.2017.02.031
Hm, H. T., Ahmed, E. M., and N, A. A. M. (2018). Food Taboos among Pregnant Women in
Health Centers, Khartoum StateSudan, 2016. International Journal of Science and
Healthcare Research, 3(1), 1-13.
Hundera, T. D., Gemede, H. F., Wirtu, D., & Kenie, D. N. (2015). Nutritional Status and
Associated Factors among Lactating Mothers in Nekemte Referral Hospital and Health
Centers, Ethiopia. Food Science and Quality Management, 35, 64–72. Retrieved from
http://iiste.org/Journals/index.php/FSQM/article/view/19192
Bazzano, A. N., Potts, K. S., & Mulugeta, A. (2018). How do pregnant and lactating women, and
young children, experience religious food restriction at the community level? A qualitative
study of fasting traditions and feeding behaviors in four regions of Ethiopia. PLoS ONE,
13(12). https://doi.org/10.1371/journal.pone.0208408

198
IMF. (2011). The Federal Democratic Republic of Ethiopia : Poverty Reduction Strategy Paper :
Growth and transformation Plan 2010/11-2014/15-Volume I. Washington D.C.
Iqbal, S., Zakar, R., Zakar, M. Z., & Fischer, F. (2017). Factors associated with infants‘ and
young children‘s (6-23 months) dietary diversity in Pakistan: Evidence from the
demographic and health survey 2012-13. Nutrition Journal, 16(1).
https://doi.org/10.1186/s12937-017-0297-7
Jati, I. R. A. P., Widmer, C., Purwestri, R. C., Wirawan, N. N., Gola, U., Lambert, C., and
Biesalski, H. K. (2014). Design and validation of a program to identify inadequate intake of
iron, zinc, and vitamin A. Nutrition, 30(11–12), 1310–1317.
https://doi.org/10.1016/j.nut.2014.03.015
Jayatissa, R., Bekele, A., Piyasena, C. L., & Mahamithawa, S. (2006). Assessment of nutritional
status of children under five years of age , pregnant women , and lactating women living in
relief camps after the tsunami in Sri Lanka. Food and Nutrition Bulletin, 27(2), 144–152.
Coates, J., Swindale, A., & Bilinsky, P. (2007). Household Food Insecurity Access Scale
(HFIAS) for Measurement of Food Access: Indicator Guide. Journal of Chemical
Information and Modeling (Vol. 53, pp. 1689–1699).
https://doi.org/10.1017/CBO9781107415324.004
Kandala, N., Fahrmeir, L., Klasen, S., and Priebe, J. (2009). Geo-additive Models of Childhood
Undernutrition in Three Sub-Saharan African Countries 1. Population, Space and Place,
473(December 2008), 461–473.
Kassa, T., Meshesha, B., Haji, Y., & Ebrahim, J. (2016). Appropriate complementary feeding
199
practices and associated factors among mothers of children age 6-23 months in Southern
Ethiopia, 2015. BMC Pediatrics, 16(1), 1–10. https://doi.org/10.1186/s12887-016-0675-x
Kariuki, L. W., Lambert, C., Purwestri, R. C., Maundu, P., & Biesalski, H. K. (2017). Role of
food taboos in energy, macro and micronutrient intake of pregnant women in western
Kenya. Nutrition and Food Science, 47(6), 795–807. https://doi.org/10.1108/NFS-09-2016-
0146
Karl Knutsson, E., & Selinus, R. (1970). Fasting in Ethiopia. The American Journal of Clinical
Nutrition, 23(7), 956–969.
Khan, G. N., Ariff, S., Khan, U., Habib, A., Umer, M., Suhag, Z., … Soofi, S. (2017).
Determinants of infant and young child feeding practices by mothers in two rural districts of
Sindh, Pakistan: A cross-sectional survey. International Breastfeeding Journal, 12(1), 1–8.
https://doi.org/10.1186/s13006-017-0131-z
Kiziltan, G., Karabudak, E., Tuncay, G., Avsar, F., Tuncay, P., Mungan, O., & Meral, P. (2005).
Dietary intake and nutritional status of Turkish pregnant women during Ramadan. Saudi
Med J, 26(11), 1782–1787.
Koufakis, T., Karras, S., Antonopoulou, V., Angeloudi, E., Zebekakis, P., and Kotsa, K. (2017).
Effects of Orthodox religious fasting on human health: a systematic review. European
Journal of Nutrition, 56(8), 2439–2455. https://doi.org/10.1007/s00394-017-1534-8
Kumera, G., Tsedal, E., & Ayana, M. (2018). Dietary diversity and associated factors among
children of Orthodox Christian mothers/caregivers during the fasting season in Dejen
District, North West Ethiopia. Nutrition and Metabolism. 15:16.

200
https://doi.org/10.1186/s12986-018-0248-0
Kwok, T., Cheng, G., Lai, W. K., Poon, P., Woo, J., & Pang, C. P. (2004). Use of Fasting
Urinary Methylmalonic Acid to Screen for Metabolic Vitamin B12 Deficiency in Older
Persons. Nutrition, 20, 1–4. https://doi.org/10.1016/j.nut.2004.06.001
Lambert, C., Eleraky, L., Mbwana, H., Kinabo, J., Biesalski, H. K., Riedel, S., … Stuetz, W.
(2018). Validation of a food group based nutrition software to assess nutrient intake in
Tanzania. In Global food security and food safety: The role of universities (Vol. 30, p.
2018). Ghent, Belgium: Ghent University.
Lander, R., Enkhjargal, T. S., Batjargal, J., Bolormaa, N., Enkhmyagmar, D., Tserendolgor, U.,
… Gibson, R. S. (2010). Poor dietary quality of complementary foods is associated with
multiple micronutrient deficiencies during early childhood in Mongolia. Public Health
Nutrition, 13(9), 1304–1313. https://doi.org/10.1017/S1368980009991856
Lazarou, C., and Matalas, A. (2010). A critical review of current evidence , perspectives and
research implications of diet-related traditions of the Eastern Christian Orthodox Church on
dietary intakes and health consequences. International Journal of Food Sciences and
Nutrition, 61:7, 739-758. DOI: 10.3109/09637481003769782.
Lebso, M., Anato, A., & Loha, E. (2017). Prevalence of anemia and associated factors among
pregnant women in Southern Ethiopia: A community based cross-sectional study. PLoS
ONE, 12(12), 1–11. https://doi.org/10.1371/journal.pone.0188783
Leiper, J., Molla, A. M., and Molla, A. M. (2003). Effects on health of fluid restriction during
fasting in Ramadan. European Journal of Clinical Nutrition, 57(2), S30–S38.
201
https://doi.org/10.1038/sj.ejcn.1601899
Ludwig, C., & Bau, A. (2007). Nutrition Baseline Survey - Ethiopia -for the Global Programme:
Food and Nutrition Security and Enhanced Resilence. Addis Ababa, Ethiopia.
Lyu, L., Hsu, Y., Chen, H., Lo, C., & Lin, C. (2014). Comparisons of four dietary assessment
methods during pregnancy in Taiwanese women. Taiwanese Journal of Obstetrics &
Gynecology, 53(2), 162–169. https://doi.org/10.1016/j.tjog.2014.04.007
Maliwichi-nyirenda, C. P., Maliwichi, L. L., Maliwichi-nyirenda, C. P., and Maliwichi, L. L.
(2017). Studies on Ethno-Medicine Food Related Taboos Observed During Pregnancy in
Malawi Food Related Taboos Observed During Pregnancy in Malawi. Studies on Ethno-
Medicine, 10(2), 263–268. https://doi.org/10.1080/09735070.2016.11905496
Makoka, D., & Masibo, P. K. (2015). Is there a threshold level of maternal education sufficient
to reduce child undernutrition ? Evidence from Malawi, Tanzania and Zimbabwe. BMC
Pediatrics, 15, 1–10. https://doi.org/10.1186/s12887-015-0406-8
Marie-Claude; Kennedy, Gina; Lee, Warren T. K.; and Moursi, Mourad. 2015. Moving forward
on choosing a standard operational indicator of women‘s dietary diversity. Rome, Italy:
Food and Agricultural Organization of the United Nations (FAO). http://www.fao.org/3/a-
i4942e.pdf
Masreha Tessema, Tefera Belachew, & Getahun Ersino. (2013). Feeding patterns and stunting
during early childhood in rural communities of Sidama, south Ethiopia. Pan African
Medical Journal, 14(75), 1–12. https://doi.org/10.11604/pamj.2013.14.75.1630
McGovern, M. E., Krishna, A., Aguayo, V. M., and Subramanian, S. V. (2017). A review of the
202
evidence linking child stunting to economic outcomes. International Journal of
Epidemiology, 46(4). https://doi.org/10.1093/ije/dyx017
Meyer-Rochow, V. B. (2009). Food taboos: Their origins and purposes. Journal of Ethnobiology
and Ethnomedicine, 5, 1–10. https://doi.org/10.1186/1746-4269-5-18
Mekonnen, T. C., Workie, S. B., Yimer, T. M., & Mersha, W. F. (2017). Meal frequency and
dietary diversity feeding practices among children 6–23 months of age in Wolaita Sodo
town, Southern Ethiopia. Journal of Health, Population and Nutrition, 36(1), 18.
https://doi.org/10.1186/s41043-017-0097-x
Mekuria, G., Wubneh, Y., & Tewabe, T. (2017). Household dietary diversity and associated
factors among residents of finote selam town , north west Ethiopia : a cross sectional study.
BMC Nutrition, 3(28), 3–8. https://doi.org/10.1186/s40795-017-0148-0
Mengistu, G., Moges, T., Samuel, A., & Baye, K. (2017). Energy and nutrient intake of infants
and young children in pastoralist communities of Ethiopia. Nutrition, 41, 1–6.
https://doi.org/10.1016/j.nut.2017.02.012
Mesfin, A., Henry, C., Girma, M., & Whiting, S. J. (2016). Use of pulse crops in complementary
feeding of 6-23-month-old infants and young children in Taba Kebele, Damot Gale District,
Southern Ethiopia. Journal of Public Health in Africa, 6(1), 1–6.
https://doi.org/10.4081/jphia.2015.357
Meyer-Rochow, V. B. (2009). Food taboos: Their origins and purposes. Journal of Ethnobiology
and Ethnomedicine, 5, 1–10. https://doi.org/10.1186/1746-4269-5-18

203
Morseth, M. S., Torheim, L. E., Gebremariam, M. K., Chandyo, R. K., Ulak, M., Shrestha, S. K.,
… Henjum, S. (2018). Tracking of infant and young child feeding practices among 9- to 24-
month-old children in Nepal: The MAL-ED Birth Cohort Study. Public Health Nutrition,
21(2), 355–364. https://doi.org/10.1017/S1368980017002294
Mosites, E. M., Rabinowitz, P. M., Thumbi, S. M., & Montgomery, J. M. (2015). The
Relationship between Livestock Ownership and Child Stunting in Three Countries in
Eastern Africa Using National Survey Data. PLoS ONE, 10(9), 1–10.
https://doi.org/10.1371/journal.pone.0136686
Müller, O., & Krawinkel, M. (2005). Malnutrition And Health In Developing Countries.
Canadian Medical Association Journal, 173(3), 279–286.
https://doi.org/10.1503/cmaj.050342
Mulat, E., Alem, G., Woyraw, W., & Temesgen, H. (2019). Uptake of minimum acceptable diet
among children aged 6 – 23 months in orthodox religion followers during fasting season in
rural area , Dembecha, north West Ethiopia. BMC Nutrition, 5(18), 1–10.
Mulugeta, A., Hagos, F., Kruseman, G., Linderhof, B., Stoecker, B., Abraha, Z., … Samual, G.
G. (2010). Factors Contributing to Child Malnutrition in Tigray , Northern Ethiopia. East
African Medical Journal, 87(6), 248–254. https://doi.org/10.4314/eamj.v87i6.63083
National Academy of Sciences. (1991). Nutrition During Lactation (4th Editio). Washington,
D.C: National Academy Press.
Naik, R. and R. Smith. 2015. Linkages Between Family Planning and Nutrition. Washington,
DC: Futures Group, Health Policy Project
204
Negash, C., Whiting, S. J., Henry, C. J., Belachew, T., & Hailemariam, T. G. (2015). Association
between maternal and child nutritional status in Hula , rural southern Ethiopia : A cross
sectional study. PLoS ONE, 10(11), e0142301.
https://doi.org/10.1371/journal.pone.0142301
Neumann, C., Harris, D. M., & Rogers, L. M. (2002). Contribution of animal source foods in
improving diet quality and function in children in the developing world. Nutrition Research,
22, 193–220.
Nguyen, P. H., Avula, R., Ruel, M. T., Saha, K. K., Ali, D., Tran, L. M., … Rawat, R. (2013).
Maternal and Child Dietary Diversity Are Associated in Bangladesh, Vietnam, and
Ethiopia. The Journal of Nutrition, 143, 1176–1183. https://doi.org/10.3945/jn.112.172247.
Nigatu, M., Gebrehiwot, T. T., & Gemeda, D. H. (2018). Household Food Insecurity, Low
Dietary Diversity, and Early Marriage Were Predictors for Undernutrition among Pregnant
Women Residing in Gambella, Ethiopia. Advances in Public Health, 2018(1350195), 10.
https://doi.org/https://doi.org/10.1155/2018/1350195
Nkurunziza, S., Meessen, B., Van geertruyden, J. P., & Korachais, C. (2017). Determinants of
stunting and severe stunting among Burundian children aged 6-23 months: Evidence from a
national cross-sectional household survey, 2014. BMC Pediatrics.
https://doi.org/10.1186/s12887-017-0929-2
Nyaruhucha, C. N. M., Msuya, J. M., Mamiro, P. S., & Kerengi, A. J. (2006). Nutritional status
and feeding practices of under-five children in Simanjiro District, Tanzania. Tanzania
Health Research Bulletin, 8(3), 162–167.
Ocampo-Guirindola, M. L., Garcia-Malabad, C. J., Valdeabella-Maniego, M. L. M., & Punzalan,
205
S. L. M. (2016). Association between dietary diversity score and nutritional status of
Filipino children aged 6-23 months. Philippine Journal of Science, 145(1), 57–69.
Ogechi, U. P., & Chilezie, O. V. (2017). Assessment of Dietary Diversity Score, Nutritional
Status and Socio-demographic Characteristics of Under-5 Children in Some Rural Areas of
Imo State, Nigeria. Mal J Nutr, 23(3), 425–435.
Özaltin, E., Hill, K., & Subramanian, S. V. (2011). Association of Maternal Stature With
Offspring Mortality, Underweight, and Stunting in Low- to Middle-Income Countries.
JAMA, 303(15), 1507–1516. https://doi.org/10.1001/jama.2010.450.
Papadaki, A., Vardavas, C., Hatzis, C., and Kafatos, A. (2007). Calcium, nutrient and food intake
of Greek Orthodox Christian monks during a fasting and non-fasting week. Public Health
Nutrition, 11(10), 1022–1029. https://doi.org/10.1017/S1368980007001498
Picciano, M. F. (2003). Dietary Supplement Use in Women : Current Status and Future
Directions Pregnancy and Lactation : Physiological Adjustments , Nutritional Requirements
and the Role of Dietary Supplements. J. Nutr., 133, 1997–2002.
Rakicioǧlu, N., Samur, G., Topçu, A., & Topçu, A. A. (2006). The effect of Ramadan on
maternal nutrition and composition of breast milk. Pediatrics International, 48(3), 278–283.
https://doi.org/10.1111/j.1442-200X.2006.02204.x
Regassa, N., & Stoecker, B. J. (2012). Household food insecurity and hunger among households
in Sidama district, southern Ethiopia. Public Health Nutrition, 15(7), 1276–1283.
https://doi.org/10.1017/S1368980011003119
Riang‘a, R. M., Broerse, J., and Nangulu, A. K. (2017). Food beliefs and practices among the

206
Kalenjin pregnant women in rural Uasin Gishu County, Kenya. Journal of Ethnobiology
and Ethnomedicine, 13(1). https://doi.org/10.1186/s13002-017-0157-8
Roba, K. T., O‘Connor, T. P., Belachew, T., and O‘Brien, N. M. (2015). Seasonal variation in
nutritional status and anemia among lactating mothers in two agro-ecological zones of rural
Ethiopia: A longitudinal study. Nutrition, 31(10), 1213–1218.
https://doi.org/10.1016/j.nut.2015.03.007
Roba, K. T., O‘Connor, T. P., Belachew, T., and O‘Brien, N. M. (2016a). Infant and Young
Child Feeding (IYCF) Practices Among Mothers of Children Aged 6–23 Months in Two
Agro-ecological Zones of Rural Ethiopia. International Journal of Nutrition and Food
Sciences, 5(3), 185. https://doi.org/10.11648/j.ijnfs.20160503.16
Roba, K. T., O‘Connor, T. P., Belachew, T., and O‘Brien, N. M. (2016b). Variations between
post- and pre-harvest seasons in stunting, wasting, and infant and young child feeding
(IYCF) practices among children 6-23 months of age in lowland and midland agro-
ecological zones of rural Ethiopia. Pan African Medical Journal, 24, 1–9.
https://doi.org/10.11604/pamj.2016.24.163.9387
Sadeghirad, B., Motaghipisheh, S., Kolahdooz, F., Zahedi, M. J., and Haghdoost, A. A. (2014).
Islamic fasting and weight loss: A systematic review and meta-analysis. Public Health
Nutrition, 17(2), 396–406. https://doi.org/10.1017/S1368980012005046
Sarri, K. O., Tzanakis, N. E., Linardakis, M. K., Mamalakis, G. D., & Kafatos, A. G. (2003).
Effects of Greek orthodox christian church fasting on serum lipids and obesity. BMC Public
Health, 8, 1–8.
207
Sarri, K. O., Linardakis, M. K., Bervanaki, F. N., Tzanakis, N. E., & Kafatos, A. G. (2004).
Greek Orthodox fasting rituals: a hidden characteristic of the Mediterranean diet of Crete.
British Journal of Nutrition, 92, 277–284. https://doi.org/10.1079/BJN20041197
Sarri, K. O., Kafatos, A. G., and Higgins, S. (2005). Is religious fasting related to iron status in
Greek Orthodox Christians ? British Journal of Nutrition, 2001, 198–203.
https://doi.org/10.1079/BJN20051472
Schlemmer, U., Frølich, W., Prieto, R. M., & Grases, F. (2009). Phytate in foods and
significance for humans: food sources, intake, processing, bioavailability, protective role
and analysis. Mol Nutr Food Re, 53(Suppl 2), S330-75. https://doi.org/doi:
10.1002/mnfr.200900099.
Schwei, R. J., Tesfay, H., Asfaw, F., Jogo, W., & Busse, H. (2017). Household dietary diversity,
vitamin A consumption and food security in rural Tigray, Ethiopia. Public Health Nutrition,
20(9), 1540–1547. https://doi.org/10.1017/S1368980017000350
Sellassie, S. H., and Mikael, B. (2019). Worship in the Ethiopian Orthodx church. Retrieved
March 12, 2019, from https://www.ethiopianorthodox.org/english/ethiopian/worship.html
Senarath, U., Godakandage, S. S. P., Jayawickrama, H., Siriwardena, I., & Dibley, M. J. (2012).
Determinants of inappropriate complementary feeding practices in young children in Sri
Lanka: Secondary data analysis of Demographic and Health Survey 2006-2007. Maternal
and Child Nutrition, 8(SUPPL. 1), 60–77. https://doi.org/10.1111/j.1740-
8709.2011.00375.x
208
Silva, D. e, Valente, A., Borges, A., Almeida, F., Neves, E., & Afonso, C. (2017). Relationship
between the mothers‘ nutritional status with that of a child population from São Tomé
Principe, ― Africa. Rev. Bras. Saúde Matern. Infant., Recife, 17(2), 327–335.
https://doi.org/http://dx.doi.org/10.1590/1806-93042017000200007
Sitotaw, I. K., Kiday, H., & Adama, Y. (2017). Comparison of nutritional status and associated
factors of lactating women between lowland and highland communities of District Raya,
Alamata. BMC Nutrition, 3(61), 1–12. https://doi.org/10.1186/s40795-017-0179-6
Sohnesen, T. P., Ambel, A. A., Fisker, P., Andrews, C., and Khan, Q. (2017). Small area
estimation of child undernutrition in Ethiopian districts. PLoS ONE, 12(4), 1–17.
https://doi.org/https://doi.org/10.1371/ journal.pone.0175445
Solomon, D., Aderaw, Z., & Tegegne, T. K. (2017). Minimum dietary diversity and associated
factors among children aged 6-23 months in Addis Ababa, Ethiopia. International Journal
for Equity in Health, 16(1), 1–9. https://doi.org/10.1186/s12939-017-0680-
Steyn, N. P., Nel, J. H., Nantel, G., Kennedy, G., & Labadarios, D. (2006). Food variety and
dietary diversity scores in children : are they good indicators of dietary adequacy ? Public
Health Nutrition, 9(5), 644–650. https://doi.org/10.1079/PHN2005912.
Stoecker, B. J., and Abebe, Y. (2014). Context for food-based approaches for improved feeding
of infants and children in Ethiopia. Food and Nutrition Bulletin, 35(4), S209–S213.
https://doi.org/10.1177/15648265140354S308.
Tafa, M., Haidar, J., & Fekadu, H. (2015). Gynecology & Obstetrics Modern Family Planning
Use and its Relationship with the Nutritional Status of Women of Child Bearing Age at
209
Tena District , Arsi Zone Oromia Regional State , Ethiopia 2013 : A Community based
Case Control Study. Gynecology & Obstetrics, 5(3), 1–10. https://doi.org/10.4172/2161-
0932.1000282
Tamiru, M. W., Tolessa, B. E., & Abera, S. F. (2015). Under Nutrition and Associated Factors
Among Under-Five Age Children of Kunama Ethnic Groups in Tahtay Adiyabo Woreda ,
Tigray Regional State , Ethiopia : Community Based Study. International Journal of
Nutrition and Food Sciences, 4(3), 277–288. https://doi.org/10.11648/j.ijnfs.20150403.15
Tebekaw, Y., Teller, C., & ColÃ3n-Ramos, U. (2014). The burden of underweight and
overweight among women in Addis Ababa, Ethiopia. BMC Public Health, 14(1126).
https://doi.org/10.1186/1471-2458-14-1126
Tassew, A. A., Tekle, D. Y., Belachew, A. B., & Adhena, B. M. (2019). Factors affecting
feeding 6–23 months age children according to minimum acceptable diet in Ethiopia: A
multilevel analysis of the Ethiopian Demographic Health Survey. PLoS ONE, 14(2).
https://doi.org/10.1371/journal.pone.0203098
Tegegne, M., Sileshi, S., Benti, T., Teshome, M., & Woldie, H. (2017). Factors associated with
minimal meal frequency and dietary diversity practices among infants and young children in
the predominantly agrarian society of Bale zone, Southeast Ethiopia: A community based
cross sectional study. Archives of Public Health, 75(1), 1–11.
https://doi.org/10.1186/s13690-017-0216-6
Tesfaye, B., Sinclair, K., Wuehler, S. E., Moges, T., De-regil, L. M., & Dickin, K. L. (2018).
Applying international guidelines for calcium supplementation to prevent pre-eclampsia :
simulation of recommended dosages suggests risk of excess intake in Ethiopia. Public
210
Health Nutrition, 22(3), 531–541. https://doi.org/10.1017/S1368980018002562
Tessema, M., De Groote, H., Brouwer, I. D., Feskens, E. J. M., Belachew, T., Zerfu, D., …
Gunaratna, N. S. (2019). Soil zinc is associated with serum zinc but not with linear growth
of children in Ethiopia. Nutrients, 11(221). https://doi.org/10.3390/nu11020221
Tewodros, D. (2008). Beef Cattle Production System and Opportunities for Market Orientation
in Borena Zone, Southern. MSc Thesis, Department of Animal Sciences. Haromaya
University.Pp.139.
Tezera, R., Sahile, Z., Yilma, D., Misganaw, E., & Mulu, E. (2018). Prevalence of anemia
among school-age children in Ethiopia: A systematic review and meta-analysis. Systematic
Reviews, 7(1). https://doi.org/10.1186/s13643-018-0741-6
Tigga, P. L., & Sen, J. (2016). Maternal Body Mass Index Is Strongly Associated with Children
Z -Scores for Height and BMI. Journal of Anthropology, 2016(6538235), 10.
https://doi.org/10.1155/2016/6538235
Tigray Region Agriculture and Rural Development Bureau. (2016). Food Security Status of
Tigray Districts 2016.pdf.
Tolulope, A., and Olubukola, B. (2015). Spatial Pattern of Household Food Insecurity and
Childhood Malnutrition in Akinyele Local Government Area, Nigeria, (January).
https://doi.org/10.15640/ijhs.v3n1a15
Trepanowski, J. F., and Bloomer, R. J. (2010). The impact of religious fasting on human health.
Nutrition Journal, 9(1), 57. https://doi.org/10.1186/1475-2891-9-57

211
UNICEF. (1998). The status of the world’s children. Geneva, Switzerland: Oxford University
Press.
UNICEF. (2015). UNICEF’s approach to scaling up nutrition for mothers and their children.
Discussion paper. Programme Division, UNICEF, New York, June 2015.
UNICEF. (2017). Leveles and trend in child malnutrition: UNICEF/WHO/World Bank Group
joint estimates , key findings of the 2017 edition.
Vasilevski, V., Alban, S., Box, P. O., Carolan-olah, M., & Affiliation, M. (2016). Ethiopian
pregnancy food taboos. Journal of Clinical Nursing, 25(19), 3069–3075.
https://doi.org/https://doi.org/10.1111/jocn.13319
Vollmer, S., Bommer, C., Krishna, A., Harttgen, K., & Subramanian, S. V. (2017). The
association of parental education with childhood undernutrition in low- and middle-income
countries : comparing the role of paternal and maternal education. International Journal of
Epidemiology, 46(August 2016), 312–323. https://doi.org/10.1093/ije/dyw133
Weldehaweria, N. B., Misgina, K. H., Weldu, M. G., Gebregiorgis, Y. S., Gebrezgi, B. H.,
Zewdie, S. W., … Alemu, W. (2016). Dietary diversity and related factors among lactating
women visiting public health facilities in Aksum town, Tigray, Northern Ethiopia. BMC
Nutrition, 2(38). https://doi.org/10.1186/s40795-016-0077-3
WFP. (2009). Food Security and Vulnerability in Selected Towns of Tigray Region , Ethiopia.
WHO. (1998). Complementary feeding of young children in developing countries: a review of
current scientific knowledge. Geneva, Switzerland.
WHO. (2010). Indicators for assessing infant and young child feeding practices. Part 3 Country
212
Profiles, 1–47. https://doi.org/ISBN 978 92 4 159975 7
WHO. (2014). Postnatal care of the mother and newborn 2013. World Health Organization, 1–
72. https://doi.org/978 92 4 150664 9
WHO. (2011). The Global Prevalence of Anaemia in 2011. Document, World Heal, 1–43.
Williams, J., Mai, C. T., and Mulinare, J. (2015). National Birth Defects Prevention Month and
Folic Acid Awareness Week — January 2015 Updated Estimates of Neural Tube Defects
Prevented by Mandatory Folic Acid Fortification — United States , 1995 – 2011. MMWR,
64(1), 1–5.
Workicho, A., Belachew, T., Feyissa, G. T., Wondafrash, B., Lachat, C., Verstraeten, R., &
Kolsteren, P. (2016). Household dietary diversity and Animal Source Food consumption in
Ethiopia: Evidence from the 2011 Welfare Monitoring Survey. BMC Public Health,
16(1192). https://doi.org/10.1186/s12889-016-3861-8
Wu, X., & Li, L. (2012). Family size and maternal health: Evidence from the One-Child policy
in China. Journal of Population Economics, 25(4), 1341–1364.
https://doi.org/10.1007/s00148-011-0361-0
Zerfu, T. A., Umeta, M., & Baye, K. (2016). Dietary habits, food taboos, and perceptions
towards weight gain during pregnancy in Arsi, rural central Ethiopia: a qualitative cross-
sectional study. Journal of Health, Population, and Nutrition, 35(1), 22.
https://doi.org/10.1186/s41043-016-0059-8
Zhang, J., Kang, H., Wang, L., Zhao, X., Liu, R., & He, L. (2016). A Prevalence Analysis to

213
Assess the Relationship between Maternal and Children‘ s Nutritional Status in North-
Western Rural China Clinics in Mother and Child Health. Clinics in Mother and Child
Health, 13(2), 100242. https://doi.org/10.4172/2090-7214.1000242
Zhao, W., Yu, K., Tan, S., Zheng, Y., Zhao, A., Wang, P., & Zhang, Y. (2017). Dietary diversity
scores : an indicator of micronutrient inadequacy instead of obesity for Chinese children.
BMC Public Health, 17(440). https://doi.org/10.1186/s12889-017-4381-x

214
Affidavit
Annex 2 to the University of Hohenheim doctoral degree regulations for Dr. rer. nat.
Affidavit according to Sec. 7(7) of the University of Hohenheim doctoral degree
regulations for Dr. rer. nat.
1. For the dissertation submitted on the topic
Dietary Intake, Nutritional Status of Lactating Women and their 6-23-Months-Old Children in
Genta Afeshum District, Rural Ethiopia; Development and Validation of Calculator for
Inadequate Micronutrient Intake (CIMI)
I hereby declare that I independently completed the work.
2. I only used the sources and aids documented and only made use of permissible assistance by
third parties. In particular, I properly documented any contents which I used- either by directly
quoting or paraphrasing - from other works.
3. I did not accept any assistance from a commercial doctoral agency or consulting firm.
4. I am aware of the meaning of this affidavit and the criminal penalties of an incorrect or
incomplete affidavit.
I hereby confirm the correctness of the above declaration: I hereby affirm in lieu of oath that I
have, to the best of my knowledge, declared nothing but the truth and have not omitted any
information.
Place and Date Signature

215
Curriculum Vitae
Personal Information
Full name: Beruk Berhanu Desalegn
Sex: Male
Nationality: Ethiopian
Date of Birth: July 26, 1985G.C
Place of Birth: Hawassa, Ethiopia
Contact Address
School of Nutrition, Food Science and Technology
Hawassa University, Hawassa, SNNPR, Ethiopia
P.O. Box: 05
Phone Number: +251-941048918 or +251-916041191
Email: BerukB.Desalegn @uni-hohenheim.de
Educational Information
PhD student at University of Hohenheim, Germany (Since April, 2016)
MSc student in Food Science and Post-Harvest Technology (2010-2013)
o MSc Thesis Title: Formulation of Quality Protein Maize Based Nutritionally
Improved Complementary Food: The Case of Shebedino Woreda, Southern
Ethiopia
o Thesis Result: Excellent
BSc student in Rural Development and Family Sciences (2007-2010)

216
o BSc Thesis Title: Knowledge, Attitude and Practices of Family Planning Use in
Hawella-Tulla Sub-city, Hawassa Town
Diploma in Medical Laboratory Technology (2003-2004)
Work Experience
Lecturer and researcher (Since October, 2013)
School of Nutrition, Food Science and Technology, Hawassa University
Head, Gender Office, Food preparation and Dormitory Services
o College of Agriculture, Hawassa University (2009-2013)
Data Analyst
o College of Agriculture, Hawassa University (2009)
Medical Laboratory Technician
o Ministry of Health of Ethiopia and Hawassa University (2005-2009)
Publications
1. Desalegn, B.; Lambert, C. Low diet diversity and its associated factors among the
mothers and their children in agroforestry land use systems of Sidama, Ethiopia: A
community-based cross-sectional study. Cogent Food and Agriculture 2020, 6(1),
1818367. https://doi.org/10.1080/23311932.2020.1818367
2. Desalegn, B.; Lambert, C.; Riedel, S.; Negese, T.; Biesalski, H.K. Feeding Practices and
Undernutrition in 6–23-Month-Old Children of Orthodox Christian Mothers in Rural
Tigray, Ethiopia: Longitudinal Study. Nutrients 2019, 11 (1), 138.
doi:10.3390/nu11010138
3. Desalegn, B.; Lambert, C.; Riedel, S.; Negese, T.; Biesalski, H.K. Ethiopian Orthodox
Fasting and Lactating Mothers: Longitudinal Study on Dietary Pattern and Nutritional
Status in Rural Tigray, Ethiopia. International Journal of Environmental Research and
Public Health 2018, 15 (8), 1767. doi:10.3390/ijerph15081767.
4. Desalegn, B.B.; Abegaz, K.; Kinfe, E. Assessment of Knowledge and Practices on
Complementary Food Preparation and Child Feeding at Shebedino, Sidama, Southern
217
Ethiopia. International Journal of Food Science and Nutritional Engineering 2015, 5(2),
82-87.
5. Desalegn, B.B.; Abegaz, K.; Kinfe, E. Effect of Blending Ratio and Processing
Technique on Physicochemical, Functional Properties and Sensory Acceptability of
Quality Protein Maize (QPM) Based Complementary Food. International Journal of Food
Science and Nutritional Engineering 2015, 5 (3), 121-129.
6. Berhanu, B. Effect of Soaking and Germination on Proximate Composition, Mineral
Bioavailability and Functional Properties of Chickpea Flour. Food and Public Health
2015, 5(4),108-113.
7. Desalegn, B.B.; Tadesse, F.T.; Haile, D. Physical and Proximate Characterization of
Anchote (Coccinia abyssinica) Accessions Grown Under Hawassa and Wondo Genet
Conditions, Southern Ethiopia. Food Science and Quality Management 2015, 42, 62-74.
8. Desalegn, B.B.; Abegaz, K.; Kinfe, E. Formulation of Quality Protein Maize (QPM)
Based Nutritionally Improved Complementary Food: The Case of Shebedino Woreda,
Southern Ethiopia. European Journal of Nutrition and Food Safety 2015, 5(5), 5-416.
9. Anchamo, A.A.; Pragya, S.; Bosha, B.; Desalegn, B.B. Effect of Breakfast Eating
Patterns and Anthropometric Measurements on Cognitive Function of Early Adolescents
in Rural Area of Sidama Zone, Southern Ethiopia. Journal of Food and Nutrition
Sciences 2015, 3(6), 251-258. doi: 10.11648/j.jfns.20150306.19
10. Dagem, A.; Haki, G.; Ali, K.; Desalegn, B.B.; Basore., D. Proximate, Mineral
Composition and Sensory Acceptability of Home Made Noodles from Nettle (Urtica
simensis) Leaves and Wheat Flour Blends. International Journal of Food Science and
Nutritional Engineering 2016, 6(3), 55-61. doi:10.5923/j.food.20160603.02
11. Desalegn, B.B.; Kinfe, E.; Fikre, K.; Bosha, T. Stunting and Its Associated Factors in
Under Five Years Old Children: The Case of Hawassa University Technology Villages,
Southern Ethiopia. IOSR Journal of Environmental Science, Toxicology and Food
Technology (IOSR-JESTFT) 2016, 10(11), 25-31. doi: 10.9790/2402-1011022531
12. Desalegn, B.B.; Abegaz, K.; Kinfe, E. Formulation of Quality Protein Maize (QPM)
Based Nutritionally Improved Complementary Food: The Case of Shebedino Woreda,
218
Southern Ethiopia. Proceedings of the 5th Annual Conference, Food and Nutrition
Society of Ethiopia 2015, p. 55-68.
13. Desalegn, B.B.; Tadesse, F.T.; Haile, D. Physical and Proximate Characterization and
Mineral Analysis of Anchote (Coccinia abyssinica) Accessions Grown Under Hawassa
and Wondo Genet Conditions, Southern Ethiopia. Proceedings of the 37th Annual
Research Review Workshop, Hawassa University, Hawassa, Ethiopia. 2016, p. 1-18.
14. Desalegn, B.B.; Kinfe, E.; Fikre, K.; Bosha, T. Stunting and Its Associated Factors in
Under Five Years Old Children: The Case of Hawassa University Technology Villages,
Southern Ethiopia. Proceedings of the 37th Annual Research Review Workshop,
Hawassa University, Hawassa, Ethiopia. 2016, p.45-58.
15. Getahun, D.; Berhanu, B. Formulation of Flat Bread (Kitta) from Maize (Zea Mays
Linaeus.) and Amaranth (Amaranthus Caudatus L.): Evaluation of Physico-Chemical
Properties, Nutritional, Sensory and Keeping Quality. International Journal of Food
Science and Nutritional Engineering 2017, 7(6), 125-131. DOI:
10.5923/j.food.20170706.01
16. Hassen, Y.; Mukisa, I.M.; Kurabachew, H.; Desalegn, B.B. Evaluation of Yeast and
Lactic Acid Bacteria Starter Cultures for the Production of Rice Injera. Evaluation of
Yeast and Lactic Acid Bacteria Starter Cultures for the Production of Rice Injera. J. Food
Process. Technol. 2017, 9,721. doi: 10.4172/2157-7110.1000721
17. Desalegn, B.B.; Desta, F.T. Effect of Blending Ratio on Proximate Composition,
Physico-Chemical Property, and Sensory Acceptability of Injera Produced from Red Tef
(Eragrostis tef) and Cassava (Manihot Esculenta). Food Science and Quality
Management 2017, 68,6-10.
18. Berhanu, B.; Reta, F.; Getahun, D.; Zegeye, M. Formulation of Flat Bread (Kitta) from
Maize (Zea Mays Linaeus.) and Amaranth (Amaranthus Caudatus L.): Evaluation of
Physico-Chemical Properties, Nutritional, Sensory and Keeping Quality. Proceedings of
the 38th Annual Research Review Workshop, College of Agriculture, Hawassa
University, Hawassa, Ethiopia. 2017, p. 179-187.
219
19. Desalegn, B.B.; Abegaz, K.; Kinfe, E. Assessment of Knowledge and Practices on
Complementary Food Preparation and Child Feeding at Shebedino, Sidama, Southern
Ethiopia. Book of Abstracts of Research Articles Published by Academic Staffs of
Hawassa University. Volume 2. December, 2017. Hawassa University, Hawassa,
Ethiopia.
20. Desalegn, B.B.; Abegaz, K.; Kinfe, E. Effect of Blending Ratio and Processing
Technique on Physicochemical, Functional Properties and Sensory Acceptability of
Quality Protein Maize (QPM) Based Complementary Food. Book of Abstracts of
Research Articles Published by Academic Staffs of Hawassa University. Volume 2.
December, 2017. Hawassa University, Hawassa, Ethiopia.
Scholarship and Research Grant Award
PhD research grant from German Federal Ministry for Economic Cooperation and
Development (BMZ) through the Food Security Center/DAAD Scholarship Program
PhD Scholarship Award from University of Hohenheim
Training Scholarship Award from CDI, Wageningen University and Research,
Wageningen, The Netherlands.
Large Scale Thematic Research grant from Hawassa University (1 project)
Medium and Small Scale Research grants from Hawassa University (8 projects)
MSc research grant from NORHED and USAID/ENGINE project at Hawassa University