Embed Size (px)
DESCRIPTION
Dietary Changes to Slow Chronic Kidney Disease Progression. Kalani Raphael, MD MS Division of Nephrology & Hypertension University of Utah Salt Lake City VA Health Care System. I have no financial relationships to disclose. Objectives. Overview of chronic kidney disease (CKD) - PowerPoint PPT Presentation
Citation preview

Dietary Changes to Slow Chronic Kidney Disease Progression
Kalani Raphael, MD MSDivision of Nephrology & Hypertension
University of UtahSalt Lake City VA Health Care System

I have no financial relationships to disclose

Objectives
• Overview of chronic kidney disease (CKD)
• Promising dietary intervention targets– Dietary acid – Fructose
• Dietary recommendations for CKD patients

CKD
Diagnosis– Glomerular filtration rate (GFR) < 60 ml/min
OR– Evidence of kidney injury when GFR ≥ 60 ml/min• Examples of kidney injury:– Albuminuria ≥ 30 mg/gm– Polycystic kidney disease– Glomerular hematuria (IgA nephropathy)

Causes of CKD
HypertensionDiabetesCystic kidney diseaseGlomerulonephritisInterstitial nephritisReflux Obstruction

Stages of CKD
eGFR # of Americans Mortality RiskStage 1 ≥ 90 7.7 million ~2xStage 2 60 - 89 7.3 million ~2xStage 3 30 - 59 10 million 25% over 5 yearsStage 4 15 - 29 400,000 50% over 5 yearsStage 5 < 15 600,000 20% per year
Levey et al. Kidney Int, 2011.

CKD - A Significant Burden
• 25 million Americans have CKD– 12% of US population
• Advancing CKD poor outcomes☞• ESRD accounts for 6% of Medicare budget• Kidney transplantation – scarce resource

Strategies to slow CKD progression
• ACE-I or ARB• Blood pressure control
< 140/90< 130/80
• Glucose control

Diet?Exercise?Vitamins?

REDUCE DIETARY ACID INTAKE

Acid
• A major function of kidney is to regulate H+ • Avg renal acid burden = 1 meq H+ per kg/day• Sources of acid–Diet• Protein: Red meat > fish > plant
– Endogenous production• Ketoacids, lactic acid

NH4+
Excreted
Urine
NH4+
NH4+
NH4+
NH4+
NH3
NH3
NH3
NH3 NH3
H+
H+
H+
H+
H+
H+otDogs
NH4+
Excreted
Urine
NH4+
NH4+
NH4+
NH4+
NH3
NH3
NH3
NH3 NH3
H+
H+
H+
H+
H+

↑ [NH3]
ComplementActivation
Kidney injury
Kidney Tubular Cell
Endothelin-1
H+ot Dog
CKD Progression

Does reducing renal acid burden slow CKD progression?

Sodium Bicarbonate
• Alkaline agent• Neutralizes non-volatile acid• Typically prescribed when serum bicarbonate
< 22 mmol/L in CKD patients– Bone protection– Reduce protein catabolism

Sodium bicarbonate may slow progression in moderate CKD
Dial
ysis
free
surv
ival
Time (months)
Sodium bicarbonate
Control
De Brito-Ashurst et al J Am Soc Neph 2009.
Stage 4/5 CKDSerum bicarbonate 16 – 20

Sodium bicarbonate may slow progression in early CKD
Mahajan et al Kidney International 2010
Stage 2 hypertensive CKD patientsAlbuminuriaNormal serum bicarbonate

Summary of Sodium Bicarbonate
• Sodium bicarbonate reduces acid load to the kidney
• Reduces renal ammonia production• Reduces complement-mediated kidney injury
• Can we reduce dietary acid load?1. Reduce protein intake2. Increase fruits and vegetables

Low protein diet in CKD
Improves:• Phosphorus• BP• H+
• Proteinuria• Insulin sensitivity
Disadvantages:• Protein-energy
malnutrition• Decreased muscle• Complex• Inconvenient

MDRD* Study – Study ACh
ange
in G
FR
Low Protein (0.58 gm/kg/day)
Usual Protein (1.3 gm/kg/day)
Klahr et al. NEJM 1994
*Modification of Diet in Renal Disease
GFR 25-55 ml/min

ESRD
ESRD or Death
p=NS for both
Levey et al AJKD 2006.
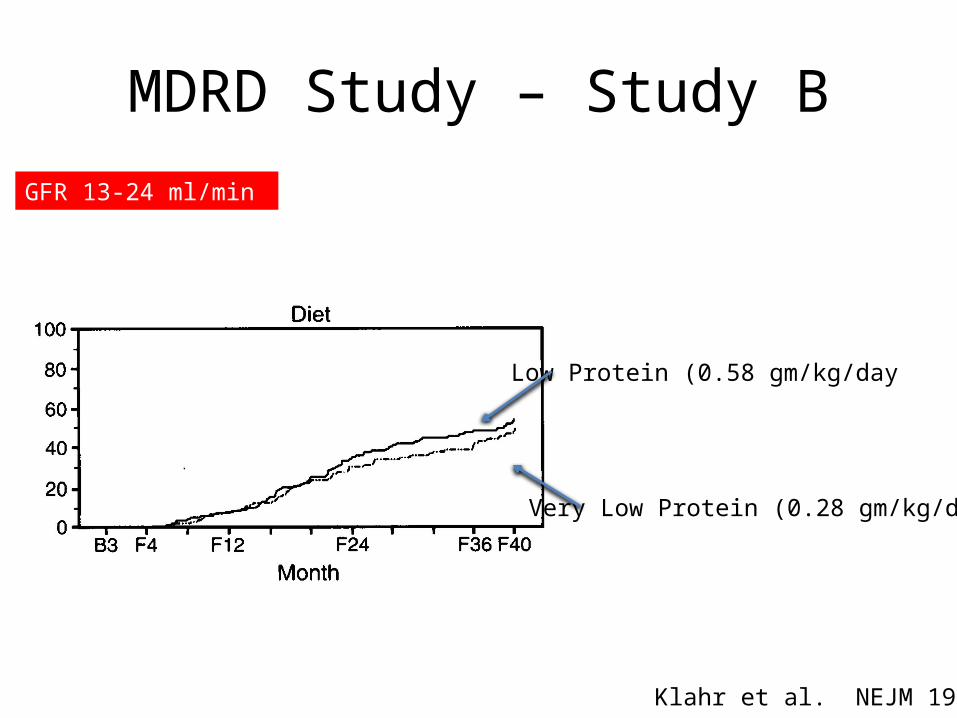
MDRD Study – Study B
Low Protein (0.58 gm/kg/day
Very Low Protein (0.28 gm/kg/day
GFR 13-24 ml/min
Klahr et al. NEJM 1994

ESRD
Death
Menon et al AJKD 2009.

Low protein diet - Summary
• Theoretically beneficial
• Clinical trials inconclusive– Unlikely to be replicated
• Personal recommendation– Substitute red meat with poultry, fish, plant
protein

Fruits & Vegetables – Interventional Study
Key entry criteria• Stage 4 CKD (GFR 15 – 29)• Metabolic acidosis (Bicarb < 22)Intervention• Sodium bicarbonate (1meq/kg/day) or• Fruits and vegetables (reduce acid load by ½)
Goraya et al Kidney Int 2013.

F/V Strategy
• Apples• Apricots• Oranges• Peaches• Pears• Raisins• Strawberries
• Carrots• Cauliflower• Eggplant• Lettuce
• Potatoes• Spinach• Tomatoes• Zucchini
Enough given for all household members
Provided free from local food bank
Goraya et al Kidney Int 2013.

Baseline One year3035404550556065
Renal Acid Load (mmol/d)
BicarbonateFruit/Veg
Baseline One year18.5
1919.5
2020.5
2121.5
22
Serum Bicarbonate (mM)
Baseline One year05
1015202530
8-hr Urinary H+ Excretion (mM)
Due to ↓NH4+
Goraya et al Kidney Int 2013.

Other findings
Bicarbonate and fruits/vegetables reduce urinary:1. Albumin
No hyperkalemia observed in F/V group• Pts had K < 4.7 at baseline
Goraya et al Kidney Int 2013.

Augmenting diet with fruits & vegetables1. Reduces acid burden2. Reduces renal ammonia production3. Normalizes serum bicarbonate4. Ameliorates kidney injury

Practical Recommendation F/V
• Increase fruits/veg in the diet
• Caution if K is > 5.0– Reduce K with diuretics

REDUCE FRUCTOSE INTAKE

Fructose
Uric Acid HTN
Fructose
CKD

Fructose
Uric Acid
InflammationOxidative stressReduced NO
Kidney Injury
CKD Progression
OtherMechanisms??

Fructose
• Primary sources in Western diet– High fructose corn syrup– Table sugar (sucrose)
• Avg American consumes 64 pounds of fructose/yr
• In large quantities, systemic levels high enough to be filtered by kidney

Nakayama et al. AJP Renal Phys 2010. Gersch et al AJP Renal Phys 2007.
Normal rats
CKD rats

Baseline Week 5 Week 90
1020304050607080
BUN mg/dL
Normal DietFructose DietDextrose Diet
Gersch et al AJP Renal Phys 2007.

0 1 2 30.0%2.0%4.0%6.0%8.0%
10.0%12.0%14.0%16.0%18.0%20.0%
8.7%9.6%
12.2%
15.3%
Age-Adjusted Prevalence of Albuminuria
p<0.001
Number of sugary soft drinks per day
Shohan et al PLOS One 2008.

Shohan et al PLOS One 2008.

Low fructose diet – interventional study
• 28 non-DM CKD stage 2 or 3• Basal fructose intake (~60 gm/day)• 6 wk low fructose (~12 gm/day)– Designed to reduce by 80%
• Return to basal diet for 6 wks (~53 gm/day)• No diff in caloric intake• Reduce consumption of sucrose-sweetened
and artificially sweetened drinks & foods

Basal Low Fructose Basal0
10203040506070
Fructose Intake
Basal Low Fructose Basal6
6.26.46.66.8
77.2
Uric Acid
Basal Low Fructose Basal125126127128129130131132
SBP
Brymora et al Nephrol Dial Trans 2012.
Basal Low Fructose Basal0
10
20
30
40
50
TGF-beta

Summary - Fructose
Low fructose diet…• Improves uric acid, BP• May reduce renal inflammation• No long-term interventional studies
• It’s not good for you.

DIETARY RECOMMENDATIONS FOR CKD PATIENTS

Western Diet DASH DietRed meat, processed Poultry, fishRefined grains Whole grainsHigh-fat dairy Low-fat dairySaturated, trans-fats Unsaturated fatsHigh cholesterol Fresh fruitSugary desserts/drinks Vegetables

‘Westerner’ Diet & CKD progression
0
0.5
1
1.5
2
Western Diet
Q1 Q2 Q3 Q4
Refe
renc
e
Odd
s Rati
o
Lin et al AJKD 2011.

‘DASHier’ Diet & CKD progression
0
0.5
1
1.5
2
Western DietDASH Diet
Q1 Q2 Q3 Q4
Refe
renc
e
Odd
s Rati
o
Lin et al AJKD 2011.

Conclusion
• High H+ & fructose cause kidney injury in CKD
• Average American diet high in both
• It is sensible to increase fruits & vegetables, reduce animal protein, and eliminate sugary foods/drinks.

Summary - Dietary Recommendations for CKD
1. Stop soda, fruit drinks2. Rare desserts3. Fresh fruit and vegetables (monitor K+)4. Fish, chicken breast5. Plant based protein, nuts6. Less red meat, processed/canned foods7. Low fat milk (monitor phosphorus)8. Low salt