Embed Size (px)
Citation preview
DIETARY ASSESSMENT OF DOCOSAHEXAENOIC ACID (DHA) INTAKE IN
PREGNANT WOMEN OF SOUTHWEST MONTANA
by
Gita Dorothy Gelfer
A thesis submitted in partial fulfillment of the requirements for the degree
of
Master of Science
in
Health and Human Development
MONTANA STATE UNVERSITY Bozeman, Montana
July 2009

© COPYRIGHT
by
Gita Dorothy Gelfer
2009
All Rights Reserved

ii
APPROVAL
of a thesis submitted by
Gita Dorothy Gelfer
This thesis has been read by each member of the thesis committee and has been found to be satisfactory regarding content, English usage, format, citation, bibliographic style, and consistency, and is ready for submission to the Division of Graduate Education.
Dr. Christina Gayer Campbell
Approved for the Department of Health and Human Development
Dr. Timothy Dunnagan
Approved for the Division of Graduate Education
Dr. Carl A. Fox

iii
STATEMENT OF PERMISSION TO USE
In presenting this thesis in partial fulfillment of the requirements for a
mater’s degree at Montana State University, I agree that the Library shall make it
available to borrowers under rules of the Library.
If I have indicated my intention to copyright this thesis by including a
copyright notice page, copying is allowable only for scholarly purposes,
consistent with “fair use” as prescribed in the U.S. Copyright Law. Requests for
permission for extended quotation from or reproduction of this thesis in whole or
in any parts may be granted only by the copyright holder.
Gita Dorothy Gelfer
July 2009

iv
TABLE OF CONTENTS
1. INTRODUCTION..................................... .........................................................1
Statement of Purpose ………………….............................................................3 Hypotheses ……………………………..............................................................4 Limitations ………………………………. ...........................................................5 Delimitations ……………………………. ...........................................................6 Assumptions ……………………………. ...........................................................6 Operational Definitions …………………….. ......................................................7 2. REVIEW OF LITERATURE …………...............................................................8
Introduction ……………………………. .............................................................8 Lipid Metabolism ……………………… .............................................................9 Omega – 3 Metabolism ……………..........................................................10 Recommendations and Sources of DHA During Pregnancy .........................12 Influences on DHA Intake During Pregnancy ..........................................16 Effects of Marine n – 3 PUFA Consumption on Membrane Composition.......18 Placental Transfer of DHA During Pregnancy ...............................................21 Summary …………………………………….....................................................23
3. METHODOLOGY ………………………..........................................................25
Subjects …………………………………….. ....................................................25 Experimental Design …………………….........................................................26 Anthropometric Data …………………….........................................................26 Diet Record and Food Frequency Questionnaire ..........................................27 Maternal Blood Collection ……………............................................................28 Fetal Cord Blood ……………………… ...........................................................29 Post-Partum Survey ………………….. ...........................................................30 Fatty Acid Analysis …………………… ...........................................................30 Statistical Analysis ……………………............................................................31

v
TABLE OF CONTENTS – CONTINUED 4. RESULTS ………………………………...........................................................33 Introduction…………………………………......................................................33 Subjects …………………………………..........................................................33 Subject Adherence to the Project ….........................................................33 Demographic and Anthropometric Data ...................................................35 Maternal Dietary DHA Intake…………. ..........................................................37 Sources of DHA Among Participants ….........................................................40 5. DISCUSSION ………………………………. ....................................................43
Introduction …………………………….. ..........................................................43 Recommendations and Sources of DHA During Pregnancy .........................43 Meeting Current Recommendations for DHA Intake Among Participants……………….. ...........................................................44 DHA Intake During the Third Trimester of Pregnancy ..............................48 Dietary Sources of DHA ……………… .....................................................49 Sources of Error in Maternal Dietary Intake ……......................................51 Effects of Marine n – 3 PUFAs on Membrane Composition ..........................53 Relationship Between Maternal DHA intake and Maternal Blood Lipid Parameters………………………… ...........................................................53 Relationship Between Maternal and Fetal Blood Lipid Parameters .........55 Possible Sources of Error and Improvements ...............................................57 6. Conclusion ………………………………..........................................................60
REFERENCES ....…………………………… .......................................................62
APPENDICES …………………………….............................................................68
APPENDIX A: Human Subjects Consent Form ............................................69 APPENDIX B: Medical History Questionnaire ...............................................74 APPENDIX C: Medical Provider Consent Form ...........................................79 APPENDIX D: 3-day Diet Record Example ..................................................81 APPENDIX E: Food Frequency Questionnaire ............................................84 APPENDIX F: Post-Partum Survey … ........................................................101 APPENDIX G: List of Endangered Species ................................................108 APPENDIX H: Participant Adherence to the Project ...................................113

vi
LIST OF TABLES Table Page 2.1. Marine Sources of DHA …………...............................................................14
2.2. Sources of DHA from Fish Oil Supplementation ........................................15
2.3. Miscellaneous Sources of DHA ..... ............................................................15
4.1. Summary Statistics for Participants’ Demographic (n = 39)........................36
4.2. Summary Statistics for Participants’ 3-day Dietary Intake at Weeks 18, 28 and 35 ……………………………..........................................37 4.3. Participant Summary Statistics for DHA Intake at Weeks 18, 28 and 35 Derived from the FFQ …………….. ............................................................38 4.4. The Number of Participants Above and Below Current DHA Recommendations Derived From the FFQ Interview at Weeks 18, 28 and 35 ……………………….............................................................40 4.5. Participants’ Fish Consumption Throughout Pregnancy Derived from the Post-Partum Survey……………............................................................42

vii
LIST OF FIGURES Figure Page 2.1. Schematic Representation of the Desaturation and Elongation of ALA to DHA ……………………….. ............................................................ 11 4.1. Detailed Scatter Plot for Individual Participant DHA Intake at Weeks 18, 28 and 35 ………………………… .............................................39

viii
ABSTRACT
Docosahexaenoic acid (DHA; 22:6n-3) is imperative for prenatal development and is found primarily in the flesh of marine life. Previous research has indicated that pregnant women do not meet current DHA recommendations of 200 mg per day. Much of the research has been conducted in coastal communities with greater access to marine sources and may not reflect non-coastal communities. PURPOSE: The purpose of this study was to describe maternal DHA intake in pregnant women from Southwest Montana and to determine changes in dietary DHA intake over time. METHODS: Thirty-nine participants were asked to complete a non-consecutive 3-day diet record and a DHA focused food frequency questionnaire (FFQ) at weeks 18, 28 and 35 (± 1 week). Maternal fasted plasma and red blood cell samples were obtained via venipuncture during the same data collection periods. Fetal cord blood samples were collected at delivery. Due to time restrictions, all blood lipid parameters were undetermined. After delivery, participants completed a post-partum survey. RESULTS: Participants’ overall mean (MEAN ± SD (min. – max.)) DHA intake was 248 ± 321 mg/d (8 – 1,836 mg/d). According to those who reported using DHA supplements in their FFQ interviews at weeks 18 (n = 12), 28 (n = 13) and 35 (n = 11), the mean DHA intake was 272 ± 380 mg/d (147 – 1,490 mg/d). The mean DHA intake among non-supplement users at weeks 18 (n = 22), 28 (n = 20) and 35 (n = 21) was 147 ± 139 mg/d (8 – 555 mg/d). Dietary DHA intake from weeks 18, 28 and 35 did not differ significantly (F (2, 62) = 0.220, p = 0.803). CONCLUSION: Dietary DHA intake did not differ over time. The mean dietary DHA intake for non-supplement users was below the current prenatal recommendation. Therefore, pregnant women in Southwest Montana are not meeting current DHA recommendations through dietary means alone and should consider DHA supplementation as a method to meet fetal and maternal DHA needs during pregnancy

1
CHAPTER 1
INTRODUCTION
Adequate maternal nutrition during pregnancy is imperative for proper fetal
development. Dietary fats, especially poly unsaturated fatty acids (PUFAs), are
essential in maintaining fetal membrane fluidity and permeability. The PUFA,
docosahexaenoic acid (DHA; 22:6n-3), is quickly integrated into fetal retinal and
brain lipids, especially during the third trimester of pregnancy, and is associated
with fetal neurological development (Innis, 2003). Inadequate maternal DHA
intake throughout pregnancy and decreased DHA concentrations in utero have
been shown to impair neurogenesis and visual acuity post-partum (Innis, 2003;
Innis & Friesen, 2008).
The role of PUFAs during pregnancy is currently under investigation.
Docosahexaenoic acid is the most abundant omega-3 (n-3) fatty acid (FA) in the
mammalian brain and selectively accumulates during fetal brain development
(Innis, 2000, 2007a). Research suggests that DHA functions to influence
neurogenesis, neurotransmission, and protection against oxidative stress (Innis,
2007a). In-utero, lipid-bound DHA may play a role in the development of the
lipid-bilayer, providing flexibility and direct interaction with membrane proteins
and impacting the speed of signal transduction and neurotransmission (Innis &
Elias, 2003). Unesterified DHA influences gene expression, ion channel
activities, and provides neuro-protective metabolites in the brain (Innis & Elias,
2003). Intervention studies (Innis & Elias, 2003; Innis & Friesen, 2008) suggest

2
an adequate maternal intake of dietary DHA will positively influence development
in utero and post-partum.
Mammalian cells do not have the enzymes needed to insert a double bond
at the n-3 position of a FA. Therefore, all of the n-3 PUFAs accumulated in fetal
tissue must originate from the maternal diet (Innis & Elias, 2003). Alpha-
linolenic acid (ALA; 18:3n-3) is an example of an essential fatty acid (EFA), which
must come from outside dietary sources. In the liver, ALA can be converted into
long-chain PUFAs (LCPUFAs), such as DHA, but the efficiency of ALA
conversions and the amount of DHA produced from ALA is unclear (Innis & Elias,
2003). Thus, pregnant women should consume DHA directly in the form of n-3
PUFA fortified foods, marine n-3 PUFAs or supplementation in order to ensure
proper maternal and fetal nutrition (Koletzko, 2008; Koletzko, Cetin, & Brenna,
2007).
Pregnant women are advised to meet current DHA recommendations.
The Perinatal Lipid intake (PERILIP) Working Group suggests that pregnant
women consume at least 200 mg of DHA per day throughout the pregnancy
(Koletzko et al., 2007; Koletzko et al., 2008). In the third trimester, DHA
accretion occurs rapidly in the fetal central nervous system and fetal needs have
been estimated at 50 – 70 mg of DHA per day (Innis & Friesen, 2008; Troxell et
al., 2005). Thus, maternal DHA intake should well exceed 70 mg/d after the 28th
week of gestation for positive fetal development.

3
Research has indicated that higher intakes of DHA and n-3 PUFAs are
associated with positive birth outcomes. High maternal n-3 PUFA intakes are
related to longer gestational length and higher birth weights (Hadders-Algra,
2008; I. B. Helland et al., 2001). Although there has been literature that
acknowledges the importance of DHA for fetal development, much of the
research has been limited to pregnant women living in coastal communities with
greater accessibility to marine foods (Grandjean, Bjerve, Weihe, & Steuerwald,
2001; Olsen & Secher, 2002). Further investigations are needed to assess DHA
consumption among pregnant women in non-coastal communities to determine if
individuals with less access to marine n-3 PUFAs are obtaining the
recommended amount of DHA for their growing fetus.
Statement of Purpose
The purpose of this study was to determine DHA status in pregnant
women and their fetuses from Southwest Montana. The specific aims of this
research included: (a) to describe DHA intake and to determine if our population
was consuming the recommended ≥ 200 mg of DHA/d; (b) to determine if there
was a difference in maternal DHA intake between weeks 18, 28 and 35; (c) to
determine if there was a relationship between maternal DHA intake and maternal
DHA blood lipid concentration; and (d) to determine if there is a correlation
between maternal DHA blood lipid concentrations and fetal DHA blood lipid
concentrations. Maternal dietary DHA intake was established in 39 pregnant
women. Maternal and fetal DHA lipid status was suppose to be investigated in

4
the blood parameters of 14 pregnant women and their fetuses; however, results
were undetermined due to the time restrictions of this project.
Hypotheses
Hypothesis 1: There is no change in DHA consumption from weeks 18, 28, and
35.
H0: µ18 = µ28 = µ35
Ha: µ18 < µ28 < µ35
Hypothesis 2: There is no correlation between maternal DHA consumption and
maternal DHA RBC and plasma status at week 35.
H0: │rDRBC│= 0; │rDP│= 0
Ha: │rDRBC│ > 0; │rDP│> 0
Hypothesis 3: There is no relationship between maternal RBC DHA
concentrations at week 35 and fetal RBC concentrations at delivery.
H0: rMFRBC = 0
Ha: rMFRBC > 0
Hypothesis 4: There is no relationship between maternal plasma DHA
concentrations at week 35 and fetal plasma DHA concentrations at delivery.

5
H0: rMFP = 0
Ha: rMFP > 0
Where: µ18 is dietary consumption at week 18
µ28 is dietary consumption at week 28
µ35 is dietary consumption at week 35
│rDRBC│is the absolute value of the correlation coefficient between
maternal dietary DHA intake and maternal RBC DHA status
│rDP│is the absolute value of the correlation coefficient between
maternal dietary DHA intake and maternal plasma DHA
status
rMFRBC is the correlation coefficient between maternal DHA RBC
status and fetal RBC status
rMFP is the correlation coefficient between maternal DHA plasma
status and fetal plasma status
Limitations
1. The limitations of this study included a small sample size of 39 pregnant
women from Gallatin and Park County, Montana. Ethnic and socio-
economic variations among subjects were modest and may not reflect all
non-costal communities.

6
Delimitations
1. The scope of this study was delimited to pregnant women in Gallatin and
Park Counties, Montana.
2. The study population was delimited to pregnant women who were prior to
their 18th week of gestation.
3. Subjects were accepted if they were pregnant with only one fetus, a non-
smoker and not previously diagnosed with type 1 or type 2 diabetes
mellitus.
Assumptions
1. This study assumed that the participants complied with the required
procedures for dietary and blood data collection at weeks 18, 28 and 35.
2. The study assumed that FFQ interviews accurately reflected the DHA
intake throughout the pregnancy.

7
Operational Definitions
Fatty Acid (FA): A molecule with a hydro-carbon chain that has a methyl (CH3-) and carboxyl (-COOH) end. Fatty acid molecules can vary in length and in the number of carbon - carbon double bonds. Polyunsaturated Fatty Acids (PUFA): A fatty acid molecule, which has more than one carbon-carbon double bond. Long-Chain PUFA (LCPUFA): Fatty acid molecules with a carbon chain > 18 carbons. Essential Fatty Acid (EFA): A fatty acid molecule that cannot be constructed in mammalian cells and must be consumed from an outside dietary source. Alpha-linolenic Acid (ALA; 18:3n-3): An essential n-3 fatty acid that is found in vegetable seeds and oils, such as flax and canola. Docosahexaenoic Acid (DHA; 22:6n-3): An n-3 PUFA found primarily in marine life. Food Frequency Questionnaire (FFQ): A questionnaire that contains 107 food choices, which are focused on extracting n-3 PUFA consumption over the past month in which the questionnaire has been administered. 3-day diet record: A measurement (in grams) of food and beverages consumed during three days (two weekdays and one weekend) in a seven day period.

8
CHAPTER 2
REVIEW OF LITERATURE
Introduction
Proper fetal growth and development relies on adequate maternal
nutrition. Observational studies (Innis & Elias, 2003; Stark et al., 2005) have
determined that pregnant women in areas with greater access to marine omega-
3 (n-3) poly-unsaturated fatty acids (PUFAs) do not meet the current prenatal
recommendation of at least 200 mg of docosahexaenoic acid (DHA; 22:6n-3) per
day. However, intervention studies (Bergmann et al., 2008; Innis & Friesen,
2008) have determined that ≥ 200 mg of DHA can induce positive visual and
neurological effects on the fetus during development and postpartum (Koletzko et
al., 2007). Little is known about DHA intake in women of Southwest Montana as
compared to other populations. A prospective observational study will allow
researchers and health professionals to establish maternal dietary n -3 PUFA
intake in pregnant women living in a non-coastal population with less accessibility
to marine n -3 PUFAs.

9
Lipid Metabolism
Dietary lipids provide energy, build numerous cellular components and
play a major role in molecular and metabolic processes. Fatty acids (FA) differ in
size and can be obtained from an outside dietary source or synthesized from
acetyl-CoA (Groff & Gropper, 2000). Cellular acetyl-CoA also can be used to
produce energy in the form of adenosine-tri-phosphate (ATP) from degraded
lipids. In the mitochondrion, energy production occurs via the β-oxidation cycle,
which cleaves two acetyl-CoA molecules at the –COOH end (2000). Acetyl-CoA
molecules enter the Krebs Cycle in the mitochondrial matrix to form carbon di-
oxide (CO2), water, and 12 ATP (2000). The process is reversible and can be
used to form long-chain FA.
During pregnancy, maternal fuel metabolism shifts from carbohydrate
(CHO) to FA utilization. Stored lipids are degraded into free fatty acids (FFA),
which helps meet the necessary demands of the growing fetus (Homko, Sivan,
Reece, & Boden, 1999). Maternal lypolysis causes an up-regulation of plasma
FFA that generates glycerol, a substrate used for gluconeogensis. Increased
levels of plasma FFAs drive the β-oxidation process to break down maternal
adipose fats into acetyl-CoA (1999). A greater amount of FFA in blood plasma
causes lypolytic hormone levels to increase and contributes to a decrease in
maternal insulin sensitivity, which allows for CHO preservation for the fetus
(1999). The β-oxidation process and lypolysis contributes to a large number of
the FFA available for maternal energy during pregnancy. Biochemically

10
increasing FFA and decreasing insulin sensitivity in pregnant women ensures
that the mother and the developing fetus are obtaining enough energy to meet
their metabolic needs.
Omega 3 Fatty Acid Metabolism
Essential fatty acids (EFA) are required for proper cellular growth and
development; however, they cannot be synthesized in vivo and must be
consumed from an outside dietary source. Alpha-linolenic acid (ALA; 18:3n-3),
which is found in unsaturated vegetable oils, such as flax and canola, is an
example of an EFA formed in plant tissue but not mammalian tissue. In the liver,
ALA can be converted to DHA or used as a precursor for other LCPUFAs (Innis,
2003).
Synthesis of DHA begins with the desaturation of the ALA (18:3n-3)
molecule, by delta (Δ) 6 desaturase into 18:4n-3 (Innis, 2000; Koletzko et al.,
2008). The next step is elongation with the addition of two carbons to 20:4n-3
(Koletzko et al., 2008). Desaturation by Δ5 desaturase forms eicosapentenoic
acid (EPA; 20:5n-3) (Innis, 2000). The formation of EPA with the Δ5 desaturase
and the following steps are pathways found only in animal cells and not plant
cells, which is why DHA and other LCPUFAs are not found in plant sources
(Innis, 2003). The translocation and regulations of DHA conversion from EPA
remains unclear (Innis, 2007b). The current view states that there is an addition
of two carbon units to form 22:5n-3, another elongation to form 24:5n-3 and a
potential second Δ6 desaturation to form 24:6n-3. Eventually, a partial β-

11
oxidation cleaves the newly formed 24-carbon molecule into a 22-carbon DHA
molecule (22:6n-3) (Innis, 2000; Innis, 2003). Once the DHA molecule is
produced it can be used as a structural lipid that enriches certain phospholipid
membranes of the nervous system and retina (Innis, 2003).
\\ 18:3n-3 (ALA)
↓ ∆ 6 Desaturase 18:4n-3
↓ Elongase 20:4n-3
↓ ∆ 5 Desaturase 20:5n-3
↓ Elongase 22:5n-3
↓ Elongase 24:5n-3
↓ ∆ 6 Desaturase 24:6n-3
↓ Partial β-oxidation 22:6n-3 (DHA)
Figure 2.1. The schematic representation of the desaturation and elongation of ALA to DHA (Innis, 2000).
Maternal consumption of DHA from an outside source is more beneficial in
meeting the rapid cellular demands of the growing fetus than consuming only
ALA. Research suggests that less than 1 – 4% of dietary ALA is converted to
DHA (Innis & Elias, 2003). An increase in maternal DHA intake has been
associated with higher DHA levels in maternal and fetal phospholipid tissue and
a faster accumulation of fetal DHA rather than consuming ALA alone (Innis &
Elias, 2003). Moreover, ALA has not been determined to serve any essential
cellular function other than to act as a precursor for EPA and DHA (Innis, 2003).

12
In fact, most of the ALA consumed is β-oxidized to acetyl-CoA, which further
forms cholesterols, various FAs, or can be metabolized into CO2 and expelled
from the body (Innis, 2003). Thus, consuming DHA directly, either in the form of
marine n-3 PUFAs or supplementation is more beneficial to the mother and
developing fetus.
Recommendations and Sources of DHA During Pregnancy
Polyunsaturated fatty acids are a necessary component to the human diet.
Among adults in the United States, PUFAs should provide at least 7% of the total
energy intake and 19-22% of actual fat energy intake (Kris-Etherton et al., 2000;
Nelms, Sucher, & Long, 2007). The major omega-6 (n-6) and n-3 PUFAs in the
diet are linolenic acid (LA; 18:2n-6) and ALA, which comprise of 84-89% and 9-
11%, respectively of the PUFAs consumed (Kris-Etherton et al., 2000). The
Institute of Medicine (IOM) recommends that pregnant women consume about 13
g/d of n- 6 PUFAs, such as LA, and 1.4 g/d of n-3PUFAs, such as ALA
(Simopoulos, 2000).
The Perinatal Lipid intake (PERILIP) Working Group and the Early
Nutrition Programming Project (EARNEST) have suggested that pregnant
women consume at least 200 mg of DHA/d or at least 2 portions of fatty fish per
week (Koletzko, 2008; Koletzko et al., 2007); however, an intake of around 1 g/d
of DHA has been used in clinical trials without adverse side effects (Freeman &
Sinha, 2007; Helland, Smith, Saarem, Saugstad, & Drevon, 2003; Koletzko et al.,
2007; Olsen et al., 1992; Szajewska, Horvath, & Koletzko, 2006). Furthermore,

13
fetal development and DHA accretion is greatest during the third trimester of
pregnancy. Fetal needs have been estimated at 50 – 70 mg of DHA per day
(Troxell et al., 2005). Recently, the International Society for the Study of Fatty
Acids and Lipids (ISSFAL) has adopted the PERILIP recommendations
(International Society for the Study of Fatty Acids and Lipids [ISSFAL], 2006;
Koletzko et al., 2007) and recognizes the importance of adequate maternal DHA
intake during pregnancy.
The primary source for DHA is the flesh of marine fish, crustaceans, and
shell fish and to a much lesser extent, meat, poultry, eggs and dairy products
(Cleland, James, & Proudman, 2006; Gebauer, Psota, Harris, & Kris-Etherton,
2006; Innis, 2007b). Marine-derived n-3 PUFAs are excellent sources of protein,
vitamins, and minerals during pregnancy (Gebauer et al., 2006); they contribute a
significant amount of fats to the phospholipid membranes of the fetal brain and
eyes. Plant-based foods, such as nuts, seeds, and derived oils, are high in ALA
content, but are void of DHA (Gebauer et al., 2006). Mothers are advised to
increase DHA intake, not in the form of ALA, during pregnancy in order to
increase blood lipid levels of DHA and to ensure adequate DHA transfer to fetus
(Innis, 2007b). For a complete list of dietary and miscellaneous sources of DHA
see Tables 2.1 – 2.3.

14
Table 2.1. Marine Sources of DHA (Gebauer et al., 2006).
Fish (100 g Portion = 3.5 oz) DHA (g)
Salmon, Atlantic, cooked, dry heat 2.147
Herring, Atlantic, cooked, dry heat 2.014 Mackerel, Pacific and jack, mixed species, cooked, dry heat 1.848
Anchovy, European, raw 1.449 Sardine, Atlantic, Canned in oil, drained with bone 0.982
Trout, mixed species, cooked dry heat 0.936
Shark, mixed species, raw 0.843
Swordfish, cooked, dry heat 0.819
Mussel, blue, cooked, moist heat 0.782 Sea bass, mixed species, cooked dry heat 0.762 Flatfish (Founder and Sole), cooked, dry heat 0.501
Pollock, Atlantic, cooked, dry heat 0.542 Spiny lobster, mixed species, cooked, moist heat
0.48
Halibut, Atlantic and Pacific, cooked, dry heat 0.465 Carp, cooked, dry heat 0.451 Oyster, eastern, farmed, cooked, dry heat
0.440
Crab, Alaska King, cooked, moist heat 0.413
Tuna, skipjack, fresh, cooked, dry heat 0.328
Perch, mixed species, cooked, dry heat 0.324 Shrimp, mixed species, cooked, moist heat
0.315

15
Table 2.1. Sources of DHA, Continued.
Fish (100 g Portion = 3.5 oz)
DHA (g)
Octopus, common, cooked, moist heat 0.314 Clam, mixed species, cooked, moist heat
0.284
Tuna, white, canned in oil, drained 0.244
Eel, mixed species, cooked, dry heat 0.189 Scallop, mixed species, cooked, breaded and fried
0.180
Catfish, farmed, cooked, dry heat 0.177
Cod, Atlantic, cooked, dry heat 0.158
Pike, northern, cooked, dry heat 0.137
Tuna, light, canned in oil, drained 0.128 Conch, baked or broiled
0.120
Table 2.2. Sources of DHA From Fish Oil (Gebauer et al., 2006).
Fish Oil Supplements (1 Tbsp) DHA (g) Salmon 2.48 Cod-Liver 1.49 Sardine 1.379 Herring 0.872 Table 2.3. Miscellaneous Sources of DHA (Gebauer et al., 2006).
Other sources of DHA DHA (g) Expecta, maternal supplements (1 capsule)
0.200
L'il Critters omega-3 supplements (2 fish)
0.200
Omega-3 Fortified eggs
0.075

16
Consumption of farm-raised or wild fatty fish during pregnancy supplies an
ample amount of DHA to a developing fetus. Eight ounces or about 227 g/week
of cooked farmed Atlantic salmon provides an average of 400 mg of DHA daily
(Santerre, 2008). Eight ounces of wild coho or sockeye salmon contains around
350 mg – 400 mg (2008). There is a minimal distinction between the nutritional
benefits between wild and farm-raised salmon and women can chose to
consume either or both during their pregnancy.
The 10 most popular marine life consumed in the United States (ordered
from greatest to least consumption) include: shrimp, canned tuna, salmon,
Pollock, tilapia, catfish, crab, cod, clams, scallops (Santerre, 2008). In a 100 g
portion, only salmon exceeds the daily recommended amount of DHA for
pregnant women. Thus, if pregnant women consume salmon at least twice per
week, which would provide around 400 mg of DHA/d, in addition to the other
popular marine n-3 PUFAs, they can meet DHA requirements for adequate
prenatal nutrition.
Influences on DHA Intake During Pregnancy A major concern among pregnant women when consuming fish is
contamination. Methyl-mercury (mercury) contamination is associated with
adverse effects and injuries to a developing nervous system (Santerre, 2008).
Fetal vulnerability to fish toxicity is greater than the mother’s due to the immature
liver and excretory pathways of the fetus (Genuis, 2008). The fetal liver is unable
to efficiently detoxify contaminants because of low levels of fetal binding proteins

17
(Genuis, 2008). Excreted urinary pollutants are usually recycled into the nose
and mouth in amniotic fluid and can be rapidly incorporated into developing
organs. In 2004, the U.S. Food and Drug Administration (FDA) advised pregnant
women to avoid eating predatory fish, such as shark, swordfish, and king
mackerel, and to check with local advisories before eating locally caught fish
(Genuis, 2008; Santerre, 2008). A concentration of 1,000 parts per billion (ppb)
of mercury in commercial fish is considered the legal limit. Farm-raised and wild
salmon have <100 ppb concentration of mercury, which is well below the FDA
limit (Santerre, 2008).
Research on birth-weight and contaminant levels found that women who
consumed fatty fish more than three times per week had infants that were not
affected by seafood contamination (Grandjean et al., 2001). All fish contain
some organic mercury in their flesh (Myers, Davidson, & Strain, 2007); however,
farm-raised or wild salmon have low levels of methyl and other contaminants.
Salmon can be consumed at least once per week and will provide high
concentrations of LCPUFAs and low levels of mercury. On the other hand,
predatory fish have higher toxicity levels and should be totally avoided or
consumed sparingly by pregnant women.
Local fish contamination varies from location. When consuming locally
caught fish, some guidelines can be applied. For instance, women are advised
to eat smaller sized fish more often or large fish less often. Consuming fish like
perch or other non-predator fish will have less toxins but lower values of DHA per
100 g of fish (Thorsdottir, Birgisdottir, Halldorsdottir, & Geirsson, 2004). The

18
contaminant poly-chloride bi-phyenols (PCBs) are generally found downstream
from cities. Individuals are advised to fish upstream to avoid PCB contamination
in the fish (2004). Levels of PCBs have decreased in the past few decades and
are becoming less of a concern.
Endangered species can influence maternal food choices and pose a
moral and ethical threat to maternal marine consumption. Varieties of catfish,
carp, trout and other marine life are placed on the United States threatened and
endangered species list, daily (U.S. Fish & Wildlife Service, 2009). However,
many of these species of carp and trout provide a small amount of DHA per day
if consumed only once or twice a week. Farm-raised salmon provides adequate
DHA concentrations to the mother (Santerre, 2008). Salmon can be used as an
alternative fish choice for pregnant women who are concerned with contributing
to the endangerment of wild-life. For a complete list of endangered species,
please see Appendix G.
Effects of Marine n-3 PUFA Consumption on Membrane Composition
Previous studies (Denomme, Stark, & Holub, 2005; Innis & Elias, 2003;
Stark et al., 2005; Williams et al., 2006) have reported relationships between
habitual fish consumption and maternal erythrocyte membrane n- 3 PUFA
concentrations. Williams et al. (2006) investigated the relationship between n -3
and n-6 PUFA concentrations in maternal plasma and erythrocytes during early
pregnancy as related to habitual fish consumption during the periconceptional
period (60 days before to 7 days after conception) (McMillen, Schwartz, Coulter,

19
& Edwards, 2004; Williams et al., 2006). Researchers indicated that as maternal
self-reported fish consumption increased, mean erythrocyte n-3 PUFA content
increased (all trend p-values were < 0.001). Erythrocyte DHA values were 30.0%
higher among women who consumed fish more than twice per week as
compared to women who consumed fish less than once a week (Williams et al.,
2006). A higher consumption of fish during periconception allowed more DHA to
be incorporated into maternal erythrocytes during the prenatal period leading to
higher DHA availability for the fetus.
Biochemical analysis of plasma phospholipids may help to validate
maternal dietary assessment during pregnancy. Innis and Elias (2003)
investigated the influence of dietary PUFA intake on plasma phospholipids in 55
pregnant women. The mean intake of DHA, determined via FFQ interview at
weeks 28 and 35 was 160 ± 20 mg/d. Plasma phospholipids of the women at
week 35 was 5.0 ± 0.18 g DHA/100 g FA (2003). The mean daily intake of DHA
was significantly related to the concentration of DHA in the plasma phospholipids
(r = 0.63; p < 0.0001) and the concentration of DHA increased with a greater
intake of fatty fish, such as salmon (r = 0.61, p < 0.0001) (2003). However, the
relationship between intake of lean fish and the concentration of DHA was less
significant (r = 0.29, p < 0.03). The research done by Innis and Elias (2003)
highlights the relationship between maternal fish consumption and maternal DHA
availability for the fetus. With an increase in maternal intake of fatty fish, DHA
concentrations in maternal plasma phospholipids increases, which allows for a
greater supply of DHA to be transferred across the placenta.

20
The placental transport of DHA to the fetus relies on adequate maternal
DHA plasma lipid concentrations. Elias and Innis (2001) measured unrestricted
maternal FA intake and determined maternal and fetal plasma phospholipid
concentrations. The average maternal DHA intake was not reported because
this project was looking at trans-FA intake and the influence of birth outcomes.
Maternal and infant plasma phospholipid DHA concentrations, measured in
percent by weight of total FA were 5.02 ± 0.21% (2.84 – 8.11%; n = 44) and 7.67
± 0.25% (4.38 – 10.71%; n = 44), respectively, and significantly differed (p <
0.05) (2001). Correlation analysis showed maternal and fetal DHA plasma
phospholipid concentrations were significantly related (r = 0.48; p < 0.001).
Thus, maternal plasma DHA values may be related to the concentration in infant
plasma at delivery; moreover, fetal accretion of n-3 PUFAs may partially be
determined by n- 3 PUFA concentrations in maternal plasma lipids (Elias & Innis,
2001).
During the third trimester of pregnancy, LCPUFA transport across the
placenta is selective. Bohles, Arndt, Ohlenschlager, Beeg, Gebhardt and Sewell
(1999) investigated DHA erythrocyte phospholipid concentrations in 43 women
and infants at delivery. The researchers determined that the mean DHA
percentage of total FA in maternal and newborn erythrocyte phospholipids was
3.2 ± 2.2% and 3.4 ± 2.3%, respectively, but did not differ significantly between
mothers and newborns (p > 0.05) (1999). However, there was a correlation
between the erythrocyte phospholipid DHA concentrations in newborns and their
mothers (r = 0.63; p < 0.001). This study (1999) provides evidence that maternal

21
DHA concentrations in the later stages of pregnancy influence fetal cord blood
DHA concentrations at delivery.
Epidemiological (Olsen & Secher, 2002; Thorsdottir et al., 2004) and
intervention studies (Helland et al., 2001; Helland et al., 2003; Olsen et al., 1992)
show that marine consumption and/or fish oil supplements during pregnancy is
positively associated with positive fetal outcome. Consuming at least 200 mg of
DHA/d during pregnancy may be used to reduce prenatal complications
(Koletzko et al., 2008). More research is needed to determine how much marine
n-3 PUFAs are being consumed during pregnancy and how they influence
maternal and fetal blood lipid parameters.
Placenta Transfer of DHA During Pregnancy
Essential fatty acids cannot be converted to DHA in the developing fetal
liver (Innis, 2005, 2007b); therefore, ALA conversion to DHA must occur in the
maternal liver. Dietary DHA or to a lesser extent, DHA formed from its precursor
ALA, is provided to the fetus via placental transfer from the maternal blood
(Cleland et al., 2006; Ruyle, Connor, Anderson, & Lowensohn, 1990). High
concentrations of lipoprotein lipase and triacylglycerol hydrolase, two enzymes
that hydrolyze triglycerides, are found in the placenta (Stark et al., 2005). These
findings suggest that transfer across the placenta may be limited to non-esterified
fatty acids and that triacylglycerols are the major source of maternal fatty acids
available for fetal nutrition (Stark et al., 2005).

22
Placental transfer of nutrients involves the umbilical arteries that bring fetal
blood into the placental and the umbilical veins, which return enriched blood to
the fetus (Ruyle et al., 1990). The exchange of fetal and maternal blood in the
placenta allows for facilitated or simple diffusion, or active transport to occur,
which provides the growing fetus with appropriate energy stores (Ruyle et al.,
1990). Little is known about the actual mechanism by which DHA is transported
across the placenta. Speculation is made that FFAs, FA binding proteins, and
transport proteins are released into fetal circulation. Free fatty acids are
reesterified with the preferential incorporation of the LCPUFA, DHA, into fetal
neural cells (Innis, 2007a). Intervention and observational studies have indicated
that higher dietary maternal intake of DHA (200 mg/d) during pregnancy results
in higher maternal-to-fetal transfer of DHA (Innis, 2007a). Increasing fetal
resources for DHA supply can ensure proper DHA incorporation into numerous
components of fetal development.
Ruyle et al. (1990) studied the effects of plasma vs. erythrocytes in the
transport of LCPUFAs from mother to fetal tissue. At delivery, the umbilical fetal
cord was double clamped and blood was drawn from the venous and arterial
circulation of the cord (n = 26). Maternal blood was drawn from the antecubital
vein (n = 21). Maternal and fetal RBC DHA composition in the vein, as
expressed in percent by weight, was 3.7 ± 0.9% and 5.6 ± 1.6%, respectively,
and the maternal – fetal venous difference was statistically significant (p ≤ 0.001)
(1990). Concentrations of DHA in the fetal veins and arteries were significantly
higher (p ≤ 0.02) than all other LCPUFAs, with the exception of arachidonic acid

23
(AA; 20:4n-6) (1990). These findings provide evidence for the importance of high
DHA concentrations in fetal erythrocytes and that DHA may play an important
role in prenatal development.
Proper fetal development relies on DHA from the maternal diet. Previous
research suggests that 50 – 70 mg DHA/d accumulates by the fetus during the
third trimester of pregnancy (Innis & Elias, 2003; Troxell et al., 2005). Innis &
Elias (2003) administered a food frequency questionnaire to 55 pregnant
Canadian women during the 28th and 35th week of gestation. The mean intake of
DHA was reported to be 160 ± 20 mg/d (Innis & Elias, 2003), suggesting that
Canadian women living in a coastal region may not be obtaining the
recommended amount of DHA during their third trimester of pregnancy. The
mean daily intake of DHA was significantly related to DHA concentrations in the
plasma phospholipids (p < 0.001) (Innis & Elias, 2003). As DHA consumption
increased among the women, DHA levels in the plasma also increased, allowing
for a greater availability for fetal transfer during the third trimester.
Summary
Data assessing maternal DHA consumption and DHA concentrations in
maternal and fetal blood lipid parameters is limited. Further investigations need
to be performed on a variety of populations in order to provide an adequate
recommendation to future mothers. Increased DHA consumption positively
enhances fetal development; however, less is known about women who do not
have a consistent supply of marine n-3 PUFAs due to where they live.

24
Therefore, investigating the amount of DHA consumption and the effects of fetal
transfer is imperative to better the understanding of dietary needs for healthy
pregnant women in a non-coastal community.

25
CHAPTER 3
METHODOLOGY
Participants
Forty-one pregnant women between the ages of 21 and 39 were recruited
from Gallatin and Park Counties in Southwest Montana via flyers, newspaper
advertisements and word-of-mouth. Eligibility criteria included singleton
pregnancy, at or before week 18 of gestation, and a non-smoker. Minor
individuals (under 18 years of age) or individuals who were unable to have a full-
term pregnancy were ineligible.
Potential volunteers were initially screened to determine health status,
stage of pregnancy, and eligibility for participation. Upon initial acceptance,
participants signed a Montana State University Institutional Review Board (IRB)
approved Subject Consent Form (see Appendix A). Prior to the first data
collection period, participants completed a medical history questionnaire (see
Appendix B). Medical providers were faxed an additional subject consent form in
order to approve the eligible participant, as well (see Appendix C).

26
Procedures
The project was a prospective observational study, which took place over
the course of the participant’s pregnancy. Data was collected any day during the
18th, 28th and 35th (±1 week) week of gestation. Anthropometric information,
venipuncture fasted blood samples (no food or beverages for 8 – 12 hours prior
to blood draw), and dietary intake were obtained during weeks 18, 28, and 35 of
gestation. At the time of birth, a health care provider (e.g., physician, mid-wife,
nurse, etc.) collected fetal cord blood from the placenta. After delivery,
participants were required to complete a post-partum. Nutritionist Pro software
program (Axxya Systems, Stafford, USA) was used to analyze dietary
docosahexaenoic acid (DHA) consumption during pregnancy. Fatty acid (FA)
analysis from red blood cells (RBC) and plasma samples was conducted at the
University of British Columbia. Statistical analysis was performed using SPSS
for Windows (Version 17; SPSS Inc, Chicago, USA).
Anthropometric Data
During weeks 18, 28, and 35 (± 1 week) of gestation, participant’s height
and weight were measured by an investigator and recorded on the appropriate
food frequency questionnaire (FFQ) sheet. In the Nutrition Research Lab (NRL),
weight was obtained using a calibrated scale and measured to the nearest 0.1
kg. When FFQ interviews were conducted outside of the NRL, a traveling scale
was used and the weight was recorded in whole numbers. Height was

27
determined using a stadiometer and taken to the nearest 0.1 cm at week 18 (± 1
week). All measurements were taken from the participants wearing light clothing
and no shoes.
Diet Record and Food Frequency Questionnaire
At each data collection point, participants were provided with a food log
and a Precision Electronic Cuisinart scale (model SA-110A; Cuisinart, Newark,
NJ) for one week. The participants were required to weigh (in grams) and record
all food and beverages consumed during three days (one weekend day and two
weekdays) in a seven-day period. An investigator provided each participant with
explicit written and verbal instructions on how to weigh and record all foods and
beverages using the food scale and dietary food log (see Appendix D).
At the same data collection period, participants took part in an hour-long
interview using the specifically designed FFQ (see Appendix E). The FFQ was
developed by a graduate student to determine the amount of omega-3 (n-3)
polyunsaturated fatty acid (PUFA) consumption during the past month of
pregnancy. The correlation between dietary DHA from the 3-day diet record and
the FFQ interview was developed and used for a separate project (currently, r =
0.77 on May 3, 2009). Investigators were trained how to administer the FFQ to
participants in order to obtain the most detailed descriptions of food products and
portion sizes.

28
Maternal Blood Collection
Venipuncture blood samples were collected by a phlebotomist. Blood
samples were obtained at the same data collection points (week 18, 28 and 35)
as the dietary information. If participants were unable to fast before the blood
draw, they were instructed to eat a low-fat snack (e.g., dry toast). A total of 14
mL whole blood was collected directly into 2 ethylenediamine tetraacetic acid
(EDTA) vacutainer tubes and immediately placed on ice or in the refrigerator until
centrifugation was possible. An investigator processed the blood sample within
one hour of collection. The second tube was taken to the Bozeman Deaconess
Hospital (BDH) for a complete blood count (CBC) and a lipid profile panel.
Participants’ data from BDH was faxed directly to the main office in the
Department of Health and Human Development in Herrick Hall. Participants’
CBC and lipid profiles were used for another project.
Plasma was separated from whole blood via centrifugation. The EDTA
vacutainer tube was placed directly into the centrifuge (Fisher Marathon 2100 R,
Ontario, Canada), and spun at gravitation acceleration (g) of 2500 for 10 minutes
at 4 degrees Celsius (C˚). After centrifugation, the plasma was pipetted and
collected into 1.5 mL labeled cryovial tubes and placed into the freezer at -80 C˚.
The red blood cells (RBCs) and the white buffy layer were not disturbed. The
RBCs were washed using a saline/EDTA buffer solution that contained 9 g/L of
sodium chloride and 1.14 g/L of sodium EDTA in water. The amount of the buffer
solution added to the RBCs was at an equal volume to the amount of the plasma

29
that was removed. The RBCs and buffer mix was then inverted 10 times and
spun again at 2500 g for 10 minutes at 4 C˚. After centrifugation, the buffer
solution was pipetted out of the tube and discarded until only RBCs and the thin
buffy coat layer remained. Again, the saline/EDTA mixture was added to the
RBCs at an equal volume to the previously discarded buffer solution.
Centrifugation occurred for 10 minutes at 2500 g at 4 C˚. The saline/EDTA
mixture was pipetted out of the tube and discarded along with the thin buffy layer.
The RBC sample was pipetted into a 1.5 mL labeled cryovial tube for storage. All
plasma and RBC tubes were labeled according to the date (e.g., 1/1/09),
subject’s initials (e.g., LW), number assignment (e.g., 5), week of gestation (18th
(A), 28th (B), 35th (C), or fetal cord blood (D)), and blood component ((RBC) or
plasma (P)). All samples were stored in the freezer at -80 C˚ in the NRL until
shipment to Dr. Shelia Innis’ lab could occur.
Fetal Cord Blood
Prior to delivery, medical professionals were provided with explicit verbal
and written instructions on cord blood collection and handling. After the delivery
of the newborn, medical providers clamped the umbilical cord and collected the
sample from the placenta. Cord blood was drained into a sterilized 4 mL EDTA
vacutainer tube and gently inverted 10 times. At the Bozeman Birth Center, a
midwife drew blood directly from the placenta into the EDTA vacutainer tube via
a 25 gauge syringe. All samples were placed on ice or in the refrigerator and a
medical provider contacted an investigator as soon as possible. The cord blood

30
samples were processed exactly as maternal blood samples previously
described. The plasma and RBC samples were labeled and stored in the NRL
freezer at -80 C˚ until shipment to the University of British Colombia was
possible.
Post-Partum Survey
Participants completed a post-partum survey after delivery (see Appendix
F). The survey was a generalized questionnaire that the participants filled out by
hand and sent into the NRL. Questions on the survey included risk of pregnancy,
labor procedures and newborn anthropometric data. Other questions included
exercise trends, fish consumption, and supplementation use throughout
pregnancy. For the purpose of this study, the post-partum survey was used to
determine fish consumption and supplementation use.
Fatty Acid Analysis
All RBC and plasma FA analysis were performed in Dr. Shelia Innis’
laboratory at the University of British Columbia, Canada. Total lipids from RBC
were obtained using a 2.2 mL isopropyl alcohol and 1.4 mL chloroform, followed
by a series of centrifugations. Evaporation of the solvents occurred with nitrogen
and lipid class separations. Plasma lipids were extracted using a modified Folch
extraction procedure (Folch, Lees, & Sloane-Stanley, 1957), which used a two
part sample in saline, three parts methanol, and six parts chloroform. Vortex and
centrifugation occurred at 1000 g for 10 minutes. Following directly after, the

31
lower organic layer was collected and the aqueous phase was washed with
additional chloroform. The organic layer was then collected and pooled with the
first layer. The samples were dried under nitrogen to obtain a total lipid
extraction. Each lipid class (phospholipids, cholesterol esters, and triglycerides)
was separated using high performance liquid chromatography (HPLC) with
evaporated light scattering detection (ELSD) (Innis & Dyer, 2002). Lipid fractions
were recovered and FAs were converted to their respective methyl esters for
separation by gas chromatography using a flame ionization via Agilent 6850 gas
chromatography (Agilent Technologies Inc., Santa Cara, CA) with an Agilent HP-
88 capillary column (30 m x 0.25 mm internal diameter x 20 µm film thickness).
Software accompanying Agilent quantified the peak areas, which calculated the
percent weight of each fatty acid based on the peak areas (Innis & King, 1999).
The inter- and intra-assay coefficient of variance for DHA analysis conducted at
UBC was 3.1 and 2.1%, respectively.
Statistical Analysis
Descriptive statistics (mean ± standard deviation (SD) and range (min. –
max.)) were used to describe participants’ age, weight, economic and
educational status and dietary intake of DHA. The sources of fish and
supplementation consumed during pregnancy were determined from the post-
partum survey. Repeated measures one-way analysis of variance (ANOVA) was
used to test for differences in the mean intake of DHA calculated from the FFQ at
weeks 18, 28 and 35. All analyses were done with SPSS for WINDOWS (version

32
17.0; SPSS Inc, Chicago, USA). The level of significance was set with an alpha
value (α) p < 0.05.

33
CHAPTER 4
RESULTS
Introduction
The results for this project will focus on dietary docosahexaenoic acid
(DHA) intake. Dietary intake was determined using the food frequency
questionnaire (FFQ) interview at weeks 18, 28 and 35 (± 1 week). Maternal and
fetal blood lipid parameters were undetermined due to time restrictions.
Therefore, hypotheses two, three and four will not be addressed in chapter four.
Expected results for hypothesis two, three and four will be discussed in the
chapter five.
Subjects
Subject Adherence to the Project Forty-one participants responded to recruitment efforts and consented to
be in the study. Prior to the 18th week of gestation, two participants dropped out
due to a miscarriage (n = 1) or a lack of commitment to the project’s timing (n =
1). Three-day diet records were completed by 39, 37 and 35 individuals during
weeks 18, 28 and 35, respectively. Reason for incomplete 3-day diet data
included a loss of interest in the project (n = 1) and unavailability at week 28 (n =
1) and pre-term labor (n = 1) and relocation (n = 1) at week 35.

34
Food frequency questionnaire interviews were administered to 34, 33, and
32 participants during weeks 18, 28 and 35, respectively. The FFQ was created
and implemented after the first five participants enrolled. Thus, 34 FFQ
interviews were conducted at week 18. Reasons for lost FFQ data at week 28
included enrollment prior to the FFQ design (n = 2), scheduling conflicts (n = 2),
loss of interest in the project (n = 1) and unavailability (n = 1). Lost FFQ data at
the 35th week of gestation was due to pre-term labor at week 35 (n = 1) and
relocation (n = 1). Overall, 32 participants had complete dietary FFQ data and
were used for DHA intake statistical analyses.
The post-partum survey was provided to participants at week 35. Thirty-
six participants completed the post-partum survey after delivery. Reasons for
incomplete surveys included birth complications (n = 1), loss of interest in the
project (n = 1), and relocation (n = 1).
Week 18 blood samples were collected from 38 of the 39 participants.
The first study participant began the project prior to blood collection. At week 28,
blood samples were collected from 37 participants. The reasons for incomplete
data was due to loss of interest (n = 1) and unavailability (n = 1) at week 28.
Week 35 blood samples were taken from 36 participants. Loss of data at week
35 was due to relocation (n = 1), pre-term labor (n = 1), and a scheduling conflict
(n = 1). Cord blood samples were collected from 36 out of 39 participants.
Samples were not taken from three participants due to birth complications (n =
1), relocation (n = 1) and loss of interest in the project (n = 1). For a diagram of
participant adherence to the project see Appendix H.

35
Demographic and Anthropometric Data The average age of participants was 30.4 ± 4.5 years (21 - 39 years) and
mean household income was $47,564 ± $22,880 ($10,000 – $75,000).
Participants were predominantly Caucasian and educated at the college level or
above. Ninety-five percent of Gallatin County is white and 63% of the Bozeman
population (≥ 25 years of age) has some form of college education (Bozeman
Population Overview, 2000). Therefore, our study population was representative
of Bozeman, Montana. Summary statistics for participant demographics are
shown in Table 4.1.

36
Table 4.1. Summary statistics for participant demographics (n= 39).
Demographic Sample Size
Education (years)
≤ 12 (High School)
3
13 – 16 (College)
23
≥ 17 (Graduate) 13
Number of Pregnancies
Primigravida 23
Multigravida 16
Marital Status
Single
2
Married
37
Ethnicity Caucasian
35
Hispanic
1
Asian
1
Asian/Caucasian
1
Native American
1
Participants’ mean height and pre-pregnancy weight was 166.0 ± 4.6 cm
(155.0 – 177.8 cm) and 62.7 ± 10.8 kg (45.5 – 102.3 kg), respectively. Mean
body mass index (BMI) for participants prior to pregnancy was 23.2 ± 4.2 kg/m2
(18.2 – 39.1 kg/m2). At weeks 18, 28 and 35, participants mean BMI was 25.0

37
kg/m2, 26.8 kg/m2, and 28.0 kg/m2, respectively. For a detailed description of
participants’ weight at weeks 18, 28 and 35 please see Table 4.2.
Table 4.2. Participants’ weight at weeks 18, 28, and 35.
Variable
Sample Size Mean Standard Deviation
(SD)
Range (min. – max.)
Wk 18 Weight (kg) 39 68.3 11.6 49.7 – 102.3
Wk 28 Weight (kg) 37 73.7 12.7 52.7 – 110.0
Wk 35 Weight (kg) 35 76.7 13.4 56.4 – 110.0
Maternal Dietary DHA Intake The FFQ interview was used to determine DHA intake of the pregnant
women over a 30 day period. Since fish and seafood are not typically consumed
on a daily basis, estimation of DHA intake was better represented from a method
that covered a greater scope of reporting time (e.g., a one-month time period).
The mean intake for participants, calculated from the average of the 3 FFQ
assessment points, was determined to be 248 ± 321 mg (8 – 1,839 mg). For
group summary statistics of DHA consumption at weeks 18, 28 and 35, see
Table 4.3.

38
Table 4.3. Participants’ summary statistics DHA intake at weeks 18, 28 and 35 derived from FFQ. DHA (mg) Sample
Size Mean Standard
Deviation (SD)
Range (min. – max.)
Median
Wk 18 DHA (mg)
34 246 323 14 – 1,791 155
Wk 28 DHA (mg) 33 253 324 8 – 1,839 209
Wk 35 DHA (mg) 32 246 326 13 – 1,681 190
Participants’ overall median intake was 186 mg. According to FFQ
interview data, the participants that consumed at least 200 mg of DHA during
weeks 18, 28 and 35 were 15 (out of 34), 17 (out of 33) and 16 (out of 32),
respectively. For a detailed plot of total DHA intake per subject at weeks 18, 28
and 35 please see Figure 4.1. For a detailed description of participants’ DHA
intake in relation to current recommendations, please see Table 4.4.

39
Week
3530252015
DH
A (
mg
)2100.00
2000.00
1900.00
1800.00
1700.00
1600.00
1500.00
1400.00
1300.00
1200.00
1100.00
1000.00
900.00
800.00
700.00
600.00
500.00
400.00
300.00
200.00
100.00
0.00
Total Participant DHA Intake
Figure 4.1. Total DHA intake at weeks 18, 28 and 35 for each participant (divided by the line, which represents 200 mg of DHA).

40
Table 4.4. The number of participant above and below current DHA recommendations derived from the FFQ interview at weeks 18, 28 and 35.
DHA Intake Week 18 n = 34
Week 28 n = 33
Week 35 n = 32
≥ 200 mg 15 17 16
70 – 199 mg 10 8 6
< 70 mg 9 8 10
There was no statistical difference in DHA intake from weeks 18, 28 and
35 (F (2, 62) = 0.220, p = 0.803). Dietary DHA intake was based on complete
FFQ data from 32 participants at weeks 18, 28 ad 35. The Mauchly’s test of
sphericity, which is used to validate repeated measures factors and within
subject effects was not significant (p = 0.08). Therefore, the null hypothesis,
which stated that there would be no change in DHA intake from weeks 18, 28
and 35, must not be rejected.
Sources of DHA Among Participants
Based upon weeks 18, 28 and 35 FFQ interviews, there were 12, 13 and
11 participants reported using DHA supplements, respectively. At week 18 the
mean daily DHA intake from supplementation was 252 ± 400 mg (15 – 1,492
mg). The average daily DHA intake for weeks 28 and 35 were 284 ± 370 mg (53
– 1,492 mg) and 280 ± 405 mg (78 – 1,492 mg), respectively. The average
median DHA intake from daily supplementation taken from weeks 18, 28 and 35
was 180 mg. According to the post-partum survey, 16 women used DHA

41
supplementation during their pregnancy; their mean daily DHA intake was 340 ±
373 mg (78 – 1,492 mg) and the median was 200 mg/d.
Among participants who did not consume DHA supplementation, the
mean DHA intake for week 18 was 145 ± 117 mg (14 – 424 mg; n = 22). At week
28 and 35, the mean DHA intake was 144 ± 79 mg (8 – 541 mg; n = 20) and 152
± 94 mg (13 – 555 mg; n = 21), respectively. The median value at weeks 18, 28
and 35 was 92 mg, 79 mg, and 94 mg, respectively.
According to the 34 completed week 35 FFQ interview, 24 participants
stated they consumed both meat (red meat and poultry) and fish during their
pregnancy. One participant was an ova-lacto vegetarian, two participants
avoided meat but ate fish, and five women avoided fish but ate meat. According
to the 36 completed post-partum survey, four women claimed to avoid fish due to
concerns of mercury contamination. Of these four participants, one participant
added nausea as a reason for lack of fish consumption and two added they were
concerned about food safety issues. Two participants did not consume fish
because of taste. Thirteen participants consumed fish at least once per week.
For a detailed description of participants’ fish consumption throughout pregnancy
see Table 4.5.

42
Table 4.5. Participants’ fish consumption throughout pregnancy derived from the post-partum survey.
Fish Consumption N 0 5 < 1/month 4 1/month 5 2/month 7 1/week 13 2/week 1 3/week 1
Tuna and salmon were the most consumed types of fish during
pregnancy. According to the post-partum survey, the types of fish consumed
from most to least included tuna (n = 18), salmon (n = 17), cod (n = 6), albacore
(n = 4) and trout (n = 2). Other types of marine food consumed by participants
included white-fish, tilapia, walleye, halibut, mahi-mahi, eel, anchovies, sardines,
cat-fish, and shell-fish, such as shrimp, crab and scallops. Many of the
participants consumed more than one variety of fish and shell-fish.
According to the post-partum survey, the n-3 and DHA fortified foods,
which provided a source of DHA included peanut butter, eggs and soy milk.
Eight participants stated they consumed DHA fortified soy-milk. Twenty-one
participants reported eating DHA enriched eggs. Fortified peanut-butter was
consumed by one participant during her pregnancy.

43
CHAPTER 5
DISCUSSION
Introduction
This study was used to describe maternal docosahexaenoic acid (DHA)
intake in a non-coastal community. The purpose of this study was to describe
maternal DHA intake, to determine if participants met current DHA
recommendations, and to determine if maternal DHA intake differed from weeks
18, 28 and 35. Biochemical analysis was not performed on maternal and fetal
plasma and red blood cell (RBC) phospholipids due to time restrictions. Much of
the previous prenatal research on maternal DHA intake has taken place in
coastal communities (Denomme et al., 2005; Innis & Elias, 2003; Oken,
Kleinman, Olsen, Rich-Edwards, & Gillman, 2004). Results from these
populations may not reflect pregnant women in Southwest Montana, which have
different accessibility to marine omega-3 (n-3) polyunsaturated fatty acids
(PUFAs).
Recommendations and Sources of DHA During Pregnancy
Maternal DHA intake was determined using a food frequency
questionnaire (FFQ) interview. Previously reported n-3 PUFA intake has been
based on either food diaries (Bonham et al., 2008; Denomme et al., 2005) or
FFQ interviews (Innis & Elias, 2003; Stark et al., 2005). Food frequency

44
questionnaires are used because the scope of reporting time is greater than a 3-
day diet record. Since marine n-3 PUFAs are not typically consumed on a day-
to-day basis, our study used an n-3 focused FFQ, which was created for this
project and covered a four week period, in order to determine maternal DHA
intake.
Meeting Current Recommendations for DHA Intake Among Participants Participants’ overall mean DHA intake was 248 ± 321 mg. This value
shows that as a group, participants were meeting the recommended ≥ 200 mg of
DHA/d through out their pregnancy. However, participants’ range in overall
dietary DHA intake was 1,758 mg/d and their overall median intake was 186
mg/d.
According to FFQ interview data at weeks 18 and 28, 44% and 52% of our
participants were meeting the ≥ 200 mg of DHA recommendations, respectively.
At week 35, 50% of our population was meeting current recommendations.
During week 35, 11 participants consumed ≤ 100 mg of DHA/d and 10
participants did not meet 3rd trimester recommendations of 50 – 70 mg of DHA/d.
Therefore, 31% of our participants were not meeting fetal DHA requirements
during the 3rd trimester and 50% of our population was consuming less DHA than
recommended.
In North America, the estimated average maternal intake of DHA is 40 –
120 mg/d (Denomme et al., 2005; Innis & Elias, 2003; Innis & Friesen, 2008;
Stark et al., 2005); however, individual intake can vary widely. Participants in our
45
study had a DHA intake that ranged from 8 – 1,839 mg/d, which was a greater
range than that previously reported. For instance, Innis and Elias (2003) found
that pregnant Canadian women have a DHA intake range of 24 – 524 mg/d and
Innis and Friesen (2008) found pregnant women had consumed 10 – 760 mg of
DHA/d.
The participant with the daily DHA intake of 8 mg/d at week 28 is
Caucasian, educated at the graduate level, married and with a household income
of $50,000 – $75,000. In her post-partum survey she stated that she consumed
prenatal vitamins and 1,000 mg of flax seed oil, daily. At least once per week
during her pregnancy, she consumed salmon, walleye or tilapia. According to
the USDA Nutrient Data base (USDA Agricultural Research Services, 2009)
tilapia has a DHA value of 130 mg per 100 g of fish, walleye contains 288 mg of
DHA per 100 g of fish, and wild Atlantic salmon contains 1,429 – 2,147 mg of
DHA per 100 g of fish. If tilapia, walleye or salmon was consumed once per
week, they would provide 19 mg, 41 mg or 204 –306 mg of DHA/d. Only one
100 g portion of salmon per week provides the recommended amount of DHA.
The Perinatal Lipid Intake (PERILIP) Working Group and the International
Society for the Study of Fatty Acids and Lipids (ISSFAL) suggest that pregnant
women consume two portions of fatty fish per week (ISSFAL, 2006; Koletzko,
2008). This participant did not take DHA supplementation nor did she consume
the recommended amount of fatty fish per week. In fact, in her week 28 FFQ
interview, she stated that she had not consumed any fish during the previous
month in question. This leads us to believe that a zero fish intake and a lack of

46
DHA supplements provide a low DHA intake of around 8.0 mg/d. Furthermore,
the discrepancy between this participant’s FFQ interview and post-partum survey
emphasizes the potential for participants to over-report fish or supplementation
intake in the post-partum survey.
This participant took 1,000 mg of flaxseed oil, which provides 533 mg of
alpha-linolenic acid (ALA) and 0 mg of DHA (USDA Agricultural Research
Services, 2009). Others have reported that only 1 – 4% of ALA is converted to
DHA (Innis & Elias, 2003). Therefore, consuming n-3 PUFAs in the form of ALA
from flaxseed oil does not provide enough DHA to meet maternal dietary DHA
intake recommendations during pregnancy.
The participant in question is well-educated and affluent. Our findings
suggest that DHA education and intervention may be necessary for women in a
variety of socio-economic standings (Stark et al., 2005). Moreover, pregnant
women who rely on ALA conversion to form LCPUFAs and limited amounts of
fish may not receive the adequate amount of DHA during their pregnancy.
Although DHA values in our study had a range of 1,831 mg, results for the
overall mean maternal DHA in our participants are higher than previously
reported in other studies. Denomme et al. (2005) found that 20 pregnant
Canadian women during their second and third trimester consumed an average
of 82 ± 33 mg/d of DHA and did not consume DHA supplements. Innis and Elias
(2003) estimated, from food sources, that DHA intake among pregnant women
located in the Pacific coastal community of Vancouver was 160 ± 20 mg/d in

47
2003 and 110 mg/d in 2008 (Innis & Friesen, 2008). Among African-American
women, Stark et al. (2005) predicted a mean DHA intake of 68 ± 75 mg/d.
Although women in our study had a greater mean intake, only 16
participants were meeting the ≥ 200 mg of DHA/d recommendation at week 35.
An average of 12 participants reported, via the FFQ interviews, using DHA
supplementation. These participants had a total mean and median DHA intake
value of 272 ± 380 mg/d and 185 mg/d, respectively. According to the post-
partum survey, 16 women used DHA supplementation during their pregnancy
and had a mean daily DHA intake of 340 ± 373 mg and a median value of 200
mg.
The group of participants who used DHA supplementation met current
prenatal DHA recommendations. However, participants who did not consume
DHA in the form of supplementation had a total mean DHA value of 147 ± 139
mg and a median value of 88 mg. The mean DHA value among participants who
did not consume any form of DHA supplementation is congruent with previous
research findings (Innis & Elias, 2003; Stark et al., 2005). Therefore, the mean
dietary DHA intake for participants who did not consume supplementation was
below the recommended 200 mg of DHA/d.

48
DHA Intake During the Third Trimester of Pregnancy
Fetal demands for DHA are high and may challenge maternal capacities.
About 90% of fetal fat deposits occur during the last 10 weeks of gestation
(Hadders-Algra, 2008). Fetal DHA needs during the third trimester has been
estimated at 67 mg/d (Denomme et al., 2005; Innis, 2003; Innis, 2007b). Since
the fetus represents around 25% of the total weight gained at term pregnancy,
maternal intake of DHA should exceed the amount that accumulates in fetal
tissue (Innis & Elias, 2003). Pregnant women should consume > 67 mg of
DHA/d in order to meet their physiological demands and the demands of the
growing fetus.
At week 35, participants in our study consumed an overall mean DHA
value of 246 ± 326 mg and a median value of 190 mg. However, among the
participants that did not consume DHA supplementation (n = 21) the mean DHA
intake value was 152 ± 155 mg/d and the median value was 94 mg/d.
Participants that did consume DHA supplementation (n = 11) had a mean DHA
intake of 280 ± 405 mg/d and a median value of 200 mg. Thus, participants who
consumed DHA supplementation were exceeding the recommended 200 mg.
Furthermore, our findings suggest pregnant women in Southwest Montana do not
obtain enough DHA via dietary intake for maintaining maternal and fetal needs
during the third trimester and pregnant women in the Bozeman community
should consider DHA supplementation in order to meet the current DHA
recommendations.
49
Week 35 FFQ interviews were used to investigate the DHA intake of those
participants who reported, via post-partum survey, not consuming fish during
their pregnancy. Those participants who reportedly avoided fish but consumed
DHA supplements had a daily DHA intake of 284 mg and 221 mg. Although
these participants (n = 2) did not eat marine n – 3 PUFAs, they were obtaining
the recommended amount of DHA for adequate third trimester maternal and fetal
needs by consuming soft-gel fish oil capsules or Expecta DHA supplements.
Among those participants who did not consume fish or DHA supplementation (n
= 3) the daily DHA intake was 24 mg, 26 mg, and 41 mg. The mean daily DHA
intake of 30 mg among these participants was insufficient to meet the estimated
fetal needs of 67 mg of DHA/d. This data supports evidence that DHA
supplementation can be a resourceful way for pregnant women to meet fetal and
maternal needs during gestation even if they do not consume fish.
Dietary Source of DHA According to the 32 completed FFQ interview, at week 35, the majority of
the participants (n = 24) consumed meat and fish during their pregnancy.
Reasons for lack of fish consumption among participants included mercury
contamination and/or food safety concerns (n = 3), mercury contamination and
nausea (n = 1), and taste (n = 2). Of the six participants who did not eat fish,
three reported taking a DHA supplement throughout pregnancy (200 – 1,000 mg)
and three did not take any DHA supplementation.

50
According to the post-partum survey, many participants in our study did
not consume fish on a weekly basis. Assuming that the average FFQ estimation
of four ounces of fish per serving was correct, 16 participants in our study had a
low habitual fish intake of around 8 ounces or 2 servings per month. Thirteen
women did state they consumed around four ounces of fish once per week. This
value is comparable to other first nation countries, such as the United Kingdom
(UK). In the UK, the average fish consumption per week is 140 g or 5 ounces
(Bonham et al., 2008). Among participants that consumed fish during their
pregnancy, the major sources of marine n-3 PUFA included tuna, salmon and
cod. Other less frequently consumed marine n – 3 PUFAs were albacore, trout,
tilapia, halibut, mahi-mahi, and shell-fish. Fortified eggs, milks and other
products provided DHA to the maternal diet during pregnancy.
Recommendations for fish intake during pregnancy are based on
adequate n-3 PUFAs for the mother and fetus; however, a concern of adverse
effects on prenatal mercury exposure has lead to guidelines on maternal fish
consumption (Bonham et al., 2008). The United Kingdom’s Scientific Advisory
Committee on Nutrition recommend that pregnant women consume no more than
10 ounces of oily fish per week and the US Food and Drug Administration (FDA)
and US Environmental Protection Agency (EPA) jointly recommend that women
consume no more than 12 ounces of low mercury fish per week (Bonham et al.,
2008). However, eight ounces of cooked salmon per week sufficiently provides
around 400 mg of DHA/d (Santerre, 2008).

51
Consuming a low mercury fish, such as salmon, provides an adequate
amount of LCPUFAs and does not require the mother to exceed the advisory
warnings of 10 – 12 ounces of fish per week. Only one participant in our study
admitted to consuming fish three times per week. The type of fish that this
participant consumed most frequently was salmon; however, others included
sardines, anchovies and shell-fish. According to her week 35 FFQ, she
consumed salmon twice per week, shrimp once per week, crab once per week,
and snapper once during the month. This participant had a daily DHA value of
493 mg at week 35 and did not consume DHA supplementation. Consuming 12
ounces of salmon per week does not exceed the US FDA and US EPA warnings
of mercury poisoning and provided around 600 mg of DHA/d. This participant
consumed eight ounces of salmon and other marine n-3 PUFAs throughout the
week, and was able to exceed maternal and fetal DHA needs for the third
trimester. Therefore, obtaining adequate DHA intake for maternal and fetal
needs via dietary sources is possible if one consumes at least two portions of
fatty fish per week.
Sources of Error in Maternal Dietary Intake Many factors influence maternal dietary intake during pregnancy. Sources
of error in this project could have included under-reporting during data collection
of the 3-day diet record and the FFQ interview. During the FFQ interview,
participants may have had difficulty estimating portion sizes and/or remembering
foods that were less frequently consumed during the month in question.

52
Moreover, 16 women reported using DHA supplementation during their
pregnancy; however, only 12, 13 and 11 participants reporting using DHA
supplements during weeks 18, 28 and 35, respectively. The inconsistency
between the post-partum survey and the FFQ interview could potentially be
attributed to the forgetfulness of the participants during the FFQ interviews and 3-
day diet records or an over-reporting of maternal DHA supplementation on the
post-partum survey.
Due to a large reporting time, the FFQ interview can be a more reliable
method of obtaining maternal DHA intake during pregnancy. The 3-day diet
record was unable to capture all maternal fish consumption during the week in
question, since many participants did not report eating fish more than once per
week. The correlation between DHA intake from maternal 3-day dietary
information and the FFQ interview is currently at r = 0.77 (May, 2009).
Therefore, future studies can use the FFQ interview to determine maternal
dietary DHA intake, which reduces the amount of work a participant has to do
and may introduce participation in a greater socioeconomic demographic.
The value of maternal DHA intake did not differ significantly from weeks
18, 28 and 35. This suggests that three data points at weeks 18, 28 and 35 may
not be necessary for future projects because participants’ DHA intake does not
differ throughout the pregnancy. Other researchers have collected dietary data
from week 28, 35 or 36 only, and others used both week 28 and 35 (Bonham et
al., 2008; Innis & Elias, 2003; Innis & Friesen, 2008; Stark et al., 2005).
Therefore, reducing dietary data collection to one or two time points may

53
increase participation while maintaining an actual representation of n-3 PUFA
intakes during pregnancy.
Effects of Marine n – 3 PUFAs on Membrane Composition
The maternal and fetal blood parameters were undetermined in our study.
Due to a lack of results, a regression analysis could not be used to determine the
correlation between maternal DHA intake and maternal blood lipid parameters at
week 35. The relationship between maternal blood parameters and fetal blood
parameters could not be investigated, as well. Nevertheless, a discussion is
provided to demonstrate an understanding of what was expected in maternal and
fetal blood parameters.
Relationship Between Maternal DHA Intake and Maternal Blood Lipid Parameters Maternal metabolic changes are expected to occur throughout pregnancy.
In the early stages of pregnancy, maternal fat stores increase and insulin
sensitivity decreases (Lain & Catalano, 2007). Insulin is a lypogenic substance
that favors maternal fat accumulation in preparation for the rise in energy needs
associated with the rapidly growing fetus and placenta (Homko et al., 1999). By
the third trimester, insulin resistance increases in order to favor a rise in maternal
free fatty acid (FFA) concentrations, which allows for a greater carbohydrate
(CHO) and fatty acid (FA) availability for the growing fetus (Homko et al., 1999).
Available maternal FFAs for fetal development can arise from the
catabolism of maternal adipocyte cells or directly from maternal dietary intake.

54
Our second hypothesis stated that there is no correlation between maternal DHA
intake and maternal RBC and plasma DHA concentrations at week 35. However,
previous research has shown that an increase in maternal DHA intake can
increase maternal DHA lipid profiles. Innis and Freisen (2008) administered 400
mg of DHA/d from weeks 16 to 36 (n = 68) and observed an increase of 32% in
RBC DHA concentrations in the intervention group (p < 0.05).
Among Canadian women, Innis and Elias (2003) determined that the
mean daily intake of DHA is significantly related to the concentration of DHA in
the plasma phospholipids (r = 0.63; p < 0.0001). Plasma phospholipids DHA
concentrations were measured at 5.0 ± 0.18 g DHA/100 g fatty acid (Innis &
Elias, 2003). They further determined that an increase in fatty fish consumption
was related to an increase in DHA plasma phospholipid concentrations (r = 0.61,
p < 0.0001) (Innis & Elias, 2003). Therefore, an increase in maternal fatty fish
intake or DHA supplementation can increase DHA concentrations in maternal
RBCs and plasma phospholipids, which provides higher DHA concentrations to
the developing fetus.
Previous research has shown that an increase in maternal dietary DHA
will increase maternal blood lipid parameters. Therefore, our research expected
to see a direct relationship between maternal DHA intake and DHA blood lipid
concentrations. However, due to the lack of analyzed data, we can neither reject
nor fail to reject our second null hypothesis.

55
Relationship between Maternal and Fetal Blood Lipid Parameters Hypothesis three and four stated that there is no relationship between
maternal plasma and red blood cell (RBC) DHA concentrations at week 35 and
fetal plasma and RBC concentrations at delivery. Elias and Innis (2001)
described how DHA concentrations in infant plasma lipids were significantly
related to maternal plasma lipid concentrations (r = 0.48; p < 0.001). The mean
maternal and infant plasma phospholipid DHA concentrations, measured in % by
weight of total FA were 5.02% and 7.67%, respectively (Elias & Innis, 2001).
Others found that maternal and newborn plasma phospholipid concentrations at
delivery were 3.66 ± 0.06% and 5.82 ± 0.09%, respectively (p < 0.001)
(Vlaardingerbroek & Hornstra, 2004).
The concentration of DHA has been shown to be around 300 – 400 times
greater in fetal compared to maternal plasma phospholipids (Innis, 2003).
Research has shown that the concentration of DHA in maternal plasma
phospholipids declines towards the end of gestation (Bergmann et al., 2008;
Haggarty, 2004; Vlaardingerbroek & Hornstra, 2004). Plasma contains a high
concentration of FFA, which provides direct energy stores for fetal accretion. At
delivery, higher fetal DHA plasma phospholipid concentrations would be
expected compared to maternal DHA concentrations at week 35 or delivery.
Fetal needs for FFAs containing DHA are greater than maternal needs for higher
plasma DHA FFA concentrations. Increased plasma FFA during late stage
pregnancy has been shown to be induced by insulin resistance and aid in

56
inhibiting glucose uptake, which provides an increase in nutrients transported to
the fetus (Homko et al., 1999).
Research on the difference between maternal and infant DHA RBC
concentrations is conflicting. Bohles et al. (1999) did not observe a significant
difference between maternal and infant DHA erythrocyte concentrations at
delivery, although fetal RBC DHA concentrations were slightly greater (p > 0.05).
The mean maternal and fetal DHA RBC phospholipid concentrations were 3.2%
and 3.4%, respectively (r = 0.63; p < 0.001). However, others found that at
delivery the percent of total DHA in maternal and fetal RBC and plasma
phospholipid were 3.85 ± 0.05% and 4.73 ± 0.05%, respectively and significantly
differed (p < 0.001) (Vlaardingerbroek & Hornstra, 2004).
The turn over of a RBC is around 100 – 120 days, or 3 – 4 months.
Maternal DHA RBC concentrations are expected to be higher since maternal
RBCs are older than fetal RBC and reflect the maternal diet prior to and during
pregnancy. The fetus begins producing RBC around the 16th week of gestation
(FortuneCity, 1999). If maternal DHA intake and DHA blood lipid concentrations
are low during the first trimester of pregnancy, then the fetal RBC collected at
birth is a reflection of maternal DHA status during the earlier stages of pregnancy
and not the later stages of pregnancy and may be low, too. Therefore,
determining maternal and fetal transfer of DHA using erythrocytes may be less of
an indicator of DHA availability at the time of collection than plasma
concentrations. Thus, if our results were congruent with other research, we
would have suspected that maternal plasma and RBC DHA concentrations were

57
positively related to fetal plasma and RBC DHA blood lipid parameters at
delivery. However, our results were undetermined and we can neither reject nor
fail to reject the null hypotheses for hypotheses three and four.
Possible Sources of Error and Improvements
The study population may not be reflective of the greater Southwest
Montana population or other non-coastal communities. Maternal dietary intake of
DHA was higher than previously reported (Denomme et al., 2005; Innis & Elias,
2003; Stark et al., 2005). The women in our study were predominantly white,
well-educated, and affluent. The mean household income was $47,564, which
alludes to the fact that our participants could afford prenatal vitamins, DHA
supplements, and marine n-3 PUFAs. All the women in our study had some form
health-care and worked with a health-care provider.
Recruitment efforts took place at the Bozeman farmer’s market and
grocery stores. Flyers were placed in coffee shops, clothing stores and local
news papers. This type of recruitment could have targeted educated and affluent
women, who shopped locally and participated in local events. Women who were
interested in the project but lived in the smaller communities surrounding
Bozeman, such as Ennis, Manhattan, and Livingston stated that they could not
afford the time and money it would have cost to drive to Bozeman, and were
unable to participate.
During recruitment efforts people showed an interest in our study. Women
who were interested in our project, but did not follow through with recruitment

58
efforts, were intimidated with the data collection. Completing a 3-day diet record,
an FFQ interview and a venipuncture blood draw was unappealing to many
potential recruits. Therefore, our participants were individuals who enjoyed
contributing to the growing knowledge of prenatal and maternal healthcare
science. Again, these participants may not be reflective of the greater Southwest
Montana region, nor can they be used to generalize other non-coastal
populations.
In order to obtain accurate and representative results from this community
in the future, the project should be repeated with a larger sample size. Bozeman,
Montana has a population of around 33,000 people (Bozeman Population
Overview, 2000). Our participants represent only 0.12% of the Bozeman
population. Obtaining a larger sample can provide a greater representation of
the Southwest Montana community. Furthermore, performing this study in
communities around the state of Montana, for example in Billings, Missoula
and/or Havre, researchers can have a better understanding of the entire Montana
population as it relates to DHA intake.
Future studies should address how pregnant women acquire their
knowledge about DHA intake and supplementation. Around half of our
population was consuming DHA supplementation throughout their pregnancy;
however, it is undetermined where participants obtained information regarding n-
3 PUFA supplementation. For instance, the participant that consumed 1,000 mg
of flax oil/d only consumed 8 mg of DHA/d during the month surrounding the 28th
week of gestation. However, the participants that were consuming DHA

59
supplementation had a mean daily DHA intake that exceeded current
recommendations. Pregnant women may think that all n-3 PUFAs are the same
or provide the same benefits to the growing fetus. Further investigations
regarding participants’ knowledge of DHA intake can allow researchers and
healthcare providers to understand the consumer perception of FA intake during
pregnancy and better suggest sources of DHA to meet maternal dietary DHA
recommendations.

60
CHAPTER 6
CONCLUSION
Dietary patterns of our participants remained consistent over time and
docosahexaenoic acid (DHA) intake did not differ significantly. Participants who
consumed supplementation did so throughout the pregnancy. The participants
who were low marine omega-3 (n-3) polyunsaturated fatty acid (PUFA)
consumers (less than once per week) did not change their dietary fish habits by
the 35th week of pregnancy. Since dietary patterns did not change over time, one
can conclude that future studies can use week 28 and/or 35 to determine DHA
status in pregnant women.
Current recommendations suggest that pregnant women among the
general population should consume at least 200 mg of DHA per day and even
higher dosages can be beneficial, especially during the third trimester of
pregnancy (Hadders-Algra, 2008). Our overall population’s DHA intake mean
was above the current recommendation. However, only half (n = 16) of our
population was meeting DHA recommendations, especially during the week 35
data collection period. Among the 16 participants, the daily DHA mean was 418
± 392 mg and the median was 257 mg/d. The primary source of DHA among the
16 participants was DHA supplementation (n = 11); only 5 participants were
meeting current DHA recommendations through dietary means, alone at week
35.

61
Current recommendations state that pregnant women can obtain
adequate DHA concentrations for maternal and fetal needs by consuming at
least two portions of fatty fish per week (ISSFAL, 2006; Koletzko et al., 2007).
However, only two participants in our study reported consuming marine n-3
PUFAs at least twice per week. More than half of our population consumed
marine n-3 PUFAs once a week or less.
Dietary DHA intake from marine n-3 PUFAs is insufficient to meet
maternal and fetal needs among pregnant women in Southwest Montana. The
most adequate source of DHA for pregnant women in this community is DHA
supplementation. Furthermore, n-3 PUFA education is necessary among this
population to ensure that maternal DHA intake sufficiently meets current DHA
dietary recommendations.

62
REFERENCES

63
Bergmann, R. L., Haschke-Becher, E., Klassen-Wigger, P., Bergmann, K. E., Richter, R., Dudenhausen, J. W., et al. (2008). Supplementation with 200 mg/day docosahexaenoic acid from mid-pregnancy through lactation improves the docosahexaenoic acid status of mothers with a habitually low fish intake and of their infants. Annals of Nutrition and Metabolism, 52(2), 157-166.
Bohles, H., Arndt, S., Ohlenschlager, U., Beeg, T., Gebhardt, B., & Sewell, A. C.
(1999). Maternal plasma homocysteine, placenta status and docosahexaenoic acid concentration in erythrocyte phospholipids of the newborn. European Journal of Pediatrics, 158(3), 243-246.
Bonham, M. P., Duffy, E. M., Wallace, J. M. W., Robson, P. J., Myers, G. J.,
Davidson, P. W., et al. (2008). Habitual fish consumption does not prevent a decrease in LCPUFA status in pregnant women (the Seychelles Child Development Nutrition Study). Prostaglandins, Leukotrienes & Essential Fatty Acids, 78(6), 343-350.
Bozeman Population Overview. (2000) In Epodunk. Retrieved on April 1, 2009,
from http://www.epodunk.com/cgi-bin/popInfo.php?locIndex=27674 Cleland, L. G., James, M. J., & Proudman, S. M. (2006). Fish oil: what the
Prescriber needs to know. Arthritis Research & Therapy, 8(1), 202. Crawford, M. (2000). Placental delivery of arachidonic and docosahexaenoic
acids: implications for the lipid nutrition of preterm infants. American Journal of Clinical Nutrition, 71(1 Suppl), 275S-284S.
Denomme, J., Stark, K. D., & Holub, B. J. (2005). Directly quantitated dietary (n-
3) fatty acid intakes of pregnant Canadian women are lower than current dietary recommendations. Journal of Nutrition, 135(2), 206-211.
Elias, S. L., & Innis, S. M. (2001). Infant plasma trans, n-6, and n-3 fatty acids
and conjugated linoleic acids are related to maternal plasma fatty acids, length of gestation, and birth weight and length. American Journal of Clinical Nutrition, 73(4), 807-814.
U.S. Fish & Wildlife Service Report. (2009) In Endangered Species Special
Report. Retrieved May 1, 2009, from http://ecos.fws.gov/tess_public/SpeciesReport.do
Folch, J., Lees, M., & Sloane-Stanley, G. H. (1957). A simple method for the
isolation and purification of total lipides from animal tissues. Journal of Biological Chemistry, 226(1), 497-509.

64
FortuneCity. (1999) Formation of Blood Cells. Retrieved May 1, 2009, from http://www.fortunecity.com/greenfield/rattler/46/haemopoiesis.htm
Freeman, M. P., & Sinha, P. (2007). Tolerability of omega-3 fatty acid
supplements in perinatal women. Prostaglandins, Leukotrienes, & Essential Fatty Acids, 77(3-4), 203-208.
Gebauer, S. K., Psota, T. L., Harris, W. S., & Kris-Etherton, P. M. (2006). n-3
fatty acid dietary recommendations and food sources to achieve essentiality and cardiovascular benefits. American Journal of Clinical Nutrition, 83(6 Suppl), 1526S-1535S.
Genuis, S. J. (2008). To sea or not to sea: Benefits and risks of gestational fish
consumption. Reproductive Toxicology, 26(2), 81-85. Grandjean, P., Bjerve, K. S., Weihe, P., & Steuerwald, U. (2001). Birth weight in
a fishing community: significance of essential fatty acids and marine food contaminants. International Journal of Epidemiology, 30(6), 1272-1278.
Groff, J. L., & Gropper, S. S. (2000). Advanced Nutrition and Human Metabolism (3 ed.). Belmont: Wadsworth/Thomson Learning. Hadders-Algra, M. (2008). Prenatal long-chain polyunsaturated fatty acid status:
the importance of a balanced intake of docosahexaenoic acid and arachidonic acid. Journal of Perinatal Medicine, 36(2), 101-109.
Haggarty, P. (2004). Effect of placental function on fatty acid requirements during
pregnancy. European Journal of Clinical Nutrition, 58(12), 1559-1570. Helland, I. B., Saugstad, O. D., Smith, L., Saarem, K., Solvoll, K., Ganes, T., et
al. (2001). Similar effects on infants of n-3 and n-6 fatty acids supplementation to pregnant and lactating women. Pediatrics, 108(5), E82.
Helland, I. B., Smith, L., Saarem, K., Saugstad, O. D., & Drevon, C. A. (2003).
Maternal supplementation with very-long-chain n-3 fatty acids during pregnancy and lactation augments children's IQ at 4 years of age. Pediatrics, 111(1), e39-44.
Homko, C. J., Sivan, E., Reece, E. A., & Boden, G. (1999). Fuel metabolism
during pregnancy. Seminars in Reproductive Endocrinology, 17(2), 119-125.
Innis, S. M. (2000). The role of dietary n-6 and n-3 fatty acids in the developing
brain. Developmental Neuroscience, 22(5-6), 474-480.

65
Innis, S. M. (2003). Perinatal biochemistry and physiology of long-chain polyunsaturated fatty acids. Journal of Pediatrics, 143(4 Suppl), S1-8.
Innis, S. M. (2005). Essential fatty acid transfer and fetal development. Placenta,
26 Suppl A, S70-75. Innis, S. M. (2007a). Dietary (n-3) fatty acids and brain development. Journal of
Nutrition, 137(4), 855-859. Innis, S. M. (2007b). Fatty acids and early human development. Early Human
Development, 83(12), 761-766. Innis, S. M., & Dyer, R. A. (2002). Brain astrocyte synthesis of docosahexaenoic
acid from n-3 fatty acids is limited at the elongation of docosapentaenoic acid. Journal of Lipid Research, 43(9), 1529-1536.
Innis, S. M., & Elias, S. L. (2003). Intakes of essential n-6 and n-3
polyunsaturated fatty acids among pregnant Canadian women. American Journal of Clinical Nutrition, 77(2), 473-478.
Innis, S. M., & Friesen, R. W. (2008). Essential n-3 fatty acids in pregnant women
and early visual acuity maturation in term infants. American Journal of Clinical Nutrition, 87(3), 548-557.
Innis, S. M., & King, D. J. (1999). trans Fatty acids in human milk are inversely
associated with concentrations of essential all-cis n-6 and n-3 fatty acids and determine trans, but not n-6 and n-3, fatty acids in plasma lipids of breast-fed infants. American Journal of Clinical Nutrition, 70(3), 383-390.
International Society for the Study of Fatty Acids and Lipids. (2006). PUFA
Recommendations. Retrieved September 16, 2008, from http://www.issfal.org/uk.
Koletzko, B. (2008). Prenatal supply of docosahexaenoic acid (DHA): should we
be worried? Journal of Perinatal Medicine, 36(3), 265-267; author reply 268-269.
Koletzko, B., Cetin, I., & Brenna, J. T. (2007). Dietary fat intakes for pregnant and
lactating women. British Journal of Nutrition, 98(5), 873-877. Koletzko, B., Lien, E., Agostoni, C., Bohles, H., Campoy, C., Cetin, I., et al.
(2008). The roles of long-chain polyunsaturated fatty acids in pregnancy, lactation and infancy: review of current knowledge and consensus recommendations. Journal of Perinatal Medicine, 36(1), 5-14.

66
Kris-Etherton, P. M., Taylor, D. S., Yu-Poth, S., Huth, P., Moriarty, K., Fishell, V., et al. (2000). Polyunsaturated fatty acids in the food chain in the United States. American Journal of Clinical Nutrition, 71(1 Suppl), 179S-188S.
Lain, K. Y., & Catalano, P. M. (2007). Metabolic changes in pregnancy. Clinical
Obstetrics and Gynecology, 50(4), 938-948. McMillen, I. C., Schwartz, J., Coulter, C. L., & Edwards, L. J. (2004). Early
embryonic environment, the fetal pituitary-adrenal axis and the timing of parturition. Endocrine Research, 30(4), 845-850.
Myers, G. J., Davidson, P. W., & Strain, J. J. (2007). Nutrient and methyl mercury
exposure from consuming fish. Journal of Nutrition, 137(12), 2805-2808. Nelms, M., Sucher, K., & Long, S. (2007). Nutrition Therapy and
Pathophysiology. Belmont: Thomson Higher Education. USDA Agriculture Research Service. (2009). In Nutrition Data Base Products and
Service. Retrieved on April 1, 2009, from http://www.ars.usda.gov Oken, E., Kleinman, K. P., Olsen, S. F., Rich-Edwards, J. W., & Gillman, M. W.
(2004). Associations of seafood and elongated n-3 fatty acid intake with fetal growth and length of gestation: results from a US pregnancy cohort. American Journal of Epidemiology, 160(8), 774-783.
Olsen, S. F., & Secher, N. J. (2002). Low consumption of seafood in early
pregnancy as a risk factor for preterm delivery: prospective cohort study. British Medical Journal, 324(7335), 447.
Olsen, S. F., Sorensen, J. D., Secher, N. J., Hedegaard, M., Henriksen, T. B.,
Hansen, H. S., et al. (1992). Randomized controlled trial of effect of fish-oil supplementation on pregnancy duration. The Lancet, 339(8800), 1003-1007.
Ruyle, M., Connor, W. E., Anderson, G. J., & Lowensohn, R. I. (1990). Placental
transfer of essential fatty acids in humans: venous-arterial difference for docosahexaenoic acid in fetal umbilical erythrocytes. Proceedings of the National Academy of Science U S A, 87(20), 7902-7906.
Santerre, C. R. (2008). Wild versus Farm-Raised Salmon: Health Benefits and
Risks. Sports, Cardiovascular and Wellness Nutrition (Scan's) Pulse, 27(4), 1-5.
67
Simopoulos, A. P. (2000). Human requirement for N-3 polyunsaturated fatty acids. Poultry Science, 79(7), 961-970.
Stark, K. D., Beblo, S., Murthy, M., Buda-Abela, M., Janisse, J., Rockett, H., et al.
(2005). Comparison of bloodstream fatty acid composition from African-American women at gestation, delivery, and postpartum. Journal of Lipid Research, 46(3), 516-525.
Szajewska, H., Horvath, A., & Koletzko, B. (2006). Effect of n-3 long-chain
polyunsaturated fatty acid supplementation of women with low-risk pregnancies on pregnancy outcomes and growth measures at birth: a meta-analysis of randomized controlled trials. American Journal of Clinical Nutrition, 83(6), 1337-1344.
Thorsdottir, I., Birgisdottir, B. E., Halldorsdottir, S., & Geirsson, R. T. (2004).
Association of fish and fish liver oil intake in pregnancy with infant size at birth among women of normal weight before pregnancy in a fishing community. American Journal of Epidemiology, 160(5), 460-465.
Troxell, H., Anderson, J., Auld, G., Marx, N., Harris, M., Reece, M., et al. (2005).
Omega-3 for baby and me: material development for a WIC intervention to increase DHA intake during pregnancy. Maternal and Child Health Journal, 9(2), 189-197.
Vlaardingerbroek, H., & Hornstra, G. (2004). Essential fatty acids in erythrocyte
phospholipids during pregnancy and at delivery in mothers and their neonates: comparison with plasma phospholipids. Prostaglandins, Leukotrienes & Essential Fatty Acids, 71(6), 363-374.
Williams, M. A., Frederick, I. O., Qiu, C., Meryman, L. J., King, I. B., Walsh, S.
W., et al. (2006). Maternal erythrocyte omega-3 and omega-6 fatty acids, and plasma lipid concentrations, are associated with habitual dietary fish consumption in early pregnancy. Clinical Biochemistry, 39(11), 1063-1070.

68
APPENDICES

69
APPENDIX A
SUBJECT CONSENT FORM

70
Subject Consent Form For
Participation in Human Research Montana State University
Project Title: Assessment of physical activity levels and dietary intake in pregnant women Principal Investigator: Christina Gayer Campbell, PhD, RD Associate Professor, Nutrition Department of Health and Human Development Herrick Hall, Rm 20 Montana State University Bozeman, MT 59717-3540 406-994-5002; [email protected] Purpose and Rationale of the Study: The purpose of this study is to document the physical activity patterns and consumption of healthy fats in pregnant women. This study will assess healthy pregnant women’s current fat intake and the amount of fat transferred to the baby during pregnancy. You have been identified as a possible participant because you are a healthy women living in the communities surrounding Montana State University (Bozeman, Belgrade, Four Corners, and Livingston) who has shown interest in our study by responding to our recruiting efforts. You have been selected to participate based on several criteria including:
• Pregnant (prior to 18th week of pregnancy); • Not pregnant with multiple babies (e.g. twins); and • Not a smoker.
Study Outline: If you agree to participate, you will be asked to do the following: Prior to Beginning You will be required to receive confirmation that you are healthy enough to participate in this study from your medical provider. The attached consent letter will be sent by the principal investigator to your medical provider and returned to the project director. You will need to provide contact information for your medical provider so that the letter can be sent. Throughout your pregnancy You may participate in physical activities that you choose or have been recommended to you by your physician and you feel comfortable doing. You will consume the “diet” of your choice. We will not ask you to modify your current food choices. You will need to fill out various questionnaires related to your medical history. At any time you are invited to discuss any concerns that you have about the study protocol; however, the project director will not make any physical activity or diet recommendations.

71
At weeks 18, 28 and 35 of your pregnancy You will be required to meet with a study coordinator or project director at Herrick Hall Room 18 before you begin recording your diet, physical activity, and heart rate. During each visit you will be given a dietary scale, heart rate monitor, 3-day food log, 3-day physical activity log, and diet questionnaire. You will have a weight measurement taken and you will have a fasted blood sample obtained via venipuncture by a Red Cross trained phlebotomist. Consenting to this study allows the investigators to utilize frozen blood samples for future analysis. The 3-day food log requires you to weigh all food and beverages consumed for 3 consecutive days. You will be given detailed instructions on how to properly complete the forms and tips on accurately weighing food. You will be provided with a dietary scale, at no cost to you, for use during the study to facilitate the process. You may perceive this to be a tedious process; however it is the most accurate means of collecting dietary intake information. You will not be given a diet to follow; observations are made on what you typically choose to eat. During each visit you will complete a food questionnaire that will take approximately 15 minutes to complete. This questionnaire provides information about the foods you have consumed during the past month. You will be provided with an activity monitor that is worn on the wrist like a watch. The activity monitor will be worn with a locking wristband for seven days, 24 hours a day to ensure the best possible data collection. The monitor is water resistant and can be worn while showering, washing dishes, and swimming. This wrist activity monitor has been used in the Montana State University Movement Science Lab for previous monitoring studies and it has never been reported to cause discomfort or localized skin irritation.
The 7-day physical activity log requires you to record all of your daily activities into a log that will be provided for the same 7 consecutive days you record your food intake, heart rate, and activity monitor. No recommendations for physical activity will be provided to you through this study. All choices for physical activity will be left up to you.
You will be provided with a heart rate monitor that consists of a band worn around your chest and a transmitter worn like a watch. You will need to wear the heart rate monitor consistently for 3 days from the time you awake to the time you go to bed. You may remove the heart rate monitor when sleeping and showering. If you choose to swim continue to wear the heart rate monitor. These 3 days of wearing the heart rate monitor will coincide with the 3 days you record your food log and physical activity log during a period of no more than 7 days. You will receive detailed instruction on proper usage. You will need to arrange a time with a study coordinator or project director to pass in your 3-day food record, 3-day physical activity log, heart rate monitor, and dietary scale at the end of each data collection period. Delivery

72
At birth, an additional blood sample will be collected from the umbilical cord. Cord blood will be collected in a routine procedure already done by your physician at birth once the baby is detached from the placenta. The cord blood sample will be collected from the umbilical cord section still attached to the placenta. There is no risk to your newborn associated with this blood collection. During the 35th week visit you will be provided with a reminder packet specific to the delivery of your baby containing the cord blood sample instructions, a follow-up questionnaire and instructions for coordinating the sample pick-up by an investigator. You will be asked to contact a study coordinator when you go into labor and after the delivery so that blood samples and questionnaires can be picked up immediately from the hospital. Consent to participate in this study allows the investigators to contact you following the completion of the study. Risks: This is an observational study and it will not provide any risks to you or your fetus. This study is looking at what you are doing and does not require you to make any changes to your daily patterns, therefore there are no risks associated with the observational component of the study. Approximately 3 tablespoons of blood will be removed by putting a needle in a vein of your arm on 4 occasions. This is a standard method used to obtain blood for tests. There is momentary pain at the time the needle is inserted into the vein but other discomfort should be minimal. In about 10% of the cases, a small amount of bleeding under the skin will produce a bruise. The risk of infection is less than 1 in 1,000. Benefits: You will be provided with a summary and explanation of the results from the study. Gifts will be provided throughout the study as a token of our appreciation for your participation in the study. Funding: This project is funded by the Department of Health and Human Development and the NIH--INBRE. Confidentiality: The data obtained from the study will be regarded as privileged and confidential. Your privacy will be maintained in any future analysis and/or presentation of the data with the use of coded identifications for each participant’s data. All data will be stored in a locked file cabinet with access only by the principle investigator and project director. Additionally, any data entered into the computer will be available with restricted password only. Freedom of Consent: Participation in this study is completely voluntary. You may withdraw consent in person or by phone with the principal investigator, Christina Campbell at any time. In the event of any physical injury occurring in connection with the study, Montana State University will not provide any special compensation or any medical treatment. We will advise and assist the participant in receiving medical treatment by contacting the appropriate health

73
care provider as directed by you, the participant. Please feel free to ask any questions or express your concerns regarding this study. The investigator will attempt to answer all questions. Contact Dr. Christina Campbell at 994-5002. Please address any questions relating to the rights of human subjects to Mark Quinn, Chair, Human Subjects Committee, 994-5721. Authorization: I have read the above and understand the inconveniences and risks of this study. I, _____________________________________ (your name), agree to participate in the project. I understand that I may later refuse to participate, and that I may withdraw from the study at any time. I have received a copy of this consent form for my own records. Signed: __________________________________________ Witness: _________________________________________ Investigator: ______________________________________ Date: ________________________

74
APPENDIX B
MEDICAL HISTORY QUESTIONNAIRE

75
Medical History Questionnaire Please answer the following questions to the best of your knowledge. All information provided here is completely confidential. Please ask for clarification if needed. Subject Name:____________________________________________________________ (Last) (First) (MI) Phone Number we can reach you at: ____________________________ Email address__________________________________________________ Address:____________________________________________________________ Age: _______yrs_______mo Date of Birth:_____________________________ Pre-pregnancy weight:_______________lbs Height:________ft_________in Is this your first pregnancy? Yes No If no, number of pregnancies____________________ Number of children__________________________ Birth dates of children __________________________________________________________ mo/day/yr mo/day/yr mo/day/yr mo/day/yr mo/day/yr Are you planning to breastfeed? First day of last menstrual period:__________ Due Date:__________________________ What is the first day of your next week of pregnancy? (circle)
Sunday Monday Tuesday Wednesday Thursday Friday Saturday
In what week of your pregnancy did you find out you were
pregnant?____________________
Prior to your pregnancy what was your average number of workouts per week?______________ Average duration of workout_____________________

76
Type of activity____________________________________________________ Since you became pregnant what has been your average number of workouts per week?_______ Average duration of workout_____________________ Type of activity______________________________________________________________ Have you experienced any morning sickness that altered your activity level? Yes No If yes, please describe______________________________________________________ Are you following any guidelines regarding exercise during your pregnancy?_______________ If yes, please describe___________________________________________________________ Where did you receive the guidelines?______________________________________________ Race (circle):
1. American Indian or Alaska Native 2. African American 3. Caucasian 4. Asian 5. Hispanic 6. Other (specify):________________
Marital Status (circle):
1. single 2. married 3. divorced/separated 4. widowed
Education Level What is the last grade in school that you completed? Please specify if two year school (circle)
1. Elementary 01 02 03 04 05 06 07 08 2. High School 09 10 11 12 3. College 13 14 15 16 4. Graduate/Professional School 17+

77
Employment: What is your occupation?__________________________________ If employed how many hours a week do you work?______________ Income: What is your household annual income (circle)
1. No income 2. $1 to $10,000 3. $10,001 to $20,000 4. $20,001 to $30,000 5. $30,001 to $40,000 6. $40,001 to $50,000 7. $50,001 to $75,000 8. $75,001 or more
Medical History (circle any, and give age at diagnosis): Age
1. Diabetes ____ 2. Thyroid Disease ____ 3. Cirrhosis ____ 4. Hepatitis ____ 5. Gall Stones ____ 6. Kidney Stones ____ 7. Nephritis ____ 8. Cancer (specify) ____ 9. High Blood Pressure ____ 10. Angina ____ 11. Allergies (specify) ____ 12. Goiter ____ 13. Cardiovascular Disease ____ 14. Depression requiring medication ____ 15. Insomnia requiring medication ____
Drug History:
1. Do you currently take any medications on a regular basis?_____________________ If yes, please specify___________________________________________________
2. Have you taken medication regularly in the past?_____________________________ If yes, please specify____________________________________________________ How long ago was medication taken regularly?_______________________________
3. Do you currently take vitamin supplements on a regular basis?__________________

78
If yes, please specify____________________________________________________ Have you in the past?___________________________________________________ If so, how long ago?____________________________________________________
4. Do you currently take herbal supplements on a regular basis?____________________
If yes, please specify____________________________________________________ Have you in the past?___________________________________________________ If so, how long ago?____________________________________________________
Diet History: a. Are you a vegetarian? Yes No b. If yes, circle one of the following: i. Lacto-ovo (consume milk, milk products and eggs) ii. Ovo (consume eggs, but no milk or milk products)
iii. Lacto (consume milk and milk products, but no eggs) iv. Vegan (consume no animal products)
c. During your pregnancy are you consuming alcohol?___________ If so, how many drinks each week?_________________________

79
APPENDIX C
MEDICAL PROVIDER CONSENT FORM

80
Dear Medical Provider, _____________________________ has volunteered to participate in an observational study regarding exercise duration, frequency, and intensity in habitually active pregnant women. This study will not be prescribing exercise; it only involves recording what the subject chooses to do on her own. Your patient will wear a heart rate monitor during each bout of exercise, record her daily activities in a log book, and keep a weighed food diet record. Your patient will be keeping these records during the 18th, 28th, and 35th weeks of her pregnancy. At the beginning of each “study” week your patient will be weighed. We would like you to confirm that ______________________________ is healthy enough to participate in exercise during her pregnancy, and that we will be informed if her health status alters her ability to safely exercise. Signature of Medical Provider______________________________ Print Name_____________________________________________ Date________________ Please return this form via facsimile as soon as possible. Thank you for your help with this project. Sincerely, Rebecca Filipowicz Gita Gelfer Phone: (406)994-5001 Fax: (406)994-2013

81
APPENDIX D
3-DAY DIET FOOD LOG EXAMPLE

82
Date:____________
Time Food Constituents Description Weight 9am
Grape Nuts
Post Brand 120g
9am
Sugar White 3g
9am
Milk 1% 106g
9am
Blueberries
Frozen, unsweetened 50g
9am
Orange Juice
Tropicana, no pulp, calcium added
120g
11:30 am
Almonds Raw, unsalted, Kirkland brand
60g
1:00pm
Sandwich Bread Whole Wheat, Wheat Montana
45g
1pm
Sprouts Alfalfa 5g
1pm
Cheese Tillamook Sharp Cheddar
33g
1pm
Apple Juice
From concentrate, Apple Tree brand 100% juice
70g
For Official Use Only
Subject ID:
For Official Use Only
Subject ID:

83
Date:____________
Time Food Constituents Description Weight
Daily Supplements
For Official Use Only
Subject ID:
For Official Use Only
Subject ID:

84
APPENDIX E
FOOD FREQUENCY QUESTIONNAIRE

85 Nutrition Research Lab, Montana State University, Bozeman Subject ______________ Height________________ Weight_______________ Week of Pregnancy____ Interviewer___________ Date ________________ How would you describe your diet since you became pregnant?
I eat both meat and fish ____
I avoid meat, but eat fish ____
I avoid fish, but eat meat ____
I’m a vegetarian and include dairy and eggs in my diet ____
I’m a vegetarian and include dairy but not eggs in my diet ____
I’m a vegetarian and include dairy, eggs, and fish in my diet ____
I’m a vegan, avoid all animal products ____

86 How would you describe your diet before you became pregnant? I eat both meat and fish ____
I avoid meat, but eat fish ____
I avoid fish, but eat meat ____
I’m a vegetarian and include dairy and eggs in my diet ____
I’m a vegetarian and include dairy but not eggs in my diet ____
I’m a vegetarian and include dairy, eggs, and fish in my diet ____
I’m a vegan, avoid all animal products ____
How often have you had the following meals per week in the last month? Number of meals per week
7 6 5 4 3 2 1 0
Breakfast ___ ___ ___ ___ ___ ___ ___ ___
Snack, morning ___ ___ ___ ___ ___ ___ ___ ___
Lunch ___ ___ ___ ___ ___ ___ ___ ___ Snack, afternoon ___ ___ ___ ___ ___ ___ ___ ___
Dinner ___ ___ ___ ___ ___ ___ ___ ___ Snack, after dinner ___ ___ ___ ___ ___ ___ ___ ___ Snack, before bed ___ ___ ___ ___ ___ ___ ___ ___
Other ___ ___ ___ ___ ___ ___ ___ ___
Dairy Products
Times per Milk Brand/Type Amount (cups) Day Week Month
Cow (type)
____________________
_______ _________
__ 1 2 3 4 5
6+ 1 2 3 4 5 6 7 1 2 3
Soy
____________________
_______ _________
__ 1 2 3 4 5
6+ 1 2 3 4 5 6 7 1 2 3

87
Flavored __________
_______ _________
__ 1 2 3 4 5
6+ 1 2 3 4 5 6 7 1 2 3
Almond
____________________
_______ _________
__ 1 2 3 4 5
6+ 1 2 3 4 5 6 7 1 2 3
Hemp
____________________
_______ _________
__ 1 2 3 4 5
6+ 1 2 3 4 5 6 7 1 2 3
Other
____________________
_______ _________
__ 1 2 3 4 5
6+ 1 2 3 4 5 6 7 1 2 3
Times per Cheese Brand/Type Amount (ounces) Day Week Month
Cheddar
____________________
_______ _______
___ 1 2 3 4 5
6+ 1 2 3 4 5 6 7 1 2 3
Mozzarella
____________________
_______ _______
___ 1 2 3 4 5
6+ 1 2 3 4 5 6 7 1 2 3
Parmesan
____________________
_______ _______
___ 1 2 3 4 5
6+ 1 2 3 4 5 6 7 1 2 3
American
____________________
_______ _______
___ 1 2 3 4 5
6+ 1 2 3 4 5 6 7 1 2 3
Swiss
____________________
_______ _______
___ 1 2 3 4 5
6+ 1 2 3 4 5 6 7 1 2 3
Cottage
____________________
_______ _______
___ 1 2 3 4 5
6+ 1 2 3 4 5 6 7 1 2 3
Cream
____________________
_______ _______
___ 1 2 3 4 5
6+ 1 2 3 4 5 6 7 1 2 3
______________
____________________
_______ _______
___ 1 2 3 4 5
6+ 1 2 3 4 5 6 7 1 2 3
______________
____________________
_______ _______
___ 1 2 3 4 5
6+ 1 2 3 4 5 6 7 1 2 3

88 Times per Yogurt Brand/Type Amount
(ounces) Day Week Month
Plain
____________________
_______ _______
___ 1 2 3 4 5
6+ 1 2 3 4 5 6 7 1 2 3
Flavored
____________________
_______ _______
___ 1 2 3 4 5
6+ 1 2 3 4 5 6 7 1 2 3
Soy
____________________
_______ _______
___ 1 2 3 4 5
6+ 1 2 3 4 5 6 7 1 2 3
Frozen
____________________
_______ _______
___ 1 2 3 4 5
6+ 1 2 3 4 5 6 7 1 2 3
______________
____________________
_______ _______
___ 1 2 3 4 5
6+ 1 2 3 4 5 6 7 1 2 3
Times per Ice Cream
Brand/Type Amount (cups) Day Week Month
Vanilla
____________________
_______ _______
___ 1 2 3 4 5
6+ 1 2 3 4 5 6 7 1 2 3
Flavored
____________________
_______ _______
___ 1 2 3 4 5
6+ 1 2 3 4 5 6 7 1 2 3
______________
____________________
_______ _______
___ 1 2 3 4 5
6+ 1 2 3 4 5 6 7 1 2 3
Times per Eggs Brand/Type Amount
(items) Day Week Month
______________
____________________
_______ _______
___ 1 2 3 4 5
6+ 1 2 3 4 5 6 7 1 2 3
______________
____________________
_______ _______
___ 1 2 3 4 5
6+ 1 2 3 4 5 6 7 1 2 3

89 Times per Other Brand/Type Amount
(ounces) Day Week Month
Sour Cream
____________________
_______ _______
___ 1 2 3 4 5
6+ 1 2 3 4 5 6 7 1 2 3
Cream in coffee
____________________
_______ _______
___ 1 2 3 4 5
6+ 1 2 3 4 5 6 7 1 2 3
Whipped cream
____________________
_______ _______
___ 1 2 3 4 5
6+ 1 2 3 4 5 6 7 1 2 3
Pudding
____________________
_______ _______
___ 1 2 3 4 5
6+ 1 2 3 4 5 6 7 1 2 3
______________
____________________
_______ _______
___ 1 2 3 4 5
6+ 1 2 3 4 5 6 7 1 2 3
______________
____________________
_______ _______
___ 1 2 3 4 5
6+ 1 2 3 4 5 6 7 1 2 3
Table and Cooking Fat
Times per Brand/Type Amount (ounces) Day Week Month
Butter for spreading
____________________
_______ _______
___ 1 2 3 4 5
6+ 1 2 3 4 5 6 7 1 2 3
Margarine for spreading
____________________
_______ _______
___ 1 2 3 4 5
6+ 1 2 3 4 5 6 7 1 2 3
Butter for cooking
____________________
_______ _______
___ 1 2 3 4 5
6+ 1 2 3 4 5 6 7 1 2 3
Margarine for cooking
____________________
_______ _______
___ 1 2 3 4 5
6+ 1 2 3 4 5 6 7 1 2 3
Other spread
____________________
_______ _______
___ 1 2 3 4 5
6+ 1 2 3 4 5 6 7 1 2 3
Olive oil
____________________
_______ _______
___ 1 2 3 4 5
6+ 1 2 3 4 5 6 7 1 2 3
Canola oil ____________________
__________
1 2 3 4 5 6+
1 2 3 4 5 6 7 1 2 3

90
Flax seed oil
____________________
_______ _______
___ 1 2 3 4 5
6+ 1 2 3 4 5 6 7 1 2 3
Other
____________________
_______ _______
___ 1 2 3 4 5
6+ 1 2 3 4 5 6 7 1 2 3
Salad dressing
____________________
_______ _______
___ 1 2 3 4 5
6+ 1 2 3 4 5 6 7 1 2 3
Mayonnaise
____________________
_______ _______
___ 1 2 3 4 5
6+ 1 2 3 4 5 6 7 1 2 3
Peanut Butter
____________________
_______ _______
___ 1 2 3 4 5
6+ 1 2 3 4 5 6 7 1 2 3
______________
____________________
_______ _______
___ 1 2 3 4 5
6+ 1 2 3 4 5 6 7 1 2 3
Meat and Poultry
Times per Brand/Type Amount (ounces) Day Week Month
Chicken
____________________
_______ _______
___ 1 2 3 4 5
6+ 1 2 3 4 5 6 7 1 2 3
Turkey
____________________
_______ _______
___ 1 2 3 4 5
6+ 1 2 3 4 5 6 7 1 2 3
Beef
____________________
_______ _______
___ 1 2 3 4 5
6+ 1 2 3 4 5 6 7 1 2 3
Pork
____________________
_______ _______
___ 1 2 3 4 5
6+ 1 2 3 4 5 6 7 1 2 3
Lamb
____________________
_______ _______
___ 1 2 3 4 5
6+ 1 2 3 4 5 6 7 1 2 3
Wild Game
____________________
_______ _______
___ 1 2 3 4 5
6+ 1 2 3 4 5 6 7 1 2 3
Hot dogs
____________________
_______ _______
___ 1 2 3 4 5
6+ 1 2 3 4 5 6 7 1 2 3
__________ _______

91 Sausage __________
_______ ___ 1 2 3 4 5
6+ 1 2 3 4 5 6 7
1 2 3
Lunch meat
____________________
_______ _______
___ 1 2 3 4 5
6+ 1 2 3 4 5 6 7 1 2 3
Bacon
____________________
_______ _______
___ 1 2 3 4 5
6+ 1 2 3 4 5 6 7 1 2 3
______________
____________________
_______ _______
___ 1 2 3 4 5
6+ 1 2 3 4 5 6 7 1 2 3
______________
____________________
_______ _______
___ 1 2 3 4 5
6+ 1 2 3 4 5 6 7 1 2 3
Fish and Shellfish
Times per Brand/Type Amount (ounces) Day Week Month
Canned tuna
____________________
_______ _______
___ 1 2 3 4 5
6+ 1 2 3 4 5 6 7 1 2 3
Fresh tuna
____________________
_______ _______
___ 1 2 3 4 5
6+ 1 2 3 4 5 6 7 1 2 3
Fatty fish
____________________
_______ _______
___ 1 2 3 4 5
6+ 1 2 3 4 5 6 7 1 2 3
Lean fish
____________________
_______ _______
___ 1 2 3 4 5
6+ 1 2 3 4 5 6 7 1 2 3
Sushi
____________________
_______ _______
___ 1 2 3 4 5
6+ 1 2 3 4 5 6 7 1 2 3
Locally caught fish
____________________
_______ _______
___ 1 2 3 4 5
6+ 1 2 3 4 5 6 7 1 2 3
Fish sticks
____________________
_______ _______
___ 1 2 3 4 5
6+ 1 2 3 4 5 6 7 1 2 3
Breaded fish sandwiches
____________________
_______ _______
___ 1 2 3 4 5
6+ 1 2 3 4 5 6 7 1 2 3
Shellfish ___________________
__________
1 2 3 4 5 6+
1 2 3 4 5 6 7 1 2 3

92
Vegetables Times per Brand/Type Amount
(cups) Day Week Month
Potatoes
____________________
_______ _______
___ 1 2 3 4 5
6+ 1 2 3 4 5 6 7 1 2 3
Leafy greens
____________________
_______ _______
___ 1 2 3 4 5
6+ 1 2 3 4 5 6 7 1 2 3
Orange vegetables
____________________
_______ _______
___ 1 2 3 4 5
6+ 1 2 3 4 5 6 7 1 2 3
Green Vegetables
____________________
_______ _______
___ 1 2 3 4 5
6+ 1 2 3 4 5 6 7 1 2 3
Beans
____________________
_______ _______
___ 1 2 3 4 5
6+ 1 2 3 4 5 6 7 1 2 3
Tofu
____________________
_______ _______
___ 1 2 3 4 5
6+ 1 2 3 4 5 6 7 1 2 3
Soybeans
____________________
_______ _______
___ 1 2 3 4 5
6+ 1 2 3 4 5 6 7 1 2 3
Salsa
____________________
_______ _______
___ 1 2 3 4 5
6+ 1 2 3 4 5 6 7 1 2 3
Tomato/pasta sauce
____________________
_______ _______
___ 1 2 3 4 5
6+ 1 2 3 4 5 6 7 1 2 3
Avocado
____________________
_______ _______
___ 1 2 3 4 5
6+ 1 2 3 4 5 6 7 1 2 3
Olives
____________________
_______ _______
___ 1 2 3 4 5
6+ 1 2 3 4 5 6 7 1 2 3

93
Fruit Times per Brand/Type Amount
(cups) Day Week Month
5 most common
____________________
_______ _______
___ 1 2 3 4 5
6+ 1 2 3 4 5 6 7 1 2 3
______________
____________________
_______ _______
___ 1 2 3 4 5
6+ 1 2 3 4 5 6 7 1 2 3
______________
____________________
_______ _______
___ 1 2 3 4 5
6+ 1 2 3 4 5 6 7 1 2 3
______________
____________________
_______ _______
___ 1 2 3 4 5
6+ 1 2 3 4 5 6 7 1 2 3
______________
____________________
_______ _______
___ 1 2 3 4 5
6+ 1 2 3 4 5 6 7 1 2 3
______________
____________________
_______ _______
___ 1 2 3 4 5
6+ 1 2 3 4 5 6 7 1 2 3
Grains
Times per Cereals Brand/Type Amount (cups) Day Week Month
Flax added
____________________
_______ _______
___ 1 2 3 4 5
6+ 1 2 3 4 5 6 7 1 2 3
Oatmeal
____________________
_______ _______
___ 1 2 3 4 5
6+ 1 2 3 4 5 6 7 1 2 3
Cream of Wheat
____________________
_______ _______
___ 1 2 3 4 5
6+ 1 2 3 4 5 6 7 1 2 3
Hot whole grain
____________________
_______ _______
___ 1 2 3 4 5
6+ 1 2 3 4 5 6 7 1 2 3
Breakfast cereal
____________________
_______ _______
___ 1 2 3 4 5
6+ 1 2 3 4 5 6 7 1 2 3
Rice
____________________
_______ _______
___ 1 2 3 4 5
6+ 1 2 3 4 5 6 7 1 2 3

94
Pasta
____________________
_______ _______
___ 1 2 3 4 5
6+ 1 2 3 4 5 6 7 1 2 3
Quinoa
____________________
_______ _______
___ 1 2 3 4 5
6+ 1 2 3 4 5 6 7 1 2 3
Couscous
____________________
_______ _______
___ 1 2 3 4 5
6+ 1 2 3 4 5 6 7 1 2 3
Flax
____________________
_______ _______
___ 1 2 3 4 5
6+ 1 2 3 4 5 6 7 1 2 3
Other___
____________________
_______ _______
___ 1 2 3 4 5
6+ 1 2 3 4 5 6 7 1 2 3
Times per Breads Brand/Type Amount (items) Day Week Month
Wheat bread
____________________
_______ _______
___ 1 2 3 4 5
6+ 1 2 3 4 5 6 7 1 2 3
White bread
____________________
_______ _______
___ 1 2 3 4 5
6+ 1 2 3 4 5 6 7 1 2 3
English Muffins
____________________
_______ _______
___ 1 2 3 4 5
6+ 1 2 3 4 5 6 7 1 2 3
Bagels
____________________
_______ _______
___ 1 2 3 4 5
6+ 1 2 3 4 5 6 7 1 2 3
Buns or rolls
____________________
_______ _______
___ 1 2 3 4 5
6+ 1 2 3 4 5 6 7 1 2 3
Tortillas
____________________
_______ _______
___ 1 2 3 4 5
6+ 1 2 3 4 5 6 7 1 2 3
______________
____________________
_______ _______
___ 1 2 3 4 5
6+ 1 2 3 4 5 6 7 1 2 3
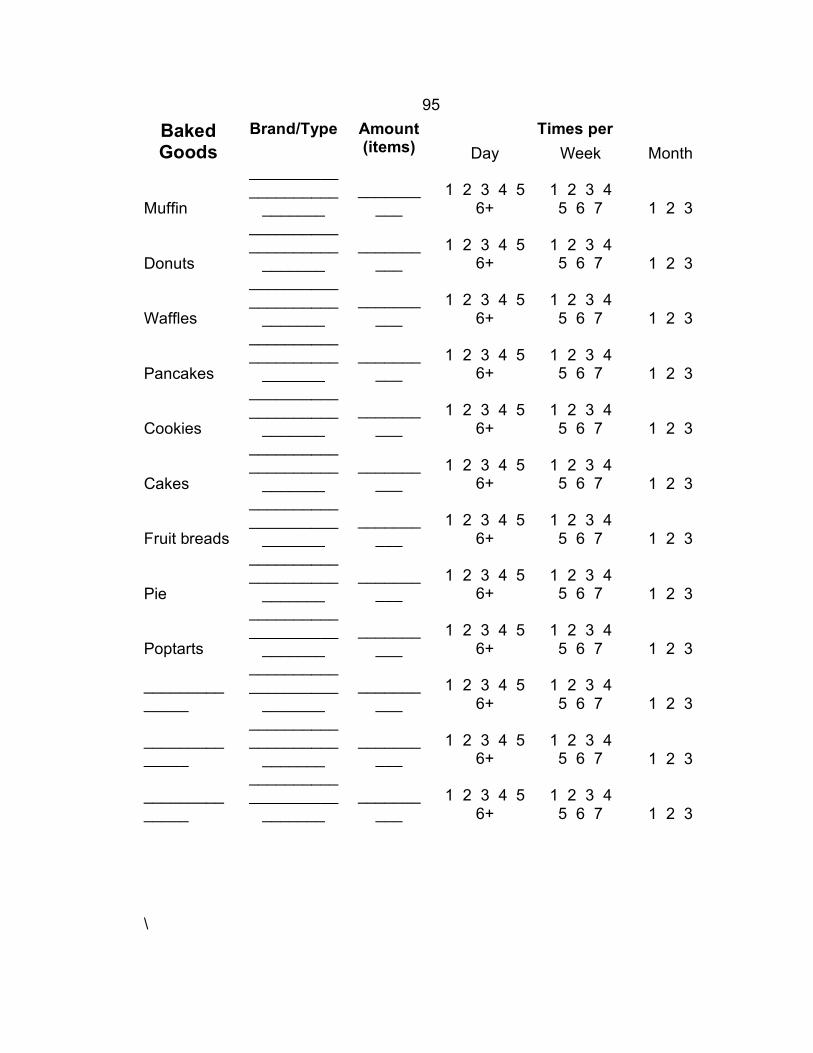
95 Times per Baked
Goods Brand/Type Amount
(items) Day Week Month
Muffin
____________________
_______ _______
___ 1 2 3 4 5
6+ 1 2 3 4 5 6 7 1 2 3
Donuts
____________________
_______ _______
___ 1 2 3 4 5
6+ 1 2 3 4 5 6 7 1 2 3
Waffles
____________________
_______ _______
___ 1 2 3 4 5
6+ 1 2 3 4 5 6 7 1 2 3
Pancakes
____________________
_______ _______
___ 1 2 3 4 5
6+ 1 2 3 4 5 6 7 1 2 3
Cookies
____________________
_______ _______
___ 1 2 3 4 5
6+ 1 2 3 4 5 6 7 1 2 3
Cakes
____________________
_______ _______
___ 1 2 3 4 5
6+ 1 2 3 4 5 6 7 1 2 3
Fruit breads
____________________
_______ _______
___ 1 2 3 4 5
6+ 1 2 3 4 5 6 7 1 2 3
Pie
____________________
_______ _______
___ 1 2 3 4 5
6+ 1 2 3 4 5 6 7 1 2 3
Poptarts
____________________
_______ _______
___ 1 2 3 4 5
6+ 1 2 3 4 5 6 7 1 2 3
______________
____________________
_______ _______
___ 1 2 3 4 5
6+ 1 2 3 4 5 6 7 1 2 3
______________
____________________
_______ _______
___ 1 2 3 4 5
6+ 1 2 3 4 5 6 7 1 2 3
______________
____________________
_______ _______
___ 1 2 3 4 5
6+ 1 2 3 4 5 6 7 1 2 3
\

96 Times per Snacks Brand/Type Amount
(ounces) Day Week Month
Crackers
____________________
_______ _______
___ 1 2 3 4 5
6+ 1 2 3 4 5 6 7 1 2 3
Pretzels
____________________
_______ _______
___ 1 2 3 4 5
6+ 1 2 3 4 5 6 7 1 2 3
Potato Chips
____________________
_______ _______
___ 1 2 3 4 5
6+ 1 2 3 4 5 6 7 1 2 3
Corn Chips
____________________
_______ _______
___ 1 2 3 4 5
6+ 1 2 3 4 5 6 7 1 2 3
Popcorn
____________________
_______ _______
___ 1 2 3 4 5
6+ 1 2 3 4 5 6 7 1 2 3
Granola bars
____________________
_______ _______
___ 1 2 3 4 5
6+ 1 2 3 4 5 6 7 1 2 3
Energy bars
____________________
_______ _______
___ 1 2 3 4 5
6+ 1 2 3 4 5 6 7 1 2 3
Almonds
____________________
_______ _______
___ 1 2 3 4 5
6+ 1 2 3 4 5 6 7 1 2 3
Nuts
____________________
_______ _______
___ 1 2 3 4 5
6+ 1 2 3 4 5 6 7 1 2 3
Seeds
____________________
_______ _______
___ 1 2 3 4 5
6+ 1 2 3 4 5 6 7 1 2 3
Graham crackers
____________________
_______ _______
___ 1 2 3 4 5
6+ 1 2 3 4 5 6 7 1 2 3
Candy
____________________
_______ _______
___ 1 2 3 4 5
6+ 1 2 3 4 5 6 7 1 2 3
______________
____________________
_______ _______
___ 1 2 3 4 5
6+ 1 2 3 4 5 6 7 1 2 3
______________
____________________
_______ _______
___ 1 2 3 4 5
6+ 1 2 3 4 5 6 7 1 2 3

97
Mixed/Prepared Foods Times per Brand/Type Amount
Day Week Month
Lasagna
____________________
_______ _______
___ 1 2 3 4 5
6+ 1 2 3 4 5 6 7 1 2 3
Macaroni and Cheese
____________________
_______ _______
___ 1 2 3 4 5
6+ 1 2 3 4 5 6 7 1 2 3
Hamburger helper
____________________
_______ _______
___ 1 2 3 4 5
6+ 1 2 3 4 5 6 7 1 2 3
Frozen dinners
____________________
_______ _______
___ 1 2 3 4 5
6+ 1 2 3 4 5 6 7 1 2 3
Tacos
____________________
_______ _______
___ 1 2 3 4 5
6+ 1 2 3 4 5 6 7 1 2 3
Burritos
____________________
_______ _______
___ 1 2 3 4 5
6+ 1 2 3 4 5 6 7 1 2 3
Pizza
____________________
_______ _______
___ 1 2 3 4 5
6+ 1 2 3 4 5 6 7 1 2 3
Stir-fry
____________________
_______ _______
___ 1 2 3 4 5
6+ 1 2 3 4 5 6 7 1 2 3
Soup
____________________
_______ _______
___ 1 2 3 4 5
6+ 1 2 3 4 5 6 7 1 2 3
Casseroles
____________________
_______ _______
___ 1 2 3 4 5
6+ 1 2 3 4 5 6 7 1 2 3
Rice-a-roni
____________________
_______ _______
___ 1 2 3 4 5
6+ 1 2 3 4 5 6 7 1 2 3
______________
____________________
_______ _______
___ 1 2 3 4 5
6+ 1 2 3 4 5 6 7 1 2 3

98
Beverages Times per Brand/Type Amount
(ounces) Day Week Month
Orange juice
____________________
_______ _______
___ 1 2 3 4 5
6+ 1 2 3 4 5 6 7 1 2 3
Other 100% fruit juice
____________________
_______ _______
___ 1 2 3 4 5
6+ 1 2 3 4 5 6 7 1 2 3
Sweetened juice
____________________
_______ _______
___ 1 2 3 4 5
6+ 1 2 3 4 5 6 7 1 2 3
Vegetable juice
____________________
_______ _______
___ 1 2 3 4 5
6+ 1 2 3 4 5 6 7 1 2 3
Soda
____________________
_______ _______
___ 1 2 3 4 5
6+ 1 2 3 4 5 6 7 1 2 3
Tea
____________________
_______ _______
___ 1 2 3 4 5
6+ 1 2 3 4 5 6 7 1 2 3
Coffee
____________________
_______ _______
___ 1 2 3 4 5
6+ 1 2 3 4 5 6 7 1 2 3
Instant breakfast
____________________
_______ _______
___ 1 2 3 4 5
6+ 1 2 3 4 5 6 7 1 2 3
Slim fast
____________________
_______ _______
___ 1 2 3 4 5
6+ 1 2 3 4 5 6 7 1 2 3
Ensure
____________________
_______ _______
___ 1 2 3 4 5
6+ 1 2 3 4 5 6 7 1 2 3
Sports drinks
____________________
_______ _______
___ 1 2 3 4 5
6+ 1 2 3 4 5 6 7 1 2 3
Flavored water
____________________
_______ _______
___ 1 2 3 4 5
6+ 1 2 3 4 5 6 7 1 2 3
______________
____________________
_______ _______
___ 1 2 3 4 5
6+ 1 2 3 4 5 6 7 1 2 3
______________
____________________
_______ _______
___ 1 2 3 4 5
6+ 1 2 3 4 5 6 7 1 2 3

99 How often do you eat fast food?
Brand/Type Times per Day Week Month
______________________________________________
___________________ 1 2 3 1 2 3 4 5 6
7 1 2 3 ______________________________________________
___________________ 1 2 3 1 2 3 4 5 6
7 1 2 3 ______________________________________________
___________________ 1 2 3 1 2 3 4 5 6
7 1 2 3 ______________________________________________
___________________ 1 2 3 1 2 3 4 5 6
7 1 2 3 Please list other foods that you have eaten in the last month that you have not been asked about.
Please list and vitamins and supplements that you are taking.
Brand/Type Times per Day Week Month
___________________________________________________________________ 1 2 3
1 2 3 4 5 6 7 1 2 3
___________________________________________________________________ 1 2 3
1 2 3 4 5 6 7 1 2 3
___________________________________________________________________ 1 2 3
1 2 3 4 5 6 7 1 2 3
___________________________________________________________________ 1 2 3
1 2 3 4 5 6 7 1 2 3
Brand/Type Times per Day Week Month
________________________________________________ 1 2 3
1 2 3 4 5 6 7 1 2 3

100 Are there foods that you commonly ate before you became pregnant that you do not eat now?
Brand/Type Reasons for not eating
__________________________________________________________________
_ __________________________________________________________________
_

101
APPENDIX F
POST-PARTUM SURVEY

102
Thank you for your participation in the Blossom Project. Please take the time to complete this short questionnaire and return in the attached self addressed stamped envelope.
Birth Outcome Questionnaire
Date Survey Completed: ____________________________ At the end of your pregnancy you were considered: □ High risk □ Low risk □ No risk
Why were you considered “at risk”?
How many weeks pregnant were you when you had your baby? □ 35 weeks □ 36 weeks □ 37 weeks □ 38 weeks □ 39 weeks □ 40 weeks □ More than 40 weeks Other:____________________________ Due Date Birth Date of Baby Sex of Baby (circle one)
Female Male
Birth Weight lb. oz. Head Circumference Length APGAR score (1 minute) (5minutes) Your weight prior to Labor lbs Did you exercise during your first trimester? Yes No If yes, how often?

103 □ 1/week □ 2-3/week □ 3-4/week □ 4+/week On average, how long were your bouts of exercise? □ Less than 30 minutes □ 30-45 minutes □ 45-60 minutes □ More than 60 minutes Did you exercise less than you expected/desired during the first trimester? Yes No If yes check as many of the following reasons that apply: □ Moring sickness □ Fatigue □ Time limitations □ Abdominal discomfort □ Physician recommendations □ Other: What types of exercises did you favor the most during the first trimester? □ Walking □ Running □ Biking □ Swimming □ Yoga □ Other: Did you exercise during your second trimester? Yes No If yes, how often?

104 □ 1/week □ 2-3/week □ 3-4/week □ 4+/week On average, how long were your bouts of exercise? □ Less than 30 minutes □ 30-45 minutes □ 45-60 minutes □ More than 60 minutes Did you exercise less than you expected/desired during the second trimester? Yes No If yes check as many of the following reasons that apply: □ Moring sickness □ Fatigue □ Time limitations □ Abdominal discomfort □ Physician recommendations □ Other: What types of exercises did you favor the most during the second trimester? □ Walking □ Running □ Biking □ Swimming □ Yoga □ Other:
Did you exercise during your third trimester? Yes No If yes, how often?

105 □ 1/week □ 2-3/week □ 3-4/week □ 4+/week How long were your bouts of exercise? □ Less than 30 minutes □ 30-45 minutes □ 45-60 minutes □ More than 60 minutes Did you exercise less than you expected/desired during the third trimester? Yes No If yes check as many of the following reasons that apply: □ Moring sickness □ Fatigue □ Time limitations □ Abdominal discomfort □ Physician recommendations □ Other:
What types of exercises did you favor the most during the third trimester? □ Walking □ Running □ Biking □ Swimming □ Yoga □ Other: Did you stop exercising before the birth of your baby? Yes No If yes, circle the number of weeks prior to birth 1 2 3 4 5 6 7 8 9 Reason(s) why you stopped exercising?
Length of active labor (at least 4cm dilated pushing and contractions) (hrs, min) Did you experience any complications during labor? Yes No If yes, what where your complications □ Breech □ Epidural □ Induction
Type of delivery Vaginal Cesarean

106 □ Cesarean □ Stalled labor after 4cm dilation □ Difficulty pushing Did you use any pain medications during labor? Yes No If yes, what type?
□ Epidural □ Narcotics (circle any that apply: Demerol, Nubain, or Stadol) □ Local Blocks □ Other □ Not sure Did you have your labor induced? Yes No If yes: □ Pitocin □ “Broke your water” Did your medical provider immediately clamp the umbilical cord? Yes No Unknown Will/are you breastfeeding? Yes No If yes, did you have difficulty beginning breastfeeding? Yes No Why? Are you using infant formula? Yes No If yes, why? If yes what brand? Did you take any supplements during pregnancy? Yes No If yes, what kind? □ Prenatal vitamin (Specify Brand): □ Herbal supplements □ Other Did you consume fish during your pregnancy? Yes No If yes, check average serving frequency that applies: □ 1/week □ 2/week □ 3/week □ Other (Specify amount per/week):

107 What type of fish did you consume during pregnancy: □ Tuna □ Albacore □ Cod □ Salmon □ Trout □ Other (Specify type): If you chose not to consume fish during your pregnancy check any reasons that may apply: □ I don’t like fish □ I couldn’t eat the fish due to nausea □ Mercury contamination concerns □ Food Safety issues (food poisoning) □ Costs too much money □ Other (Specify type): Did you consume any of the following foods during pregnancy? □ Soy milk fortified with DHA/Omega-3 □ Eggs fortified with Omega-3s

108
APPENDIX G
LIST OF ENDANGERED SPECIES

109
Threatened and Endangered Species listed in the U.S. Fish and Wildlife Service
Last updated: May 3, 2009 (US Fish & Wildlife Service, 2009)
• T = Threatened; E = Endangered
Inverted Common Name Listing Status Catfish, Yaqui T Cavefish, Alabama E Cavefish, Ozark T Chub, bonytail E Chub, Borax Lake E Chub, Chihuahua T Chub, Gila E Chub, humpback E Chub, Hutton tui T Chub, Mohave tui E Chub, Oregon E Chub, Owens tui E Chub, Pahranagat roundtail E Chub, slender T Chub, Sonora T Chub, spotfin T Chub, Virgin River E Chub, Yaqui E Cui-ui E Dace, Ash Meadows speckled E Dace, blackside T Dace, Clover Valley speckled E Dace, desert T Dace, Foskett speckled T Dace, Independence Valley speckled E Dace, Kendall Warm Springs E Dace, Moapa E Darter, amber E Darter, bayou T Darter, bluemask (=jewel) E Darter, boulder E Darter, Cherokee T

110 Inverted Common Name Listing Status
Darter, duskytail E Darter, Etowah E Darter, fountain E Darter, goldline T Darter, leopard T Darter, Maryland E Darter, Niangua T Darter, Okaloosa E Darter, relict E Darter, slackwater T Darter, snail T Darter, vermilion E Darter, watercress E Gambusia, Big Bend E Gambusia, Clear Creek E Gambusia, Pecos E Gambusia, San Marcos E Goby, tidewater E Logperch, Conasauga E Logperch, Roanoke E Madtom, Neosho T Madtom, pygmy E Madtom, Scioto E Madtom, smoky E Madtom, yellowfin T Minnow, Devils River T Minnow, loach T Minnow, Rio Grande silvery E Pikeminnow (=squawfish), Colorado E Poolfish, Pahrump E Pupfish, Ash Meadows Amargosa E Pupfish, Comanche Springs E Pupfish, desert E Pupfish, Devils Hole E Pupfish, Leon Springs E Pupfish, Owens E Pupfish, Warm Springs E Salmon, Atlantic E Salmon, Chinook T Salmon, chum T
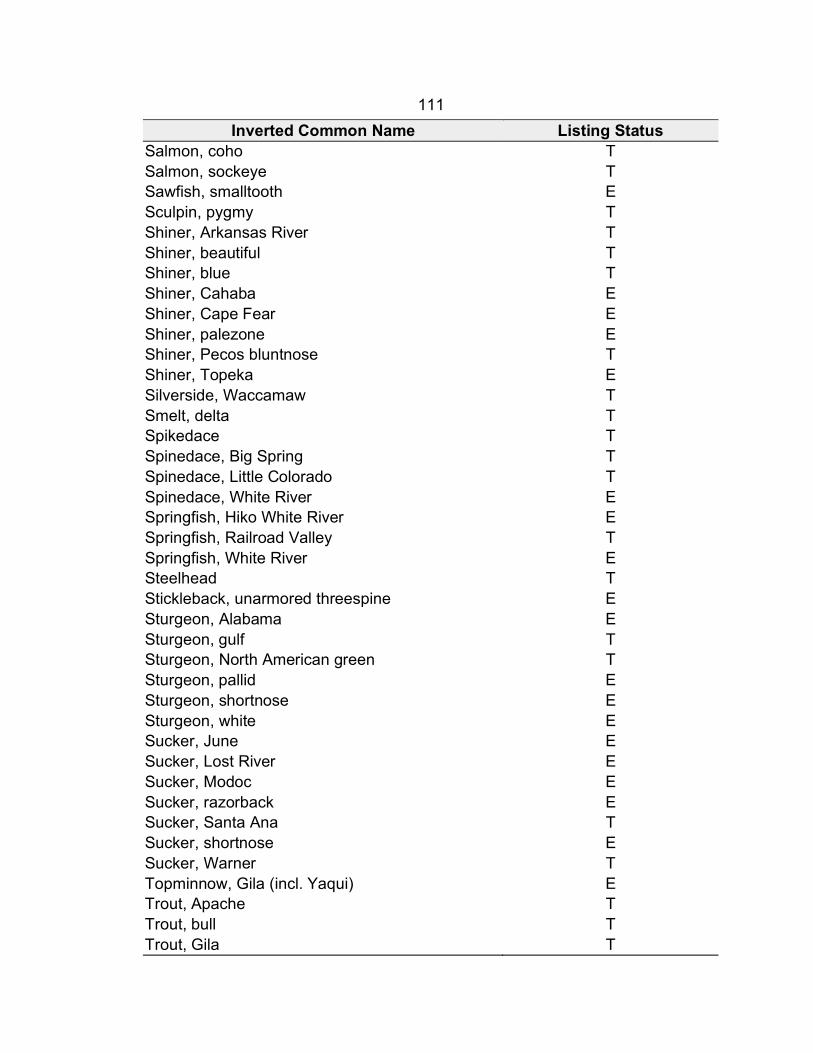
111 Inverted Common Name Listing Status
Salmon, coho T Salmon, sockeye T Sawfish, smalltooth E Sculpin, pygmy T Shiner, Arkansas River T Shiner, beautiful T Shiner, blue T Shiner, Cahaba E Shiner, Cape Fear E Shiner, palezone E Shiner, Pecos bluntnose T Shiner, Topeka E Silverside, Waccamaw T Smelt, delta T Spikedace T Spinedace, Big Spring T Spinedace, Little Colorado T Spinedace, White River E Springfish, Hiko White River E Springfish, Railroad Valley T Springfish, White River E Steelhead T Stickleback, unarmored threespine E Sturgeon, Alabama E Sturgeon, gulf T Sturgeon, North American green T Sturgeon, pallid E Sturgeon, shortnose E Sturgeon, white E Sucker, June E Sucker, Lost River E Sucker, Modoc E Sucker, razorback E Sucker, Santa Ana T Sucker, shortnose E Sucker, Warner T Topminnow, Gila (incl. Yaqui) E Trout, Apache T Trout, bull T Trout, Gila T

112 Inverted Common Name Listing Status
Trout, greenback cutthroat T Trout, Little Kern golden T Trout, Paiute cutthroat T

113
APPENDIX H
PARTICIPANT ADHERENCE TO THE PROJECT

114
Participant Adherence to the Project n = number of participants nd = number of participants participating in 3-day diet record nf = number of participants participating in food frequency questionnaire interview nb = number of participant participating in blood draw Recruited n = 41 n = 2 (lack of commitment and miscarriage) Week 18 3-day diet records nd = 39/39 FFQ interview nf = 34/34 Blood Draw nb = 38/38 nf = +2 nb = +1 nd,f = 2 (loss of interest and unavailable) Week 28 3-day diet records nd = 37/39 FFQ interview nf = 33/35 Blood Draw nb = 37/39 nf = +1 nd,f,b = 2 (relocation, preterm labor) Week 35 nf = 1 (lost FFQ data) 3-day diet records nd = 35/39 nb = 1 (scheduling conflict) FFQ interview nf = 32/35 Blood Draw nb = 36/39 Delivery Post-partum Survey n = 36 Cord Blood Samples n = 36


![Computational Analyses of Docosahexaenoic Acid (DHA, C22 ...Sequence-based computational methods, namely FoldAmyloid 28], AGGRESCAN [ 29][, and ProA 30][, were used to predict the](https://img.dokumen.tips/doc/110x75/604d6e594dcdd021347b922a/computational-analyses-of-docosahexaenoic-acid-dha-c22-sequence-based-computational.jpg)