Embed Size (px)
Citation preview

DID CRYPTERONIACEAE REALLY DISPERSE OUT OF INDIA? MOLECULAR DATINGEVIDENCE FROM rbcL, ndhF, AND rpl16 INTRON SEQUENCES
Frank Rutschmann,1,* Torsten Eriksson,y Jurg Schonenberger,z and Elena Conti*
*Institute of Systematic Botany, University of Zurich, Zollikerstrasse 107, CH-8008 Zurich, Switzerland; yBergius Foundation, Royal SwedishAcademy of Sciences, SE-104 05 Stockholm, Sweden; and zDepartment of Botany, Stockholm University, Lilla Frescativagen 5,
SE-106 91 Stockholm, Sweden
Biogeographical and paleontological studies indicated that some ancient Gondwanan taxa have been carriedby the rafting Indian plate from Gondwana to Asia. During this journey, the Indian island experienceddramatic latitudinal and climatic changes that caused massive extinctions in its biota. However, some taxasurvived these conditions and dispersed ‘‘out of India’’ into South and Southeast Asia, after India collided withthe Asian continent in the Early Tertiary. To test this hypothesis, independent estimates for lineage ages areneeded. A published rbcL tree supported the sister group relationship between the South and Southeast AsianCrypteroniaceae (comprising Crypteronia, Axinandra, and Dactylocladus) and a clade formed by the AfricanOliniaceae, Penaeaceae, and Rhynchocalycaceae and the Central and South American Alzateaceae. Moleculardating estimates indicated that Crypteroniaceae split from their West Gondwanan sister clade in the Early toMiddle Cretaceous and reached Asia by rafting on the Indian plate. Here we present molecular evidence fromadditional chloroplast DNA regions and more taxa to test the validity of the out-of-India hypothesis forCrypteroniaceae. Both clock-based (Langley-Fitch) and clock-independent age estimates (nonparametric ratesmoothing and penalized likelihood) based on maximum likelihood analyses of three chloroplast DNA regions(rbcL, ndhF, and rpl16 intron) were used to infer the age of Crypteroniaceae. Our dating results indicate anancient Gondwanan origin of Crypteroniaceae in the Early to Middle Cretaceous, followed by diversificationon the Indian plate in the Early Tertiary and subsequent dispersal to Southeast Asia. These findings arecongruent with recent molecular, paleontological, and biogeographic results in vertebrates. Within thebiogeographic context of this study, we explore the critical assignment of paleobotanic and geologicconstraints to calibrate ultrametric trees.
Keywords: molecular dating, molecular clock, r8s, rates of substitution, penalized likelihood, NPRS, clockcalibration, biogeography, Gondwana, vicariance, Crypteroniaceae, Myrtales.
Introduction
Crypteroniaceae sensu stricto (Myrtales; Candolle 1857)are a small group of evergreen tropical shrubs and trees com-prising three genera: Crypteronia Bl., with seven species, isthe genus with the broadest distribution in Southeast Asia,including the Malay Peninsula, Sumatra, Java, Borneo, Philip-pines, Thailand, Vietnam, Myanmar, and New Guinea;Dactylocladus Oliv. has only one species, Dactylocladusstenostachys, endemic to Borneo; Axinandra Thw. includesone species, Axinandra zeylanica, endemic to Sri Lanka, andthree other species with restricted distribution in the Malaypeninsula and the northern part of Borneo (van Beusekom-Osinga and van Beusekom 1975; Johnson and Briggs 1984;Pereira and Wong 1995; Conti et al. 2002; fig. 1).
Southeast Asia and Sri Lanka are among the taxonomicallymost diverse regions on earth. In addition, they harbor highproportions of endemic species. For these reasons, both areashave been included among the 25 hot spots of biological di-versity identified in a recent worldwide survey (Myers et al.
2000). This remarkable species richness can be partially ex-plained by the geologic history of Sri Lanka and SoutheastAsia. The uplift of the Himalayan chain caused by the colli-sion of the Deccan plate (comprising India, Sri Lanka, and theSeychelles) with Laurasia during the Eocene (between 55 and40 million years ago [mya]) and the generalized Late Tertiaryaridification (Partridge 1997; Willis and McElwain 2002) ledto an impoverishment of the tropical biome in Asia. Pocketsof this biome, however, survived in refugial areas character-ized by constant, tropical conditions, for example, in SriLanka and Southeast Asia. Only in these refugial areas didtropical plants have a chance to survive the detrimental effectsof Quaternary climate oscillations on the Indian subcontinent(Raven and Axelrod 1974). The relictual nature of the South-east Asian flora is also reflected in the great concentration ofearly diverging angiosperm clades in the fossil records of thesubtropical forests of Asia-Australasia (Morley 2001).
Crypteroniaceae had been proposed as being an ancient andrelictual group on the basis of their distribution and morphol-ogy (van Vliet and Baas 1975; van Beusekom-Osinga 1977).They represent an interesting case study to investigate the rela-tive contributions of Laurasian and Gondwanan elements tothe South Asian flora because their members had been alterna-tively suggested as being of Laurasian or Gondwanan origin.
1 Author for correspondence; e-mail [email protected].
Manuscript received April 2003; revised manuscript received November 2003.
Int. J. Plant Sci. 165(4 Suppl.):S000–S000. 2004.
� 2004 by The University of Chicago. All rights reserved.
1058-5893/2004/1650S4-0006$15.00

For example, Meijer (1972) postulated a Gondwanan originfor Axinandra, a genus that he interpreted as being morpho-logically similar to the ancestor of the entire order Myrtales.Furthermore, Ashton and Gunatilleke (1987, p. 263), refer-ring to the biogeographic history of Axinandra, stated: ‘‘Thedisjunct distribution and generalized morphology of this low-land rain forest genus suggest considerable antiquity and pos-sible spread into Asia by way of the Deccan Plate.’’ The sameauthors suggested that Axinandra and other taxa were carriedby the rafting Indian plate from Gondwana to Laurasia. AfterIndia collided with the Asian continent in the Early Tertiary,a few surviving Gondwanan elements dispersed ‘‘out of India’’into South and Southeast Asia, which at the time lay in thesame latitudinal and climatic zone (Morley 2000). The out-of-India origin of Crypteroniaceae was also supported in recentbiogeographic studies based on molecular dating estimates(Conti et al. 2002; Morley and Dick 2003).
The idea that splitting plates may carry biotic elementsfrom one continent to the other had already been proposedby Axelrod (1971) and McKenna (1973). However, Ravenand Axelrod (1974) noted that it is difficult to find evidencefor out-of-India dispersal because of the dramatic latitudinaland climatic changes that affected the Deccan plate during itsjourney from Gondwana to Laurasia and the ensuing massiveextinctions in its biota. The same authors suggested a Laur-asian origin for Crypteroniaceae (Raven and Axelrod 1974).Recent molecular phylogenetic analyses of rbcL sequences inMyrtales (Conti et al. 2002) supported that Crypteroniaceaeform a monophyletic group comprising Axinandra, Dactylo-cladus, and Crypteronia and identified a sister clade compris-ing (1) Penaeaceae, a small group of 23 species in sevengenera endemic to the Cape Province of South Africa; (2)Oliniaceae, comprising a single genus with eight species re-stricted to Eastern and Southern Africa; (3) Rhynchocalyca-ceae, with the single speciesRhynchocalyx lawsonioides, a rare,evergreen tree endemic to the Eastern Cape and KwaZulu-Natal in South Africa (Johnson and Briggs 1984); and (4)
Alzateaceae, with the single species Alzatea verticillata, a treerestricted to the submontane tropical forests of Bolivia, Peru,Panama, and Costa Rica (Graham 1984).
To investigate the biogeographic history of Crypteronia-ceae, Conti et al. (2002) inferred the age of Crypteroniaceaeby using three different molecular dating approaches appliedto rbcL sequences. Because both phylogenetic relationshipsand dating estimates of relevant nodes were concordant withthe geologic history of the Deccan Plate in relation to WestGondwanan continents, the authors suggested a West Gond-wanan origin for Crypteroniaceae and related families, withsubsequent dispersal of Crypteroniaceae to the Asian conti-nent via India. However, these conclusions were based onevidence from only one gene (rbcL) and limited taxon sam-pling from Crypteroniaceae and related families.
In this article, we test the validity of previous conclusionson the out-of-India origin of Crypteroniaceae by expandingthe taxon sampling to include four out of 12 described speciesof Crypteroniaceae and 13 out of 33 described species of theirsister clade. Furthermore, we perform our analyses on DNAsequences of three chloroplast regions (rbcL, ndhF, rpl16 in-tron) and a combined data set, compare the results of clock-dependent (Langley-Fitch [LF], Langley and Fitch 1974) andclock-independent molecular dating methods (nonparametricrate smoothing [NPRS], Sanderson 1997; penalized likeli-hood [PL], Sanderson 2002), and evaluate the level of errorin our divergence time estimates by implementing a bootstrapapproach (Baldwin and Sanderson 1998; Sanderson andDoyle 2001). We also discuss how problems of calibration inmolecular dating analyses affect different conclusions on pos-sible biogeographic scenarios for our study system.
Material and Methods
Plant Material and DNA Extractions
For Crypteronia paniculata, Crypteronia griffithii, Axinan-dra zeylanica, Dactylocladus stenostachys, and Olinia emar-ginata, we extracted total genomic DNA from silica-driedleaf material. Leaf tissue was homogenized using glass beadsand a MM 2000 shaker (Retsch GmbH, Haan, Germany).The DNA from these species was extracted with a methoddescribed in protocol D of Smith et al. (1991), which em-ploys a 2% hexadecyl-trimethylammonium bromide (CTAB)extraction/lysis buffer. For all other taxa, the method ofDNA extraction is given in Schonenberger and Conti (2003).Taxon names, voucher information, and GenBank accessionnumbers are listed in table 1.
PCR and DNA Sequencing
Amplification and sequencing primers from Zurawski et al.(1981), Olmstead and Sweere (1994), and Baum et al. (1998)were used to generate DNA sequences of rbcL, ndhF, andthe rpl16 intron, respectively. PCR amplifications were per-formed in a Biometra TGradient thermocycler, applyinga thermal cycling program that consisted of 34 cycles of 0.5min at 95�C, 1 min at 49�C–52�C, and 1.7 min at 72�C, fol-lowed by a terminal extension of 10 min at 72�C. In order tosuccessfully detect amplified DNA target regions and possible
Fig. 1 Current distribution of Crypteroniaceae and related taxa.
Cry ¼ Crypteroniaceae, Alz ¼ Alzateaceae, Pen ¼ Penaeaceae, Oli ¼Oliniaceae, Rhy ¼ Rhynchocalycaceae.
INTERNATIONAL JOURNAL OF PLANT SCIENCES

contamination, PCR products were separated on 1% agarosegels, stained with ethidium bromide, and visualized underUV light. Successfully amplified PCR products were purifiedwith the QIAquick PCR Purification Kit (QIAGEN, Basel,Switzerland). Cycle-sequencing reactions were performed us-ing the ABI PRISM Dye Terminator Cycle Sequencing ReadyReaction Kit (Applied Biosystems, Applera Europe B.V.,Rotkreuz, Switzerland). For a few taxa, we were unable toamplify the entire rpl16 intron; in these cases, two additionalinternal primers, MF and MR, were used (Schonenbergerand Conti 2003). Cycle-sequencing reactions were performedin a GeneAmp PCR System 9700 (Applied Biosystems) by us-ing a temperature cycle of 10 s at 96�C, 5 s at 50�C, and4 min at 60�C (25 cycles). The sequencing fragments werecleaned with MicroSpin G-50 columns (Amersham Pharma-cia Biotech Europe GMBH, Dubendorf, Switzerland) to re-move excess dye terminators before loading them on an ABIPrism 3100 genetic analyzer (Applied Biosystems).
The software Sequencher 3.1.1 (Gene Codes, Ann Arbor,Mich.) was used to edit and assemble complementarystrands. Base positions were individually double-checked foragreement between the complementary strands. The rbcL se-quences were readily aligned by eye, while ndhF and rpl16
intron sequences were first aligned using Clustal X 1.81(Thompson et al. 1997) prior to adjusting the alignments byeye in the software MacClade 4.0 (Maddison and Maddison2000). For the rpl16 intron data set, the variable region be-tween nucleotides 810 and 1031 was deleted because wewere unable to produce a reasonable alignment within thatregion. The data sets used for further phylogenetic analysescontained 24 taxa and 1280 (rbcL), 981 (ndhF), 1010 (rpl16intron), and 3271 (all three data sets combined) aligned posi-tions.
Phylogenetic Analyses
Maximum likelihood (ML) optimization was used to findthe best tree for each of the three separate data partitionsand for the combined data matrix, including all characters. Aneighbor-joining tree calculated under the JC69 substitutionmodel (Jukes and Cantor 1969) was used as the starting treeto estimate the optimal ML parameters under 56 differentmodels of evolution in Modeltest 3.06 (Posada and Crandall1998). The best substitution model was selected by perform-ing hierarchical likelihood ratio tests (Felsenstein 1981; Huel-senbeck and Rannala 1997). The estimated parameters were
Table 1
Species Names, Sources, and GenBank Accession Numbers of the DNA Sequences Used in the Analyses
GenBank accession numbers
Taxon Voucher rbcL ndhF rpl16 intron
Alzatea verticillata Ruiz & Pavona,b,c . . . U26316b AF215591c AY151598a
Axinandra zeylanica Thwaites Peter Ashton, s.n., Sri Lanka AY078157d AJ605094 AJ605107
Brachysiphon acutus (Thunb.) A. Juss. J. Schonenberger 365 (Z), (BOL) AJ605084 AJ605095 AY151605a
Brachysiphon fucatus (L.) Gilg J. Schonenberger 357 (Z), (BOL) AJ605085 AJ605096 AY151606a
Brachysiphon microphyllus Rourke J. Schonenberger 386 (Z), (BOL) AJ605086 AJ605097 AY151608a
Crypteronia griffithii C.B. Clarke Shawn Lum s.n., Singapore AJ605087 AJ605098 AJ605108
Crypteronia paniculata Blume Peter Ashton s.n., Brunei AY078153d AJ605099 AY151597a
Dactylocladus stenostachys Oliver Peter Becker, s.n., Brunei AY078156d AJ605100 AJ605109Endonema retzioides A. Juss J. Schonenberger 370 (Z), (BOL) AJ605088 AJ605101 AY151611a
Eugenia uniflora L.c . . . AF294255c AF215592c AF215627c
Medinilla humbertiana Gaudich.c . . . AF215517c AF215557c AF215602c
Mouriri helleri Aubletc,e . . . AF270752c AF322230e AF215611c
Myrtus communis L.c . . . AF294254c AF215593c AF215628c
Olinia emarginata Davy J. Schonenberger 579, cultivated,
Kirstenbosch Botanical Garden, (Z)
AJ605089 AJ605102 AY151601a
Olinia ventosa (L.) Cuf.a,c . . . AF215546c AF215594c AY151604a
Osbeckia chinensis L.c . . . AF215525c AF215570c AF210378c
Penaea mucronata L.a,d,c . . . AJ605090 AF270756c AY151620a
Rhexia virginica L.b,c . . . U26334b AF215587c AF215623c
Rhynchocalyx lawsonioides Olivera,b,c . . . U26336b AF270757c AY151599a
Saltera sarcorolla (L.) Bullock J. Schonenberger 360 (Z), (BOL) AJ605091 AJ605103 AY151621a
Sonderothamnus petraeus (Barker f.) R. Dahlgren J. Schonenberger 362 (Z), (BOL) AY078154d AJ605104 AY151622a
Stylapterus ericoides A. Juss. ssp.pallidus R. Dahlgren J. Schonenberger 355 (Z), (BOL) AJ605092 AJ605105 AY151625a
Stylapterus micranthus R. Dahlgren M. Johns s.n. (Z) AJ605093 AJ605106 AY151627a
Tibouchina urvilleana (DC.) Cogn.b,f . . . U26339b AF272820f AF322234f
Note. Herbaria acronyms: Z ¼ Zurich, BOL ¼ Bolus (University of Cape Town).a Schonenberger and Conti 2003.b Conti et al. 1996.c Clausing and Renner 2001.d Conti et al. 2002.e Renner et al. 2001.f Renner and Meyer 2001.
RUTSCHMANN ET AL.—TESTING THE OUT-OF-INDIA HYPOTHESIS

then used in a ML heuristic search using 100 random addi-tion sequences, tree bisection reconnection branch swapping,and steepest descent activated, implemented in PAUP 4.0b10(Swofford 2001). The trees were rooted on the branch lead-ing to Mouriri helleri (Memecylaceae) and four represen-tatives of Melastomataceae, which were constrained to bemonophyletic. These choices were justified by the results ofmore inclusive phylogenetic analyses of Myrtales (Conti et al.1996, 2002). Statistical support for each clade was estimatedby generating 1000 bootstrap pseudoreplicates using the MLfast–heuristic search option in PAUP. All phylogenetic analy-ses were performed on a 2 Ghz Pentium IV machine underRed Hat Linux 8.0.
Molecular Dating
When performing molecular dating analyses, several cru-cial choices need to be made that might affect the estimatedages, including selection of molecular dating method, genesampling, and calibration method. The first choice is to de-cide whether the analyses should be based on the assumptionof rate constancy (molecular clock) or whether they shouldallow rates to vary across branches of a tree. To evaluatewhether the sequences of each data partition evolved ina clocklike fashion, a likelihood ratio (LR) test was per-formed by comparing the scores of ML trees with and with-out a molecular clock enforced (Felsenstein 1981; Sanderson1998; Nei and Kumar 2000). To gain some insight into therelative performance of different molecular dating methods,we compared the results of the clock-dependent LF (Langley
and Fitch 1974) and the clock-independent NPRS (Sanderson1997) and PL (Sanderson 2002) analyses, as implementedin r8s 1.6 (Sanderson 2003). Both latter methods relax theassumption of rate constancy by smoothing changes of sub-stitution rates across the tree. NPRS is an entirely nonpara-metric method that estimates rates and times via a leastsquares smoothing criterion, whereas PL is a semiparametrictechnique that attempts to combine the statistical power ofparametric methods with the robustness of nonparametricmethods. Briefly, PL relies on a data-driven cross-validationprocedure that sequentially prunes taxa from the tree, esti-mates parameters from the submatrix for a given smoothingvalue, predicts the data that were removed by using the esti-mated parameters, and calculates the x2 error associated withthe difference between predicted and observed data of the re-moved submatrix. The optimal smoothing level correspondsto the lowest x2 error (Sanderson 2002).
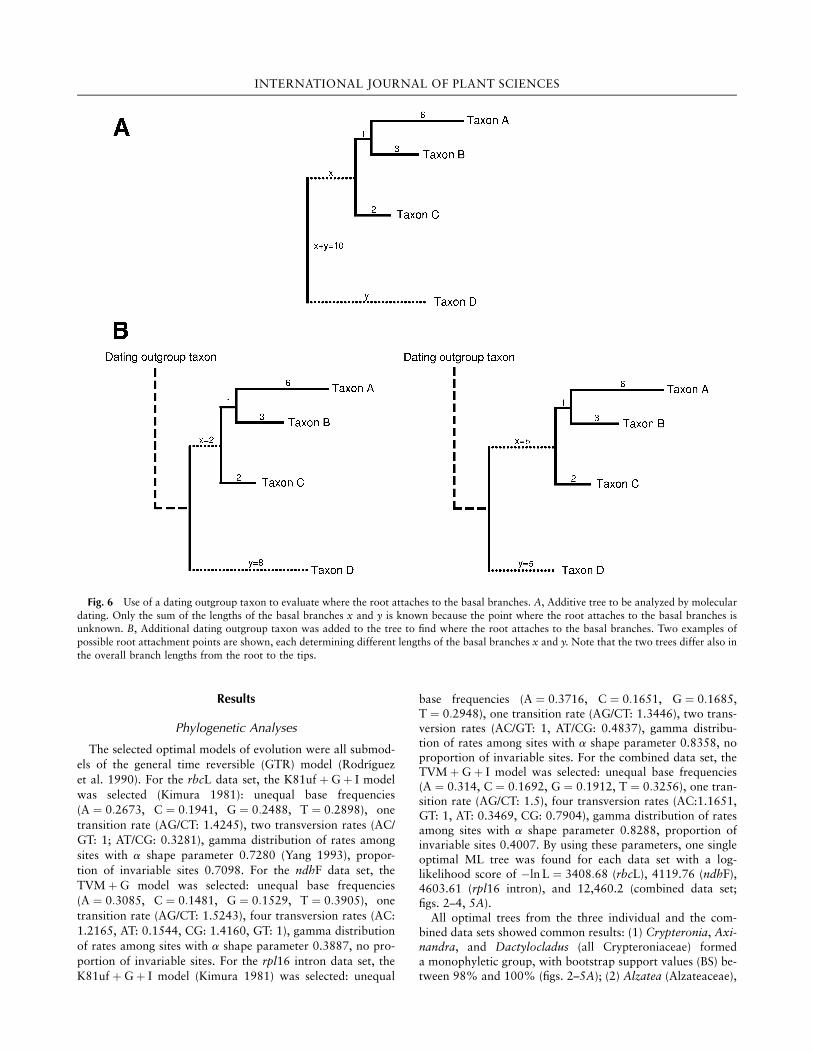
The optimal ML trees estimated in PAUP 4.0b10 for eachdata partition and for the combined data set were saved withbranch lengths (figs. 2–4, 5A) and then used as input trees inr8s. To establish the position of the root in the basal branchof the ML trees, Myrtus communis and Eugenia uniflora(Myrtaceae) were used as dating outgroups (see Conti et al.1996, 1997). To evaluate the overall branch length from theroot to a tip of a tree, it is necessary to know the lengths ofthe basal branches. In an additive tree, only the sum of theselengths is known, and the place where the root attaches tothe basal branches is undefined (fig. 6A). Dating outgroupchoice influences the position of the root attachment point,hence the lengths of the basal branches (fig. 6B) and the
Fig. 2 Maximum likelihood tree based on the rbcL data set (1280 characters). Bootstrap support values are reported below the branches.
Nodes of interest: A (diversification of Crypteroniaceae crown group), B (origin of Crypteroniaceae stem lineage), C (diversification of the West
Gondwanan crown group), D (crown group of Melastomeae), and E (diversification of Melastomataceae crown group).
INTERNATIONAL JOURNAL OF PLANT SCIENCES

relative contribution of individual branches to the total pathsfrom the root to the tips (Sanderson and Doyle 2001; Sander-son 2002). Therefore, root position affects the calculation ofabsolute substitution rates and the smoothing of differentialsubstitution rates across the tree.
After root position was established, the dating outgroupwas removed in r8s prior to molecular dating. For the PLanalyses, the optimal smoothing parameter, ranging between0.001 and 1000, was selected prior to the dating by per-forming a cross-validation procedure. To calculate the abso-lute substitution rates across the tree, optimization via theTruncated-Newton algorithm was chosen for the Langley-Fitch and PL methods and the POWELL algorithm for theNPRS dating.
All age estimations in r8s were started five times to providedifferent starting conditions (a random set of initial diver-gence times), a practice aimed at preventing the optimizationalgorithms from converging to a local plateau. Age estima-tions were performed only for nodes A, B, and C becausethese nodes are crucial to testing the out-of-India origin ofCrypteroniaceae. Node A represents the diversification of theCrypteroniaceae crown group; node B represents the originof the Crypteroniaceae stem lineage (equivalent to the timeat which Crypteroniaceae split off from their West Gond-wanan sister group); and node C represents the split betweenthe South American Alzatea and its African sister clade (seefigs. 2–5).
To evaluate statistical support for the estimated ages, weperformed a bootstrap resampling procedure (Efron and Tib-shirani 1993). For all molecular dating analyses performedon the combined data set, 100 bootstrap pseudoreplicateswere generated using the program SEQBOOT from the Phy-lip package, version 3.6a3 (Felsenstein 2002). While the to-
pology of the optimal ML trees was kept fixed, branchlengths for each pseudoreplicate were estimated by ML withthe selected substitution model in PAUP (Sanderson 1997).With this approach, 100 bootstrap trees, with the same to-pology but different branch lengths, were generated and in-dividually analyzed in 100 molecular dating procedures asdescribed above. For the PL analysis, the optimal smoothingparameter for each bootstrap replicate was calculated priorto the dating procedures. Using the r8s bootstrap kit (Eriks-son 2002), relative branch lengths from the 100 bootstrappedtrees were transformed into a distribution of 100 absoluteages for each of nodes A, B, and C, respectively. After check-ing for normality, the obtained age distributions were used tocalculate the mean, standard deviation, and 95% confidenceinterval (CI) of each age estimate (tables 2–4).
Calibration
To transform the resulting relative branch lengths into ab-solute ages for nodes A, B, and C (fig. 5B), it is necessary tofix or constrain a node to an absolute age. The calibrationprocedure represents one of the most sensitive choices in mo-lecular dating analyses (Sanderson 1998; Wikstrom et al.2001; Thorne and Kishino 2002; Yang and Yoder 2003).Calibration can be performed by reference either to the fossilrecord (paleobotanic dating) or to known vicariance events(geologic dating; Hillis et al. 1996; Sanderson 1998). Eitherapproach can establish only the minimum age at the calibra-tion point, most likely resulting in an underestimation of di-vergence times (Tavare et al. 2002). In the following section,we consider the problems associated with each of the threecalibration points that we selected for our analyses.
Fig. 3 Maximum likelihood tree based on the ndhF data set (981 characters). Bootstrap support values and description of nodes as in legend of
fig. 2.
RUTSCHMANN ET AL.—TESTING THE OUT-OF-INDIA HYPOTHESIS

From an analytical point of view, the ideal calibrationpoint would be as close as possible to the node to be esti-mated in order to reduce potential sources of error in ageestimation (Wikstrom et al. 2001). In our tree, this was pos-sible only with geologic calibration because the fossil recordof Crypteroniaceae is too uncertain. Heterocolpate pollententatively assigned to Crypteroniaceae from the MiddleMiocene (Muller 1975) is difficult to distinguish from hetero-colpate pollen of Melastomataceae, Memecylaceae, Olinia-ceae, Penaeaceae, and Rhynchocalycaceae (Morley and Dick2003). Therefore, we were forced to look for paleobotaniccalibration points outside of Crypteroniaceae.
The phylogenetically closest fossils were in Melastomata-ceae. Renner et al. (2001) and Renner and Meyer (2001)used fossil seeds from the Miocene of central Europe(Collinson and Pingen 1992) to constrain the origin of Mela-stomeae. However, the assignment of these seeds to Melasto-meae is not straightforward. Collinson and Pingen (1992,p. 134) stated: ‘‘[These fossil seeds] are most similar to seedsof members of the tribes Osbeckieae [Melastomeae] andRhexieae, but differ in several significant features, especiallythe presence of multicellular tubercles.’’ Therefore, it is diffi-cult to know whether these fossils should be assigned to thebase of the Melastomeae crown group or to more recentnodes in the tribe. With these caveats in mind, we assigneda probably very conservative age of 26 mya (as suggested byRenner et al. 2001) to node D, representing the crown groupof Melastomeae in our current taxon sampling (figs. 2–5).
Fossil leaves from the Early Eocene of North Dakota (53mya; Hickey 1977) can also be used to constrain a node inMelastomataceae. However, the assignment of these macro-fossils to a specific node is problematic. In his description of
these fossil leaves, Hickey (1977, p. 144) stated that they re-semble most closely the leaves of extant Miconieae and Mer-ianieae but cautioned: ‘‘They all differ, however, in not beingdeeply cordate and in having tertiaries which do not forma good V pattern.’’ Renner et al. (2001) conservatively as-signed these leaves, characterized by the acrodromous leafvenation typical of extant Melastomataceae, to the node thatsubtends the crown group of the entire Melastomataceae, in-cluding the basal Kibessieae. However, these fossil leaves canalso be assigned to the crown group that includes Miconieaeand Micronieae, as the comments by Hickey (1977) mightimply (see also Renner et al. 2001). Our current sampling ofMelastomataceae does not include representatives of thebasal Kibessieae. However, also in light of the biases in themacrofossil record discussed by Morley and Dick (2003), itdoes not seem unreasonable to assign an age of 53 mya tothe node that comprises our current sampling of Melastoma-taceae (node E, see figs. 2–5; see also Renner 2004, in press).
Several recent studies have used geologic calibration pointsfor molecular dating estimates, for example, in Phylica (Rich-ardson et al. 2001), Laurales (Renner et al. 2000), ranidfrogs (Bossuyt and Milinkovitch 2001), and ratite birds(Cooper et al. 2001). In our analyses, all ML trees fromeither separate or combined data sets supported the sistergroup relationship between the South American Alzateaceaeand the African clade (see ‘‘Results’’). This pattern, supportedby a bootstrap value of 86% in the combined ML tree (seefig. 5A), represents a rather clear geologic signature and canbe used as a calibration point, despite caveats of potential cir-cularity. Therefore, we assigned an age of 90 mya, represent-ing the final split between South America and Africa, to nodeC (see fig. 5B).
Fig. 4 Maximum likelihood tree based on the rpl16 intron data set (1010 characters). Bootstrap support values and description of nodes as inlegend of fig. 2.
INTERNATIONAL JOURNAL OF PLANT SCIENCES

Fig. 5 A, Maximum likelihood tree based on the combined data set (3271 characters). Bootstrap support values and description of nodes as inlegend of fig. 2. B, Chronogram based on a penalized likelihood molecular dating analysis of the combined data set. The independent use of three
different calibration points resulted in three different time bars.
Results
Phylogenetic Analyses
The selected optimal models of evolution were all submod-
els of the general time reversible (GTR) model (Rodrıguez
et al. 1990). For the rbcL data set, the K81uf þ G þ I model
was selected (Kimura 1981): unequal base frequencies
(A ¼ 0:2673, C ¼ 0:1941, G ¼ 0:2488, T ¼ 0:2898), one
transition rate (AG/CT: 1.4245), two transversion rates (AC/
GT: 1; AT/CG: 0.3281), gamma distribution of rates among
sites with a shape parameter 0.7280 (Yang 1993), propor-
tion of invariable sites 0.7098. For the ndhF data set, the
TVM þ G model was selected: unequal base frequencies
(A ¼ 0:3085, C ¼ 0:1481, G ¼ 0:1529, T ¼ 0:3905), one
transition rate (AG/CT: 1.5243), four transversion rates (AC:
1.2165, AT: 0.1544, CG: 1.4160, GT: 1), gamma distribution
of rates among sites with a shape parameter 0.3887, no pro-
portion of invariable sites. For the rpl16 intron data set, the
K81uf þ G þ I model (Kimura 1981) was selected: unequal
base frequencies (A ¼ 0:3716, C ¼ 0:1651, G ¼ 0:1685,T ¼ 0:2948), one transition rate (AG/CT: 1.3446), two trans-version rates (AC/GT: 1, AT/CG: 0.4837), gamma distribu-tion of rates among sites with a shape parameter 0.8358, noproportion of invariable sites. For the combined data set, theTVM þ G þ I model was selected: unequal base frequencies(A ¼ 0:314, C ¼ 0:1692, G ¼ 0:1912, T ¼ 0:3256), one tran-sition rate (AG/CT: 1.5), four transversion rates (AC:1.1651,GT: 1, AT: 0.3469, CG: 0.7904), gamma distribution of ratesamong sites with a shape parameter 0.8288, proportion ofinvariable sites 0.4007. By using these parameters, one singleoptimal ML tree was found for each data set with a log-likelihood score of �ln L ¼ 3408:68 (rbcL), 4119.76 (ndhF),4603.61 (rpl16 intron), and 12,460.2 (combined data set;figs. 2–4, 5A).
All optimal trees from the three individual and the com-bined data sets showed common results: (1) Crypteronia, Axi-nandra, and Dactylocladus (all Crypteroniaceae) formeda monophyletic group, with bootstrap support values (BS) be-tween 98% and 100% (figs. 2–5A); (2) Alzatea (Alzateaceae),
Fig. 6 Use of a dating outgroup taxon to evaluate where the root attaches to the basal branches. A, Additive tree to be analyzed by molecular
dating. Only the sum of the lengths of the basal branches x and y is known because the point where the root attaches to the basal branches isunknown. B, Additional dating outgroup taxon was added to the tree to find where the root attaches to the basal branches. Two examples of
possible root attachment points are shown, each determining different lengths of the basal branches x and y. Note that the two trees differ also in
the overall branch lengths from the root to the tips.
INTERNATIONAL JOURNAL OF PLANT SCIENCES

Rhynchocalyx (Rhynchocalycaceae), and all Penaeaceae andOliniaceae included in this analysis formed another clade,with BS between 51% and 86%; (3) these two clades were sis-ter to each other, with BS between 67% and 99%; and (4) Al-zatea was sister to the clade formed by Rhynchocalyx,Oliniaceae, and Penaeaceae, with BS between 79% and 97%.These topological results were congruent with phylogeniespublished by Clausing and Renner (2001), Conti et al. (2002),and Schonenberger and Conti (2003). However, the trees dif-fered slightly in the detailed topological resolution within the
mentioned clades and in the branch lengths. In all these clades,the highest support values were obtained in the combinedanalysis.
Molecular Dating
By enforcing the molecular clock in PAUP 4.0b10, weobtained an optimal ML tree for each data set with log-likelihood scores of �ln L ¼ 3429:36 (rbcL), 4169.04(ndhF), 4648.36 (rpl16 intron), and 12,531.27 (combined
Table 2
Ages in Million Years Estimated for Nodes A, B, and C Based on rbcL, ndhF, and rpl16 Intron Sequencesand Three Different Methods Implemented in the r8s Software (Sanderson 2003; All Trees Were
Calibrated at Node E with an Age of 53 Million Years)
rbcL ndhF rpl16 intron Combined data set
LF:
A 31.51 41.64 23.85 29.44 m = 29.91, s = 3.21, CI: 29.28–30.55B 80.22 71.93 49.03 58.89 m = 58.16, s = 5.16, CI: 57.13–59.18
C 64.46 49.21 37.1 53.00 m = 43.63, s = 4.35, CI: 42.76–44.49
D NA 45.43 42.4 42.69 m = 42.31, s = 2.08, CI: 41.9–42.72NPRS:
A 57.08 153.7 56.21 82.68 m = 85.24, s = 11.93, CI: 82.87–87.61
B 111.44 217.3 106 152.64 m = 149.12, s = 16.51, CI: 145.84–152.39
C 100.56 196.1 94.76 135.68 m = 133.75, s = 15.84, CI: 130.6–136.89D NA 42.4 40.15 38.16 m = 38.35, n
PL:
Optimal smoothing value: a = 0.1 a = 0.01 a = 0.001 a = 0.00316
A 39.37 92.75 43.06 53.00 m = 54.26, s = 7.58, CI: 52.76–55.76B 96.91 154.58 91.09 100.70 m = 103.28, s = 12.32, CI: 100.84–105.73
C 80.26 128.08 76.19 83.03 m = 85.91, s = 12.45, CI: 83.44–88.38
D NA 44.17 39.75 42.4 m = 40.93, s = 2.18, CI: 40.5–41.36
Note. LF ¼ Langley-Fitch, NPRS ¼ nonparametric rate smoothing, PL ¼ penalized likelihood, m ¼ mean, s ¼ standard deviation,
CI ¼ 95% confidence interval, n ¼ bootstrapped ages not normally distributed, NA ¼ data not available because node D is not present in the
rbcL data set due to different tree topology.
Table 3
Ages in Million Years Estimated for Nodes A, B, and C Based on rbcL, ndhF, and rpl16 Intron Sequencesand Three Different Methods Implemented in the r8s Software (Sanderson 2003; All Trees Were
Calibrated at Node D with an Age of 26 Million Years)
ndhF rpl16 intron Combined data set
LF:
A 23.83 14.63 17.93 m = 18.44, nB 41.17 30.06 35.86 m = 35.82, s = 3.59, CI: 35.11–36.53
C 28.17 22.75 26 m = 26.87, s = 2.92, CI: 26.29–27.44
E 30.33 32.5 32.28 m = 32.65, s = 1.64, CI: 32.32–32.98
NPRS:A 94.25 36.4 56.33 m = 58.11, s = 9.39, CI: 56.25–59.98
B 133.25 68.64 104 m = 101.53, s = 12.96, CI: 98.56–104.1
C 120.25 61.36 92.44 m = 91.07, s = 12.27, CI: 88.63–93.5
E 32.5 34.32 36.11 m = 31.78, nPL:
Optimal smoothing value: a = 0.01 a = 0.001 a = 0.00316
A 54.6 28.17 32.5 m = 34.6, s = 5.37, CI: 33.54–35.67
B 91 59.58 61.75 m = 65.79, s = 8.54, CI: 64.1–67.49C 75.4 49.83 50.92 m = 54.73, s = 8.35, CI: 53.07–56.38
E 31.2 34.67 32.5 m = 33.77, s = 1.82, CI: 33.41–34.13
Note. LF ¼ Langley-Fitch, NPRS ¼ nonparametric rate smoothing, PL ¼ penalized likelihood, m ¼ mean,s ¼ standard deviation, CI ¼ 95% confidence interval, n ¼ bootstrapped ages not normally distributed. Ages for the
rbcL data set are not available because node D is not present in this data set due to different tree topology.
RUTSCHMANN ET AL.—TESTING THE OUT-OF-INDIA HYPOTHESIS

data set). Comparisons between clock and nonclock trees byapplying LR tests rejected clocklike evolution for all data sets(LR ¼ 41:35, rbcL; 98.56, ndhF; 89.52, rpl16 intron;142.12, combined data set; degrees of freedom ¼ 22, confi-dence interval ¼ 95%). The results of molecular dating anal-yses using both clock-dependent and clock-independentapproaches for the three separate and for the combined datasets are summarized in tables 2–4, and the PL chronogramfor the combined data set is shown in figure 5B. Smoothingparameter values of 0.1 (rbcL), 0.01 (ndhF), 0.001 (rpl16intron), and 0.00316 (combined data set), selected via across-validation procedure in r8s, were used for penalizedlikelihood age estimations.
Discussion
Comparisons among Dating Methods
Comparisons among the nodal ages estimated by the threedating methods showed remarkable differences (tables 2–4),depending on the methods themselves but also on the positionof the calibration node within the tree. A discrepancy betweenclock-based and clock-independent age estimates was expectedbecause likelihood ratio tests strongly rejected the assumptionof rate constancy for all data sets. Differences in the rates ofnucleotide substitution between branches in a tree are alsoknown as lineage effects (Britten 1986; Gillespie 1991).
In general, NPRS (Sanderson 1997), which relaxes the as-sumption of rate constancy by smoothing changes of substi-tution rates across the tree, consistently produced the highestrate differences between the branches (as visualized in theratograms produced by r8s; data not shown); thus the agesestimated using NPRS were either much younger or olderthan those obtained by using LF (Langley and Fitch 1974),depending on the position of the calibration node and data
partition. This is because NPRS tends to overfit the data,thus causing rapid rate fluctuations in certain regions of a tree(Sanderson 2002). The semiparametric PL method (Sander-son 2002) tries to alleviate this problem by selecting the opti-mal smoothing parameter via a data-driven cross-validationprocedure (Green and Silverman 1994). The application ofPL resulted in rates of nucleotide substitution as well as ageestimates, which were for most branches between those cal-culated with LF and NPRS.
By calibrating the trees at nodes E or D (tables 2, 3), theages estimated for nodes A, B, and C using NPRS were con-sistently older than those produced using PL, whereas theages obtained using LF were younger than the PL results.The likely explanation for this effect lies in the two longbranches below node E (figs. 2–5A). Depending on the datingmethod, different rates of nucleotide substitution are assignedto these branches (ratograms not shown), producing consid-erably different absolute ages at nodes located on the otherside of the root of the tree.
Comparisons among DNA Regions
By calibrating the trees at nodes E or D (tables 2, 3), theages for nodes A, B, and C estimated using the ndhF data setwere generally much older than those based on the other twodata sets. Reciprocally, when we calibrated the trees at nodeC (table 4), the ages for nodes E and D were much youngerin the ndhF-based analysis than by using the rbcL or rpl16-intron data sets. Nodal ages estimated from rbcL and rpl16intron sequences were similar to each other. Comparisons ofthe three ML phylograms show that the branches below nodeE are significantly longer in the ndhF phylogram (fig. 3) thanthe same branches in the rbcL and rpl16-intron phylograms(figs. 2, 4).
Table 4
Ages in Million Years Estimated for Nodes A, B, and C Based on rbcL, ndhF, and rpl16 Intron Sequencesand Three Different Methods Implemented in the r8s Software (Sanderson 2003; All Trees Were
Calibrated at Node C with an Age of 90 Million Years)
rbcL ndhF rpl16 intron Combined data set
LF:
A 44 76.15 57.86 62.07 m = 62.08, s = 7.35, CI: 60.63–63.54B 112 131.54 118.93 124.14 m = 120.52, s = 10.25, CI: 118.49
D NA 83.08 102.86 90 m = 88.12, n
E 74 96.92 128.57 111.72 m = 110.42, s = 11.09, CI: 108.22–112.63NPRS:
A 51.08 70.54 53.39 54.84 m = 57.6, s = 6.97, CI: 56.21–58.98
B 99.73 99.73 100.68 101.25 m = 100.5, s = 4.23, CI: 99.66–101.34
D NA 19.46 38.14 25.31 m = 26.15, s = 3.45, CI: 25.46–26.83E 47.43 24.32 50.34 35.16 m = 36.15, s = 4.19, CI: 35.32–36.98
PL:
Optimal smoothing value: a = 0.1 a = 0.01 a = 0.001 a = 0.00316
A 44.15 65.17 50.87 57.45 m = 57.31, s = 7.2, CI: 55.88–58.74B 108.68 108.62 107.61 109.15 m = 108.89, s = 8.52, CI: 107.2–110.58
D NA 31.03 46.96 45.96 m = 43.79, s = 7.02, CI: 42.4–45.18
E 59.43 37.24 62.61 57.45 m = 56.71, s = 8.39, CI: 55.04–58.37
Note. LF ¼ Langley-Fitch, NPRS ¼ nonparametric rate smoothing, PL ¼ penalized likelihood, m ¼ mean, s ¼ standard deviation,
CI ¼ 95% confidence interval, n ¼ bootstrapped ages not normally distributed, NA ¼ data not available because node D is not present in the
rbcL data set due to different tree topology.
INTERNATIONAL JOURNAL OF PLANT SCIENCES

The phenomenon of striking differences in the tempo andmode of evolution between different genes is well known,but its effects on divergence time estimation are poorly un-derstood (Goremykin et al. 1996; Sanderson and Doyle2001). In this article, we can only speculate on possible ex-planations for the anomalous results obtained from ndhF se-quences and suggest research directions that might provefruitful to investigate the role of gene-specific effects on mo-lecular dating estimates.
For example, the bias of nucleotide substitutions in bothcoding and noncoding sequences of the plant chloroplastgenome is strongly dependent on the composition of the twoflanking bases (Morton 1997a, 1997b). One possible explana-tion for the older ages obtained from ndhF sequences mightlie in the differential influence that the two neighboring basescould have on the substitution type of a certain nucleotide inour ndhF sequences as compared to rbcL and rpl16 intron se-quences. It is also reasonable to ask whether the occurrenceof an ndhF pseudogene might explain gene-specific effects onage estimates, as ndhF pseudogenes have been reported, forexample, in orchids (Neyland and Urbatsch 1996). However,translation of ndhF sequences into the corresponding aminoacids did not reveal the presence of any stop codons, andmultiple alignment of ndhF sequences required only gaps inmultiples of three, suggesting that our ndhF sequences likelyrepresent functional gene copies. Furthermore, PCR amplifi-cations using an ndhF-specific primer pair (Olmstead andSweere 1994) did not reveal any PCR products of differentlengths, and direct sequencing of double-stranded PCR prod-ucts produced unequivocal electropherograms, characterizedby single peaks at all positions. Finally, the topology of theoptimal ML tree–based ndhF was congruent to the othertrees based on the rbcL and rpl16 intron sequences. Never-theless, we cannot exclude the possibility that an ndhF pseu-dogene might exist in some or all of the studied taxa,perhaps influencing the molecular evolutionary behavior ofthe functional ndhF gene copies that we likely sequenced forthis study (Bromham and Penny 2003). Another potential ex-planation for the different dating results obtained from ndhFsequences might be sought in alignment effects. However, ex-periments using a modified ndhF data set from which allgapped regions were removed prior to analysis produced ageestimates similar to those obtained with the gapped data set(data not shown). Additional theoretical and experimentalstudies of gene-specific effects on molecular dating estimatesare clearly needed (Bromham and Penny 2003).
Although nested likelihood ratio tests of the three separatedata sets indicated that the three chloroplast regions used inour dating analyses evolved according to different modelsand parameters of nucleotide substitutions, we proceeded toestimate nodal ages from the combined data matrix becausewe wished to compare results from the latter with those fromthe three separate sequence matrices. The exceedingly olderor younger nodal ages estimated from ndhF sequences, de-pending on the position of the calibration point, seemed tofurther justify data set combination, for it has been suggestedthat the combination of sequences with different evolution-ary patterns might compensate for unusual patterns in anysingle DNA region (Qiu et al. 1999; Wikstrom et al. 2001).
Congruence between Geologic and Biological History
One of the major goals of biogeographic studies is to eluci-date the historical genesis of current plant distributions. Inan evolutionary framework, it is assumed that geologicevents of the past, for example the emergence and/or theelimination of major geographic barriers to range expansion,likely left a mark on the phylogenetic and biogeographic his-tory of biotic elements (Lieberman 2000). Therefore, to sup-port the hypothesis that geologic events shaped the currentdistribution of any taxa, one would need to demonstrate con-gruence between geologic and biological history both interms of pattern and time (table 5). At the level of pattern,one would expect correspondence between the sequence ofgeologic events and the sequence of cladogenetic events.Paleogeologic reconstructions and the topology of phyloge-netic trees provide the necessary evidence for pattern congru-ence. At the level of time, the specific timing of geologicevents must be compatible with the timing of cladogeneticevents (nodal ages) inferred from molecular or other datingmethods. Both lines of evidence (pattern and time) are neces-sary, but independently not sufficient, to support a key roleof geology in shaping current taxic distributions. If evidencefor congruence between geology and biology can be pro-duced at the levels of both pattern and time, there is no needto invoke other types of explanatory processes for current bi-otic distributions (table 5; see also Sober 1988; Hunn andUpchurch 2001).
Geologic events that influence biological distributions in-clude plate fragmentation, as in the classic interpretation ofvicariance or the expansion of a lineage due to the temporaryelimination or reduction of a geographic barrier, followed bythe emergence of a new barrier producing vicariant sistergroups, as in the recently proposed concept of geodispersal(Lieberman 1997, 2000). In the next section, we will discusswhether the phylogenetic relationships and molecular datingestimates of Crypteroniaceae warrant a key role for geologicevents in explaining the current distribution of this groupand its sister clade.
Congruence between Geology and Biology for theOut-of-India Hypothesis of Crypteroniaceae
After comparing the results of different dating methodsand data sets (see above), it seemed most reasonable to usethe ML tree topology (fig. 5A) and the PL ages (fig. 5B) cal-culated from the combined data matrix to reconstruct the
Table 5
Relationships between Geology and Biology at theLevels of Pattern and Time
Geology Biology
Pattern Sequence of geologic
events
Sequence of cladogenetic
eventsTime Timing of geologic events Timing of cladogenetic events
Note. Correspondence at both levels is necessary to support
a geodispersalist origin (sensu Lieberman 2000) of current biotic dis-tributions. See ‘‘Discussion’’ for further explanation.
RUTSCHMANN ET AL.—TESTING THE OUT-OF-INDIA HYPOTHESIS

biogeographic history of Crypteroniaceae. A previous phylo-genetic and molecular dating study based exclusively on rbcLsequences proposed an ancient Gondwanan origin for Cryp-teroniaceae in the Early to Middle Cretaceous, followed bydispersal to the Deccan plate (comprising Madagascar, India,Sri Lanka, and the Seychelles) as it was rafting along the Af-rican coast, and subsequent dispersal from India to SoutheastAsia after collision of the Indian plate with Asia in the Mid-dle Eocene (Conti et al. 2002). Is this biogeographic recon-struction congruent with both pattern and timing ofcladogenetic events (table 5), as estimated from the phyloge-netic and molecular dating analyses of the expanded data setsused in this study?
The combined ML tree (fig. 5A) strongly supports(BS ¼ 99%) the sister group relationship between the South-east Asian Crypteroniaceae and the West Gondwanan cladeand the split between the South American Alzateaceae andthe African clade (BS ¼ 86%). Therefore, at the level of pat-tern, the sequence of cladogenetic events is congruent withthe sequence of geologic events, if we consider that the Dec-can Plate rafted along the African coast between the Lowerand Middle Cretaceous (Scotese et al. 1988; Morley 2000),with likely island chain connections between the two platesup to the Early Maastrichtian (Morley 2000), and that sepa-ration between Africa and South America was completed byca. 90 mya (McLoughlin 2001), although transoceanic dis-persal routes between Africa and South America likely ex-isted between 84 and 65 mya (McDougal and Douglas 1988;Hallam 1994; Morley 2000).
At the level of time, results are more controversial. The de-viations in age estimates due to the use of different calibra-tions (tables 2–4) indicate that calibration is one of the mostcritical issues in molecular phylogenetic dating. The ages forthe origin of Crypteroniaceae (node B), obtained from PL op-timization on the combined ML tree, ranged from a minimumvalue of 62 mya, estimated by fixing node D to 26 mya toa higher value of 101 mya, estimated by fixing node E to 53mya and a maximum value of 109 mya, estimated by fixingnode C to 90 mya (see tables 2–4; fig. 5B). As explained in‘‘Material and Methods,’’ the assignments of fossil seeds fromthe Miocene of central Europe (Collinson and Pingen 1992) tonode D (Melastomeae crown group) and fossil leaves from theEocene of North Dakota (Hickey 1977) to node E (Melasto-mataceae crown group) most likely represent large underesti-mations of nodal ages. Furthermore, Morley and Dick (2003)extensively reviewed the fossil record for Melastomataceaeand argued that its abrupt appearance at northern temperatelatitudes during the Eocene and Miocene may simply reflectcolonization from ancient Gondwanan lineages. Given theseconsiderations, it seems more plausible to suggest an origin ofthe Crypteroniaceae stem lineage that is closer to the olderages (101–106 mya) obtained with our three calibrationpoints. Which biogeographic scenario is congruent with thisinterpretation for the age of Crypteroniaceae?
According to paleogeographic reconstructions, EastGondwana—including India—split from West Gondwanabetween 165 and 150 mya (Krutzsch 1989; McLoughlin 2001;Briggs 2003). Therefore, a traditional vicariant explanationfor the origin of Crypteroniaceae—with overland dispersalfrom West to East Gondwana, followed by tectonic split—is
incompatible with our dating estimates for node B and indeedwith molecular estimates for the age of angiosperms(190–140 mya; Sanderson and Doyle 2001; Wikstrom et al.2001). It is more probable that the biogeographic history ofCrypteroniaceae might reflect a temporary reduction or evenelimination of the oceanic barrier between Africa and theDeccan Plate (at that time comprising Madagascar, India, SriLanka, and the Seychelles Plateau), as the plate drifted north-ward along the African coast for a rather extended period oftime (over 40 mya) between the Early and Late Cretaceous(Scotese et al. 1988; Morley 2000; Briggs 2003). It has alsobeen suggested that small islands or land bridges betweenWest Gondwana and the Deccan Plate facilitated short- to me-dium-distance dispersal over the Mozambique Channel ofother biotic elements, including some groups of dinosaurs,crocodiles, mammals (Krause and Maas 1990; Krause et al.1999), frogs (Bossuyt and Milinkovitch 2001; Biju and Bos-suyt 2003), lizards, snakes, turtles, and caecilians (Briggs2003). Ashton and Gunatilleke (1987) suggested that the totaldistance between West Gondwana and the Deccan plate (stillconnected to Madagascar) remained more or less constant(ca. 420 km) until ca. 84 mya, when the plate separated fromMadagascar and started to drift northward (Plummer andBelle 1995; Storey et al. 1995; McLoughlin 2001). Pollen re-cords suggested that plant dispersal from Africa to Madagas-car and the Indian plate continued on a regular basis,presumably until the middle Maastrichtian (65–71 mya ago;Morley and Dick 2003). Therefore, India’s role in the biogeo-graphic history of Crypteroniaceae most likely did not con-form to a purely vicariant pattern, involving direct dispersalprior to barrier formation (Wiley 1988; Morrone and Crisci1995), but rather to the dynamics of range expansion follow-ing barrier reduction (geodispersal; Lieberman 2000; see alsoStace 1989).
Extinction played a prominent role in the history of the an-cient Gondwanan elements of India’s biotas, as India traveledrapidly across latitudes during the Middle to Late Cretaceous(Morley 2000; McLoughlin 2001). Its biotas were affectedby massive volcanism at the Cretaceous-Tertiary boundary(ca. 65 mya ago; Officer et al. 1987), extensive aridificationduring the Late Tertiary (following the uplift of the Himala-yan chain caused by India’s collision with Southern Asia be-tween 55 and 49 mya; Beck et al. 1995), and further cyclesof aridity associated with glaciations during the Quaternary(Raven and Axelrod 1974; Bande and Prakash 1986; Ashtonand Gunatilleke 1987; Morley 2000). Axinandra zeylanica isendemic in Sri Lanka, which was probably connected to In-dia until 6000 years ago (McLoughlin 2001). SouthwesternIndia together with Sri Lanka served as refugial areas, wheresome ancient Gondwanan taxa escaped extinction (Ravenand Axelrod 1974; Guleria 1992; Morley 2000). Some ofthese relictual taxa dispersed to Southeast Asia, where Cryp-teronia sp., Dactylocladus stenostachys, and the other threespecies of Axinandra occur to this day. Southeast Asia hasalso long been recognized as a refugium where the equableoceanic conditions allowed tropical lineages to survive(Bande and Prakash 1986; Takhtajan 1987; Morley 2000).
To summarize, our current phylogenetic and moleculardating results from expanded taxic and genetic sampling sug-gest a possible congruence between biological and geologic
INTERNATIONAL JOURNAL OF PLANT SCIENCES

history that is compatible with a central role played by theDeccan Plate in transporting the stem lineage of Crypte-roniaceae from West Gondwana to Asia, most likely in a timeframe comprised between the Middle and Late Cretaceous.However, our results remain open to debate, especially inlight of the difficult assignment of paleobotanic and geologicconstraints to specific nodes in the phylogeny. It is our hopethat the addition of more fossil calibration points; furthertaxonomic sampling from Crypteroniaceae and additionalgroups; and the use of dating methods that allow for multi-ple, contemporary constraints on the phylogeny will allow us
to refine our interpretations of the biogeographic history ofCrypteroniaceae and related clades.
Acknowledgments
We are very grateful to Sandro Wagen for technical assis-tance in the laboratory. We also thank Reto Nyffeler,Alexander Kocyan, and Niklaus Muller for fruitful discus-sions and general help. Financial support from the Universityof Zurich is gratefully acknowledged.
Literature Cited
Ashton PS, CVS Gunatilleke 1987 New light on the plant geography
of Ceylon. I. Historical plant geography. J Biogeogr 14:249–285.
Axelrod DI 1971 Plate tectonics in relation to the history of
angiosperm vegetation in India. Birbal Sahni Inst Paleobot Spec
Publ 1:5–18.
Baldwin BG, MJ Sanderson 1998 Age and rate of diversification of
the Hawaiian silversword alliance (Compositae). Proc Natl Acad
Sci USA 95:9402–9406.
Bande MB, U Prakash 1986 The tertiary flora of Southeast Asia with
remarks on its paleoenvironment and phytogeography of the
Indo-Malayan region. Rev Paleobot Palynol 49:203–233.
Baum DA, RL Small, JF Wendel 1998 Biogeography and floral
evolution of Baobabs (Adansonia, Bombacaceae) as inferred from
multiple datasets. Syst Biol 47:181–207.Beck RA, DW Burbank, WJ Sercombe, GW Riley, JK Barndt, JR
Berry, J Afzal, et al 1995 Stratigraphic evidence for an early
collision between northwest India and Asia. Nature 373:55–58.
Biju SD, F Bossuyt 2003 New frog family from India reveals an
ancient biogeographical link with the Seychelles. Nature 425:
711–714.
Bossuyt F, MC Milinkovitch 2001 Amphibians as indicators of early
Tertiary ‘‘out-of-India’’ dispersal of vertebrates. Science 292:93–95.
Briggs JC 2003 The biogeographic and tectonic history of India.
J Biogeogr 30:381–388.
Britten RJ 1986 Rates of DNA sequence evolution differ between
taxonomic groups. Science 231:1393–1398.
Bromham L, D Penny 2003 The modern molecular clock. Nat Rev
Genet 4:216–224.
Candolle AD 1857 Penaeaceae. Pages 483–491 in Ad Candolle, ed.
Prodromus systematis naturalis regni vegetabilis. Vol 14. Masson,
Paris.Clausing G, SS Renner 2001 Molecular phylogenetics of Melasto-
mataceae and Memecylaceae: implications for character evolution.
Am J Bot 88:486–498.
Collinson ME, M Pingen 1992 Seed of the Melastomataceae from
the Miocene of Central Europe. Pages 129–139 in J Kovar-Eden, ed.
Paleovegetation development in Europe. Museum of Natural
History, Vienna.Conti E, T Eriksson, J Schonenberger, KJ Sytsma, DA Baum
2002 Early Tertiary out-of-India dispersal of Crypteroniaceae:
evidence from phylogeny and molecular dating. Evolution 56:
1931–1942.
Conti E, A Litt, KJ Sytsma 1996 Circumscription of Myrtales and
their relationships to other Rosids: evidence from rbcL sequence
data. Am J Bot 83:221–233.Conti E, A Litt, PG Wilson, SA Graham, BG Briggs, LAS Johnson, KJ
Sytsma 1997 Interfamilial relationships in Myrtales: molecular
phylogeny and patterns of morphological evolution. Syst Bot 22:
629–647.
Cooper A, C Lalueza-Fox, S Anderson, A Rambaut, J Austin, R
Ward 2001 Complete mitochondrial genome sequences of two
extinct moas clarify ratite evolution. Nature 409:704–707.Efron B, RJ Tibshirani 1993 An introduction to the bootstrap.
Chapman & Hall, New York.Eriksson T 2002 The r8s-bootstrap-kit. Bergius Botanic Garden,
Stockholm.Felsenstein J 1981 Evolutionary trees from DNA sequences: a max-
imum likelihood approach. J Mol Evol 17:368–376.——— 2002 PHYLIP (phylogeny inference package), version 3.6a3.
Department of Genetics, University of Washington, Seattle.
Gillespie JH 1991 The causes of molecular evolution. Oxford
University Press, New York.
Goremykin V, V Bobrova, J Pahnke, A Troitsky, A Antonov, W
Martin 1996 Noncoding sequences from the slowly evolving
chloroplast inverted repeat in addition to rbcL data do not support
Gnetalean affinities of angiosperms. Mol Biol Evol 13:383–396.Graham SA 1984 Alzateaceae, a new family of Myrtales from the
American Tropics. Ann Mo Bot Gard 71:757–779.Green PJ, BW Silverman 1994 Nonparametric regression and gener-
alized linear models. Chapman & Hall, London.
Guleria JS 1992 Neogene vegetation of peninsular India. Paleobot-
anist 40:285–311.
Hallam A 1994 An outline of Phanerozoic biogeography. Oxford
Biogeography Series, no. 10. Oxford University Press, Oxford.
Hickey LJ 1977 Stratigraphy and paleobotany of the Golden Valley
Formation (Early Tertiary) of Western North Dakota. Pages
143–144 in Geological Society of America, Memoir 150. Geological
Society of America, Boulder, Colo.Hillis DM, BK Mable, C Moritz 1996 Applications of molecular
systematics: the state of the field and a look at the future. Pages
515–543 in DM Hillis, C Moritz, BK Mable, eds. Molecular
systematics. Sinauer, Sunderland, Mass.
Huelsenbeck JP, B Rannala 1997 Phylogenetic methods come of age:
testing hypotheses in an evolutionary context. Science 276:227–232.
Hunn CA, P Upchurch 2001 The importance of time/space in
diagnosing the causality of phylogenetic events: towards a ‘‘chrono-
biological’’ paradigm? Syst Biol 50:391–407.
Johnson LAS, BG Briggs 1984 Myrtales and Myrtaceae: a phyloge-
netic analysis. Ann Mo Bot Gard 71:700–756.
Jukes TH, CR Cantor 1969 Evolution of protein molecules. Pages
21–132 in HN Munro, ed. Mammalian protein metabolism.
Academic Press, New York.
Kimura M 1981 Estimation of evolutionary distances between
homologous nucleotide sequences. Proc Natl Acad Sci USA 78:
454–458.
Krause DW, MC Maas 1990 The biogeographic origins of late
Paleocene–early Eocene mammalian immigrants to the Western
Interior of North America. Pages 71–105 in TM Bown, KD Rose,
RUTSCHMANN ET AL.—TESTING THE OUT-OF-INDIA HYPOTHESIS
eds. Dawn of the age of mammals in the northern part of the Rocky
Mountain Interior, North America. Geological Society of America
Special Paper 243, Boulder, Colo.
Krause DW, RR Rogers, CA Forster, JH Hartman, GA Buckley, SD
Sampson 1999 The Late Cretaceous vertebrate fauna of Mada-
gascar: implications for Gondwanan paleobiogeography. GSA
Today (Geol Soc Am) 9:1–7.
Krutzsch W 1989 Paleogeography and historical phytogeography
(paleochorology) in the Neophyticum. Plant Syst Evol 162:
5–61.Langley CH, W Fitch 1974 An estimation of the constancy of the
rate of molecular evolution. J Mol Evol 3:161–177.
Lieberman BS 1997 Early Cambrian paleogeography and tectonic
history: a biogeographic approach. Geology 25:1039–1042.
——— 2000 Paleobiogeography: using fossils to study global
change, plate tectonics, and evolution. Kluwer, New York.Maddison PG, DR Maddison 2000 MacClade 4: analysis of phylog-
eny and character evolution. Sinauer, Sunderland, Mass.
McDougal I, RA Douglas 1988 Age-progressive volcanism in the
Tasmanitid seamounts. Earth Planet Sci Lett 89:207–220.
McKenna MCC 1973 Sweepstakes, filters, corridors, Noah’s arks,
and beached Viking funeral ships in paleogeography. Pages
291–304 in DH Tarling, SK Runcorn, eds. Implications of
continental drift to the earth sciences. Academic Press, London.McLoughlin S 2001 The breakup history of Gondwana and its
impact on pre-Cenozoic floristic provincialism. Austr J Bot 48:
271–300.
Meijer W 1972 The genus Axinandra-Melastomataceae: a missing
link in Myrtales? Ceylon J Sci Biol Sci 10:72–76.
Morley RJ 2000 Origin and evolution of tropical rain forests. Wiley,
Chichester.——— 2001 Why are there so many primitive angiosperms in the
rain forests of Asia-Australasia? Pages 185–199 in I Metcalfe, JMB
Smith, M Morwood, I Davidson, eds. Faunal and floral migrations
and evolution in Southeast Asia–Australasia. Balkeme, Lisse.
Morley RJ, CW Dick 2003 Missing fossils, molecular clocks and the
origin of the Melastomataceae. Am J Bot 90:1638–1645.
Morrone JJ, JV Crisci 1995 Historical biogeography: introduction to
methods. Annu Rev Ecol Syst 26:373–401.Morton BR 1997a The influence of neighboring base composition on
substitutions in plant chloroplast coding sequences. Mol Biol Evol
14:189–194.
——— 1997b The influence of specific neighboring bases on sub-
stitution bias in noncoding regions of the plant chloroplast genome.
J Mol Evol 45:227–231.
Muller J 1975 Note on the pollen morphology of Crypteroniaceae
s.l. Blumea 22:275–294.
Myers N, RA Mittermeier, CG Mittermeier, GAB da Fonseca, J
Kent 2000 Biodiversity hotspots for conservation priorities. Na-
ture 403:853–858.
Nei M, S Kumar 2000 Molecular evolution and phylogenetics.
Oxford University Press, Oxford.
Neyland R, LE Urbatsch 1996 Phylogeny of the subfamily Epiden-
droideae (Orchidaceae) inferred from ndhF chloroplast gene
sequences. Am J Bot 83:1195–1206.
Officer CB, CL Hallam, CL Drake, JD Devine 1987 Late Cretaceous
and paroxysmal Cretaceous/Tertiary extinctions. Nature 326:
143–149.
Olmstead RG, JA Sweere 1994 Combining data in phylogenetic
systematics: an empirical approach using three molecular datasets in
the Solanaceae. Syst Biol 43:467–481.Partridge TC 1997 Late Neogene uplift in eastern and southern
Africa and its paleoclimatic implications. Pages 63–86 in WF
Ruddiman, ed. Tectonic uplift and climate change. Plenum, New
York.
Pereira JT, KM Wong 1995 Three new species of Crypteronia
(Crypteroniaceae) from Borneo. Sandakania 6:41–53.
Plummer PS, ER Belle 1995 Mesozoic tectono-stratigraphic evolu-
tion of the Seychelles microcontinent. Sediment Geol 96:73–91.
Posada D, KA Crandall 1998 Modeltest: testing the model of DNA
substitution. Bioinformatics 14:817–818.Qiu YL, JH Lee, F Bernasconi-Quadroni, DE Soltis, PS Soltis, M
Zanis, EA Zimmer, ZD Chen, V Savolainen, MW Chase 1999 The
earliest angiosperms: evidence from mitochondrial, plastid and
nuclear genomes. Nature 402:404–407.
Rambaut A, M Charleston 2001 TreeEdit: an application for
organising, viewing and manipulating sets of phylogenetic trees.
University of Oxford, Oxford.
Raven PH, DI Axelrod 1974 Angiosperm biogeography and past
continental movements. Ann Mo Bot Gard 61:539–673.
Renner SS 2004 Bayesian analysis of combined data partitions, using
multiple calibrations, supports recent arrival of Melastomataceae in
Africa and Madagascar. Am J Bot (in press).
Renner SS, G Clausing, K Meyer 2001 Historical biogeography of
Melastomataceae: the roles of Tertiary migration and long-distance
dispersal. Am J Bot 88:1290–1300.Renner SS, BD Foreman, D Murray 2000 Timing trans-antarctic
disjunctions in the Atherospermataceae (Laurales): evidence from
coding and noncoding chloroplast sequences. Syst Biol 49:579–591.
Renner SS, K Meyer 2001 Melastomeae come full circle: biogeo-
graphic reconstruction and molecular clock dating. Evolution 55:
1315–1324.Richardson JE, FM Weitz, MF Fay, QCB Cronk, HP Linder, G Reeves,
MW Chase 2001 Rapid and ancient origin of species richness in
the Cape Flora of South Africa. Nature 412:181–183.
Rodrıguez F, JF Oliver, A Marın, JR Medina 1990 The general
stochastic model of nucleotide substitution. J Theor Biol 142:
485–501.
Sanderson MJ 1997 A nonparametric approach to estimating di-
vergence times in the absence of rate constancy. Mol Biol Evol 14:
1218–1231.
——— 1998 Estimating rates and time in molecular phylogenies:
beyond the molecular clock? Pages 242–264 in DE Soltis, PS Soltis,
JA Doyle, eds. Molecular sytematics of pants. II. DNA sequencing.
Kluwer, Boston.
——— 2002 Estimating absolute rates of molecular evolution and
divergence times: a penalized likelihood approach. Mol Biol Evol
19:101–109.——— 2003 r8s: inferring absolute rates of molecular evolution and
divergence times in the absence of a molecular clock. Bioinformatics
19:301–302.
Sanderson MJ, JA Doyle 2001 Sources of error and confidence
intervals in estimating the age of angiosperms from rbcL and 18S
rDNA data. Am J Bot 88:1499–1516.
Schonenberger J, E Conti 2003 Molecular phylogeny and floral
evolution of Penaeaceae, Oliniaceae, Rhynchocalycaceae, and
Alzateaceae (Myrtales). Am J Bot 90:293–309.
Scotese CR, LM Gahagan, RL Larson 1988 Plate tectonic recon-
structions of the Cretaceous and Cenozoic ocean basins. Tectono-
physics 155:27–48.
Smith JF, KS Sytsma, JS Shoemaker, RL Smith 1991 A qualitative
comparison of total cellular DNA extraction protocols. Phytochem
Bull 23:2–9.Sober E 1988 The conceptual relationship of cladistic phylogenetics
and vicariance biogeography. Syst Zool 37:245–253.
Stace CA 1989 Dispersal versus vicariance: no contest. J Biogeogr 16:
200–201.
Storey M, JJ Mahoney, AD Saunders, RA Duncan, SP Kelley, MF
Coffin 1995 Timing of hot spot–related volcanism and the breakup
of Madagascar and India. Science 267:852–855.
INTERNATIONAL JOURNAL OF PLANT SCIENCES

Swofford DL 2001 PAUP* 4.0b10: phylogenetic analysis using
parsimony (*and other methods). Sinauer, Sunderland, Mass.
Takhtajan A 1987 Flowering plant origin and dispersal: the cradle of
the angiosperms revisited. Pages 26–31 in TC Whitmore, ed.
Biogeographical evolution of the Malay Archipelago. Clarendon,
Oxford.Tavare S, CR Marshall, O Will, C Soligo, RD Martin 2002 Using the
fossil record to estimate the age of the last common ancestor of
extant primates. Nature 416:726–729.
Thompson JD, TJ Gibson, F Plewniak, F Jeanmougin, DG
Higgins 1997 The ClustalX windows interface: flexible strategies
for multiple sequence alignment aided by quality analysis tools.
Nucleic Acids Res 24:4876–4882.
Thorne JL, H Kishino 2002 Divergence time and evolutionary rate
estimation with multilocus data. Syst Biol 51:689–702.
van Beusekom-Osinga RJ 1977 Crypteroniaceae. Flora Malesiana
82:198–204.
van Beusekom-Osinga RJ, CF van Beusekom 1975 Delimitation and
subdivision of the Crypteroniaceae (Myrtales). Blumea 22:255–266.
van Vliet GJCM, P Baas 1975 Comparative anatomy of theCrypteroniaceae. Blumea 22:175–195.
Wikstrom N, V Savolainen, MW Chase 2001 Evolution of the
angiosperms: calibrating the family tree. Proc R Soc Lond B BiolSci 268:2211–2220.
Wiley EO 1988 Vicariance biogeography. Annu Rev Ecol Syst 19:
513–542.
Willis JK, JC McElwain 2002 The evolution of plants. OxfordUniversity Press, New York.
Yang Z 1993 Maximum likelihood estimation of phylogeny from
DNA sequences when substitution rates differ over sites. Mol Biol
Evol 10:1396–1401.Yang Z, AD Yoder 2003 Comparison of likelihood and Bayesian
methods for estimating divergence times using multiple gene loci
and calibration points, with application to a radiation ofcute-looking mouse lemur species. Syst Biol 52:1–12.
Zurawski G, B Perrot, W Bottomley, PR Whitfield 1981 The
structure of the gene for the large subunit of ribulose-1,5-
bisphosphate carboxylase from spinach chloroplast DNA. NucleicAcids Res 14:3251–3270.
RUTSCHMANN ET AL.—TESTING THE OUT-OF-INDIA HYPOTHESIS