Embed Size (px)
DESCRIPTION
TESTING EPICLIN
Citation preview

1
Clinical Epidemiology
Interpreting Medical Tests and Other Evidence

2
Interpreting Medical Tests and Other Evidence
Dichotomous model Developmental characteristics
Test parameters Cut-points and Receiver Operating Characteristic
(ROC) Clinical Interpretation
Predictive values: keys to clinical practice Bayes’ Theorem and likelihood ratios Pre- and post-test probabilities and odds of disease Test interpretation in context True vs. test prevalence
Combination tests: serial and parallel testing Disease Screening Why everything is a test!
3
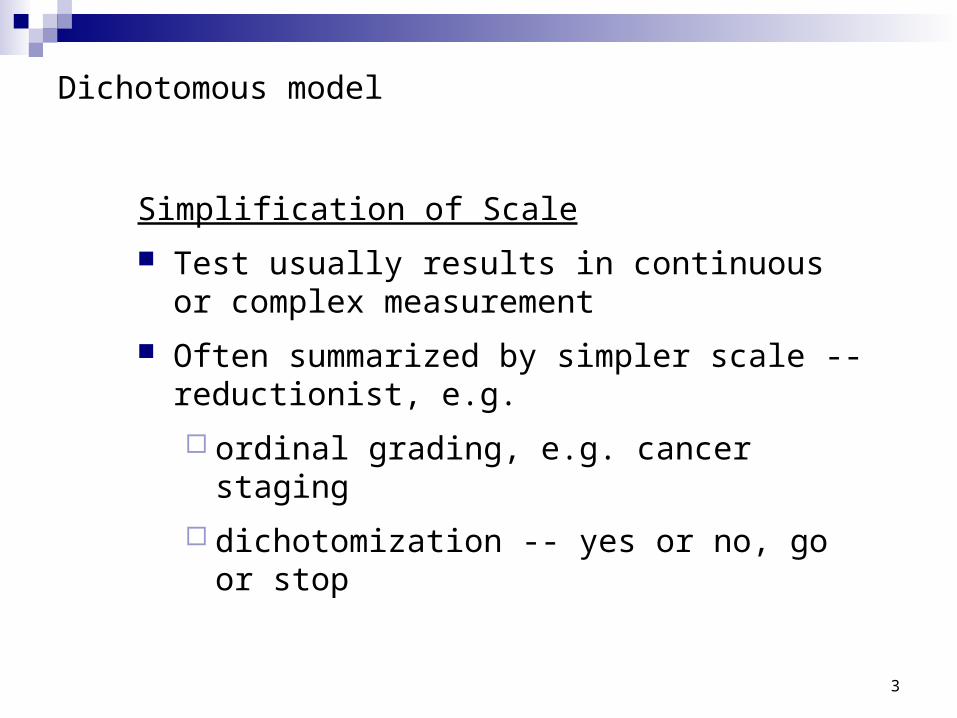
Dichotomous model
Simplification of Scale
Test usually results in continuous or complex measurement
Often summarized by simpler scale -- reductionist, e.g.
ordinal grading, e.g. cancer staging
dichotomization -- yes or no, go or stop
4
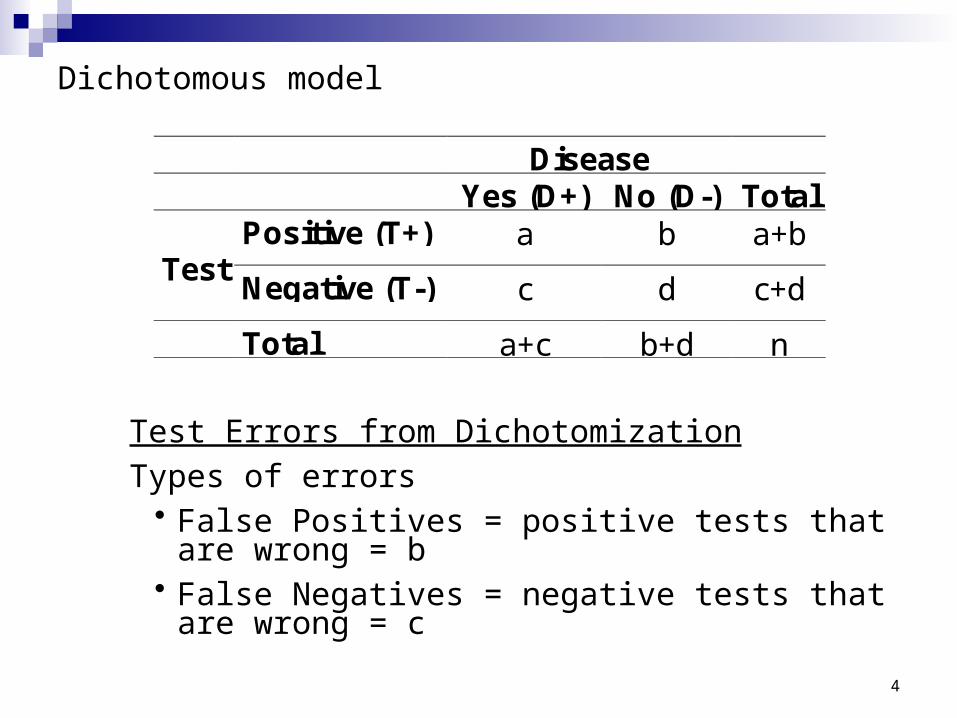
Dichotomous model
DiseaseYes (D+) No (D-) Total
Positive (T+) a b a+bTest
Negative (T-) c d c+d
Total a+c b+d n
Test Errors from Dichotomization
Types of errors• False Positives = positive tests that are wrong = b• False Negatives = negative tests that are wrong = c

5
Developmental characteristics: test parameters
Error rates as conditional probabilities Pr(T+|D-) = False Positive Rate (FP rate) =
b/(b+d) Pr(T-|D+) = False Negative Rate (FN rate) =
c/(a+c)
DiseaseYes (D+) No (D-) Total
Positive (T+) a b a+bTest
Negative (T-) c d c+d
Total a+c b+d n
6
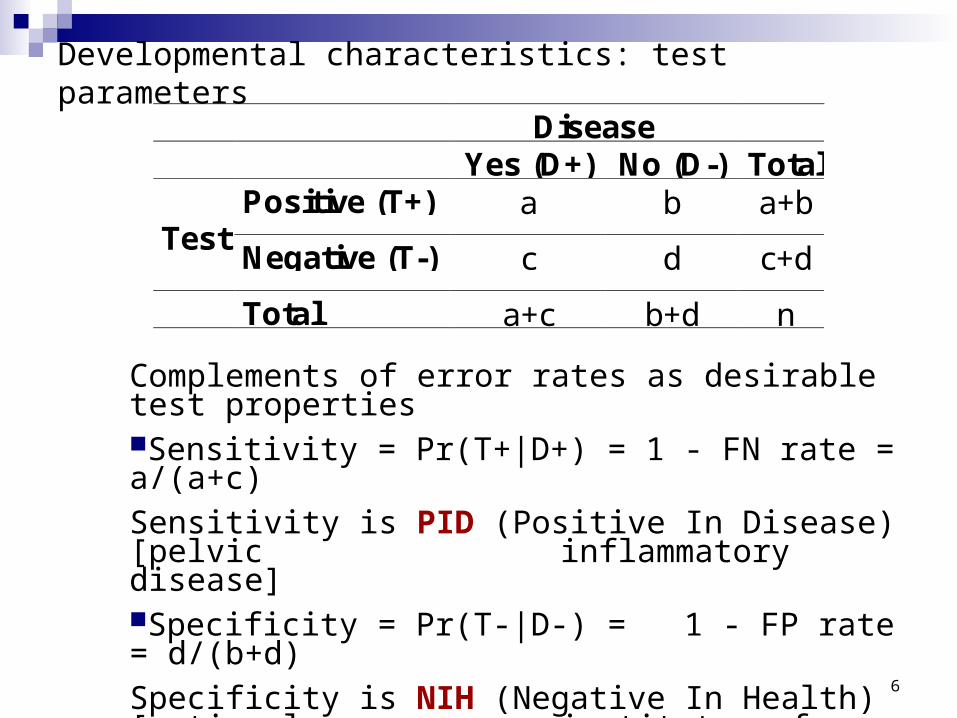
Developmental characteristics: test parameters
Complements of error rates as desirable test propertiesSensitivity = Pr(T+|D+) = 1 - FN rate = a/(a+c)
Sensitivity is PID (Positive In Disease) [pelvic inflammatory disease]
Specificity = Pr(T-|D-) = 1 - FP rate = d/(b+d)
Specificity is NIH (Negative In Health) [national institutes of health]
DiseaseYes (D+) No (D-) Total
Positive (T+) a b a+bTest
Negative (T-) c d c+d
Total a+c b+d n

7
Typical setting for finding Sensitivity and Specificity Best if everyone who gets the new test
also gets “gold standard” Doesn’t happen Even reverse doesn’t happen Not even a sample of each (case-control
type) Case series of patients who had both tests
8
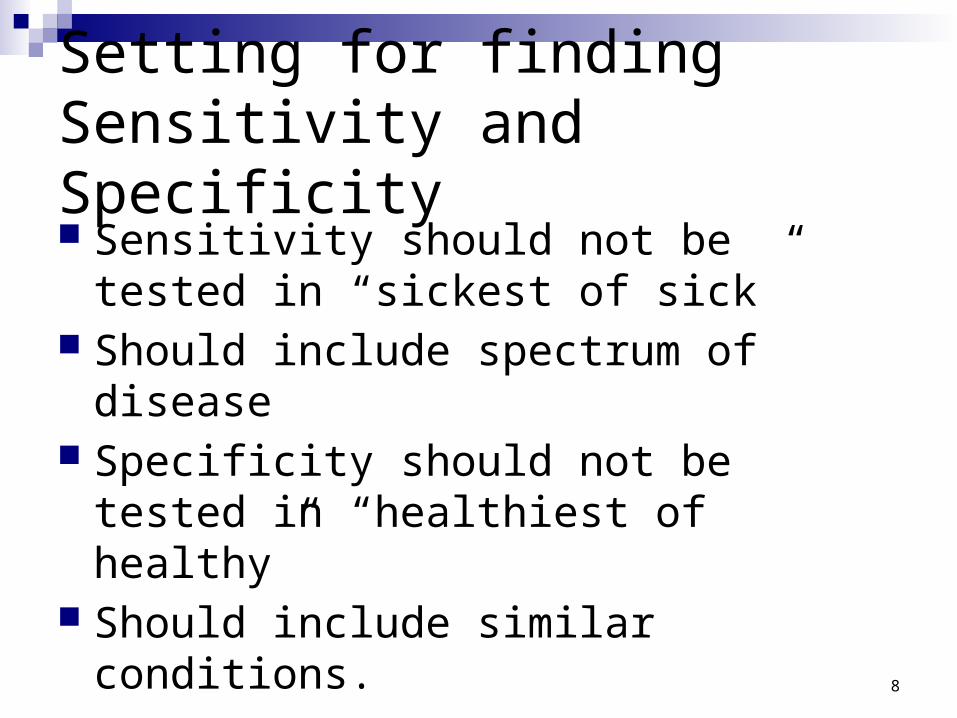
Setting for finding Sensitivity and Specificity Sensitivity should not be tested in “sickest
of sick” Should include spectrum of disease Specificity should not be tested in
“healthiest of healthy” Should include similar conditions.

9
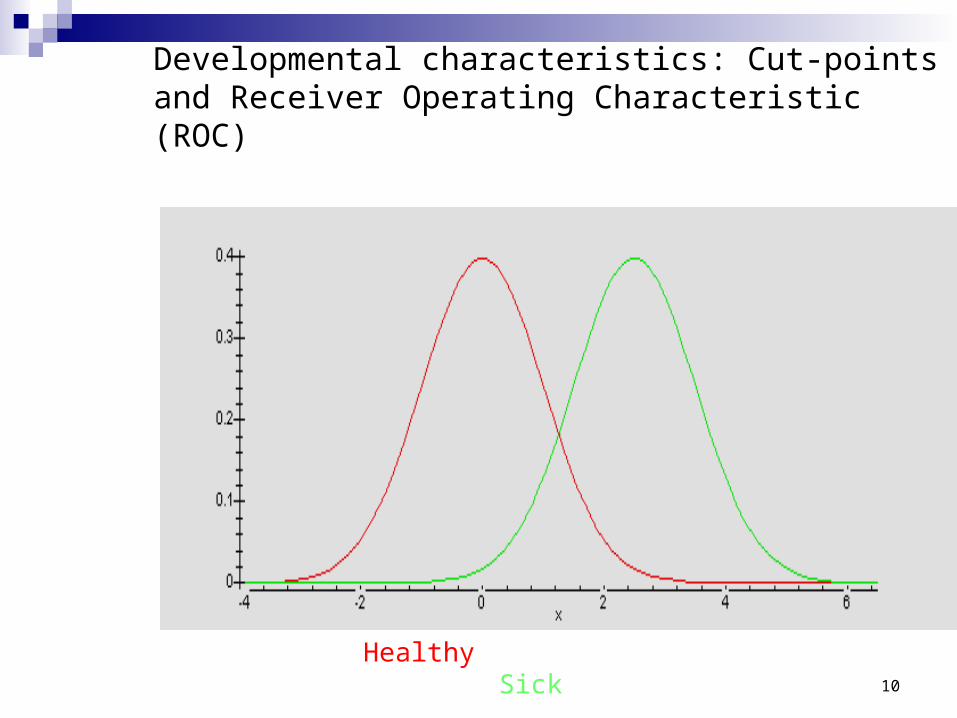
Developmental characteristics: Cut-points and Receiver Operating Characteristic (ROC)
Healthy
10
Developmental characteristics: Cut-points and Receiver Operating Characteristic (ROC)
Healthy Sick

11
Developmental characteristics: Cut-points and Receiver Operating Characteristic (ROC)
Fals pos= 20% True pos=82%

12
Developmental characteristics: Cut-points and Receiver Operating Characteristic (ROC)
Fals pos= 9% True pos=70%

13
Developmental characteristics: Cut-points and Receiver Operating Characteristic (ROC)
F pos= 100% T pos=100%

14
Developmental characteristics: Cut-points and Receiver Operating Characteristic (ROC)
F pos= 50% T pos=90%

15

16
Developmental characteristics: Cut-points and Receiver Operating Characteristic (ROC)
Receiver Operating Characteristic (ROC)
17
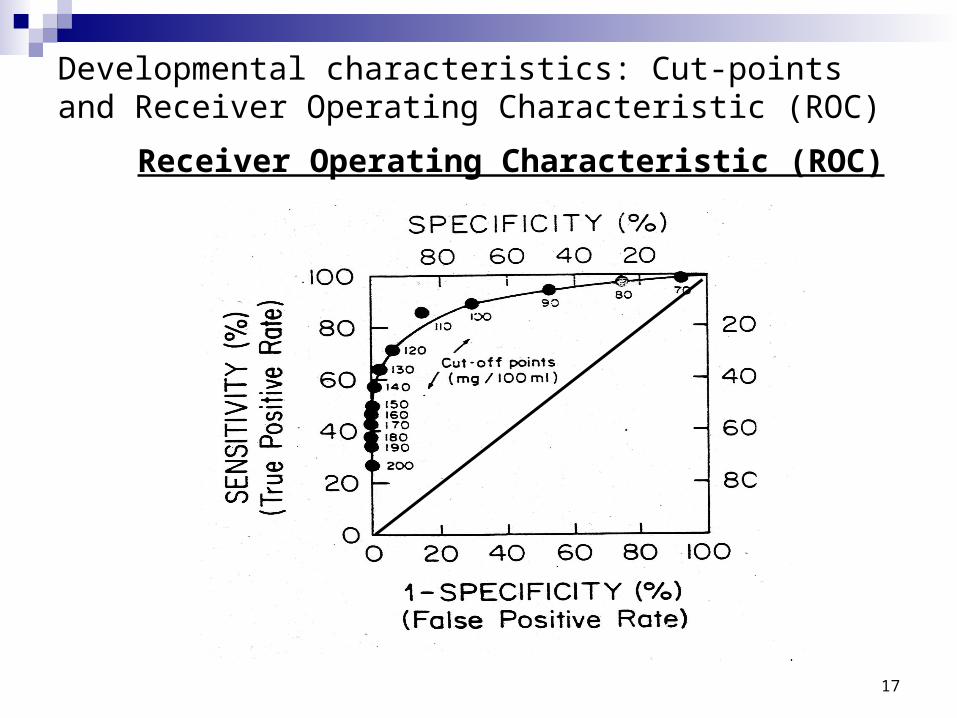
Developmental characteristics: Cut-points and Receiver Operating Characteristic (ROC)
Receiver Operating Characteristic (ROC)
18
Receiver Operating Characteristic (ROC)
ROC Curve allows comparison of different tests for the same condition without (before) specifying a cut-off point.
The test with the largest AUC (Area under the curve) is the best.

19
20
Developmental characteristics: test parameters
Problems in Assessing Test Parameters
Lack of objective "gold standard" for testing, because
unavailable, except e.g. at autopsy
too expensive, invasive, risky or unpleasant
Paucity of information on tests in healthy
too expense, invasive, unpleasant, risky, and possibly unethical for use in healthy
Since test negatives are usually not pursued with more extensive work-ups, lack of information on false negatives

21
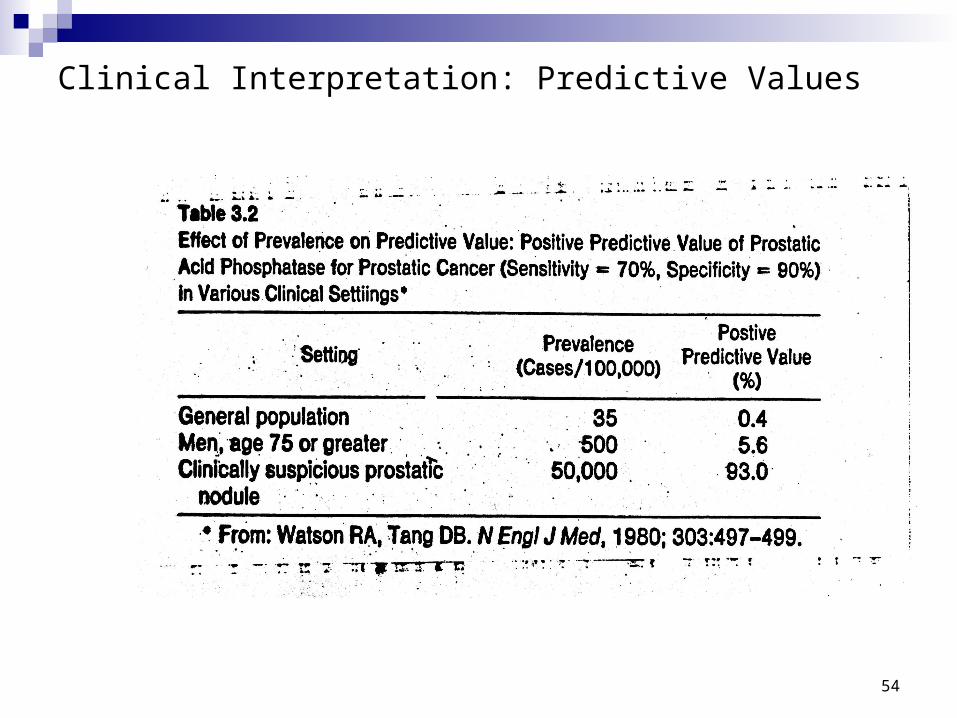
Clinical Interpretation: Predictive Values
Most test positives below are sick. But this is because there are as many sick as healthy people overall. What if fewer people were sick, relative to the healthy?
22
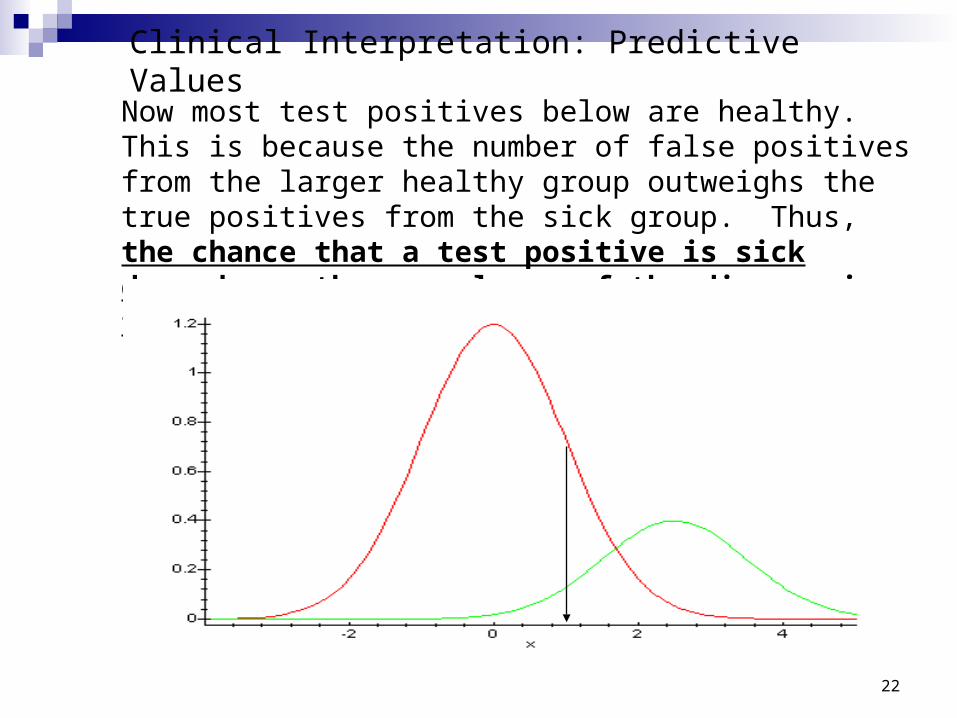
Clinical Interpretation: Predictive Values
Now most test positives below are healthy. This is because the number of false positives from the larger healthy group outweighs the true positives from the sick group. Thus, the chance that a test positive is sick depends on the prevalence of the disease in the group tested!

23
Clinical Interpretation: Predictive Values
But
• the prevalence of the disease in the group tested depends on whom you choose to test
• the chance that a test positive is sick, as well as the chance that a test negative is healthy, are what a physician needs to know.
These are not sensitivity and specificity!
The numbers a physician needs to know are the predictive values of the test.
24
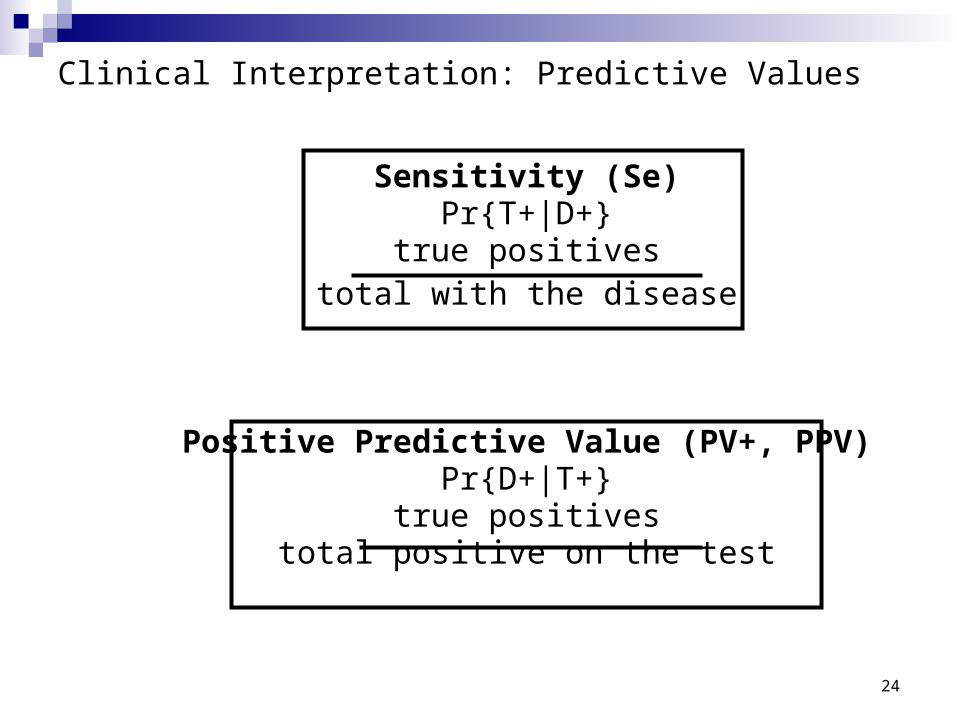
Clinical Interpretation: Predictive Values
Sensitivity (Se)Pr{T+|D+}
true positivestotal with the disease
Positive Predictive Value (PV+, PPV)Pr{D+|T+}
true positivestotal positive on the test
25
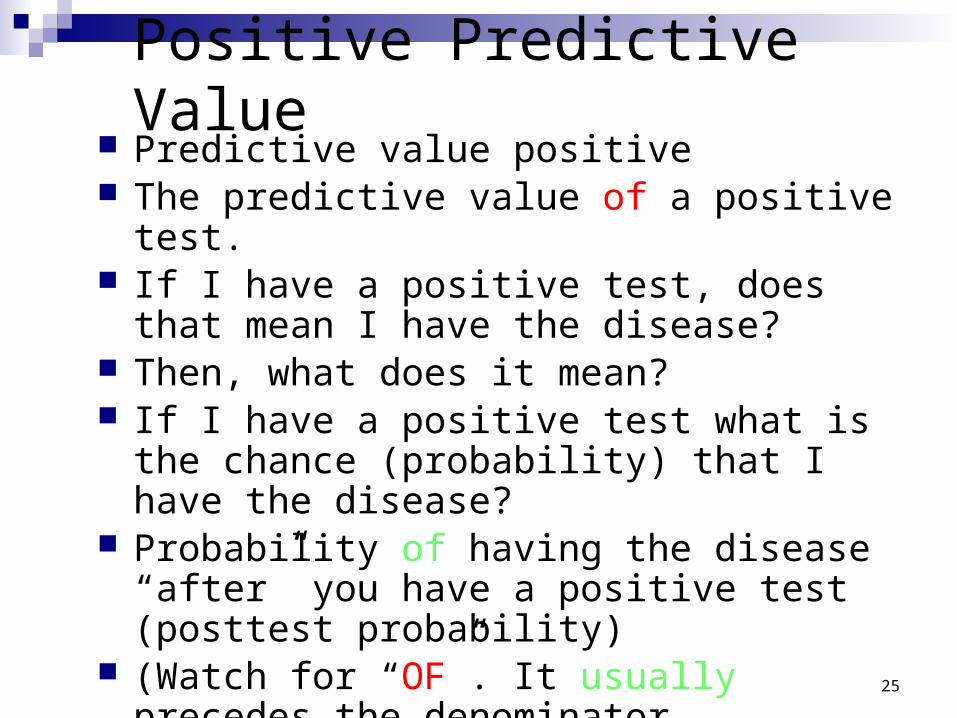
Positive Predictive Value Predictive value positive The predictive value of a positive test. If I have a positive test, does that mean I have
the disease? Then, what does it mean? If I have a positive test what is the chance
(probability) that I have the disease? Probability of having the disease “after” you
have a positive test (posttest probability) (Watch for “OF”. It usually precedes the
denominator Numerator is always PART of the denominator)

26
Clinical Interpretation: Predictive Values
T+
D+
T+andD+
27
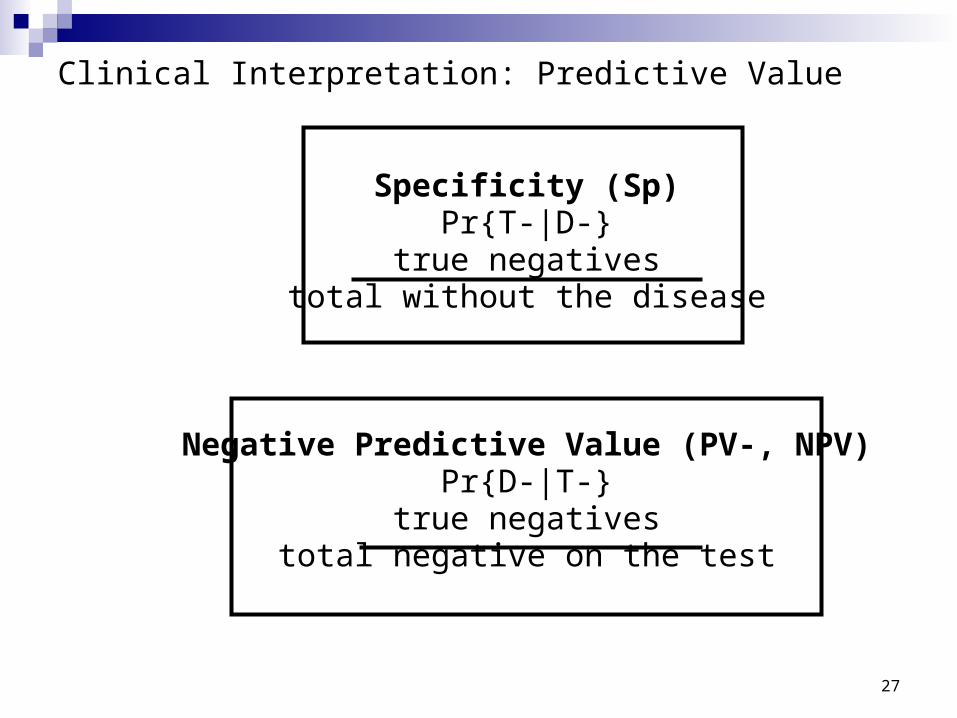
Clinical Interpretation: Predictive Value
Specificity (Sp)Pr{T-|D-}
true negativestotal without the disease
Negative Predictive Value (PV-, NPV)Pr{D-|T-}
true negativestotal negative on the test

28
Negative Predictive Value
Predictive value negative If I have a negative test, does that mean I
don’t have the disease? What does it mean? If I have a negative test what is the chance
I don’t have the disease? The predictive value of a negative test.

29
Mathematicians don’t Like PV-
PV- “probability of no disease given a negative test result”
They prefer (1-PV-) “probability of disease given a negative test result”
Also referred to as “post-test probability” (of a negative test)
Ex: PV- = 0.95 “post-test probability for a negative test result = 0.05”
Ex: PV+ = 0.90 “post-test probability for a positive test result = 0.90”

30
Mathematicians don’t Like Specificity either They prefer false positive rate, which is 1 –
specificity.
31
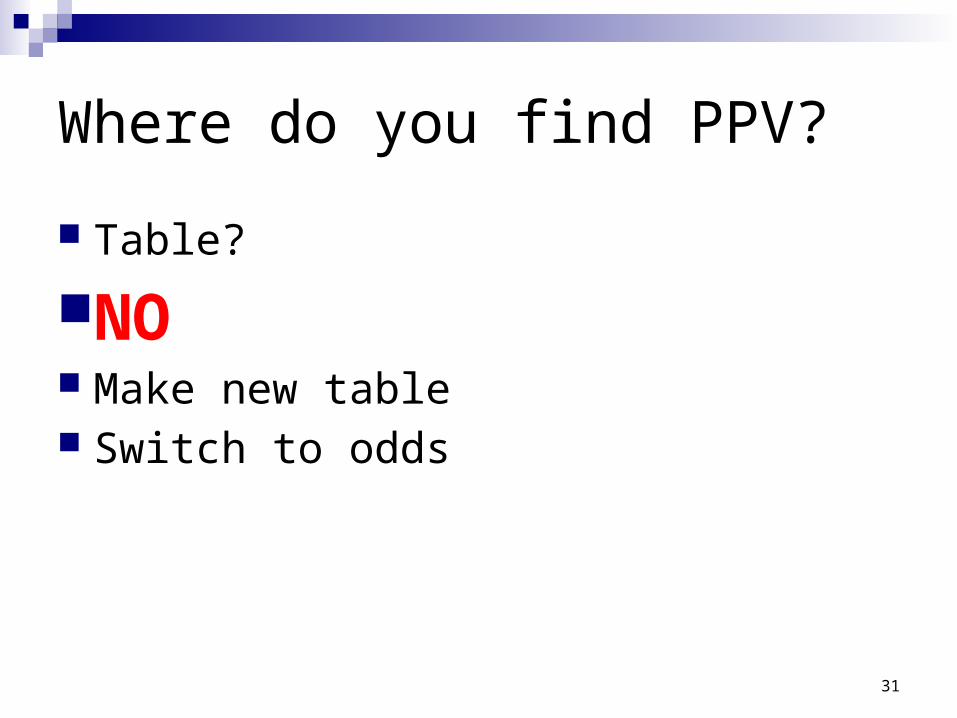
Where do you find PPV?
Table?
NO Make new table Switch to odds

32
Use This Table ? NO Disease
Test Result
+ - Total
+ 95 8 103 - 5 92 97
Total 100 100 200 You would conclude that PPV is 95/103 = 92%

33
Make a New Table
Disease Test
Result + - Total
+ 95 72 167 - 5 828 833
Total 100 900 1000

34
Make a New Table
Disease Test
Result + - Total
+ 95 72 167 - 5 828 833
Total 100 900 1000 Probability of having the disease before testing was 10%. (pretest probability prevalence) Posttest probability (PPV) = 95/167 = 57% So we went up from 10% probability to 57% after having a positive test
35
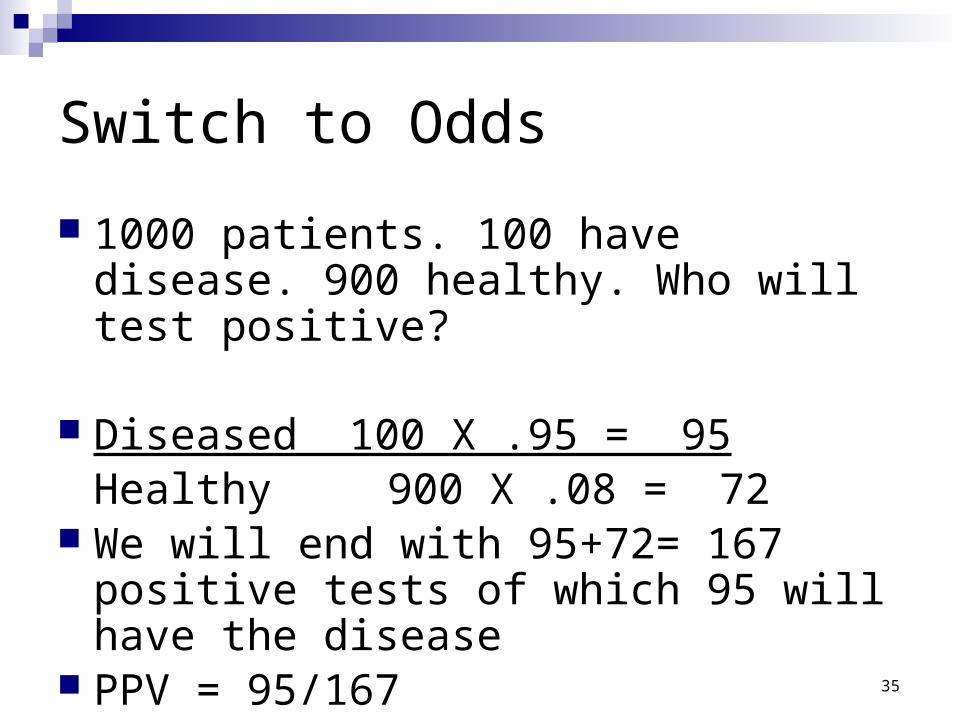
Switch to Odds
1000 patients. 100 have disease. 900 healthy. Who will test positive?
Diseased 100 X .95 = 95Healthy 900 X .08 = 72
We will end with 95+72= 167 positive tests of which 95 will have the disease
PPV = 95/167

36
From pretest to posttest odds
Diseased 100 X.95 = 95
Healthy 900 X.08 = 72 100 = Pretest odds
900 .95 = Sensitivity = prob. Of positive test in dis
.08 1-Specificity prob. Of positive test in hlth
95 =Posttest odds. Probability is 95/(95+72)
72

37
Remember to switch back to probability

38
What is this second fraction?
Likelihood Ratio Positive Multiplied by any patient’s pretest odds
gives you their posttest odds. Comparing LR+ of different tests is
comparing their ability to “rule in” a diagnosis.
As specificity increases LR+ increases and PPV increases (Sp P In)
39
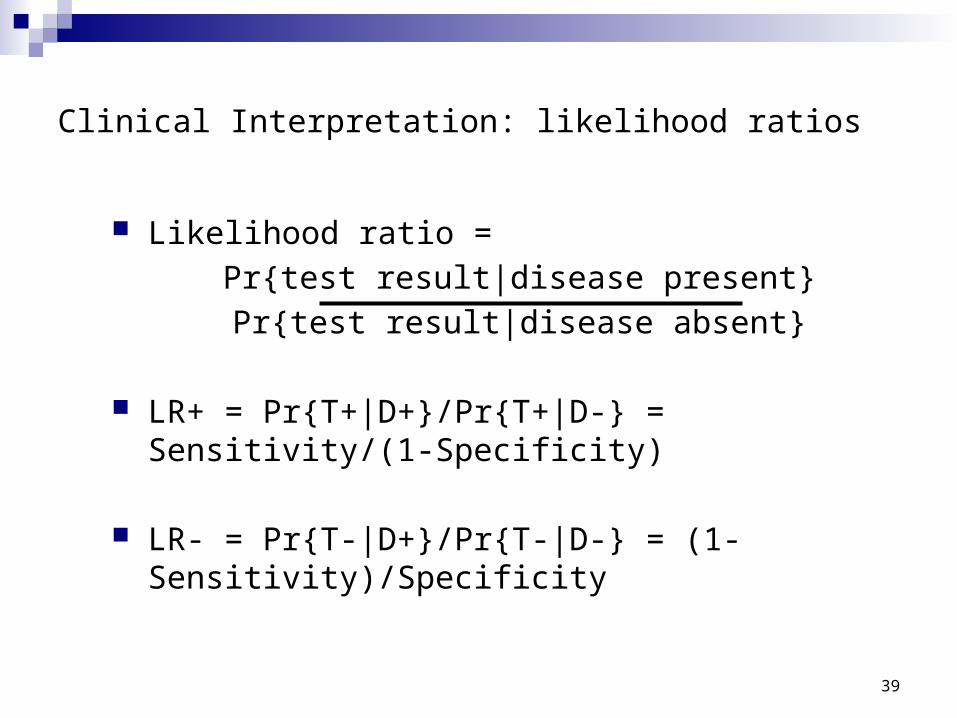
Clinical Interpretation: likelihood ratios
Likelihood ratio =
Pr{test result|disease present}
Pr{test result|disease absent}
LR+ = Pr{T+|D+}/Pr{T+|D-} = Sensitivity/(1-Specificity)
LR- = Pr{T-|D+}/Pr{T-|D-} = (1-Sensitivity)/Specificity
40
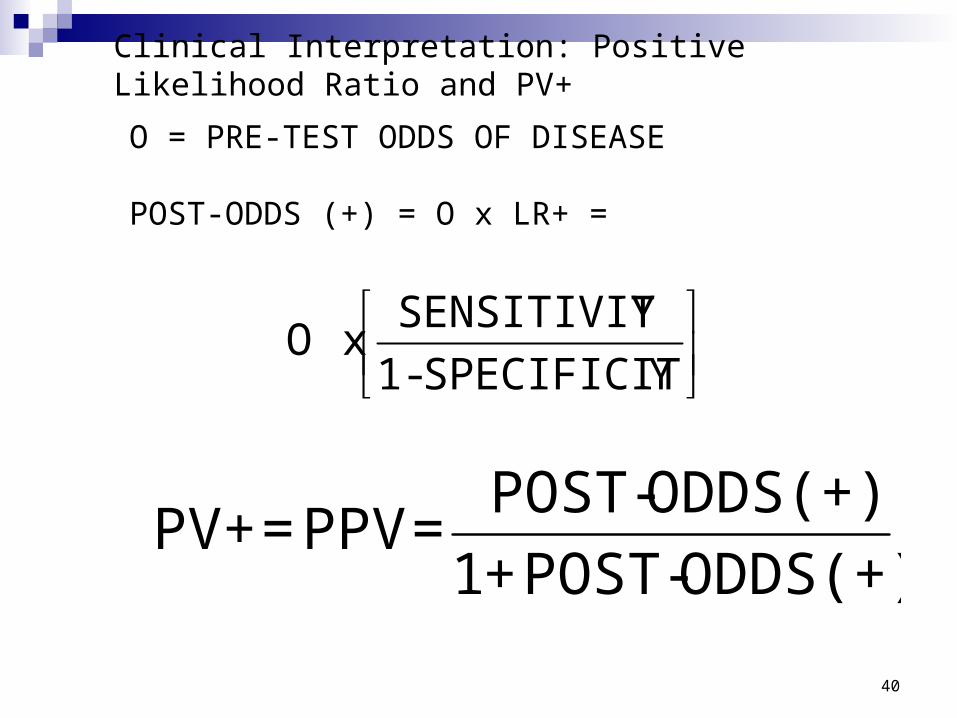
Clinical Interpretation: Positive Likelihood Ratio and PV+
O = PRE-TEST ODDS OF DISEASE
POST-ODDS (+) = O x LR+ =
YSPECIFICIT - 1
YSENSITIVIT x O
ODDS(+)POST-+1
ODDS(+)POST- = PPV = PV+
41
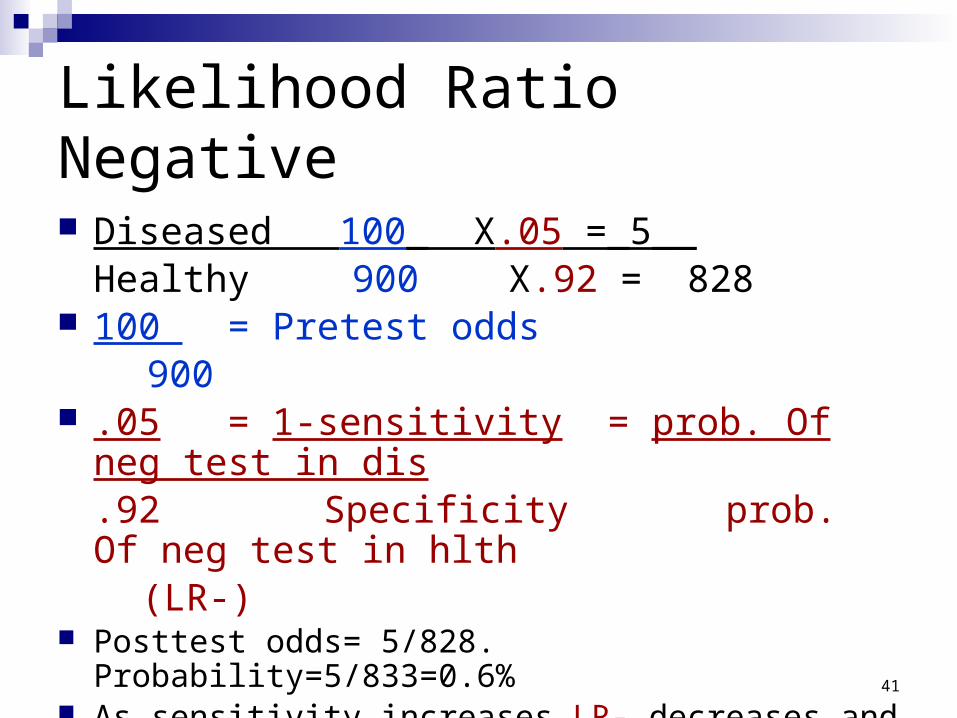
Likelihood Ratio Negative
Diseased 100_ X.05 =_5__Healthy 900 X.92 = 828
100 = Pretest odds 900 .05 = 1-sensitivity = prob. Of neg test in dis
.92 Specificity prob. Of neg test in hlth(LR-)
Posttest odds= 5/828. Probability=5/833=0.6% As sensitivity increases LR- decreases and NPV
increases (Sn N Out)
42
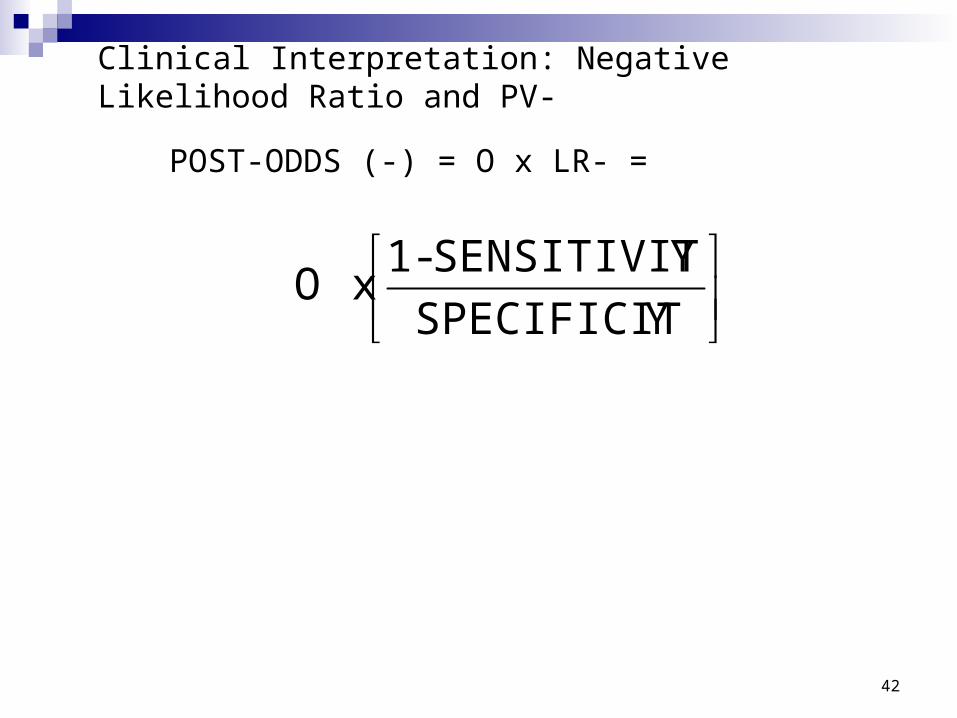
Clinical Interpretation: Negative Likelihood Ratio and PV-
POST-ODDS (-) = O x LR- =
YSPECIFICIT
YSENSITIVIT-1 x O
43
Remember to switch to probability and also to use 1 minus

44
Post test probability given a negative test
= Post odds (-)/ 1- post odds (-)
ODDS(-)POST-+1
ODDS(-)POST- -1= NPV = PV-

45
Value of a diagnostic test depends on the prior probability of disease
Prevalence (Probability) = 5%
Sensitivity = 90% Specificity = 85% PV+ = 24% PV- = 99% Test not as useful
when disease unlikely
Prevalence (Probability) = 90%
Sensitivity = 90% Specificity = 85% PV+ = 98% PV- = 49% Test not as useful
when disease likely

46
Clinical interpretation of post-test probability
Don't treat for disease
Do further diagnostic
testingTreat for disease
Probability of disease:
0 1
Testing threshold
Treatment threshold
Disease ruled out
Disease ruled in

47
Advantages of LRs
The higher or lower the LR, the higher or lower the post-test disease probability
Which test will result in the highest post-test probability in a given patient?
The test with the largest LR+ Which test will result in the lowest post-test
probability in a given patient? The test with the smallest LR-

48
Advantages of LRs
Clear separation of test characteristics from disease probability.

49
Likelihood Ratios - Advantage
Provide a measure of a test’s ability to rule in or rule out disease independent of disease probability
Test A LR+ > Test B LR+Test A PV+ > Test B PV+ always!
Test A LR- < Test B LR-Test A PV- > Test B PV- always!

50
Using Likelihood Ratios to Determine Post-Test Disease Probability
Pre-test probability of disease
Pre-test odds of disease
Likelihood ratio
Post-test odds of disease
Post-test probability of disease

51

52
Predictive ValuesAlternate formulations:Bayes’ Theorem
PV+ =
Se Pre-test Prevalence
Se Pre-test Prevalence + (1 - Sp) (1 - Pre-test Prevalence)
High specificity to “rule-in” disease
PV- =
Sp (1 - Pre-test Prevalence)
Sp (1 - Pre-test Prevalence) + (1 - Se) Pre-test Prevalence
High sensitivity to “rule-out” disease

53
Clinical Interpretation: Predictive Values
PV+ And PV-1 Of Electrocardiographic Status2
For Angiographically Verified3 Coronary ArteryDisease, By Age And Sex Of Patient
Sex Age PV+ (%) PV- (%)
F <40 32 88F 40-50 46 80F 50+ 62 68
M <40 62 68M 40-50 75 54M 50+ 85 38
1. Based on statistical smoothing of results from 78 patients referred to NCMemorial Hospital for chest pain. Each value has a standard error of 6-7%.
2. At least one millivolt horizontal st segment depression.3. At least 50% stenosis in one or more main coronary vessels.
54
Clinical Interpretation: Predictive Values

55
If Predictive value is more useful why not reported?
Should they report it? Only if everyone is tested. And even then. You need sensitivity and specificity from
literature. Add YOUR OWN pretest probability.

56
So how do you figure pretest probability? Start with disease prevalence. Refine to local population. Refine to population you serve. Refine according to patient’s presentation. Add in results of history and exam (clinical
suspicion). Also consider your own threshold for testing.

57
Why everything is a test
Once a tentative dx is formed, each piece of new information -- symptom, sign, or test result -- should provide information to rule it in or out.
Before the new information is acquired, the physician’s rational synthesis of all available information may be embodied in an estimate of pre-test prevalence.
Rationally, the new information should update that estimate to a post-test prevalence, in the manner described above for a diagnostic test.
In practice it is rare to proceed from precise numerical estimates. Nevertheless, implicit understanding of this logic makes clinical practice more rational and effective.

58
Pretest Probability: Clinical Significance Expected test result means more than
unexpected. Same clinical findings have different
meaning in different settings (e.g.scheduled versus unscheduled visit). Heart sound, tender area.
Neurosurgeon. Lupus nephritis.

59
What proportion of all patients will test positive?
Diseased X sensitivity
+ Healthy X (1-specificity) Prevalence X sensitivity +
(1-prevalence)(1-specificity) We call this “test prevalence” i.e. prevalence according to the test.

60
SENS = SPEC = 95%
What if test prevalence is 5%? What if it is 95%?

61
62
Combination tests: serial and parallel testing
Combinations of specificity and sensitivity superior to the use of any single test may sometimes be achieved by strategic uses of multiple tests. There are two usual ways of doing this.
Serial testing: Use >1 test in sequence, stopping at the first negative test. Diagnosis requires all tests to be positive.
Parallel testing: Use >1 test simultaneously, diagnosing if any test is positive.
63
Combination tests: serial testing
Doing the tests sequentially, instead of together with the same decision rule, is a cost saving measure.
This strategy increases specificity above that of any of the individual tests,
but degrades sensitivity below that of any of them singly.
However, the sensitivity of the serial combination may still be higher than would be achievable if the cut-point of any single test were raised to achieve the same specificity as the serial combination.

64
Combination tests: serial testing Demonstration: Serial Testing with Independent Tests
SeSC = sensitivity of serial combinationSpSC = specificity of serial combination
SeSC = Product of all sensitivities= Se1X Se2X…etc Hence SeSC < all individual Se
1-SpSC = Product of all(1-Sp)
Hence SpSC > all individual Spi
Serial test to rule-in disease
65
Combination tests: parallel testing
Parallel Testing Usual decision strategy diagnoses if any test positive.
This strategy increases sensitivity above that of any of the individual tests,
but degrades specificity below that of any individual test.
However, the specificity of the combination may be
higher than would be achievable if the cut-point of any single test were lowered to achieve the same sensitivity as the parallel combination.
66
Combination tests: parallel testing Demonstration: Parallel Testing with Independent Tests
SePC = sensitivity of parallel combinationSpPC = specificity of parallel combination
1-SePC = Product of all(1 - Se)
Hence SePC > all individual Se
SpPC = Product of all Sp
Hence SpPC < all individual Spi
Parallel test to rule-out disease
67
Clinical settings for parallel testing Parallel testing is used to rule-out serious but
treatable conditions (example rule-out MI by CPK, CPK-MB, Troponin, and EKG. Any positive is considered positive)
When a patient has non-specific symptoms, large list of possibilities (differential diagnosis). None of the possibilities has a high pretest probability. Negative test for each possibility is enough to rule it out. Any positive test is considered positive.

68
Because specificity is low, further testing is now required (serial testing) to make a diagnosis (Sp P In).

69
Clinical settings for serial testing
When treatment is hazardous (surgery, chemotherapy) we use serial testing to raise specificity.(Blood test followed by more tests, followed by imaging, followed by biopsy).
70
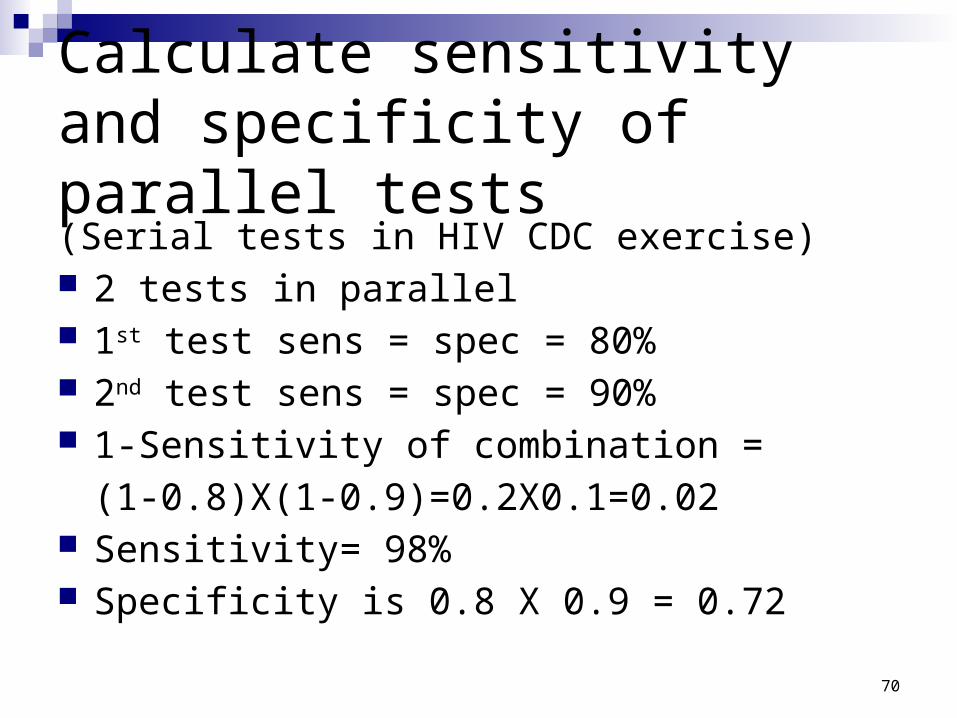
Calculate sensitivity and specificity of parallel tests(Serial tests in HIV CDC exercise) 2 tests in parallel 1st test sens = spec = 80% 2nd test sens = spec = 90% 1-Sensitivity of combination =
(1-0.8)X(1-0.9)=0.2X0.1=0.02 Sensitivity= 98% Specificity is 0.8 X 0.9 = 0.72
71
Typical setting for finding Sensitivity and Specificity Best if everyone who gets the new test
also gets “gold standard” Doesn’t happen Even reverse doesn’t happen Not even a sample of each (case-control
type) Case series of patients who had both tests

72
EXAMPLE
Patients who had both a stress test and cardiac catheterization.
So what if patients were referred for catheterization based on the results of the stress test?
Not a random or even representative sample.
It is a biased sample.

73
74
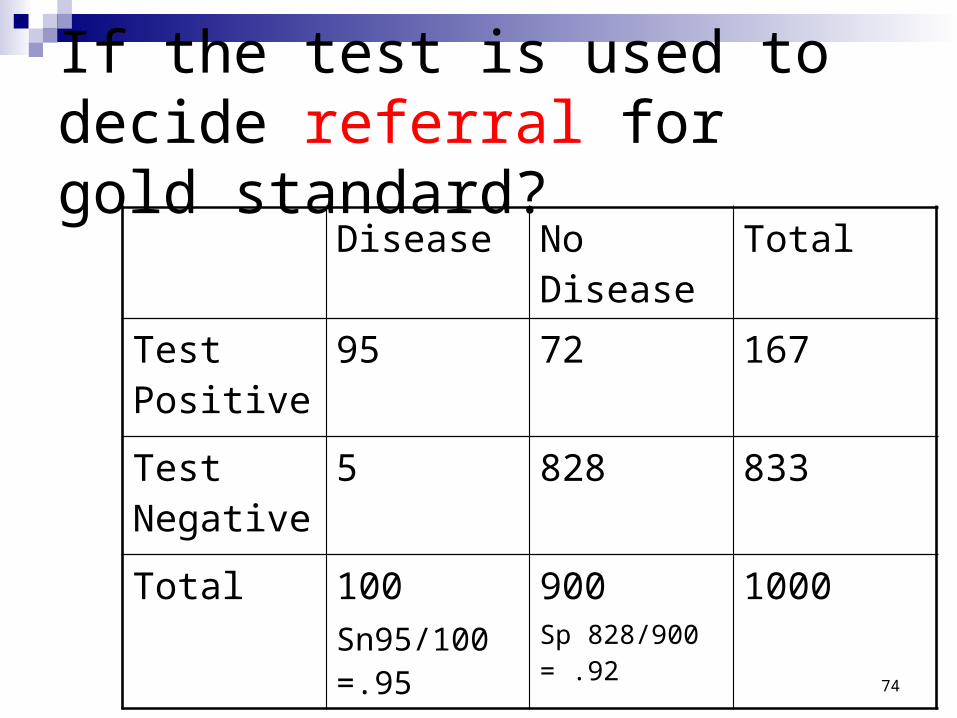
If the test is used to decide referral for gold standard?
Disease No Disease
Total
Test Positive
95 72 167
Test Negative
5 828 833
Total 100Sn95/100 =.95
900Sp 828/900 = .92
1000

75
If the test is used to decide referral for gold standard?
Disease No Disease
Total
Test Positive
9585
7265
167167150
Test Negative
51
82899
833833 100
Total 10086Sn85/86=.99
900164Sp 99/164=.4
1000

76
If the test is used to decide referral for gold standard?
Disease No Disease Total
Test Positive
85 65 150
Test Negative
1 99 100
Total 86Sn85/86=.99
164Sp 99/164=.4
250