Embed Size (px)
Citation preview
DIAGNOSTIC ACCREDITATION PROGRAM
Radiology and CT Quality Control Procedures Workbook

College of Physicians and Surgeons of British Columbia
Radiology and CT Quality Control Procedures Workbook
Quality Control Procedures – Radiography/CR/DR 1
Quality Control Procedures – Radiography/CR/DR Safety Code 35 Summary For more detail about each quality control (QC) procedure select the relevant link in the tables below.
Daily Quality Control Tests
Quality Control Procedures Film CR System DR System
Equipment Warm-up D1 D1 D1
Meters Operation D2 D2 D2
Equipment Conditions D3 D3 D3
Darkroom Cleanliness D5
Film Processor Function D6
Overall Visual Assessment of Electronic Display Devices
D7 D7 D7
Normal Font – Required Tests
Italics – Recommended
Abbreviations used
FS Film-screen CR Computed radiography DR Digital radiography RS Radioscopy (fluoroscopy and angiography) CT Computed tomography SF Spot film or acquisition
Weekly, Monthly and Quarterly Quality Control Tests
Quality Control Procedures Film CR DR Comments
Weekly Quality Control Tests
Visual Inspection of Cleanliness of Imaging Systems
W1-FS W1-CR W1-DR Inspect screens/CR plates/DR housing
Viewbox Condition W2 W2 W2 Cleanliness, luminance
Laser Film Printer Operation W3 W3 Print pattern such as SMPTE
Monthly Quality Control Tests
Cassette, Screen, and Imaging Plate Cleaning
M1-FS M1-CR Clean screens/CR plates/DR housing
Darkroom Temperature and Humidity Conditions
M2 Temp: 18-23C; Humidity 40-60%

College of Physicians and Surgeons of British Columbia
Radiology and CT Quality Control Procedures Workbook
Quality Control Procedures – Radiography/CR/DR 2
Quality Control Procedures Film CR DR Comments
Darkroom Light Conditions M3 Check for light tightness
Film Processor Operation M4 Temp ± 0.5C; Developer and fixer correct
Retake Analysis M5 M5 M5 For film, collect discards; for CR and DR use manufacturers software
Electronic Display Device Performance
M6 M6 M6 Display pattern such as SMPTE on all image display stations
Laser Film Printer Operation M7 M7 • Print pattern such as SMPTE
• Check for 0/5% and 95/100% patch visibility
• Optical Density of 10% to 90% patches
• No artifacts or geometrical distortion greater than 1mm
Quarterly Quality Control Tests
Collimator Operation Q1 Q1 Q1 Ensure smooth operation
Interlocks Q2 Q2 Q2 Check function of any interlocks
Annual Quality Control Tests
Quality Control Procedures Film CR DR Comments
Performance
Safelight Test Y1
Film/Screen Contact Y2
Accuracy of Loading Factors Y3 Y3 Y3 mAs Linearity
Radiation Output Reproducibility Y4 Y4 Y4 Reproducibility
Radiation Output Linearity Y5 Y5 Y5 Output with mAs
X-ray Beam Filtration Y6 Y6 Y6 HVL
Automatic Exposure Control Y7-FS Y7-CR Y7-DR Check AEC for all kVps and thicknesses
X-ray Field and Light Field Alignment
Y8-9 Y8-9 Y8-9 Congruency of X-ray beam and light field edges
X-ray Beam Collimation Y8-9 Y8-9 Y8-9 Congruency of x-ray beam and light field centres

College of Physicians and Surgeons of British Columbia
Radiology and CT Quality Control Procedures Workbook
Quality Control Procedures – Radiography/CR/DR 3
Quality Control Procedures Film CR DR Comments
Image Quality
Grid Performance Y10 Y10 Y10 Check uniformity and movement of grid
Response Function Y11-CR Y11-DR See Y12
Exposure Index Y11-CR Y11-DR Exposure Index versus Dose 1 to 50 µGy
Dynamic Range Y13-FS Y11-CR Y11-DR
Noise, Uniformity and Image Artifacts
Y11-CR Y11-DR For above range of dose measure noise in center and each quadrant Check for artifacts
Spatial Resolution Y15 Y15 Y15 Line-pair or Leeds phantom
Contrast Detectability Y13-FS Y11-CR Y11-DR Leeds phantom
Digital Detector Residual Images Y11-CR Y11-DR Take image at 50 µGy then zero; check for artifacts
Phantom Dose Measurements Y18 Y18 Y18 Measure dose at surface of standard phantom e.g. 20 cm PMMA
Other
Viewboxes Y26 Y26 Y26 Check luminance, uniformity, homogeneity, ambient light
Electronic Display Device Performance
Y27 Y27 All clinical workstations must be calibrated for luminance, distortion, resolution and noise
Integrity of Protective Equipment Y28 Y28 Y28 Lead aprons, integral shielding
General Preventive Maintenance Y29 Y29 Y29 As per manufacturer
DAP Meter Y30 Y30 Y30 Calibrate if fitted

College of Physicians and Surgeons of British Columbia
Radiology and CT Quality Control Procedures Workbook
Quality Control Procedures – Radioscopy (Fluoroscopy and Angiography) 4
Quality Control Procedures – Radioscopy (Fluoroscopy and Angiography) Safety Code 35 Summary For more detail about each quality control procedure select the relevant link in the tables below.
Daily Quality Control Tests
Quality Control Procedures Radioscopic Systems
Equipment Warm-up D1
Meters Operation D2
Equipment Conditions D3
System Movements D4
Darkroom Cleanliness D5
Film Processor Function D6
Overall Visual Assessment of Electronic Display Devices D7
Normal Font – Required Tests
Italics – Recommended
Abbreviations used
FS Film-screen CR Computed radiography DR Digital radiography RS Radioscopy (fluoroscopy and angiography) SF Spot film or acquisition
Weekly, Monthly and Quarterly Quality Control Tests
Quality Control Procedures Link Radioscopic System
Weekly Quality Control Tests
Visual Inspection of Cleanliness of Imaging Systems
W1-RS
Viewbox Condition W2 Cleanliness, luminance
Laser Film Printer Operation W3
Digital Subtraction Angiography System Performance
W7 Use phantom to check consistency (W7)
Monthly Quality Control Tests
Electronic Display Device Performance M6 Display pattern such as SMPTE on all image display stations

College of Physicians and Surgeons of British Columbia
Radiology and CT Quality Control Procedures Workbook
Quality Control Procedures – Radioscopy (Fluoroscopy and Angiography) 5
Quality Control Procedures Link Radioscopic System
Laser Film Printer Operation M7 • Print pattern such as SMPTE • Check for 0/5% and 95/100% patch
visibility • Measure OD of 10% to 90%
patches • No artifacts or geometrical
distortion greater than 1mm
Quarterly Quality Control Tests
Collimator Operation Q1 Check motions
Interlocks Q2 Check no radiation in park position
Table Angulation and Motion Q3 Check smooth operation
Compression Devices Operation Q4 Check function
Chronometer Operation Q5 Check timer with external timer
Protective Devices Q6 Check lead skirts, etc. for cracks
Park Position Interrupt Q7 Check no radiation possible in park position
Abbreviations used
FS Film-screen CR Computed radiography DR Digital radiography RS Radioscopy (fluoroscopy and angiography) CT Computed tomography SF Spot film or acquisition
Annual Quality Control Tests
Quality Control Procedures Link Radioscopic System
Performance
Safelight Test Y1 If film is used
Film/Screen Contact Y2 If film is used
Accuracy of Loading Factors Y3-RS kVp; mAs Linearity for spot film/acquisition mode
Radiation Output Reproducibility Y4-RS Reproducibility for spot film/acquisition mode
Radiation Output Linearity Y5-RS Output with mAs for spot film/acquisition mode
X-ray Beam Filtration Y6-RS HVL for spot film/acquisition mode
X-ray Field and Light Field Alignment Y8-9 RS Congruency of X-ray beam and light field edges

College of Physicians and Surgeons of British Columbia
Radiology and CT Quality Control Procedures Workbook
Quality Control Procedures – Radioscopy (Fluoroscopy and Angiography) 6
Quality Control Procedures Link Radioscopic System
X-ray Beam Collimation Y8-9 RS Congruency of x-ray beam and light field centres
Image Quality
Grid Performance Y10-RS Check uniformity and movement of grid
Spatial Resolution Y15 Line-pair or Leeds phantom
Contrast Detectability Y16-RS Leeds phantom
Dose
Phantom Dose Measurements Y18-RS Measure dose at surface of standard phantom e.g. 20 cm PMMA
Typical Image Intensifier Air Kerma Rate Y19 e.g. 20 cm PMMA
Maximum Image Intensifier Air Kerma Rate Y20 With detector blocked by lead
Automatic Intensity Control Y21 Tracking of detector dose with phantom thickness
Other
Viewboxes Y26 Check luminance, uniformity, homogeneity, ambient light
Electronic Display Device Performance Y27 All clinical workstations must be calibrated for luminance, distortion, resolution and noise (Y27)
Integrity of Protective Equipment Y28 Lead aprons, integral shielding
General Preventive Maintenance Y29 As per manufacturer
DAP Meter Y30 Calibrate if fitted

College of Physicians and Surgeons of British Columbia
Radiology and CT Quality Control Procedures Workbook
Quality Control Procedures – CT 7
Quality Control Procedures – CT Safety Code 35 Summary For more detail about each quality control procedure select the relevant link in the tables below.
Daily Quality Control Tests
Quality Control Procedures CT System
Equipment Warm-up D1
Meters Operation D2
Equipment Conditions D3
Overall Visual Assessment of Electronic Display Devices D7
Normal Font – Required Tests
Italics – Recommended
Weekly, Monthly and Quarterly Quality Control Tests
Quality Control Procedures Link CT System
Weekly QC Tests
Visual Inspection of Cleanliness of Imaging Systems
W1-CT Clean annular window
CT Number Accuracy W4 Check CT number water 0 ± 4 HU
CT Noise W5 Image noise in centre of water phantom ± 10% from baseline value
CT Uniformity W6 Check CT number in centre and 4 quadrants ± 5HU Follow up ± 2HU from baseline value
Viewbox Condition W2 Cleanliness, luminance
Laser Film Printer Operation W3 Print pattern such as SMPTE
Monthly QC Tests
Electronic Display Devices Performance M6 All devices used to display digital images – use SMPTE pattern
Laser Film Printer Operation M7 • Print pattern such as SMPTE • Check for 0/5% and 95/100% patch
visibility • Measure OD of 10% to 90%
patches • No artifacts or geometrical
distortion greater than 1mm

College of Physicians and Surgeons of British Columbia
Radiology and CT Quality Control Procedures Workbook
Quality Control Procedures – CT 8
Quality Control Procedures Link CT System
CT Tomographic Section Thickness M8 Slice thickness should be ± 50% if SW over 1 mm Slice thickness should be ± 0.5 mm if SW under 1 mm
Calibration of CT Number M9 Check CT number water 0 ± 4 HU and air -1000 ± 10 HU
CT Number Linearity M10 Check CT number over CT range -1000 to +1000
Quarterly QC Tests
Interlocks Q2 Check door interlocks (if present)
CT Patient Support Movement Q8 Check table movement corresponds to digital display ±1 mm
CT Spatial Resolution Q9 Measure MTF or line pair phantom
CT Low Contrast Detectability Q10
Semi-annual and Annual Quality Control Tests
Quality Control Procedures Link CT System
Semi-annual QC Tests
CT Laser Light Accuracy SY1 Check laser light vs X-ray beam with phantom
CT Accuracy of Automatic Positioning of Tomographic Plane (using the scanned projection radiograph)
SY2 Check localization scan corresponds to digital display ±2 mm
CT Accuracy of Gantry Tilt SY3
CT Patient Dose SY4 Check CTDI ± 20% from baseline values
Annual QC Tests
CT Number Dependence on Phantom Position
Y23 Check CT number water 0 ± 5 HU for possible patient positions in the gantry
CT Radiation Dose Profile Y24
CT Radiation Dose—Scout Localisation Image
Y25 Radiation Dose for Localisation Image within 20% of baseline value
Viewboxes Y26 Check luminance, uniformity, homogeneity, ambient light
Electronic Display Device Performance Y27 All clinical workstations must be calibrated for luminance, distortion, resolution and noise
Integrity of Protective Equipment Y28 Any protective equipment must be checked

College of Physicians and Surgeons of British Columbia
Radiology and CT Quality Control Procedures Workbook
Quality Control Procedures – CT 9
Quality Control Procedures Link CT System
General Preventive Maintenance Y29 Biomed PMs must be performed

College of Physicians and Surgeons of British Columbia
Radiology and CT Quality Control Procedures Workbook
D1 – Equipment Warm-up 10
D1 – Equipment Warm-up For many diagnostic imaging systems there is a warm-up period before the system performs optimally. This may include the boot-up of the system and operating system, warm-up of the x-ray tube, calibration of detectors, and stabilization of displays.
In many cases, for example CT, an air calibration is usually carried out at least on a daily basis. Certain x-ray manufacturers also build an X-ray tube warm-up procedure into the boot-up of the system, which has to be completed before the system will function. If the system is used only on day shifts, then such warm-up should be carried out when the system is first turned on. If the system runs continually, for example in an emergency area, then the system should be warmed-up/calibrated at the required interval, for example at midnight or 0800.

College of Physicians and Surgeons of British Columbia
Radiology and CT Quality Control Procedures Workbook
D2 – Meter Operation 11
D2 – Meter Operation Meters or other visual displays should be checked for correct operation.

College of Physicians and Surgeons of British Columbia
Radiology and CT Quality Control Procedures Workbook
D3 – Equipment Condition 12
D3 – Equipment Condition The equipment should be checked for any obvious signs of damage or loose components, especially on those systems which move such as table and the ceiling mounted x-ray system.

College of Physicians and Surgeons of British Columbia
Radiology and CT Quality Control Procedures Workbook
D4 – System Movement 13
D4 – System Movement Check the movement of the various components, and the locks for the x-ray tube and image detector assemblies. If fitted, check that the anti-collision devices function.

College of Physicians and Surgeons of British Columbia
Radiology and CT Quality Control Procedures Workbook
D5 – Darkroom Cleanliness 14
D5 – Darkroom Cleanliness In order to maintain the cleanliness of the darkroom, all working surfaces, counters and the floor should be cleaned daily. A UV B lamp may be useful in identifying dirt and debris.

College of Physicians and Surgeons of British Columbia
Radiology and CT Quality Control Procedures Workbook
D6 – Film Processor Function 15
D6 – Film Processor Function Film processor function must be evaluated every morning before performing clinical examinations, after the processor has been turned on and has reached the required development temperature; and at other times as required, such as after a replenishment rate change. Facilities operating spot film equipment must also perform the following quality control tests on the film processing system.
• The film processing solution levels must be checked to ensure agreement with the manufacturers’ recommended baseline levels for the particular processor and film type, for the given number of films processed daily.
• The displayed processor temperature must be checked to ensure agreement with the manufacturers’ recommended baseline level for the particular processor and film used.
• Sensitometric strip processing must be performed in order to monitor the performance of the image processing system.

College of Physicians and Surgeons of British Columbia
Radiology and CT Quality Control Procedures Workbook
D7 – Overall Visual Assessment of Electronic Display Devices 16
D7 – Overall Visual Assessment of Electronic Display Devices The performance of electronic display devices used for interpretation of clinical images must be assessed. By displaying the image of a test pattern, an assessment must be made of the general image quality and for the presence of artifacts. SMPTE or the TG18-QC test patterns must be available from the PACS system or local clinical workstation and should be displayed using the software routinely used to display clinical images. It is recommended that the test pattern image be viewed from a distance of 30 cm from the front of the display device. The results of the assessment must be within established limits.
Example implementation for the Radiologist at each login:
1. Find suitable SMPTE test pattern
2. Make accessible on PACS
3. Alert radiologists of requirement, frequency, and procedure
4. Check visibility of line patterns in each corner
5. Check visibility of 5%/95% squares in the center of the pattern.
Left Display – 5% visible/95% not visible Right Display – 5% not visible/95% visible
College of Physicians and Surgeons of British Columbia
Radiology and CT Quality Control Procedures Workbook
W1-FS – Film/Screen Cassettes: Visual Inspection of Cleanliness of Imaging System 17
W1-FS – Film/Screen Cassettes: Visual Inspection of Cleanliness of Imaging System In the use of film/screen systems a new film is used for every exposure. However, the screens are used repeatedly and can become dirty and damaged over time.
Procedure 1. Open the cassette and inspect the intensifying screen surface in bright light. Give special
attention to the corners of the screens.
2. If the surface appears damaged take a test uniform radiograph to check for artefacts on the final image and remove from service as necessary.
3. If the surface is dirty, clean with a fluid recommended by the manufacturer.
4. Allow cassette to dry for 30 minutes before closing again.
Film scanners If films are digitized for viewing, ensure the film support whether it be horizontal or vertical remains free of dirt and dust.

College of Physicians and Surgeons of British Columbia
Radiology and CT Quality Control Procedures Workbook
W1-CR – Computed Radiography: Visual Inspection of Cleanliness of Imaging System 18
W1-CR – Computed Radiography: Visual Inspection of Cleanliness of Imaging System
Procedure 1. Remove the imaging plate using lint-free gloves and inspect the surface in bright light. Give
special attention to the corners of the screen, and any longitudinal wear lines.
2. If the surface appears damaged take a test uniform radiograph to check for artefacts on the final image and remove from service as necessary
3. If the surface is dirty, clean with the fluid recommended by the manufacturer.
4. Allow imaging plate to dry for 30 minutes before replacing in cassette.

College of Physicians and Surgeons of British Columbia
Radiology and CT Quality Control Procedures Workbook
W1-DR – Digital Radiography: Visual Inspection of Cleanliness of Imaging System 19
W1-DR – Digital Radiography: Visual Inspection of Cleanliness of Imaging System DR detectors are usually mounted in protective housings to avoid mechanical shock. Ensure that the surface of the detector housing is free of dirt and dust, and clean as necessary.

College of Physicians and Surgeons of British Columbia
Radiology and CT Quality Control Procedures Workbook
W1-RS – Radioscopy Systems: Visual Inspection of Cleanliness of Imaging System 20
W1-RS – Radioscopy Systems: Visual Inspection of Cleanliness of Imaging System RF and angiography system procedures often use radio-opaque contrast media. The image intensifier or digital detector housing must be checked for any such material which might produce artefacts on the images and cleaned as necessary.

College of Physicians and Surgeons of British Columbia
Radiology and CT Quality Control Procedures Workbook
W1 – CT Scanners: Visual Inspection of Cleanliness of Imaging System 21
W1 – CT Scanners: Visual Inspection of Cleanliness of Imaging System The annular x-ray beam window must be inspected and if dirty, wiped with a moist cloth. Any contrast on the patient table should also be removed to avoid artefacts.

College of Physicians and Surgeons of British Columbia
Radiology and CT Quality Control Procedures Workbook
W2 – Viewbox Condition 22
W2 – Viewbox Condition Film viewboxes must be visually inspected for uniformity of illumination and any discoloration.

College of Physicians and Surgeons of British Columbia
Radiology and CT Quality Control Procedures Workbook
W3 – Laser Film Printer Operation 23
W3 – Laser Film Printer Operation The quality of images from the laser printer must be checked.
1. Print a copy of a SMPTE or TG18-QC test pattern on the laser printer.
2. View it on a good viewbox.
3. Check that the 5% and 95% squares are visible as below.
4. Check that there is no geometrical distortion.
5. Check that there are no artefacts.

College of Physicians and Surgeons of British Columbia
Radiology and CT Quality Control Procedures Workbook
W4 – Accuracy of the CT Number for Water 24
W4 – Accuracy of the CT Number for Water Note: Tests W4, W5 and W6 can be done simultaneously.
Using a uniform water phantom, the mean CT number of water and the standard deviation, within a large region of interest, must remain within the established baseline and acceptable limits of variation. The CT number for water must be in the range of 0 ± 4HU.
All manufacturers should provide basic quality procedures and the necessary phantoms. Usually the phantom for several of the CT tests is a water-filled acrylic cylinder 20 cm in diameter. Phantoms provided by each manufacturer are convenient to use as they can easily be attached where the head support is normally fixed. Two typical phantoms are shown below:
Procedure If there is a predefined manufacturer’s procedure follow that. If not, the following procedure can be used:
1. Attach cylindrical phantom to the head holder and move the phantom so that the centre of the water section is at the isocentre.
2. Perform an axial (sequential) scan over the length of the water phantom to give 5 mm reconstructed slices, using standard brain CT acquisition parameters.
3. View the central reconstructed slice, and with the scanner analysis software draw a circular region of interest (ROI) in the centre of the image with a diameter of about 40% of the image width.
4. Record CT number of water; The CT number must be in the range 0 ± 4HU.
5. Record acquisition parameters for repeatability.
GE QC phantom
Siemens QC phantom attached at the
head holder of the patient table

College of Physicians and Surgeons of British Columbia
Radiology and CT Quality Control Procedures Workbook
W5 – A measurement of CT noise must be made 25
W5 – A measurement of CT noise must be made Note: Tests W4, W5 and W6 can be done simultaneously
Noise is given by the variation of CT numbers from a mean value in a defined area in the image of a uniform phantom. Its magnitude is equal to the standard deviation of the CT number values within the region of interest.
Procedure If there is a predefined manufacturer’s procedure follow that. If not, the following procedure can be used:
1. Attach cylindrical phantom to the head holder and move the phantom so that the centre of the water section is at the isocentre.
2. Perform an axial (sequential) scan over the length of the water phantom to give 5 mm reconstructed slices, using standard brain CT acquisition parameters.
3. View the central reconstructed slice, and with the scanner analysis software draw a circular region of interest (ROI) in the centre of the image with a diameter of about 40% of the image width as shown below.
4. Record the standard deviation in units of HU.
5. Noise should not vary by more than 10% or 0.2 HU from the baseline tests at acceptance.

College of Physicians and Surgeons of British Columbia
Radiology and CT Quality Control Procedures Workbook
W6 – CT Uniformity 26
W6 – CT Uniformity Note: Tests W4, W5 and W6 can be done simultaneously
Uniformity is defined as the consistency of the CT numbers of an image of a homogeneous material across the scan field. Uniformity is calculated using the following equation: ∣(CTm,c) - (CTm,p) ∣, which is the difference in the mean CT number in the centre from that at the periphery of the image.
Procedure If there is a predefined manufacturer’s procedure follow that. If not, the following procedure can be used:
1. Attach cylindrical phantom to the head holder and move the phantom so that the centre of the water section is at the isocentre.
2. Perform an axial (sequential) scan over the length of the water phantom to give 5 mm reconstructed slices, using standard brain CT acquisition parameters.
3. View the central reconstructed slice, and with the scanner analysis software draw a circular region of interest (ROI) in the centre of the image with a diameter of about 10% of the image width.
4. Record CT number of water - CTm,c .
5. Repeat the measurement at the periphery in four positions as sown below – top, bottom, left and right and take the average - CTm,p .
6. │CTm,c - CTm,p │ should not exceed 2 HU from the baseline value measured at acceptance (At acceptance the baseline uniformity of the CT number for water must not be greater than ± 5 HU from the centre of the phantom to the periphery.) .

College of Physicians and Surgeons of British Columbia
Radiology and CT Quality Control Procedures Workbook
W7 – Angiography System Performance Consistency 27
W7 – Angiography System Performance Consistency A simple test phantom containing a copper sheet and contrast and resolution objects is very useful for determining consistency of fluoroscopic systems. These phantoms can be produced locally (like the one shown below) or purchased from x-ray suppliers. This should be used weekly, when changes to the system are made, and if malfunction is suspected. The phantoms are usually about 25 cm square and 2 cm thick.
Procedure 1. Because consistency is being measured, it is important to make the test in a consistent manner.
2. The phantom should be as close to the image detector as possible – under the detector on most RF systems; on the detector on most C arm systems.
3. Set the focus to detector distance at 100 if it can be varied; otherwise note the distance.
4. Initiate fluoroscopy and collimate the beam to the size of the phantom.
5. Count the number of contrast object which can be seen – record value.
6. Count the number resolution patterns which can be seen clearly – record value.
7. Record ambient kVp and mA.
The test is facilitated on RF systems if a cube-shaped foam is used to hold the phantom under the overhead image intensifier.
Leeds phantom
Homemade phantom used at VGH
High contrast mesh
Low contrast circles
College of Physicians and Surgeons of British Columbia
Radiology and CT Quality Control Procedures Workbook
M1-FS – Film-Screen Cassettes 28
M1-FS – Film-Screen Cassettes Cassettes and screens must be cleaned and inspected for damage. Manufacturer recommended cleaners and cleaning procedures should be used. An inspection for dust particles should be done with an ultraviolet light. Cassettes must be checked for cleanliness, wear, warping, fatigue of foam compression material and closure mechanism, light leaks.
Procedure 1. Open the cassette and inspect the intensifying screen surface in bright light. Cassettes must be
checked for cleanliness, wear, warping, fatigue of foam compression material and closure mechanism, light-tightness (for film-screen cassettes).
2. If the surface appears damaged take a test uniform radiograph to check for artefacts on the final image and remove from service as necessary.
3. Clean with a fluid recommended by the manufacturer.
4. Allow cassette to dry for 30 minutes before closing again.
Note: This differs from Test W1 as all cassettes must be cleaned.

College of Physicians and Surgeons of British Columbia
Radiology and CT Quality Control Procedures Workbook
M1-CR – Cassette and Image Plate Cleaning 29
M1-CR – Cassette and Image Plate Cleaning
Procedure 1. Remove the imaging plate using non-shedding cotton gloves and inspect the surface in bright
light. Give special attention to the corners of the screen, and any longitudinal wear lines.
2. If the surface appears damaged take a test uniform radiograph to check for artefacts on the final image and remove from service as necessary.
3. If the surface is dirty, clean with the fluid recommended by the manufacturer and check radiographically if required.
4. Allow imaging plate to dry for 30 minutes before replacing in cassette.
Note: This differs from Test W1 as all cassettes must be cleaned.

College of Physicians and Surgeons of British Columbia
Radiology and CT Quality Control Procedures Workbook
M2 – Darkroom Temperature and Humidity Conditions 30
M2 – Darkroom Temperature and Humidity Conditions A monthly check of the darkroom temperature and humidity should be conducted. The temperature should be between 18∘C and 23∘C and the humidity between 40% and 60%.
College of Physicians and Surgeons of British Columbia
Radiology and CT Quality Control Procedures Workbook
M3 – Darkroom Light Conditions 31
M3 – Darkroom Light Conditions A weekly visual test must be performed in the darkroom to ensure the room is light tight. Particular attention must be paid to the door seal and the mounting of the film processor, if the film insertion to the processor is done through a wall. The assessment of darkroom light conditions should be made after a 10 to 15 minute period of adaptation to the dark conditions with safelights turned off.

College of Physicians and Surgeons of British Columbia
Radiology and CT Quality Control Procedures Workbook
M4 – Film Processor Operation 32
M4 – Film Processor Operation Facilities using film must perform quality control tests on the film processing system.
1. The accuracy of the processor temperature display must be checked with a digital thermometer. The processor developer temperature display should be accurate to within 0.5ºC.
2. The replenishment rate must be compared with the manufacturers’ recommended baseline level for the particular processor and film type, for the given number of films processed daily and for the method of processing.
3. All processing solutions should be changed and processor solution tanks cleaned.
4. Fixer retention tests should be performed to ensure fixer is adequately removed from processed films according to established baseline levels.
Full details of film-processing QC are given in SC 35 Section 3.1.

College of Physicians and Surgeons of British Columbia
Radiology and CT Quality Control Procedures Workbook
M5 – Retake Analysis 33
M5 – Retake Analysis Facilities must maintain records of every retake, including the reason for the retake along with any corrective actions. An analysis must be done of the retake records to identify and correct any trends or repeated errors. The retake rate should be less than 5%, not including quality control films. If images contain some patient diagnostic information, they should be maintained in the patient file.
Procedure 1. For film/screen systems collect discards and evaluate monthly.
2. For CR and DR use the software provided by the manufacturers to track repeat films. Most system have the ability to identify the user by initials and the reason for the repeat such as patient movement, wrong exposure, wrong label etc.

College of Physicians and Surgeons of British Columbia
Radiology and CT Quality Control Procedures Workbook
M6 – Electronic Display Device Performance 34
M6 – Electronic Display Device Performance The performance of all electronic display devices used to view images from digital systems, as well as those obtained through scanning of radiographic films, must be checked using a test pattern such as the SMPTE or a TG18 test pattern.
For closed systems, where a suitable test pattern is not available on the system, a test pattern generator equipped with the appropriate test patterns must be utilized. Where a system does not have the capability to display an externally provided pattern, the manufacturer recommended quality control procedures must be followed. The quality control procedures and acceptance criteria recommended by the AAPM (AAPM TG18 2005) should be used.
Note: This is different to test D7 as it applies to all image displays.
Procedure Example implementation:
1. Find suitable SMPTE test pattern on PACS or the local display computer.
2. Check visibility of line patterns in each corner.
3. Check visibility of 5%/95% squares in the center of the pattern.
Left Display – 5% visible/95% not visible Right Display – 5% not visible/95% visible

College of Physicians and Surgeons of British Columbia
Radiology and CT Quality Control Procedures Workbook
M7 – Laser Film Printer Operation 35
M7 – Laser Film Printer Operation The quality of images obtained from the laser film printer must be checked. Depending on the system, this may or may not require using pre-established window and level settings on the display.
Procedure 1. Print a copy of a SMPTE or TG18-QC test pattern on the laser printer.
2. View it on a good viewbox.
3. Check that the 5% and 95% squares are visible as shown in the circles below.
4. Measure the optical density of the 0%, 20%, 40%, 60%, 80% and 100% patches indicated by the crosses below.
5. Check that there is no geometrical distortion.
6. Check that there are no artefacts.

College of Physicians and Surgeons of British Columbia
Radiology and CT Quality Control Procedures Workbook
M8 – CT Tomographic Section Thickness 36
M8 – CT Tomographic Section Thickness An evaluation of the tomographic section thickness must be made.
Measurements of the tomographic section thickness are made with a test device containing one or two ramps positioned at an angle to the scan plane. The figure below shows a phantom with two inclined planes in the same Y plane, and the image from one slice. If the inclined planes are at 45 degrees to the scan plan the measured vertical projection of the plane will be equal to the slice width.
Procedure
The above is typical of the phantom provided with Siemens scanners. The phantom on the right of a GE phantom – a series of 1 mm holes are drilled at 2mm intervals on a 45 degree plane. The width of the beam can be estimated by merely counting the number of holes which can be seen. The image below is a CT slice through the American College of Radiology (ACR) CT Phantom which is widely used in the ACR CT Accreditation Program in the US.
This similarly has a row of holes on an inclined plane. 10 holes can be counted for this 5 mm wide reconstructed beam (The circular objects have calibrated CT number values, which are used in test M9).
GE CT QC phantom insert
CT# and Slice Thickness

College of Physicians and Surgeons of British Columbia
Radiology and CT Quality Control Procedures Workbook
M8 – CT Tomographic Section Thickness 37
For nominal tomographic section thicknesses of 2 mm or more, the measured tomographic section thickness must not vary by more than ± 1 mm from the established baseline tomographic section thickness. For nominal tomographic section thicknesses of 2 mm to 1 mm, the measured tomographic section thickness must not vary by more than ± 50% from the established baseline tomographic section thickness. For nominal tomographic section thicknesses of less than 1 mm, the measured tomographic section thickness must not vary by more than ± 0.5 mm from the established baseline tomographic section thickness.

College of Physicians and Surgeons of British Columbia
Radiology and CT Quality Control Procedures Workbook
M9 – Calibration of CT number 38
M9 – Calibration of CT number This means measurements rather than calibration entailing changes to the scanner. At all clinically used voltage settings, the mean CT number and standard deviation should be measured. The mean CT number and standard deviation should be calculated for a 2-3 cm2 area of water and air in the reconstructed image. The same location should be used each time this test is performed. The CT number for water must be 0 ± 4 HU. The CT number for air must be -1000 ± 10 HU.
All manufacturers provide a water phantom, which can be used for these measurements, such as these below. They are convenient as they often attach at the head holder location.

College of Physicians and Surgeons of British Columbia
Radiology and CT Quality Control Procedures Workbook
M10 – CT number linearity 39
M10 – CT number linearity At all clinically used voltage settings, the CT number linearity should be assessed. The CT number linearity should be assessed by scanning a phantom containing uniform objects of known materials with a wide range of CT numbers. The measured CT numbers of the materials should be compared with the nominal values provided by the phantom manufacturer and with previously measured values. The measured values must remain within established limits for the CT scanner.
This is essentially the same as M9 but over the range of clinical CT numbers. Some manufacturers provide such phantoms; otherwise the RMI-Gammex ACR phantom can provide this test.
The first section of the ACR phantom has 5 cylinders of different CT number, which can be seen on the front of the phantom. Take an axial scan through this section. Use the image analysis software on the scanner or a PACS workstation to determine the average CT number.
On the right is a typical image of this section showing the ROIs. The image also shows the inclined plane indicators of a 5mm beam thickness, and the steel surface alignment beads which are also in this section.
Although this is not a mandatory test, it is recommended that this procedure be carried out on at least a semi-annual basis, as many clinical decisions are based upon an accurate knowledge of the CT value of the tissue involved.

College of Physicians and Surgeons of British Columbia
Radiology and CT Quality Control Procedures Workbook
Q1 – Collimator Operation 40
Q1 – Collimator Operation Using each collimating option, a test should be performed to ensure smooth collimator blade motion. If applicable, vary the SID to assure the collimator tracks (i.e., automatically maintain the field size) as the SID changes.

College of Physicians and Surgeons of British Columbia
Radiology and CT Quality Control Procedures Workbook
Q2 – Interlocks 41
Q2 – Interlocks Interlocks are not normally used on diagnostic x-ray doors, but if they are fitted they must be tested. Other interlocks are tested such as collision sensors. For radioscopic equipment, it must not be possible to activate the X-ray tube unless the entire radioscopic beam is intercepted by the image receptor.

College of Physicians and Surgeons of British Columbia
Radiology and CT Quality Control Procedures Workbook
Q3 – Table Angulation and Motion 42
Q3 – Table Angulation and Motion The table should move freely to the upright position and stop at the appropriate spot. The table angle indicator and the actual table angle should coincide to within 2 degrees.

College of Physicians and Surgeons of British Columbia
Radiology and CT Quality Control Procedures Workbook
Q4 – Compression Devices Operation 43
Q4 – Compression Devices Operation Check that available compression devices easily move in and out of the X-ray beam and function correctly.

College of Physicians and Surgeons of British Columbia
Radiology and CT Quality Control Procedures Workbook
Q5 – Chronometer Operation 44
Q5 – Chronometer Operation The chronometer accuracy should be verified with a stopwatch.

College of Physicians and Surgeons of British Columbia
Radiology and CT Quality Control Procedures Workbook
Q6 – Protective Devices for Radioscopic Equipment 45
Q6 – Protective Devices for Radioscopic Equipment A protective curtain or drape, of at least 0.25 mm lead equivalence at 100 kV, must be in place and move freely so that it can be placed between the patient and any personnel in the radioscopic room. Lead drapes may be affixed to the image detector (under table systems) or the patient table (over table systems). Check that there are no creases or gaps that may subject the operator to unnecessary scatter radiation.
If the unit is an under-table radioscopic system, check that the shield covering the cassette holder entrance during radioscopy is working as intended. The shield should provide the equivalent protection of at least 0.5 mm of lead at 100 kV.

College of Physicians and Surgeons of British Columbia
Radiology and CT Quality Control Procedures Workbook
Q7 – Park Position Interrupt 46
Q7 – Park Position Interrupt When the image receptor is in the parked position, it should not be possible to energize the X-ray tube. This may be checked while wearing a lead apron and depressing the radioscopic irradiation switch to see if the system is activated.

College of Physicians and Surgeons of British Columbia
Radiology and CT Quality Control Procedures Workbook
Q8 – CT Patient Support Movement 47
Q8 – CT Patient Support Movement The accuracy of the patient support movement ensures that the desired volume of the patient is scanned. This becomes important when performing contiguous scans where the scan interval equals the scan width to image an entire volume of the patient. If the scan interval is larger than the scan width, then gaps are present in the imaged volume. If the scan interval is smaller than the scan width, then the scans will overlap.
Method To simulate the weight of the patient, a phantom or other weights (not exceeding 135 kg) must be place on the support when performing this test.
Tape steel rule to edge of table; approximately 2 m. Tape a plastic ruler to the tabletop so that the edge of the ruler can indicate the distance on the steel rule. Note the indicated distance on the rule and the digital display on the scanner.
Gantry table position display
1100 55
Patient loadPatient load
rulerruler
Gantry table position display
1100 55
Patient loadPatient load
rulerruler
Patient loadPatient load
rulerruler
Example of method

College of Physicians and Surgeons of British Columbia
Radiology and CT Quality Control Procedures Workbook
Q8 – CT Patient Support Movement 48
Move the table approximately one meter and reread the values.
The measured patient support movement must be within ± 1 mm of the intended movement when the patient support moves both into and out of the gantry.

College of Physicians and Surgeons of British Columbia
Radiology and CT Quality Control Procedures Workbook
Q9 – CT Spatial Resolution 49
Q9 – CT Spatial Resolution The spatial resolution must be tested, with the CT conditions of operation of the scanner, using one of the following three methods. The spatial resolution depends on the reconstruction algorithm, so it is important that repeat measurements are made under identical conditions. If the resolution is determined visually from a bar phantom the display should be adjusted for optimum viewing.
1. The recommended method of measuring the spatial resolution is using the modulation transfer function curve, obtained from the Fourier transform of the point-spread function. The test device is a high contrast wire, typically 2 mm in diameter or less, placed in a tube of minimally attenuating material. The measurement of the 50% point and the 10% point of the MTF curve must be within 0.5 lp/cm or ± 15% of the established baseline value, whichever is greater. The manufacturers’ software often provides this information.
2. A quantitative measurement of modulation can be made using a bar pattern test device which contains line-pair patterns of different spatial frequencies. Using region of interest measurements, individual points along the MTF curve can be obtained. When measurements are made using a test object with line-pair patterns of varying spatial frequency or by noting the spatial frequency at which the measured modulation transfer function drops to 5%, the limiting high contrast resolution should be 5 line pairs per centimeter or more. Some manufacturers use this method.
3. An alternate method is through visual assessment using a test device consisting of a repeated pattern of holes, bars or lines. When measuring the limiting high contrast resolution using a phantom for high contrast resolution having sets of test objects of equal diameters and spacing, the high contrast resolution must be 1 mm or less. (For example the ACR phantom described elsewhere).
ACR Phantom Axial Resolution

College of Physicians and Surgeons of British Columbia
Radiology and CT Quality Control Procedures Workbook
Q10 – CT Low Contrast Detectability 50
Q10 – CT Low Contrast Detectability Measurements should be made of the low contrast detectability to ensure it is within established limits. Low contrast detectability is typically specified as the smallest sized object at a specified contrast level to the background which can be seen in a particular phantom when imaged under specified conditions. The phantom used for this test should have objects with less than 1% or 10 HU contrast to the surrounding material. The limiting detectability should be measured with the reconstruction algorithm of the scanner which is routinely used, as well as other clinically relevant reconstruction algorithms. The baseline performance level must be stated for a given phantom at specific scan conditions, including radiation dose, viewing conditions, and visualization criteria. It should be noted that this visual test for establishing low contrast detectability is subjective since it depends on a number of factors including the visual acuity of the observers and ambient lighting conditions.
Any CT QA phantom which contains low contrast objects can be used. The image below is of the low contrast section of the ACR CT Phantom, which contains objects of 25, 6, 4, 3 and 2 mm diameter. Only the four largest objects are clearly visible under these test conditions.
Low contrast objects of 25, 6, 4, 3
and 2 mm diameter

College of Physicians and Surgeons of British Columbia
Radiology and CT Quality Control Procedures Workbook
SY1 – CT Laser Light Accuracy 51
SY1 – CT Laser Light Accuracy Laser light accuracy must be determined for both axial scan localization lights, which indicate the location of the radiation beam relative to the external anatomical structures of the patient, and the sagittal and coronal scan localization lights, which centre the anatomic structure of interest in the scan field of view. This can be tested in several ways as shown below:
1. Axial Scan Localization Lights—Axial scan localization light accuracy is tested either by imaging a thin wire (approximately 1 mm diameter) or by using a needle to puncture holes in film at the positions of the laser lights and exposing the film using the smallest available scan width. The difference between the exposed areas on the film and the locations of the pin pricks must be less than ± 2 mm.
2. Some manufacturers’ phantoms have fiducial markers which can be aligned with the external lasers and then seen in the image using a small slice width, as in the GE CT phantom shown below. The ACR phantom (Gammex 464) has beads at the surface which can be used in the same way.
3. Isocentre Alignment and Sagittal and Coronal Scan Localization Lights—Place a thin absorber
(pencil) centered in the tomographic plane at the intersection of the sagittal and coronal positioning light fields.
CT slice through alignment section of ACR phantom showing surface steel
GE Phantom showing deeper grooves for
alignment test

College of Physicians and Surgeons of British Columbia
Radiology and CT Quality Control Procedures Workbook
SY1 – CT Laser Light Accuracy 52
The intersection of the sagittal and coronal scan localization lights must indicate the centre of the field of view. The midline of the table should be coincident with the sagittal scan alignment light. The results must be within the manufacturer’s recommended values and tolerances. A limit of ± 5 mm should be achievable.
CT slice through pencil

College of Physicians and Surgeons of British Columbia
Radiology and CT Quality Control Procedures Workbook
SY2 – CT Accuracy of Automatic Positioning of Tomographic Plane (using the scanned projection radiograph/scout localization)53
SY2 – CT Accuracy of Automatic Positioning of Tomographic Plane (using the scanned projection radiograph/scout localization) The location of the scan plane prescribed by using the scanned projection radiograph must be within ± 2 mm of the actual scan plane.
Method Any suitable phantom can be used for this, but cylindrical phantoms are particularly easy to align. Align the long axis of the phantom approximately 30 cm long with the table axis (Z axis). Set the scan range to just encompass the length of the phantom. Scan using 1 mm slices. Check that the first and last images coincide with the ends of the phantom.

College of Physicians and Surgeons of British Columbia
Radiology and CT Quality Control Procedures Workbook
SY3 – CT Accuracy of Gantry Tilt 54
SY3 – CT Accuracy of Gantry Tilt The accuracy of the indicated CT gantry tilt should be verified. When performing non-orthogonal scans, it is important to ensure that the physical tilt of the gantry corresponds to the tilt angle indicated on the CT display. This is generally done by exposing film placed upright and parallel to the sagittal laser at various gantry tilt angles. At least 3 irradiations need to be made on the film: no tilt (0 degrees) and each of the extreme angles. The angles measured on the film should correspond with the computer display to within ± 3 degrees.

College of Physicians and Surgeons of British Columbia
Radiology and CT Quality Control Procedures Workbook
SY4 – Patient Dose 55
SY4 – Patient Dose The CTDI100 must be determined for both head and body scanning techniques, using the CT dosimetry phantom placed on the patient support without any additional attenuating material present. For each technique, the CTDI100 must be determined at the centre and periphery of the phantom as well as in air using the manufacturer’s recommended techniques and setting. The values of CTDI100are used to calculate CTDIw which must be within ± 20% of the established baseline values and the manufacturer’s specifications when a fixed technique is used. It is highly recommended to strive for an agreement with manufacturers’ specification of ± 10%.(But most manufacturers claim 25% is typical) This test should be performed by a medical physicist.
Method CT Dose Index (CTDI) is a primary CT quantity measured in an acrylic (PMMA) cylinder usually with a 10 cm ion chamber. The FDA phantoms of 16 and 32 cm diameter are used with a CT pencil chamber, which has uniform sensitivity. The CTDI is characteristic of a particular scanner, and is checked against the manufacturer’s specifications and console displays at Acceptance.
Procedure The following procedure is for CT scanners with beam widths less than 100 mm. For larger beam widths expert advice should be sought.
• Align the axis of the head (16 cm diameter) acrylic phantom with the Z axis of the scanner using the localization lasers.
• Insert the 10 cm chamber completely in the centre hole
• Prescribe a known single axial scan of about 10 mm length
• Zero dosemeter if necessary; make exposure; record air kerma dose (mGy)

College of Physicians and Surgeons of British Columbia
Radiology and CT Quality Control Procedures Workbook
SY4 – Patient Dose 56
• Repeat in each of the four peripheral phantom holes. If there is no difference, only one peripheral reading will need to be taken subsequently (checks for over scanning)
• Repeat for each possible kVp
• The air kerma dose reading from such a measurement is corrected for the actual beam width to give the CTDIcentre and CTDIperiphery quantities in mGy/100 mAs
• Compare the measured values with those from the manufacturer
• Repeat for the body (32 cm) phantom
CTDI is usually measured in the centre and periphery of the cylindrical phantom and these two quantities are combined to give a weighted CTDI value, where:
CTDIw = 0.33 x CTDIcentre + 0.66 CTDIperiphery
At acceptance testing it is recommended that measurements both in-air and in the acrylic head and body phantom are made. As these sets of measurements are physically related, it is only necessary to perform the in-air measurements to check consistency of CTDI values.

College of Physicians and Surgeons of British Columbia
Radiology and CT Quality Control Procedures Workbook
Y1 – Safelight Test 57
Y1 – Safelight Test An evaluation must be made of the effects of the safelight on film optical density.
Y1 Safelight Test Film cassette
Procedure • Load a fresh film into a cassette and expose cassette to a low exposure (e.g. 1 mAs; 80 kVp at
100 cm) to sensitize film
• Unload the cassette in the darkroom and place the film on the working surface adjacent to the suspected leak
• Place paper clips or coins every few cm along the long edge
• Cover the film with a piece of opaque card, and uncover one coin at a time at 30 sec intervals.
• Process film
Comments Any image showing on the film in less than 2 minutes is unacceptable and should be investigated.
College of Physicians and Surgeons of British Columbia
Radiology and CT Quality Control Procedures Workbook
Y2 – Screen/Film Contact 58
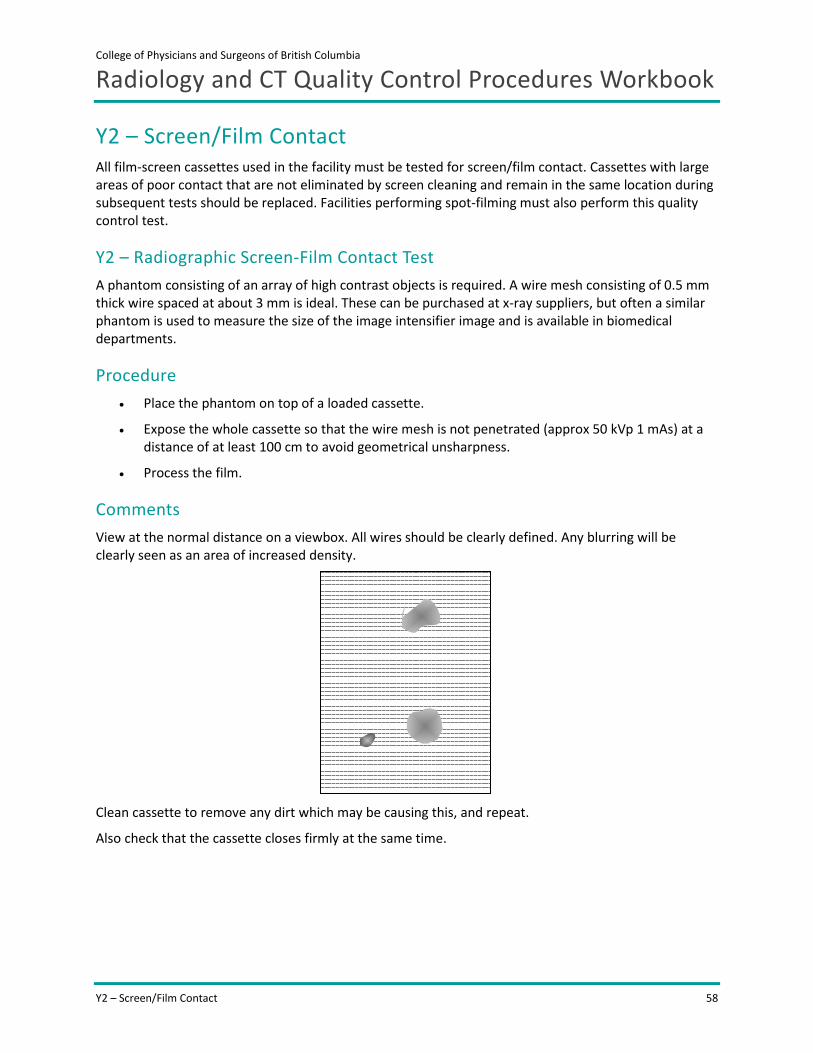
Y2 – Screen/Film Contact All film-screen cassettes used in the facility must be tested for screen/film contact. Cassettes with large areas of poor contact that are not eliminated by screen cleaning and remain in the same location during subsequent tests should be replaced. Facilities performing spot-filming must also perform this quality control test.
Y2 – Radiographic Screen-Film Contact Test A phantom consisting of an array of high contrast objects is required. A wire mesh consisting of 0.5 mm thick wire spaced at about 3 mm is ideal. These can be purchased at x-ray suppliers, but often a similar phantom is used to measure the size of the image intensifier image and is available in biomedical departments.
Procedure • Place the phantom on top of a loaded cassette.
• Expose the whole cassette so that the wire mesh is not penetrated (approx 50 kVp 1 mAs) at a distance of at least 100 cm to avoid geometrical unsharpness.
• Process the film.
Comments View at the normal distance on a viewbox. All wires should be clearly defined. Any blurring will be clearly seen as an area of increased density.
Clean cassette to remove any dirt which may be causing this, and repeat.
Also check that the cassette closes firmly at the same time.
College of Physicians and Surgeons of British Columbia
Radiology and CT Quality Control Procedures Workbook
Y3-RD – Radiographic kVp Accuracy 59
Y3-RD – Radiographic kVp Accuracy For any combination of loading factors, the X-ray tube voltage must not deviate from the selected value, by more than 10%, the loading time must not deviate from the selected value by more than (10% + 1 ms), the X-ray tube current, must not deviate from the selected by more than 20%, and the current-time product must not deviate from the selected value by more than (10% + 0.2 mAs).
Y3 RD1 Radiographic kVp Accuracy The test should be performed over the range of kVp settings normally used on the particular equipment. For radiographic and fluoroscopic systems this will usually be 60 to 120 kVp.
Ensure kVp meter is accurate over the range of kVp’s and beam filtrations used.
Procedure • Place meter probe on table top at 100 cm
• Collimate to size of meter
• For DR systems move detector out of the beam
• On console choose Table Top exposure
• Select kVp; make exposure

College of Physicians and Surgeons of British Columbia
Radiology and CT Quality Control Procedures Workbook
Y3-RD – Radiographic kVp Accuracy 60
X-ray tube
100 cm
detector
College of Physicians and Surgeons of British Columbia
Radiology and CT Quality Control Procedures Workbook
Y3-RS – Radioscopic kVp Accuracy 61
Y3-RS – Radioscopic kVp Accuracy For any combination of loading factors, the X-ray tube voltage must not deviate from the selected value, by more than 10%, the loading time must not deviate from the selected value by more than (10% + 1 ms), the X-ray tube current, must not deviate from the selected by more than 20%, and the current-time product must not deviate from the selected value by more than (10% + 0.2 mAs).
Y3 RS Fluoroscopy and Spot-Film kVp Accuracy Checks the tube potential during fluoroscopy and spot-film radiographic exposures.
Ensure kVp meter is accurate over the range of kVps and beam filtrations used.
CAUTION
• For all fluoroscopic testing you must wear a properly fitting lead apron and a personnel dosimeter.
• Keep your hands out of the primary beam.
Equipment required kVp meter, copper and aluminium filters

College of Physicians and Surgeons of British Columbia
Radiology and CT Quality Control Procedures Workbook
Y4-RD – Radiographic Output Reproducibility 62
Y4-RD – Radiographic Output Reproducibility The X-ray tube radiation output shall be high enough to minimize irradiation time to eliminate perceptible motion artifacts.
Comments Measure at 80 kVp; approximately 10 mAs
Technique • Place dose meter probe on table top at 100 cm
• Collimate to size of detector
• For DR systems move detector out of the beam
• On console choose Table Top exposure
• Make exposure
• Repeat exposure at least 9 times and record readings
The coefficient of variation of any ten consecutive irradiation measurements, taken at the same source to detector distance within a time period of one hour, is no greater than 0.05, and each of the ten irradiation measurements is within 15% of the mean value of the ten measurements.

College of Physicians and Surgeons of British Columbia
Radiology and CT Quality Control Procedures Workbook
Y4-RS – Spot-Film Output Reproducibility 63
Y4-RS – Spot-Film Output Reproducibility The X-ray tube radiation output shall be high enough to minimize irradiation time to eliminate perceptible motion artifacts. For any combination of operating loading parameters, the coefficient of variation of any ten consecutive irradiation measurements, taken at the same source to detector distance within a time period of one hour, is no greater than 0.05, and each of the ten irradiation me
asurements is within 15% of the mean value of the ten measurements.
Y4 RS Spot-film/acquisition Reproducibility For RF systems which have the tube over-table the method for Radiography above can be used with a phantom in the beam to protect the detector and to drive the system to normal operating parameters. For all other RF, angiography and C arm systems use the method below.
CAUTION
• For all fluoroscopic testing you must wear a properly fitting lead apron and a personnel dosimeter.
• Keep your hands out of the primary beam.
Comments If possible set the kVp at 80 kVp; the mAs will automatically adjust.
Procedure In most RF, angiography and C arm systems the tube cannot be rotated above the table. Therefore the kVp meter should face downwards in most cases.
• For RF rooms, place meter probe on table top facing towards x-ray tube
• For C arms set gantry to 1800 set table to isocentre and place meter on table facing towards x-ray tube
• Use a suitable phantom above the meter, such as 1.5 mm copper or 20 cm of Acrylic
• Collimate to size of meter using fluoroscopic image
• Take ten spot film/acquisition exposures and record readings.
The coefficient of variation of any ten consecutive irradiation measurements, taken at the same source to detector distance within a time period of one hour, is no greater than 0.05, and each of the ten irradiation measurements is within 15% of the mean value of the ten measurements .

College of Physicians and Surgeons of British Columbia
Radiology and CT Quality Control Procedures Workbook
Y4-RS – Spot-Film Output Reproducibility 64
X-ray tube
detector
table

College of Physicians and Surgeons of British Columbia
Radiology and CT Quality Control Procedures Workbook
Y5-RD – Radiographic Output Linearity 65
Y5-RD – Radiographic Output Linearity For any pre-selected value of X-ray tube voltage, the quotient of the average air kerma measurement divided by the indicated current time product obtained at two settings of X-ray tube current or X-ray tube current-time product must not differ by more than 0.10 times their sum, that is,
│X1-X2│ ≤ 0.10(X1+X2)
where X1 and X2 are average air kermas per current time product. The values of X1 and X2 must be determined
a. if the X-ray tube current is selected in discrete steps, any two consecutive X-ray tube current settings;
b. if the X-ray tube current selection is continuous, any two X-ray tube current settings that differ by a factor of 2 or less;
c. if the current time product is selected in discrete steps, any two consecutive current time product settings; or
d. if the current time product selection is continuous, any two current time product settings that differ by a factor of 2 or less.
Y5 RD Radiographic Output Linearity Dose meter
Comments For radiographic systems measure over the typical clinical range –e.g. 1 mAs to 100 mAs
Procedure • Place dose meter detector on table top at 100 cm.
• Collimate to size of detector
• For DR systems move detector out of the beam
• On console choose Table Top exposure
• Select 80 kVp and lowest mAs
• Make exposure with no added filter; record reading
• Repeat for other mAs values, noting any change in the focal spot size
• Calculate coefficient of variation

College of Physicians and Surgeons of British Columbia
Radiology and CT Quality Control Procedures Workbook
Y5-RS – Spot-Film Output Linearity 66
Y5-RS – Spot-Film Output Linearity For any pre-selected value of X-ray tube voltage, the quotient of the average air kerma measurement divided by the indicated current time product obtained at two settings of X-ray tube current or X-ray tube current-time product must not differ by more than 0.10 times their sum, that is,
│X1-X2│ ≤ 0.10(X1+X2)
where X1 and X2 are average air kermas per current time product. The values of X1 and X2 must be determined
a. if the X-ray tube current is selected in discrete steps, any two consecutive X-ray tube current settings;
b. if the X-ray tube current selection is continuous, any two X-ray tube current settings that differ by a factor of 2 or less;
c. if the current time product is selected in discrete steps, any two consecutive current time product settings; or
d. if the current time product selection is continuous, any two current time product settings that differ by a factor of 2 or less.
Y5 RS Spot-film/linearity For RF systems which have the tube overtable the method for Radiography above can be used with a phantom in the beam to protect the detector and to drive the system to normal operating parameters. For all other RF, angiography and C arm systems use the method as in Y4 RS.
CAUTION
• For all fluoroscopic testing you must wear a properly fitting lead apron and a personnel dosimeter.
• Keep your hands out of the primary beam.
Comments If possible set the kVp at 80 kVp.
Procedure In most RF, angiography and C arm systems the tube cannot be rotated above the table. Therefore the kVp meter should face downwards in most cases.
• For RF rooms, place meter probe on table top facing towards x-ray tube.
• For C arms set gantry to 180° set table to isocentre and place meter on table facing towards x-ray tube.
• Use a suitable phantom above the meter, such as 1.5 mm copper or 20 cm of Acrylic.
• Collimate to size of meter using fluoroscopic image.

College of Physicians and Surgeons of British Columbia
Radiology and CT Quality Control Procedures Workbook
Y5-RS – Spot-Film Output Linearity 67
• Take spot film/acquisition exposures over the range of mA settings which can be selected.
• Calculate coefficient of variation.

College of Physicians and Surgeons of British Columbia
Radiology and CT Quality Control Procedures Workbook
Y6-RD – Radiographic Beam Filtration 68
Y6-RD – Radiographic Beam Filtration The first half-value layer in terms of mm of aluminum must be measured. The measured values must not be less than the values shown in Safety Code 35 Appendix VI for a selected X-ray tube voltage. For most x-ray tubes which can be activated in excess of 80 kVp the standard is HVL > 2.3 mm Al at 80 kVp.
Y6 RD Radiographic Beam Filtration Equipment: Dose meter, aluminium filters.
A convenient way to hold the filters in place is the use of a 1 mm Al filter with Velcro straps to hold it around the collimator/tube assembly. Further filters can easily be added without the likelihood of the filters falling on and damaging the meter.
Comments For radiographic systems only one HVL will need to be measured – at 80 kVp.
College of Physicians and Surgeons of British Columbia
Radiology and CT Quality Control Procedures Workbook
Y6-RS – Beam Filtration 69
Y6-RS – Beam Filtration
Y6-RS1 Radioscopic Beam Filtration The first half-value layer in terms of mm of aluminum must be measured. The measured values must not be less than the values shown in Safety Code 35 Appendix VI for a selected X-ray tube voltage. For most x-ray tubes which can be activated in excess of 80 kVp the standard is HVL > 2.3 mm Al at 80 kVp.
Y6 RS1 Radioscopy HVL Checks the HVL of the x-ray beam during fluoroscopy
CAUTION
• For all fluoroscopic testing you must wear a properly fitting lead apron and a personnel dosimeter.
• Keep your hands out of the primary beam.
Procedure • Set up as in Y3-RS but, as scatter has to be reduced to a minimum, the dosemeter should not
have material closer than 30 cm in the x-ray beam
• Using a stand or low attenuating material (foam, cardboard) to position dosemeter in beam 30 below the table or at the end of table.
• If possible select 80 kVp.
• Record dose rate.
• Add aluminium filters at A until the dose rate decreases to less than half.
• Otherwise if only ABC is available set up as before, but arrange 5 mm of aluminium filters between the dosemeter and the detector, covering the whole beam (Filter B). Next, place attenuators immediately in front of the image intensifier or digital detector to drive the ABC control to 80 kVp. Record dose rate. Remove aluminium filters from the detector side B and move to the x-ray side of the meter (Filter A), until the HVL is reached.

College of Physicians and Surgeons of British Columbia
Radiology and CT Quality Control Procedures Workbook
Y6-RS – Beam Filtration 70
X-ray tube
Filter B
Filter A
Minimum 30 cm

College of Physicians and Surgeons of British Columbia
Radiology and CT Quality Control Procedures Workbook
Y6-RS – Beam Filtration 71
Y6-RS2 – Spot-Film Beam Filtration The first half-value layer in terms of mm of aluminum must be measured. The measured values must not be less than the values shown in Table 8 in subsection B2.5.1 for a selected X-ray tube voltage. For most x-ray tubes which can be activated in excess of 80 kVp the standard is HVL > 2.3 mm Al at 80 kVp.
Y6 RS2 Radioscopy Acquisition HVL Checks the HVL of the x-ray beam during acquisition
CAUTION
• For all fluoroscopic testing you must wear a properly fitting lead apron and a personnel dosimeter.
• Keep your hands out of the primary beam.
Procedure • Set up as below
• Protect the detector with a suitable phantom such as 20 cm Acrylic or 1.5 mm copper sheet.
• Using a stand or low attenuating material (foam, cardboard) to position meter probe in beam 30 above the table or at the end of table.
• If possible select 80 kVp or a suitable programmed body part
• Record dose.
• Add aluminium filters at A until the dose decreases to less than half.

College of Physicians and Surgeons of British Columbia
Radiology and CT Quality Control Procedures Workbook
Y6-RS – Beam Filtration 72
X-ray tube
Filter A

College of Physicians and Surgeons of British Columbia
Radiology and CT Quality Control Procedures Workbook
Y7-FS – Film-Screen AEC Variation 73
Y7-FS – Film-Screen AEC Variation For film-based systems, the automatic exposure control must be evaluated to ensure it performs in such a way that the variation in optical density in the resultant radiograms does not exceed the value of
a. 0.15 when the X-ray tube voltage is variable and the thickness of the irradiated object is constant,
b. 0.20 when the thickness of the irradiated object is variable and the X-ray tube voltage is constant,
c. 0.20 when the thickness of the irradiated object and the X-ray tube voltage are both variable, and,
d. 0.10 when the thickness of the irradiated object and the X-ray tube voltage are both constant.
Y7-FS Radiographic AEC Variation AEC Tests for film-screen Table Bucky
• Arrange the x-ray tube assembly so that is directly over the centre of the Bucky, normally by using the predefined equipment detent positions
• Place acrylic sheets 10 cm thick and large enough to convert the AEC chambers in the centre of the light field, aligned with the edges of the light field.
• Collimate the light field so that it is 2 cm inside the light field on all sides as seen on the surface of the slab.
• On console choose Table Bucky exposure, and a body part, such as abdomen, which uses AEC.
• Select the LEFT AEC photocell
• Use lead markers on the edge of the slab within the light field to identify the exposure (e.g. A1 etc. as the table below)
• Select 80 kVp
• Load a film cassette in the table Bucky
• Make exposure.
• Remove cassette and process film
• Read the OD in the centre of the film with a densitometer
• Repeat for the other cells, other kVps and other thickness as in the table below
• Record readings and compute the variation to compare with the standards above.
Repeat for the wall Bucky
Comments This test uses a lot of film and take some time. An alternative is to use a segmented wheel made from old lead apron as shown below, which is rotated after each exposure (see Appendix).

College of Physicians and Surgeons of British Columbia
Radiology and CT Quality Control Procedures Workbook
Y7-FS – Film-Screen AEC Variation 74
Recording AEC Tests for Film-Screen Systems
10 cm thick phantom
Test film # A1 A2 A3 A4 A5 A6 A7 A8
kVp 80 80 80 80 81 60 100 120
mAs
OD
Chamber left right centre centre centre centre centre centre
15 cm thick phantom
Test film # B1 B2 B3 B4 B5 B6 B7 B8
kVp 80 80 80 80 80 60 100 120
mAs
OD
Chamber left right centre centre centre centre centre centre
25 cm thick phantom
Test film # C1 C2 C3 C4 C5 C6 C7 C8
kVp 80 80 80 80 80 60 100 120
mAs
OD
Chamber left right centre centre centre centre centre centre
1
2
1

College of Physicians and Surgeons of British Columbia
Radiology and CT Quality Control Procedures Workbook
Y7-CR – Computed Radiography AEC Variation 75
Y7-CR – Computed Radiography AEC Variation For digital systems, the performance of the automatic exposure control must be assessed according to the manufacturer’s procedures and must be within the manufacturer’s specifications. It is recommended that the automatic exposure control should perform in such a way that the variation in the mean linearized data on a constant region of interest does not exceed 20% for constant X-ray tube voltage and constant thickness of the irradiated object, when the X-ray system is operated in conditions representative of the typical clinical use. Compliance is checked by ensuring that the ratio of the highest and the lowest measured values is less than or equal to 1.2 or within the manufacturer’s specifications.
CR systems display exposure indexes after each exposure. The meaning varies widely between manufacturers. In some radiographic and R/F rooms both the table Bucky and the wall Bucky will need to be tested.
Y7-CR AEC Tests for CR Systems Table Bucky
• Arrange the x-ray tube assembly so that is directly over the centre of the Bucky, normally by using the predefined detent positions
• Place acrylic sheets 10 cm thick and large enough to convert the AEC chambers in the centre of the light field, aligned with the edges of the light field.
• Collimate the light field so that it is 2 cm inside the light field on all sides as seen on the surface of the slab.
• Use lead markers on the edge of the slab within the light field to identify the exposure ( e.g. A1 as the table below), or annotate at the CR reader
• On console choose Table Bucky exposure, and a body part, such as abdomen, which uses AEC.
• Select the LEFT AEC photocell
• Select 80 kVp
• Load a freshly erased CR cassette in the table Bucky
• Make exposure.
• Remove cassette and read cassette Exposure Index (keep the time before reading constant as light emission from CR plates decreases over the first 20 minutes)
• Repeat for the other cells, other kVps and other thickness as in the table below
• Record readings
• Convert Exposure Index readings to cassette dose as above.
• Compute the variation in exposure to compare with the standards above.
Repeat for wall Bucky

College of Physicians and Surgeons of British Columbia
Radiology and CT Quality Control Procedures Workbook
Y7-CR – Computed Radiography AEC Variation 76
Comments • Note: for a quick test to compare the variation in the photocells at 80 kVp – left, center and
right, it is possible merely to record the mAs values used. Of course this cannot be used to compare various kVps.
• A commercial cassette which measures the light output from a CR screen is also available to do this test (DISC Radchex, Winnipeg MN), which may be useful if large numbers of systems are to be tested.
Recording AEC Tests for CR Systems
10 cm thick phantom
Image # A1 A2 A3 A4 A5 A6 A7 A8
kVp 80 80 80 80 80 60 100 120
mAs
Exposure indicator
Exposure microgray
Chamber left right centre centre centre centre centre centre
15 cm thick phantom
Image # B1 B2 B3 B4 B5 B6 B7 B8
kVp 80 80 80 80 80 60 100 120
mAs
Exposure indicator
Exposure microgray
Chamber left right centre centre centre centre centre centre
25 cm thick phantom
Image # C1 C2 C3 C4 C5 C6 C7 C8
kVp 80 80 80 80 80 60 100 120
mAs
Exposure indicator
Exposure microgray
Chamber left right centre centre centre centre centre centre

College of Physicians and Surgeons of British Columbia
Radiology and CT Quality Control Procedures Workbook
Y7-DR – Digital Radiography AEC Variation 77
Y7-DR – Digital Radiography AEC Variation For digital systems, the performance of the automatic exposure control must be assessed according to the manufacturer’s procedures and must be within the manufacturer’s specifications. It is recommended that the automatic exposure control should perform in such a way that the variation in the mean linearized data on a constant region of interest does not exceed 20% for constant X-ray tube voltage and constant thickness of the irradiated object, when the X-ray system is operated in conditions representative of the typical clinical use. Compliance is checked by ensuring that the ratio of the highest and the lowest measured values is less than or equal to 1.2 or within the manufacturer’s specifications.
DR systems display exposure indexes (EXI) after each exposure. The DR EXI values should be linearly related to the pixel values in a uniform image and to dose at the detector (this is a separate test for DR systems). In some radiographic and R/F rooms both the table Bucky and the wall Bucky will need to be tested.
Y7 DR AEC Tests for DR Systems Table Bucky
• Arrange the x-ray tube assembly so that is directly over the centre of the Bucky, normally by using the predefined detent positions
• Place acrylic sheets 10 cm thick and large enough to cover the AEC chambers in the centre of the light field, aligned with the edges of the light field.
• Collimate the light field so that it is 2 cm inside the light field on all sides as seen on the surface of the slab.
• Use lead markers on the edge of the slab within the light field to identify the exposure ( e.g. A1 as the table below), or annotate at the CR reader
• On console choose Table Bucky exposure, and a body part, such as abdomen, which uses AEC.
• Select the LEFT AEC photocell
• Select 80 kVp
• Make exposure.
• Record EXI readings
• Repeat for other kVps and thicknesses as in the table below
Repeat for wall Bucky
Comments Compute the variation in EXI to compare with the standards above (DR EXI should be linear with dose – this is checked in Test Y11 from website test protocol).

College of Physicians and Surgeons of British Columbia
Radiology and CT Quality Control Procedures Workbook
Y7-DR – Digital Radiography AEC Variation 78
Recording AEC Tests for DR Systems
10 cm thick phantom
Image # A1 A2 A3 A4 A5 A6 A7 A8
kVp 80 80 80 80 80 60 100 120
mAs
EXI
Exposure microgray
Chamber left right centre centre centre centre centre centre
15 cm thick phantom
Image # B1 B2 B3 B4 B5 B6 B7 B8
kVp 80 80 80 80 80 60 100 120
mAs
EXI
Exposure microgray
Chamber left right centre centre centre centre centre centre
25 cm thick phantom
Image # C1 C2 C3 C4 C5 C6 C7 C8
kVp 80 80 80 80 80 60 100 120
mAs
EXI
Exposure microgray
Chamber left right centre centre centre centre centre centre

College of Physicians and Surgeons of British Columbia
Radiology and CT Quality Control Procedures Workbook
Y8-9 – Light Field and X-ray Field Alignment 79
Y8-9 – Light Field and X-ray Field Alignment The alignment of the light localizer, designed to define the outline of the X-ray field, with the X-ray field must be verified. In the plane of the image receptor, the misalignment, of the edges of the visually defined field with the edges of the X-ray field must not exceed 2% of the focal spot to image receptor distance.
Y9 – X-ray Beam Collimation a. An evaluation of the beam limiting device must be made to ensure that the equipment is
capable of aligning the centre of the X-ray field with the centre of the image reception area to within 2% of the focal spot to image receptor distance.
b. Radiographic X-ray equipment that has a positive beam limiting system must prevent the emission of X-rays until the beam limiting device is adjusted so that
• the dimensions of the X-ray field do not exceed those of the image reception area, or the selected portion of that area, by more than 3% of the focal spot to image receptor distance, and
• the sum of the absolute values of the differences in the dimensions of the X-ray field and the image reception area, or the selected portion of that area, does not exceed 4% of the focal spot to image receptor distance.
c. Radioscopic equipment equipped with a spot-film device must have a mechanism that, when the X-ray beam axis is perpendicular to the image reception plane, permits the perimeter of the X-ray field to be aligned with that of the selected portion of the image reception area so that
• the dimensions of the X-ray field differ from the corresponding dimensions of the image reception area by a distance that does not exceed 3% of the focal spot to image receptor distance, and
• the sum of the absolute values of the differences in the dimensions between the X-ray field size and the image reception area does not exceed 4% of the focal spot to image receptor distance.

College of Physicians and Surgeons of British Columbia
Radiology and CT Quality Control Procedures Workbook
Y8/Y9 – Radiography Collimator Alignment 80
Y8/Y9 – Radiography Collimator Alignment Y8/Y9 Radiography
Collimator Alignment
Field size congruency and vertical alignment can be tested with one exposure using the test set-up shown below, using film or CR cassettes or the built-in DR detector.
The vertical tube is a commercial device for checking the vertical alignment by observing the image of a hole in the centre of the top surface compared to that in the base adjacent to the cassette.
Technique
• With the x-ray tube in the vertical position and with 100 cm FFD, adjust the collimators to give a 25 x 20 cm light field, roughly in the centre of the cassette.
• Mark the edges and corners of the light field with coins or paper clips.
• Place the alignment tube exactly in the centre of the field
• Expose at about 80 kVp 1 mAs.
Comments Field size: the light field and x-ray field should be within 2 cm at an FFD of 100 cm
Vertical alignment of field centres should be within 2 cm (follow test tool instructions)
The next page gives simple test tool which can be made to give an immediate indication of alignment and congruency.
alignment tube
alignment cassette

College of Physicians and Surgeons of British Columbia
Radiology and CT Quality Control Procedures Workbook
Y8/Y9 – Radiography Collimator Alignment 81
Alignment Phantom Phantom Using coins or paper clips with a fluorescent screen involves a certain amount of guesswork, and potential radiation exposure. Here is a simple home-made alignment phantom constructed from strips of film screen 1 cm wide glued inside a 24x30 cm cassette. This gives a permanent image of the alignment which can be saved for future comparison,
Evaluation On film x-ray field should just cover the outside of the tapered markers as shown on this sheet. Each of the markers and gaps is 1 cm wide. If alignment is out by more than 1 cm inform service staff.
Correct Field Size
1 1 1
Alignment tube
location
Cassette for field size and collimator alignment
Correct Field Size

College of Physicians and Surgeons of British Columbia
Radiology and CT Quality Control Procedures Workbook
Y8/Y9 – Radiography Collimator Alignment 82

College of Physicians and Surgeons of British Columbia
Radiology and CT Quality Control Procedures Workbook
Y8-9 RS – Radioscopy Field Size and Alignment 83
Y8-9 RS – Radioscopy Field Size and Alignment Radioscopic equipment equipped with a spot-film device must have a mechanism that, when the X-ray beam axis is perpendicular to the image reception plane, permits the perimeter of the X-ray field to be aligned with that of the selected portion of the image reception area so that
• the dimensions of the X-ray field differ from the corresponding dimensions of the image reception area by a distance that does not exceed 3% of the focal spot to image receptor distance, and
• the sum of the absolute values of the differences in the dimensions between the X-ray field size and the image reception area does not exceed 4% of the focal spot to image receptor distance.
X-ray/image size This test checks if the x-ray field is the same or less than the image receptor size.
CAUTION • For all fluoroscopic testing you must wear a properly fitting lead apron and a personnel dosimeter.
• Keep your hands out of the primary beam.
Equipment required Radio-opaque ruler, sheet of 1 cm square mesh at least 30x30 or similar
Method • Place test tool over detector
• Record maximum dimensions from the fluoroscopic image
• Compare with selected image size and with estimated size of detector, and with displayed size if available
• Newer fluoroscopy systems may always display a non-irradiated edge around image or computer generated field edge, or virtual collimators
• Tolerance 2% of focus to detector distance

College of Physicians and Surgeons of British Columbia
Radiology and CT Quality Control Procedures Workbook
Y10 – Grid Performance 84
Y10 – Grid Performance Grid performance, including movement and uniformity, must be checked annually.
Radiographic Grid Performance Suggested Method
Grids can become damaged with use and this adversely affects image quality.
To check the uniformity of a grid in a bucky
For film and CR place a 47 x35 cm cassette in the bucky.
For film, CR and DR ensure bucky is centred below the tube (use the detents)
Set FFD to the mid-point of the grids focal range
Open the light field to the largest size available
Either use a uniform phantom of 10 cm to cover the field size or use a 1.5 mm copper filter at the collimator
Take an AEC exposure at 80 kVp
Process image
Technique Image should be uniform across the whole image, not uneven as shown below.
This type of problem is not uncommon for CR where the “shading” correction (which corrects for the differences caused by the raster scanning) has to be set up properly to give an even image. Most CR systems have phantoms and software to detect and correct this type of problem.
College of Physicians and Surgeons of British Columbia
Radiology and CT Quality Control Procedures Workbook
Y10-RS – Grid Performance 85
Y10-RS – Grid Performance In Radioscopy systems grids are usually difficult to remove. Any abnormalities should be seen in a uniform exposure image as in Y10.

College of Physicians and Surgeons of British Columbia
Radiology and CT Quality Control Procedures Workbook
Y11-Y17-CR – Computed Radiography Image Quality 86
Y11-Y17-CR – Computed Radiography Image Quality Image quality is stressed for all systems in Safety Code 35. In the relevant sections Health Canada’s advice is “the manufacturer’s recommended test procedures must be followed…” If manufacturers’ tests or phantoms are used by the manufacturers themselves or in-house staff, there must be quantifiable measurements which can be used to track performance. Otherwise the QC methods described in these documents should be used.
All CR systems can provide QC phantoms plus associated software designed for use in a QC program by the manufacturer. It is suggested that this approach be used for CR.
It is important that the manufacturers’ instructions be followed for dose calibration of the readers also, as all systems are calibrated at different beam filtrations.
Particularly important in these tests are:
• Use of a linear output processing function rather than the preprogrammed body part.
• Use of the correct filter in the x-ray beam.
All areas of image quality (Y11 to Y17) are measured except contrast (Y16). It is recommended that a Leeds CDR phantom or similar be used to provide a reference image.
Dynamic range and Contrast Detectability (Y-13 and Y16-CR) Several methods can be used to document the contrast capability of a system. As contrast resolution depends on several factors, mainly the dose and the image processing algorithm, these must be kept constant for repeated or annual measurements.
Dynamic Range
Settings:100 cm SDD; 70 kVp; CR cassette on tabletop; no grid; collimate to phantom; no AEC, and the 1 mm copper filter in place.
Determine the mAs required to give air kerma doses on the surface of the cassette of 1, 4, 12 and 50 microgray (This is the range of doses that the imaging plate will receive clinically).
Remove dose meter. Replace the used cassette with a recently erased CR cassette for each of the following exposures
a. 1 microgray
b. 4 microgray
c. 12 microgray
Read the cassettes and note the Exposure Index for each cassette. The exposure index, when converted to dose should be linear with the dose to the cassette (Y13 CR Dynamic Range).
Check the images for artifacts and uniformity

College of Physicians and Surgeons of British Columbia
Radiology and CT Quality Control Procedures Workbook
Y11-Y17-CR – Computed Radiography Image Quality 87
Contrast Detectability
Method 1 Leeds TOR CDR
This is a simple phantom designed for CR or film-screen which can measure low contrast sensitivity, high contrast sensitivity and spatial resolution.
Procedure
Settings:100 cm SDD; 70 kVp; CR cassette on tabletop; no grid; collimate to phantom; no AEC, and the 1 mm copper filter in place.
Determine the mAs required to give air kerma doses on the surface of the cassette of 1, 4, 12 and 50 microgray (This is the range of doses that the imaging plate will receive clinically).
Remove dose meter. Replace the used cassette with a recently erased CR cassette and place the Leeds phantom in the centre of the light field for each of the following exposures:
a. 1 microgray
b. 4 microgray
c. 12 microgray
Read the cassettes and note the Exposure Index for each cassette. View the images on a calibrated clinical workstation at 30 cm to determine the number of each size of object which can be fully discerned, and the smallest group of lines which can be discerned. Use the tables which come with TOR CDR to determine the contrast threshold for the 11 mm and 0.5 mm objects and the spatial resolution. The 5.6 mm disks give 10 grey scale steps. Automatic image analysis programs (PIAAA) are also available from Leeds Test Object to reduce the subjectivity of this test.
Radiograph of the CDR phantom

College of Physicians and Surgeons of British Columbia
Radiology and CT Quality Control Procedures Workbook
Y11-Y17-CR – Computed Radiography Image Quality 88
Method 2 Artinis CDRAD Phantom
The CDRAD phantom is a contrast-detail phantom made from Acrylic. 225 holes of different diameter and depth are arranged in a matrix on a sheet approximately 26x26x1 cm. Because of the number of contrast-detail objects involved the automatic analysis software CDRAD Analyser is recommended (www.artinis.com ).
Procedure
The phantom can be used in many different ways. The suggested method described here tests the system over the range of clinical conditions.
Equipment required:
• Sheets of Acrylic 26x26 cm or greater to make a total thickness of 20 cm
• CDRAD phantom and CDRAD Analyser software
• PACS Connectivity or CDs/DVDs to record images for analysis
• Tape measure
• Dose meter
• Personnel dosimeter
The CDRAD phantom

College of Physicians and Surgeons of British Columbia
Radiology and CT Quality Control Procedures Workbook
Y11-Y17-CR – Computed Radiography Image Quality 89
Place a freshly erased CR cassette in the Bucky, and ensure it is correctly aligned with the x-ray light field. Place 10 cm of Plexiglas on the table top, then the CDRAD phantom, then 10 cm more Plexiglas on top. Collimate the beam to the size of the phantom.
Set up a standard supine AP Abdomen protocol at ~100 cm FDD. This will be a photo-timed procedure at about 80 kVp. Try to minimize the image pre-processing as recommended in the manufacturers’ test methods. This means removing any high frequency image processing and using a lookup table slope of 1.0. If this is not possible use the standard processing functions set for that protocol.
Note the kVp, mAs, SSD, AEC chambers used, any density corrections, and image processing factors. Make the exposure, process the image and note the Exposure Index. Annotate the image for future identification. Using exactly the same exposure factors (set mAs, no AEC), make an exposure with a solid state dose meter in the centre of the x-ray field, or with an ion chamber 30 cm above the phantom surface. Calculate surface dose by multiplying the surface air kerma by the backscatter factor.
The image will appear as below.
CDRAD phantom sandwiched
between two 10 cm slabs of acrylic
10 cm acrylic
10 cm acrylic
CDRAD phantom
Position for Dosemeter

College of Physicians and Surgeons of British Columbia
Radiology and CT Quality Control Procedures Workbook
Y11-Y17-CR – Computed Radiography Image Quality 90
When analyzed with the software, the details which can be accurately visualized will appear red as shown above. The system will also give an Image Quality Index. Ensure you note all the exposure and setup information so the exposure can be accurately repeated at future sessions.
Repeat for 10 cm of acrylic plus the CDRAD phantom at PA Chest settings.
Note: The phantom surface dose measurement required in Y18 can also be made at this time by using the preset clinical AP Abdomen and PA Chest protocols.

College of Physicians and Surgeons of British Columbia
Radiology and CT Quality Control Procedures Workbook
Y11-DR – Digital Radiography (DR) Image Quality 91
Y11-DR – Digital Radiography (DR) Image Quality Image quality is stressed for all systems in Safety Code 35. In the relevant sections Health Canada’s advice is “the manufacturer’s recommended test procedures must be followed…” If manufacturers’ tests or phantoms are used by the manufacturers themselves or in-house staff, there must be quantifiable measurements which can be used to track performance (there is not just a pass/fail indicator). Otherwise the QC methods described in these documents should be used.
Y11 (DR) to Y14 (DR) and Y17 (DR) in HCSC35 can be assessed with the following procedures
Equipment required:
• Sheets of Acrylic 26x26 cm or greater to make a total thickness of 20 cm
• Approximately 15x15 cm 1.5 mm copper filter (this is only used to reduce the intensity of the x-ray beam at the surface of the DR detector)
• Phantom of known dimensions for scaling determination – approximately 10x10 cm 1 mm copper or 20 mm aluminum (this is in addition to the filter above).
• PACS Connectivity or CDs/DVDs to record images for analysis
• Tape measure
• Dosemeter to measure air kerma (Gy). If a solid state detector is used the reading should be in air kerma. If an ionization chamber is used readings should be made at least 30 cm from the detector or the filter to avoid scatter, and the reading corrected for the detector distance by the inverse square law.
• Personnel dosimeter
Procedure Ensure that any preventive maintenance and calibrations of the detector have been performed at the required interval (varies from every month to semi-annually depending on the manufacturer and the system).
Settings: 100 cm or 180 cm SSD; 80 kVp; no grid; largest field at detector (often 43x43 cm); no AEC) and the copper filter in place, determine the mAs required to give exposures on the surface of the detector of 1, 4, 12 and 50 microgray measured with the dosemeter.
Remove dose meter. Try to minimize the image pre-processing as recommended in the manufacturers’ test methods. This means removing any high frequency image processing and using a lookup table slope of 1.0. If this is not possible use the standard processing functions set for that protocol. Annotate the images for future reference using the software on the DR console).
Make a full-field exposure for each of the following doses
a. 1 microgray
b. 4 microgray
c. 12 microgray (make three exposures at this dose)
d. 50 microgray

College of Physicians and Surgeons of British Columbia
Radiology and CT Quality Control Procedures Workbook
Y11-DR – Digital Radiography (DR) Image Quality 92
e. Obtain an ‘blank’ image: select 50 kVp; 0.5 mAs; close the collimator and cover the detector with a lead apron before making the exposure
f. Open the collimators; remove the apron and place the Scaling Phantom in centre of field make an exposure as in (c)
g. Obtain a blank image as in (e)
Record the Exposure Index (EXI) for each exposure. Save the images to PACS or to a local CD/DVD.
Analysis for Linearity, Uniformity, Noise and Artifacts
Linearity
View the images on a clinical workstation. With a region of interest (ROI) of diameter about one tenth of the width of the image, record the average pixel value. Using Excel or equivalent software plot the EI and average pixel value against the detector doses from 1 to 50 microgray. Choose a linear fit through these points and determine the R2 value. This should be better than 0.95.
Uniformity
Purpose: To assess the uniformity of the recorded signal from a uniformly exposed detector. A non-uniform response could affect clinical image quality.
• Visually inspect all 4 images obtained in the previous test for uniformity and artefacts.
• The image corresponding to a detector dose of 4 microgray should be assessed using region of interest (ROI) analysis; to measure the mean and standard deviation of the pixel values at the centre of the image and the centre of the four quadrants. If uniformity is poor in the direction of the anode-cathode axis this is likely to be a result of the anode heel affect. To confirm this, the test should be repeated with the tube rotated through 90o.
• The five mean values obtained from ROI analysis should be used to calculate five indicated receptor dose values using the relation obtained in test 1.4
Tolerance: The images should not have obvious artefacts. The ratio of the standard deviation of the 5 calculated receptor doses to their mean (the coefficient of variation) should be less than 10%.
Consistency
The EIs of the images taken at 12 microgray should not vary by more than 20%
Image retention
Purpose: To test that any detectable residual signal (ghosting) that remains in subsequent images is minimal.
Set a very narrow window and adjust the level. Visually inspect the image for any remnant of the previous image. If a remnant is visible, use region of interest analysis to quantify the difference in pixel value between the ghosted and unghosted areas. The ROI values should be used to calculate indicated receptor doses using the STP equation established in test 1.3 (see later).

College of Physicians and Surgeons of British Columbia
Radiology and CT Quality Control Procedures Workbook
Y11-DR – Digital Radiography (DR) Image Quality 93
Scaling
Using the Measurement tools on the viewing station ensure that the measured size of the Scaling Phantom is the same as the Actual Size with 1 mm.
Contrast Detectability (Y16-DR HCSC35 test ) Image quality is stressed for all systems in Safety Code 35. In the relevant sections Health Canada’s advice is “the manufacturer’s recommended test procedures must be followed…” If manufacturers’ tests or phantoms are used by the manufacturers themselves or in-house staff, there must be quantifiable measurements which can be used to track performance (there is not just a pass/fail indicator). Otherwise the QC methods described in these documents should be used.
Artinis CDRAD Phantom The CDRAD phantom is a contrast-detail phantom made from Acrylic. 225 holes of different diameter and depth are arranged in a matrix on a sheet approximately 26x26x1 cm. Because of the number of contrast-detail objects involved the automatic analysis software CDRAD Analyser should be used.
The CDRAD phantom
ROI 1 ROI 2
attenuated region
Regions of interest for image retention

College of Physicians and Surgeons of British Columbia
Radiology and CT Quality Control Procedures Workbook
Y11-DR – Digital Radiography (DR) Image Quality 94
The phantom can be used in many different ways. The suggested method described here tests the system under the range of clinical conditions.
Equipment required:
• Sheets of Acrylic 26x26 cm or greater to make a total thickness of 20 cm
• CDRAD phantom and CDRAD Analyser software
• PACS Connectivity or CDs/DVDs to record images for analysis
• Tape measure
• Dose meter
• Personnel dosimeter
• (Dosemeter)
Ensure the detector is correctly aligned with the x-ray light field by using the CTM detents or lasers. Place 10 cm of acrylic on the table top in the centre of the light field, then the CDRAD phantom, then 10 cm more Acrylic on top. Collimate the beam to the size of the phantom.
Set up a manual abdomen protocol at ~100 cm SSD and 80 kVp with the grid in place. Take test exposures to give the EXI values corresponding to 1, 4 and 12 microgray at the detector which were measured in section Y11-Y14-DR (mAs values will not be exactly the same as in the previous section). Take one image of the phantom at each of these mAs values. Try to minimize the image pre-processing. This means removing any high frequency image processing and using a lookup table slope of 1.0
Finally take one image with the standard AP Abdomen protocol using AEC. Process the image and note the Exposure Index. Record the EXI, kVp, mAs, and SSD used for each exposure. Identify the image for future identification using the annotation software at the console.
The images will appear as below.
10 cm acrylic
10 cm acrylic
CDRAD phantom

College of Physicians and Surgeons of British Columbia
Radiology and CT Quality Control Procedures Workbook
Y11-DR – Digital Radiography (DR) Image Quality 95
When analyzed with the software, the details which can be accurately visualized will appear red as shown above. The system will also give an Image Quality Factor (IQF) for each image. Ensure you note all the exposure and setup information so the exposure can be accurately repeated at future sessions
Note the IQFs for each image and calculate the detector dose required for the standard AP Abdomen protocol.
Note: The phantom surface dose measurement required in Y18 can also be made at this time by using the preset clinical AP Abdomen and PA Chest protocols.

College of Physicians and Surgeons of British Columbia
Radiology and CT Quality Control Procedures Workbook
Y13-FS – Dynamic Range and Contrast 96
Y13-FS – Dynamic Range and Contrast Dynamic Range and Contrast can be measured with a step-wedge.
For film screen systems, a high purity step wedge should be used to monitor the performance of the X-ray generator. When using a 11-step wedge, the acceptable variation in film optical density (OD) should be ± 1 step from the established baseline density, or when using a 21-step wedge, the acceptable variation in film density should be ± 2 steps from the established baseline density. Contrast index can be calculated by recording the difference in optical density (OD) between two reference steps on the sensitometric film. The upper step will usually be the one which has an OD closest to 2.2.
Below is a typical film from a 21 step wedge, showing:
1. base+fog with an OD of 0.2
2. speed index of 1.2 (step closest to OD =1.0 ). Film speed is defined by the dose required to give an optical density of 1.0
3. contrast index here is taken as the OD of the step closest to OD of 2.2 less the speed index
This process is similar to sensitometry used to monitor film processor performance, in which film strips are exposed to light in a sensitometer and processed. In principle the sensitometer film can be used to produce a complete characteristic or gamma curve for the film, but usually only the three steps are measured.

College of Physicians and Surgeons of British Columbia
Radiology and CT Quality Control Procedures Workbook
Y13-FS – Dynamic Range and Contrast 97

College of Physicians and Surgeons of British Columbia
Radiology and CT Quality Control Procedures Workbook
Y15 – Spatial Resolution 98
Y15 – Spatial Resolution Purpose: To test the high contrast limit of the system’s ability to resolve details.
Ensure the grid is removed from the system, there is no attenuation in the beam and the FDD is set as large as possible. Place the resolution test object onto the detector aligned at 45o to its edges. Set 50-60 kV and expose the cassette using 5-10mAs on fine focus.
Adjust the window level and magnification to optimise the resolution. Score the number of resolvable groups of lines from the screen. The image should be scored at a magnification of order x 5. If this facility is not available on the review workstation then images should be transferred to the reporting workstation for scoring. Look up the corresponding resolution.
Typical Line-pair phantoms

College of Physicians and Surgeons of British Columbia
Radiology and CT Quality Control Procedures Workbook
Y16-RS – Digital and Conventional Radioscopy Image Quality 99
Y16-RS – Digital and Conventional Radioscopy Image Quality
Contrast and Resolution For conventional and digital radioscopy the standard test tool is the Leeds phantom TOR 18FG. This allows measurement of
• Low contrast limit – there are 18 8 mm diameter circles of known contrast
• Spatial resolution limit – there are 21 groups of resolution patterns
• Circular linearity
• Monitor brightness and contrast setup
Procedure
With a 1mm filter at the collimator, typically the phantom is exposed at 70 kVp in ABC mode (copper filter can be adjusted to give the correct kVp).
View the images on the unit’s workstation at 30 cm to determine the number of each size of object which can be fully seen, and the smallest group of lines which can be discerned. Use the tables which come with TOR 18FG to determine the contrast threshold for the 8 mm objects and the spatial resolution.

College of Physicians and Surgeons of British Columbia
Radiology and CT Quality Control Procedures Workbook
Y16-RS – Digital and Conventional Radioscopy Image Quality 100
Uniformity and Artifacts Remove the phantom but use the same exposure factors. Look for any non-uniformity of the image or artifacts.

College of Physicians and Surgeons of British Columbia
Radiology and CT Quality Control Procedures Workbook
Y18 – Phantom Dose Measurements 101
Y18 – Phantom Dose Measurements Entrance skin air kerma measurement for frequently performed examinations must be within established limits. Measurements should be performed using the equipment geometry and loading conditions representative of those used clinically. Dose values obtained should be used for the annual review of the facilities Diagnostic Reference values.
Procedure The suggested method described here tests the system for typical abdomen and chest radiography, and can be used for Film-screen, CR and DR systems.
Equipment required:
• Sheets of Acrylic 26x26 cm or greater to make a total thickness of 20 cm
• Tape measure
• Dose meter
• Personnel dosimeter
For removable detectors place a film or a freshly erased CR cassette in the bucky. For all systems ensure the bucky is correctly aligned with the x-ray light field. Place a 21 cm thickness of acrylic sheets approximately 25x25 cm on the table top.
Collimate the beam to just less than the size of the phantom. Set up a standard supine abdomen protocol at ~100 cm SSD. This will be a phototimed procedure at about 80 kVp. Take an exposure and note all settings so that it can be repeated without AEC.
Place the dosimeter on the phantom as shown (Or if using an ion chamber arrange for the active chamber to be 30 cm above the surface of the phantom and correct by the inverse square law.) Take exposure and note air kerma reading. Calculate the phantom surface dose from:
Surface dose = surface air kerma x BSF
21 cm acrylic with dosemeter

College of Physicians and Surgeons of British Columbia
Radiology and CT Quality Control Procedures Workbook
Y18 – Phantom Dose Measurements 102
Repeat for a routine PA chest radiograph using a phantom 10 cm thick. This will be a phototimed procedure at about 110 kVp.
Covert the air kerma dose you have measured in mGy to surface dose by multiplying by the Backscatter Factor below:
HVL mm Al kVp Backscatter Factor
AP Abdomen AP Chest
2.5 80 1.37 1.27
3.0 80 1.41 1.30
4.0 110 1.45 1.43
Compare the calculated surface dose with the ACR proposed Phantom Reference Doses
Projection Surface Dose mGy*
AP Abdomen 6.3
PA Chest 0.36
*including backscatter
Gray J et al. Radiology 2005; 235:354–358

College of Physicians and Surgeons of British Columbia
Radiology and CT Quality Control Procedures Workbook
Y18-RS – Phantom Dose in Acquisition/Spot-Film Mode 103
Y18-RS – Phantom Dose in Acquisition/Spot-Film Mode
Y4 RS
Spot-film/Acquisition Reproducibility
For RF systems which have the tube overtable the method for Radiography above can be used with a phantom in the beam to protect the detector and to drive the system to normal operating parameters. For all other RF, angiography and C arm systems use the method below.
CAUTION • For all fluoroscopic testing you must wear a properly fitting lead apron and a personnel dosimeter.
• Keep your hands out of the primary beam.
Comments If possible set the kVp at 80 kVp; the mAs will automatically adjust.
Procedure In most RF, angiography and C arm systems the tube cannot be rotated above the table. Therefore the kVp meter should face downwards in most cases.
• For RF rooms, place meter probe on table top facing towards x-ray tube
• For C arms set gantry to 1800 set table to isocentre and place meter on table facing towards x-ray tube
• Use a suitable phantom above the meter, such as 1.5 mm copper or 20 cm of Acrylic.
• Collimate to size of meter using fluoroscopic image
• Take ten spot film/acquisition exposures and record readings.
The coefficient of variation of any ten consecutive irradiation measurements, taken at the same source to detector distance within a time period of one hour, is no greater than 0.05, and each of the ten irradiation measurements is within 15% of the mean value of the ten measurements .

College of Physicians and Surgeons of British Columbia
Radiology and CT Quality Control Procedures Workbook
Y18-RS – Phantom Dose in Acquisition/Spot-Film Mode 104
X-ray tube
detector table

College of Physicians and Surgeons of British Columbia
Radiology and CT Quality Control Procedures Workbook
Y19 – Typical Air Kerma Rate of Radioscopic Equipment 105
Y19 – Typical Air Kerma Rate of Radioscopic Equipment Using a uniform phantom placed on the patient support, measurements of the typical entrance air kerma rate, including backscatter, should be made for all geometries and modes of operation used clinically. The values should be within established levels.
Spot-film/Acquisition Reproducibility
For RF systems which have the tube overtable the method for Radiography above can be used with a phantom in the beam to protect the detector and to drive the system to normal operating parameters. For all other RF, angiography and C arm systems use the method below.
Comments With the phantom in the beam the kVp and the mAs will automatically adjust.
Technique In most RF, angiography and C arm systems the tube cannot be rotated above the table. Therefore the kVp meter should face downwards in most cases.
• Place meter probe on table top facing towards x-ray tube
• For C arms set gantry to 1800. Set table at isocentre and adjust so that the dosemeter probe is at 30 cm from the image detector.
• Record focus to detector distance (FDD),and focus to probe distance(FCD).
• Use a suitable phantom supported above the meter, such as 1.5 mm copper or 20 cm of Acrylic.
• Collimate to largest size visible on display.
• Turn on fluoroscopy, allowing time for meter to integrate the signal.
• Ensure the dosemeter itself is not driving the dose rate higher by observing the mAs and kVp without the dosemeter probe.
• Record kVp, mAs, Magnification, Dose Level, and Dose Rate.
• Repeat for all magnifications and dose levels.

College of Physicians and Surgeons of British Columbia
Radiology and CT Quality Control Procedures Workbook
Y19 – Typical Air Kerma Rate of Radioscopic Equipment 106
X-ray tube
detector table

College of Physicians and Surgeons of British Columbia
Radiology and CT Quality Control Procedures Workbook
Y20 – Maximum Air Kerma Rate of Radioscopic Equipment 107
Y20 – Maximum Air Kerma Rate of Radioscopic Equipment Radioscopic equipment, other than when recording images, must not operate at any combination of X-ray tube voltage and X-ray tube current that results in an air kerma rate that exceeds i) 50 mGy/min when the equipment is not fitted with an automatic intensity control, ii) 100 mGy/min when the equipment is fitted with an automatic intensity control, and iii) 150 mGy/min when the equipment is fitted with both an automatic intensity control and a high level irradiation control when the latter is activated. The image intensifier must be protected with sufficient (approximately 6 mm) lead sheets when performing this test.
Procedure This can be performed immediately following Y19 -Typical Air Kerma Rate of Radioscopic Equipment. With the same setup cover the phantom with 2 mm lead or layers of lead aprons to drive the system to its maximum output. Repeat the measurements performed in Y19.
100 mGy/min is the maximum allowed in the RED Act when the equipment is fitted with an automatic intensity control.
150 mGy/min is the maximum allowed in the RED Act when the equipment is fitted with both an automatic intensity control and a high level irradiation control when the latter is activated (there should be an audible warning of the high level mode).

College of Physicians and Surgeons of British Columbia
Radiology and CT Quality Control Procedures Workbook
Y21 – Automatic Intensity Control 108
Y21 – Automatic Intensity Control An evaluation must be made of the automatic intensity control system of radioscopic systems. The automatic intensity control system is designed to maintain the rate of the X-ray exposure to the image intensifier/detector.
Procedure This can be performed immediately following Y19 -Typical Air Kerma Rate of Radioscopic Equipment.
With the same setup, measure the dose to the image detector. Remove 10 cm thickness of the acrylic phantom and re-measure the dose to the image detector. Value should be within 10%.

College of Physicians and Surgeons of British Columbia
Radiology and CT Quality Control Procedures Workbook
Y23 – CT number dependence on phantom position 109
Y23 – CT number dependence on phantom position The CT number for water must not vary by more than ± 5 HU when the position of a water filled phantom is varied over clinically relevant positions on the patient support.
All CT scanners come with cylindrical water phantoms to be used for quality control. They can be fixed in the slot for the head holder. Otherwise use a cylindrical phantom in the head holder.
Procedure 1. Attach cylindrical phantom to the head holder and move the phantom so that the centre of the
water section is at the isocentre.
2. Perform an axial (sequential) scan over the length of the water phantom to give 5 mm reconstructed slices, using standard brain CT acquisition parameters.
3. View the central reconstructed slice, and with the scanner analysis software draw a circular region of interest (ROI) in the centre of the image with a diameter of about 40% of the image width.
4. Record CT number of water; The CT number must be in the range 0 ± 4HU
5. Repeat with bed raised 10 cm
6. Repeat with bed lowered 10 cm
7. Record acquisition parameters for repeatability
GE QC phantom
Siemens QC phantom attached at the
head holder of the patient table

College of Physicians and Surgeons of British Columbia
Radiology and CT Quality Control Procedures Workbook
Y24 – CT Radiation Dose Profile 110
Y24 – CT Radiation Dose Profile The collimation of the radiation beam should be assessed to ensure it does not exceed the prescribed scan width. Scan width is typically defined as the full width half maximum (FWHM) of the radiation dose profile. For each available scan width, the FWHM of the radiation dose profile should not exceed the prescribed scan width by more than manufacturer’s specifications. The FWHM of the radiation dose profile can be measured either directly from the density profile of the resultant film or computed from the digital profile upon digitization of the image.
This is an optional test. The most relevant way to perform this for multidetector scanners is to perform an axial scan of the water phantom as in Y23 with the widest beam collimation, and reconstruct with the smallest slice width. Measure the noise at the centre of all the reconstructed images. As Dose ~ Noise-½ in Excel it is straightforward to plot dose against the beam width. Accuracy is limited by the reconstructed slice width which will be of the order of 1.0 mm.

College of Physicians and Surgeons of British Columbia
Radiology and CT Quality Control Procedures Workbook
Y25 – CT Radiation Dose-Scan Projection Radiograph/Scout Localization Image 111
Y25 – CT Radiation Dose-Scan Projection Radiograph/Scout Localization Image The dose delivered from a scout localization image, which is a scanned projection radiograph, must remain within ± 20% of the nominal value. Changes in this dose can be indicative of problems with collimation or patient support movement. The technique and loading factors used to obtain the scout localization image must be recorded, so that identical test conditions can be used for subsequent tests. It is recommended that this test be performed semi-annually, but must be performed at least annually.
Procedure It is suggested that dose indicators be used for this test and these can be measured at the same time that the kVps of the system are measured in Y3. For each of the kVps record the kVp and the air kerma.

College of Physicians and Surgeons of British Columbia
Radiology and CT Quality Control Procedures Workbook
Y26 – Viewboxes 112
Y26 – Viewboxes All viewboxes must be tested for compliance with the following requirements. Ensure all viewboxes have been turned on for a minimum of 30 minutes before obtaining measurements.
• Luminance. Luminance is the amount of light emitted or scattered by a surface. The view box luminance should be at least 2,500 nits (cd/m2).
• Light Output Uniformity. The light output from the viewboxes should be uniform to within 10%. Measurements should not be made near the edges of the viewbox (within 1 to 2 inches), where luminance values may be quite low. iii) Light Output Homogeneity. The light output homogeneity between a bank of viewboxes should be uniform to within 20% of the mean. iv) Ambient Light Control. The ambient light within the reading room must be less than 50 lux. A value of 5-10 lux is recommended.

College of Physicians and Surgeons of British Columbia
Radiology and CT Quality Control Procedures Workbook
Y27 – Electronic Display Device Performance 113
Y27 – Electronic Display Device Performance The performance of all electronic display devices used for the interpretation of clinical images and guidance during interventional procedures must be verified using a test pattern such as the SMPTE or TG18 test patterns. For closed systems, where a suitable test pattern is not available on the system, a test pattern generator equipped with the appropriate test patterns must be utilized. Where a system does not have the capability to display an externally provided pattern, the manufacturer recommended quality control procedures must be followed. The annual quality control tests recommended by the American Association of Physicists in Medicine (AAPM, 2005), including test procedures and acceptance criteria should be used. An evaluation should be made of geometric distortion, reflection, luminance response, luminance dependencies, resolution, noise, veiling glare and chromaticity. The display system must be warmed up prior to testing and attention must be given to the ensure ambient light levels are appropriate and representative of condition under which clinical images are viewed. A viewing distance of 30 cm is recommended.
Briefly, two types of display are described:
Primary Workstations: Those used for medical interpretation of all digital images
Requirements: Contrast 250:1 Minimum luminance 170 cd/m2
Requirements for mammography are not included, see the DAP Mammography Accreditation Standards for primary display systems.
In order to achieve such a contrast ratio the light from any sources such as windows, doors, lamps, etc. must be decreased, and reflections from light clothing should be avoided.
Secondary Workstations: Those used for the display of images other than for medical interpretation
Requirements: Contrast 100:1 Minimum luminance 100 cd/m2
This level is easier to achieve by reduced room lighting.
Testing of workstations Two types of photometer are typically used. Many display system have calibration software which uses an external photometer (‘puck’) on the screen surface to sense various displayed patterns and set up contrast a colour temperature. Note that this type of puck does not measure reflected light.
For systems which have no such software, telescopic systems such as the Minolta can be used. The telescope is focused on a pattern such as the SMPTE and the density levels measured. This type of photometer does include reflected light so for accurate measurements, stray light sources should be eliminated.

College of Physicians and Surgeons of British Columbia
Radiology and CT Quality Control Procedures Workbook
Y28 – Integrity of Protective Equipment 114
Y28 – Integrity of Protective Equipment All personnel’s protective equipment must be examined using radiographic or radioscopic equipment to ensure they are not defective. Lead aprons where the total defective area is greater than 670 mm2 are not acceptable. Personnel protective equipment having a defect in the vicinity of the thyroid or the reproductive organs which is larger than the equivalent of a 5 mm diameter circle must not be used. Personal judgement should be used when small defects are located along the edges of the protective equipment and when defects are due to stitching of the equipment. All protective equipment, when not in use, should be stored in accordance to the manufacturers’ recommendations.

College of Physicians and Surgeons of British Columbia
Radiology and CT Quality Control Procedures Workbook
Y29 – General Preventive Maintenance 115
Y29 – General Preventive Maintenance Preventive maintenance of the X-ray equipment and accessories is necessary to prolong the life of the equipment. An annual inspection must be conducted for structural integrity, cleanliness, ease of movement of all components and any other procedures recommended by the manufacturers.

College of Physicians and Surgeons of British Columbia
Radiology and CT Quality Control Procedures Workbook
Y30 – Calibration of Dose Area Product Meters 116
Y30 – Calibration of Dose Area Product Meters Although the following applies to integrated DAP meters, those systems which calculate DAP from exposure factors can be tested in the same way.
DAP Meter Calibration
The DAP Meter is a flat chamber mounted in the collimator of most new x-ray systems, both radiographic and radioscopic. It records the product of the dose and the area of the beam at the position of the chamber. As dose decreases as a function of the square of the distance from the focus and the field size increases in exactly the same manner the value of DAP is CONSTANT with distance from the focus. The exposure or exposure rate can be determined at any distance i.e. the patient surface by dividing the DAP by the area of the field at the patient.
The test compares the DAP displayed with the product of the measured dose and the known field size.
Technique • Place dose meter probe on table top at 100 cm.
• Collimate to field size of 15x15 cm
• For DR systems move detector out of the beam
• On console choose Table Top exposure
• Select 80 kVp;10 mAs
• Make exposure; record reading of air kerma dose, K
Comments Calculate DAP from K x Area of field at detector (225 cm2).
Compare with the reading of DAP meter, correcting for any difference in units used.

College of Physicians and Surgeons of British Columbia
Radiology and CT Quality Control Procedures Workbook
Test Equipment for Radiology and CT Quality Control 117
Test Equipment for Radiology and CT Quality Control
Quality Control Testing in SC 35 Image quality is stressed for all imaging systems in Safety Code 35. In the relevant sections Health Canada’s advice is “the manufacturer’s recommended test procedures must be followed…” If manufacturers’ tests or phantoms are used by the manufacturers themselves or in-house staff, there should be quantifiable measurements which can be used to track performance.
If manufacturers’ QC phantoms and test procedures are not available the alternative QC methods described in these documents should be used.
Note: For all QC measurements ensure that all required calibrations and PMs have been completed at the designated intervals before any testing.
Caution
Observe radiation safety precautions when making radiation exposures.
• In radiographic and CT scanner rooms always make exposures from the control area.
• With radioscopic equipment always wear a lead apron.
• Ensure you are wearing a personal dosimeter.

College of Physicians and Surgeons of British Columbia
Radiology and CT Quality Control Procedures Workbook
Test Equipment for Radiology and CT Quality Control 118
Photometers for Digital Clinical Display QC The AAPM document TG18 gives interesting insights into the properties of medical displays, and suggest many tests which can be made on them.
Briefly, two types of display are described
Primary Workstations: Those used for medical interpretation of all digital images (excluding mammography)
Requirements: Contrast 250:1 Minimum luminance 170 cd/m2
Requirements for mammography are not included, see the DAP Mammography Accreditation Standards for primary display systems.
In order to achieve such a contrast ratio the light from any sources such as windows, doors, lamps etc must be decreased, and reflections from light clothing should be avoided.
Secondary Workstations: Those used for the display of images other than for medical interpretation
Requirements: Contrast 100:1 Minimum luminance 100 cd/m2
This level is easier to achieve by reduced room lighting.
Testing of workstations
Two types of photometer are typically used. Many display system have calibration software which uses an external photometer (“puck”) on the screen surface to sense various displayed patterns and set up contrast a colour temperature. Note that this type of puck does not measure reflected light.
For systems which have no such software, telescopic systems such as the Minolta can be used. The telescope is focused on a pattern such as the SMPTE and the density levels measured. This type of photometer does include reflected light so for accurate measurements, stray light sources should be eliminated.
College of Physicians and Surgeons of British Columbia
Radiology and CT Quality Control Procedures Workbook
Test Equipment for Radiology and CT Quality Control 119
Dosemeters Physicists often tend to favour ionization chamber detectors over other detectors for absolute dose measurements, because the response of such detectors is almost constant over a wide energy range, often from 40 keV to 10 MeV. However, they have some disadvantages. They can be damaged by mechanical shock, they require a chamber potential of a few hundred volts, and they have low sensitivity, so large ion chambers are required to measure low doses, such as for shielding measurements. Also the very wide energy response itself can be a detriment in some radiological measurements, as primary and scattered radiation will be recorded with equal sensitivity. As many ion chambers have an isotropic response, scatter will be recorded from any direction with equal sensitivity.
In recent years several companies have developed semiconductor radiation detectors which can measure several characteristics of the x-ray beam including radiation dose, kVp, time and, in some case the HVL and the radiation waveform. All use several semiconductor detectors with different attenuators to achieve this. Unlike ionization chambers the response of semiconductors with energy is very non-uniform, so that the meters have inbuilt computers that compensate for this. Like ion chambers semiconductor devices measure air kerma dose. However, unlike ion chambers these detectors have a very directional response and are much less affected by scatter.
Whatever type of meter is chosen, be aware of the limitations of the meter, such as
• Can the meter be used immediately or is a stabilization period required?
• Will the first measurement be accurate, or does the meter need test exposures
• Is there a dose or dose-rate limitation?
• Does the kVp reading depend upon the filtration in the x-ray tube and collimator?
• When using an ion chamber are there any surfaces within 30 cm which will affect the reading?
It is recommended that meters be calibrated at least every two years. Many hospitals and clinics will have several dose meters. In this case, it is recommended that at least one meter be calibrated at National Research Council Labs in Ottawa or by the manufacturer every year, and the other meters cross-calibrated.

College of Physicians and Surgeons of British Columbia
Radiology and CT Quality Control Procedures Workbook
Test Equipment for Radiology and CT Quality Control 120
Dosimetry Phantoms
Radiography Dosimetry Phantoms
In the US the FDA Nationwide Evaluation of X-ray Trends (NEXT) program has used specific solid phantom for measurements in Radiology, which mimic the x-ray spectrum which passes through a patient. They are made from acrylic (polymethyl methacrylate, PMMA) and aluminium, and the chest phantom has an air gap also.
For standard measurements it is sufficient to use an abdomen phantom of 21 cm of acrylic to represent an adult patient abdomen, and 10 cm to represent an adult patient chest. It is useful to have the material in sheet form so that the thickness can be easily changed.
For consistency measurements these are certainly suitable phantoms, but cannot be compared with measurements from surveys on actual patients, nor used to estimate effective dose.
Radioscopy Dosimetry Phantoms
The abdomen acrylic phantom is also suitable for measurements required to measure dose rates in radioscopy. An aluminium phantom 20 mm in thickness will also provide similar attenuation.
CT Dosimetry Phantoms
To measure doses in CT the FDA cylindrical phantoms of 16 cm and 32 cm diameter are required to measure CTDI. They are shown below with the 100 mm ion chamber (or solid state detectors of the same shape and response) which is inserted into holes in the phantom to measure CTDI. This test should be performed by a medical physicist.
NEXT Chest phantom
NEXT abdomen phantom

College of Physicians and Surgeons of British Columbia
Radiology and CT Quality Control Procedures Workbook
Test Equipment for Radiology and CT Quality Control 121
CT Dose Index (CTDI) is a primary CT quantity measured in an acrylic (PMMA) cylinder usually with a 10 cm ion chamber. The CTDI is characteristic of a particular scanner, and is checked against the manufacturer’s specifications and console displays at Acceptance.
CTDI is usually measured in the centre and periphery of the cylindrical phantom and these two measures are normally combined to give a weighted value:
CTDIw = 0.33 x CTDIcentre + 0.66 CTDIperiphery
CT chamber being inserted into centre hole of 32 cm phantom

College of Physicians and Surgeons of British Columbia
Radiology and CT Quality Control Procedures Workbook
Test Equipment for Radiology and CT Quality Control 122
CT chamber being inserted into
peripheral hole of 32 cm phantom
16cm phantom with CT chamber
Inserted, in scanning position

College of Physicians and Surgeons of British Columbia
Radiology and CT Quality Control Procedures Workbook
Test Equipment for Radiology and CT Quality Control 123
Image Quality Phantoms
Radiography Image Quality Phantoms
All manufacturers have image quality phantoms and test procedures for use with CR and DR systems. As recommended by SC 35 these should be used if the test procedures produce quantitative information which can be used to monitor performance. Otherwise the phantoms described below can be used.
For radiography two types of contrast-detail phantoms have been commonly used – the Leeds series of phantoms (www.leedstestobjects.com ) and the CDRAD phantom (www.artinis.com ). Both types of phantom contain objects of known diameter and contrast and the lowest contrast of each size which can be visualized under standard conditions can be used as measure of quality. Until recently reproducible ‘reading’ of images of these phantoms has been difficult, but now software is available to evaluate the DICOM images produced using the phantoms. Recently it has been shown that software evaluation of the CDRAD phantom closely matches that of a human observer (Pascoal A, Lawinski CP Honey I and Blake P Physics in Medicine and Biology 2005 50:5743-5757).
Leeds Phantom TO20
Leeds Test Objects sells a range of phantoms for all types of imaging system quality control (www. leedstestobjects.com). For CR and DR Test Object TO20 has been most commonly used. The TO20 comes with a 1.5 mm copper filter which is used taped over the collimator to simulate the x-ray spectrum and dose level which comes through a patient.
Procedure for CR or DR
Typically the phantom is exposed at 75 kVp to give a dose to the detector of
a. 1 microgray
b. 4 microgray
c. 12 microgray
d. 50 microgray
The images are viewed on a calibrated clinical workstation at 30 cm to determine the number of each size of object which can be fully discerned. Using the tables which come with TO20 the minimum detection index visible for each size of object is plotted versus the square root of the area of the object. Automatic image analysis programs (PIAAA) are also available from Leeds Test Object to reduce the subjectivity of this test.

College of Physicians and Surgeons of British Columbia
Radiology and CT Quality Control Procedures Workbook
Test Equipment for Radiology and CT Quality Control 124
Leeds Phantom TOR CDR
This is a simpler version of the above phantom which can measure low contrast sensitivity, high contrast sensitivity and spatial resolution.
Procedure
With a 1mm filter at the collimator, typically the phantom is exposed at 70 kVp to give a dose to the detector of
a. 1 microgray
b. 4 microgray
c. 12 microgray
d. 50 microgray
Typical radiograph of the TO20 test object

College of Physicians and Surgeons of British Columbia
Radiology and CT Quality Control Procedures Workbook
Test Equipment for Radiology and CT Quality Control 125
The images are viewed on a calibrated clinical workstation at 30 cm to determine the number of each size of object which can be fully discerned. The tables which come with TOR CDR are used to determine the contrast threshold for the 11 mm and 0.5 mm objects and the spatial resolution. Automatic image analysis programs (PIAAA) are also available from Leeds Test Object to reduce the subjectivity of this test.
Artinis CDRAD Phantom
The CDRAD phantom is a contrast-detail phantom made from 10 mm acrylic sheet. 225 holes of different diameter and depth are arranged in a matrix on a sheet approximately 26x26x1 cm. Because of the number of contrast-detail objects involved, the automatic analysis software CDRAD Analyser is essential.
Radiograph of the CDR phantom
The CDRAD phantom

College of Physicians and Surgeons of British Columbia
Radiology and CT Quality Control Procedures Workbook
Test Equipment for Radiology and CT Quality Control 126
Procedure
The phantom can be used in many different ways, but it has mostly been used with an acrylic phantom in order to represent the clinical situation. As image quality is affected by dose, some indicator of surface dose or detector dose needs to be recorded for repeat measurements. In the following example both the surface dose and exposure index are recorded.
Typically it is used as follows:
Place 10 cm of Plexiglas on the table top, then the CDRAD phantom, then 10 cm more Plexiglas on top. Collimate the beam to the size of the phantom.
Set up a standard supine AP Abdomen protocol at ~100 cm FDD. This will be a phototimed procedure at about 80 kVp. Try to minimize the image pre-processing as recommended in the manufacturers’ test methods. This means removing any high frequency image processing and using a lookup table slope of 1.0. If this is not possible use the standard processing functions set for that protocol
Note the kVp, mAs, SSD, AEC chambers used, any density variation, and image processing factors. Make the exposure, process the image and note the Exposure Index. Annotate the image for future identification. Using exactly the same exposure factors (set mAs, no AEC), measure the surface air kerma with a solid state dose meter in the centre of the x-ray field, or with an ion chamber 30 cm above the phantom surface(this image is not analyzed). Calculate surface dose by multiplying the air kerma recorded by the backscatter factor.
The image will appear as below.
CDRAD phantom between two 10 cm slabs
of acrylic

College of Physicians and Surgeons of British Columbia
Radiology and CT Quality Control Procedures Workbook
Test Equipment for Radiology and CT Quality Control 127
When analyzed with the software, the details which can be accurately visualized will appear red as shown above. The system will also give an Image Quality Index. Ensure you note all the exposure and setup information so the exposure can be accurately repeated at future sessions.
Conventional and Digital Radioscopy
Many manufacturers have image quality phantoms and test procedures for use with Radioscopy systems. It is recommended that these be used by the companies themselves or by in-house staff if the test procedures produce quantitative information which can be used to monitor performance. Otherwise the phantom described below can be used to monitor performance.
For conventional radioscopy the standard test tool is the Leeds phantom TOR 18FG. This allows measurement of
• Low contrast limit – there are 18 8 mm diameter circles of known contrast
• Spatial resolution limit – there are 21 groups of resolution patterns
• Circular linearity
• Monitor brightness and contrast setup
With a 1mm filter at the collimator, typically the phantom is exposed at 70 kVp in ABC mode (copper filter can be adjusted to give the correct kVp).

College of Physicians and Surgeons of British Columbia
Radiology and CT Quality Control Procedures Workbook
Test Equipment for Radiology and CT Quality Control 128
View the images on the unit’s workstation at 30 cm to determine the number of each size of object which can be fully seen, and the smallest group of lines which can be discerned. Use the tables which come with TOR 18FG to determine the contrast threshold for the 8 mm objects and the spatial resolution.
CT Image Quality Phantoms
If image quality phantoms are available from the manufacturers to carry out the required tests, these should be used if quantifiable results can be used for assessment of images and for future comparison. Otherwise, there are commercial phantoms which facilitate the required tests.
RMI-Gammex 464 (American College of Radiology Phantom)
This phantom is required at those centres in the US who are part of the ACR accreditation scheme for CT. It consists of four independent sections which can measure the required image quality parameters. Full instructions are provided with the phantom.
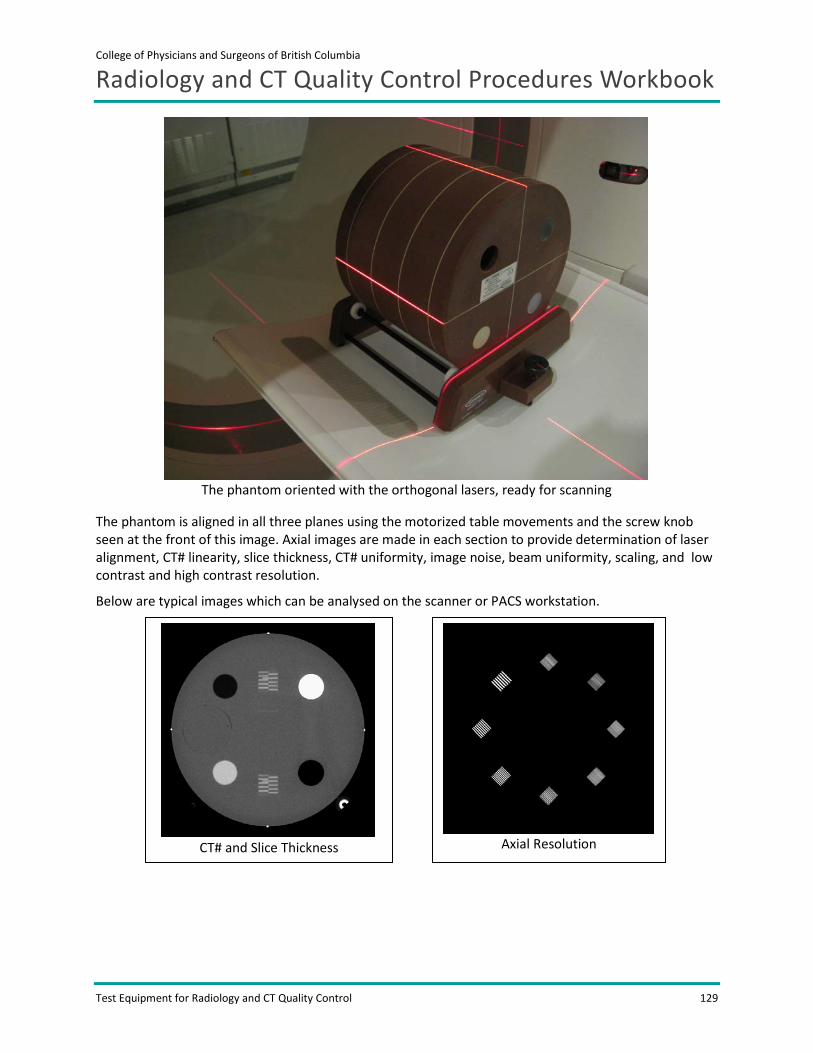
College of Physicians and Surgeons of British Columbia
Radiology and CT Quality Control Procedures Workbook
Test Equipment for Radiology and CT Quality Control 129
The phantom is aligned in all three planes using the motorized table movements and the screw knob seen at the front of this image. Axial images are made in each section to provide determination of laser alignment, CT# linearity, slice thickness, CT# uniformity, image noise, beam uniformity, scaling, and low contrast and high contrast resolution.
Below are typical images which can be analysed on the scanner or PACS workstation.
The phantom oriented with the orthogonal lasers, ready for scanning
CT# and Slice Thickness
Axial Resolution

College of Physicians and Surgeons of British Columbia
Radiology and CT Quality Control Procedures Workbook
Test Equipment for Radiology and CT Quality Control 130
A variety of CT phantoms is also available from Phantom Laboratories Inc (Catphan series).
Low contrast objects of 25, 6, 4, 3
and 2 mm diameter
Beads separated by 100 mm

College of Physicians and Surgeons of British Columbia
Radiology and CT Quality Control Procedures Workbook
Test Equipment for Radiology and CT Quality Control 131
Equipment Checklist for Annual QC Testing Here is a list of equipment which you may need when performing the required SC 35 tests.
Radiographic
• Safety Code checklist
• Laptop and Test spreadsheet
• Dosemeter – kVp, dose, time
• Aluminum filters
• Fluorescent screen or phantom for field size, congruency, and alignment
• Focal spot tool
• 20 cm PMMA for surface dose
• 20 cm PMMA for AEC checks
• Steel rule
• Tape measure
• Adhesive tape
• CDs/DVDs to store data
• Marker pen
• Area survey meter
• Personnel dosimeter
• Warning signs for doors
• Digital camera
CR (plus above for Radiographic)
• CR test phantom and software
• CDs/DVDs to store data
• Marker pen
• Personnel dosimeter
DR (plus above for Radiographic)
• Image quality phantom
• Lead apron to protect detector
• CDs/DVDs to store data
• Marker pen
• Area survey meter

College of Physicians and Surgeons of British Columbia
Radiology and CT Quality Control Procedures Workbook
Test Equipment for Radiology and CT Quality Control 132
• Personnel dosimeter
CT
• Safety Code checklist
• Laptop and Test spreadsheet
• Data for comparison – CTDI in air and in phantom (from manufacturer or Impact)
• CT chamber and meter Unfors or Radcal
• 32 cm CT body phantom
• 16 cm CT body phantom
• Water phantom
• Image quality phantom
• Steel rule
• Tape measure
• CDs/DVDs to store data
• Marker pen
• Area survey meter
• Personnel dosimeter
• Warning signs for doors
• Digital camera
Angiography
• Safety Code checklist
• Laptop and Test spreadsheet
• Dosemeter – kVp, dose, dose rate, time
• Aluminum filters
• Fluorescent screen or phantom for field size, congruency, alignment
• Focal spot tool
• Image quality phantom
• 20 cm PMMA for surface dose
• Steel rule
• Tape measure
• Adhesive tape
• Lead aprons for personnel protection
• Lead or lead aprons to block detector for max dose

College of Physicians and Surgeons of British Columbia
Radiology and CT Quality Control Procedures Workbook
Test Equipment for Radiology and CT Quality Control 133
• CDs/DVDs to store data
• Marker pen
• Area survey meter
• Personnel dosimeter
• Warning signs for doors
• Digital camera